A Study of Linkage Effects and Environmental Impacts on Information and Communications Technology Industry between South Korea and USA: 2006–2015


Abstract
:1. Introduction
- We confirmed that ICT industry in the US and Korea was a sustainable industry.
- We checked whether there was a difference in the influence of the manufacturing sector and the service sector of ICT industry on the national economy.
2. Literature Review and Hypotheses Development
3. Materials and Methods
- Sensibility Index of Dispersion;
- Power Index of dispersion;
- The factor of Leontief Inverse Matrix;
- The sum of columns of Leontief Inverse Matrix;
- The sum of rows of Leontief Inverse Matrix.
4. Results
5. Discussion and Conclusions
Author Contributions
Funding
Institutional Review Board Statement
Informed Consent Statement
Data Availability Statement
Conflicts of Interest
References
- Ministry of Environment. Available online: http://www.me.go.kr/home/web/board/read.do?menuId=286&boardMasterId=1&boardCategoryId=39&boardId=1062250 (accessed on 2 March 2021).
- European Commission. Communication from the Commission: The European Green Deal; European Commission: Brussels, Belgium, 2019. [Google Scholar]
- Eunjoo, H.; Yun Hyeok, C.; Jong Dae, K. Study on Priorities of Regional Climate Change Policy. J. Environ. Sci. Int. 2016, 25, 589–601. [Google Scholar]
- Hyun, K.; Sang Gun, L. A comparative study on production inducement effects in key industries of Korea and the Netherlands. Glob. Bus. Financ. Rev. 2020, 25, 13–32. [Google Scholar]
- OECD. OECD Digital Economy Outlook 2017; OECD: Paris, France, 2017. [Google Scholar]
- OECD. OECD Digital Economy Outlook 2015; OECD: Paris, France, 2015. [Google Scholar]
- World Bank. World Bank Annual Report 2017; World Bank Group: Washington, DC, USA, 2017. [Google Scholar]
- Ericsson. A Quick Guide to Your Digital Carbon Footprint; Ericsson: Stockholm, Sweden, 2020. [Google Scholar]
- Belkhir, L.; Elmeligi, A. Assessing ICT global emissions footprint: Trends to 2040 & recommendations. J. Clean. Prod. 2018, 177, 448–463. [Google Scholar]
- Forbes. Top 100 Digital Companies. 2019. Available online: https://www.forbes.com/top-digital-companies/list/#tab:rank (accessed on 15 February 2021).
- OECD. Measuring the Information Economy. E-Commerce; OECD: Paris, France, 2002. [Google Scholar]
- OECD. Information Economy—Sector Definitions Based on the International Standard Industry Classification (ISIC 4); OECD: Paris, France, 2007. [Google Scholar]
- OECD. OECD Guide to Measuring the Information Society 2011; OECD: Paris, France, 2011. [Google Scholar]
- Xing, W.; Ye, X.; Kui, L. Measuring convergence of China’s ICT industry: An input–output analysis. Telecommun. Policy 2011, 35, 301–313. [Google Scholar] [CrossRef]
- Rohman, I.K. The globalization and stagnation of the ICT sectors in European countries: An input-output analysis. Telecommun. Policy 2013, 37, 387–399. [Google Scholar] [CrossRef] [Green Version]
- Hong, J.P.; Byun, J.E.; Kim, P.R. Structural changes and growth factors of the ICT industry in Korea: 1995–2009. Telecommun. Policy 2016, 40, 502–513. [Google Scholar] [CrossRef]
- Abubakar, Y.A.; Mitra, J. Innovation performance in European regions: Comparing manufacturing and services ICT subsectors. Int. J. Entrep. Innov. Manag. 2010, 11, 156–177. [Google Scholar] [CrossRef]
- GSM Association. The Mobile Economy 2020; GSM Association: London, UK, 2020. [Google Scholar]
- Gartner. Gartner Forecasts Worldwide Public Cloud Revenue to Grow 17% in 2020; Gartner: Stanford, CT, USA, 2019. [Google Scholar]
- Canalys. Cloud Infrastructure Spend Reaches US$20 Billion in Q2 2018, with Hybrid IT Approach Dominant; Canalys: Singapore, 2018. [Google Scholar]
- IDC. Semiannual Public Cloud Services Tracker; IDC: Needham, MA, USA, 2018. [Google Scholar]
- European Commission. The 2019 EU Industrial R&D Investment Scoreboard; European Commission: Luxembourg, 2019. [Google Scholar]
- Bieser, J.; Hilty, L. Assessing Indirect Environmental Effects of Information and Communication Technology (ICT): A Systematic Literature Review. Sustainability 2018, 10, 2662. [Google Scholar] [CrossRef] [Green Version]
- European Commission. The 2018 EU Industrial R&D Investment Scoreboard; European Commission: Luxembourg, 2018. [Google Scholar]
- Executive Office of the President. The President’s Climate Action Plan; Executive Office of the President: Washington, DC, USA, 2013.
- Oliner, S.D.; Sichel, D.E. The resurgence of growth in the late 1990s: Is information technology the story? J. Econ. Perspect. 2000, 14, 3–22. [Google Scholar] [CrossRef] [Green Version]
- García-Muñiz, A.S.; Vicente, M.R. ICT technologies in Europe: A study of technological diffusion and economic growth under network theory. Telecommun. Policy 2014, 38, 360–370. [Google Scholar] [CrossRef]
- Fernandez-deGuevara, J.; Lopez-Cobo, M.; Mas, M. The 2017 PREDICT Key Facts Report. An Analysis of ICT R&D in the EU and beyond; Joint Research Centre (Seville Site): Luxembourg, 2017. [Google Scholar]
- OECD. Measuring the Digital Transformation: A Roadmap for the Future; OECD: Paris, France, 2019. [Google Scholar]
- Mattioli, E.; Lamonica, G.R. The ICT role in the world economy: An input-output analysis. J. World Econ. Res. 2013, 2, 20–25. [Google Scholar] [CrossRef]
- Inklaar, R.; O’Mahony, M.; Timmer, M. ICT and Europe’s productivity performance: Industry-level growth account comparisons with the United States. Rev. Income Wealth 2005, 51, 505–536. [Google Scholar] [CrossRef]
- Irawan, T. ICT and economic development: Comparing ASEAN member states. Int. Econ. Policy 2014, 11, 97–114. [Google Scholar] [CrossRef]
- Malmodin, J.; Lundén, D. The energy and carbon footprint of the global ICT and E&M sectors 2010–2015. Sustainability 2018, 10, 3027. [Google Scholar]
- Talib, F.; Rahman, Z.; Akhtar, A. An instrument for measuring the key practices of total quality management in ICT industry: An empirical study in India. Serv. Bus. 2013, 7, 275–306. [Google Scholar] [CrossRef]
- Aasa, L.; Adrian, M. The Effect of Energy Efficiency on Swedish Carbon Dioxide Emissions 1993–2004; Gothenburg University: Goeteborg, Sweden, 2008. [Google Scholar]
- Zhou, P.; Ang, B.W.; Poh, K.L. Slacks-based efficiency measures for modeling environmental performance. Ecol. Econ. 2006, 60, 111–118. [Google Scholar] [CrossRef]
- Moon, J.; Yun, E.; Lee, J. Identifying the Sustainable Industry by Input–Output Analysis Combined with CO2 Emissions: A Time Series Study from 2005 to 2015 in South Korea. Sustainability 2020, 12, 6043. [Google Scholar] [CrossRef]
- Lee, S.; Noh, D.-W.; Oh, D.-H. Characterizing the difference between indirect and direct CO2 emissions: Evidence from Korean manufacturing industries, 2004–2010. Sustainability 2018, 10, 2711. [Google Scholar] [CrossRef] [Green Version]
- Jaeger, C.C.; Paroussos, L.; Kupers, R.T.L.; Mangalagiu, D. A New Growth Path for Europe: Generating Prosperity and Jobs in the Low-Carbon Economy; Synthesis Report PIK; University of Oxford: Oxford, UK, 2011. [Google Scholar]
- Chaminade, C.; Plechero, M. Do regions make a difference? Regional innovation systems and global innovation networks in the ICT industry. Eur. Plan. Stud. 2015, 23, 215–237. [Google Scholar] [CrossRef]
- Halkos, G.E.; Tzeremes, N.G. International competitiveness in the ICT industry: Evaluating the performance of the top 50 companies. Glob. Econ. Rev. 2007, 36, 167–182. [Google Scholar] [CrossRef]
- Lee, D.H.; Hong, G.Y.; Lee, S.-G. The relationship among competitive advantage, catch-up, and linkage effects: A comparative study on ICT industry between South Korea and India. Serv. Bus. 2019, 13, 603–624. [Google Scholar] [CrossRef]
- Lechman, E.; Marszk, A. ICT technologies and financial innovations: The case of exchange traded funds in Brazil, Japan, Mexico, South Korea and the United States. Technol. Forecast. Soc. Chang. 2015, 99, 355–376. [Google Scholar] [CrossRef] [Green Version]
- Rhee, K.H.; Pyo, H.K. Aggregate Total Factor Productivity and Resource Reallocation Effect of ICT Sectors in Korea: A Comparison with the USA, Japan and EU7. Korean Econ. Rev. 2012, 28, 189–219. [Google Scholar]
- OECD. OECD Stat; OECD: Paris, France, 2020. [Google Scholar]
- Hirschman, A.O. The Strategy of Economic Development; Yale University Press: New Haven, CT, USA, 1958. [Google Scholar]
- Ye, Z.P.; Yin, Y.P. Economic Linkages and Comparative Advantage of the UK Creative Sector. University of Hertfordshire Business School Working Paper No. UHBS, 2. Available online: https://papers.ssrn.com/sol3/papers.cfm?abstract_id=1310948 (accessed on 16 February 2021).
- Chiu, R.-H.; Lin, Y.-C. Applying input-output model to investigate the inter-industrial linkage of transportation industry in Taiwan. J. Mar. Sci. Technol. 2012, 20, 173. [Google Scholar]
- Sari, K.; Arifin, M. The linkage among technology-intensive manufacture industries in east java by input-output analysis approach. J. ST Policy RD Manag. 2014, 12, 45–54. [Google Scholar]
- Morrissey, K.; O’Donoghue, C. The role of the marine sector in the Irish national economy: An input–output analysis. Mar. Policy 2013, 37, 230–238. [Google Scholar] [CrossRef] [Green Version]
- Leontiew, W. The structure of American economy, 1919–1929. In An Empirical Application of Equilibrium Analysis; Harvard University Press: Cambridge, MA, USA, 1941. [Google Scholar]
- Rasmussen, P.N. Studies in Inter-Sectoral Relations; Einar Harcks: København, Denmark, 1956. [Google Scholar]
- Lin, S.J.; Chang, Y.F. Linkage effects and environmental impacts from oil consumption industries in Taiwan. J. Environ. Manag. 1997, 49, 393–411. [Google Scholar] [CrossRef]
- Chang, Y.-T.; Shin, S.-H.; Lee, P.T.-W. Economic impact of port sectors on South African economy: An input–output analysis. Transp. Policy 2014, 35, 333–340. [Google Scholar] [CrossRef]
- Kwak, S.-J.; Yoo, S.-H.; Chang, J.-I. The role of the maritime industry in the Korean national economy: An input–output analysis. Mar. Policy 2005, 29, 371–383. [Google Scholar] [CrossRef]
- Ozturk, A.; Umit, K.; Medeni, I.T.; Ucuncu, B.; Caylan, M.; Akba, F.; Medeni, T.D. Green ICT (Information and Communication Technologies): A review of academic and practitioner perspectives. Int. J. eBus. eGov. Stud. 2011, 3, 1–16. [Google Scholar]
- Han, I.; Byun, S.-Y.; Shin, W.S. A comparative study of factors associated with technology-enabled learning between the United States and South Korea. Educ. Technol. Res. Dev. 2018, 66, 1303–1320. [Google Scholar] [CrossRef]
- Jeong, K.; Hong, T.; Kim, J. Development of a CO2 emission benchmark for achieving the national CO2 emission reduction target by 2030. Energy Build. 2018, 158, 86–94. [Google Scholar] [CrossRef]
- Hwang, W.-S.; Shin, J. ICT-specific technological change and economic growth in Korea. Telecommun. Policy 2017, 41, 282–294. [Google Scholar] [CrossRef]
- Zheng, H.; Fang, Q.; Wang, C.; Wang, H.; Ren, R. China’s carbon footprint based on input-output table series: 1992–2020. Sustainability 2017, 9, 387. [Google Scholar] [CrossRef] [Green Version]
- Faisal, F.; Turgut Tursoy, A.; Pervaiz, R. Does ICT lessen CO2 emissions for fast-emerging economies? An application of the heterogeneous panel estimations. Environ. Sci. Pollut. Res 2020, 27, 10778–10789. [Google Scholar] [CrossRef] [PubMed]
- KOSIS. Kostat. 2019. Available online: http://kostat.go.kr/portal/korea/index.action (accessed on 28 December 2020).
- Kim, J.; Eunnyeong, H. Effect of ICT capital on the demands for labor and energy in major industries of Korea, US, and UK. Environ. Resour. Econ. Rev. 2014, 23, 91–132. [Google Scholar] [CrossRef] [Green Version]
- Min, Y.-K.; Lee, S.-G.; Aoshima, Y. A comparative study on industrial spillover effects among Korea, China, the USA, Germany and Japan. Ind. Manag. Data Syst. 2019, 119, 454–472. [Google Scholar] [CrossRef]


| Country | ICT Manufacturing | Communication | Software and Service | Sum of ICT Industrial |
|---|---|---|---|---|
| Korea | 5.6% | 1.0% | 1.6% | 8.2% |
| USA | 1.5% | 1.5% | 2.1% | 5.1% |
| EU | 0.8% | 1.2% | 2.0% | 4.0% |
| Japan | 1.7% | 1.9% | 2.4% | 6.1% |
| Average of OECD | 1.0% | 1.2% | 1.9% | 4.1% |
| Sector | The Principles Underlying the Definition |
|---|---|
| ICT manufacturing Industry | • Must be intended to fulfil the function of information processing and communication including transmission and display. • Must use electronic processing to detect, measure, and/or record physical phenomena or control a physical process. |
| ICT service Industry | • Must be intended to enable the function of information processing and communication by electronic means. |
| Sector | ISIC Rev. 4 (2007) | |
|---|---|---|
| ICT Manufacturing | 2610 | Manufacture of electronic components and boards |
| 2620 | Manufacture of computers and peripheral equipment | |
| 2630 | Manufacture of communication equipment | |
| 2640 | Manufacture of consumer electronics | |
| 2680 | Manufacture of magnetic and optical media | |
| ICT Trade | 4651 | Wholesale of computers, computer peripheral equipment, and software |
| 4652 | Wholesale of electronic and telecommunications equipment and parts | |
| ICT Services | 5820 | Software publishing |
| 61 | Telecommunications | |
| 6110 | Wired telecommunications activities | |
| 6120 | Wireless telecommunications activities | |
| 6130 | Satellite telecommunications activities | |
| 6190 | Other telecommunications activities | |
| Sector | ISIC Rev. 4 (2008) | |
|---|---|---|
| ICT Manufacturing | 2610 | Manufacture of electronic components and boards |
| 2620 | Manufacture of computers and peripheral equipment | |
| 2630 | Manufacture of communication equipment | |
| 2640 | Manufacture of consumer electronics | |
| 2680 | Manufacture of magnetic and optical media | |
| ICT Services | 5820 | Software publishing |
| 6110 | Wired telecommunications activities | |
| 6120 | Wireless telecommunications activities | |
| 6130 | Satellite telecommunications activities | |
| 6190 | Other telecommunications activities | |
| 6201 | Computer programming activities ICT | |
| 6202 | Computer consultancy and computer facilities management activities ICT | |
| 6209 | Other information technology and computer service activities | |
| 6311 | Data processing, hosting, and related activities | |
| 6312 | Web portals | |
| Researcher | Country | Year | Aim of the Study |
|---|---|---|---|
| Xing et al. (2011) | China | 2002 | Analyzing the form of convergence between ICT manufacturing industry and ICT service industry, and identifying their role |
| Rohman (2013) | EU | 1995, 2000, 2005 | Analyzing the strengths of ICT industry by comparing the multiplier effects of ICT industry and non-ICT industry. |
| Hong, J.P., Byun, J.E., and Kim, P.R. (2016) | Korea | From 1995 to 2009 | Examining structural changes and growth factors of ICT manufacturing and service industries |
| Abubakar, Y.A., and Mitra, J. (2010) | EU | From 2001 to 2003 | Investigating factors influencing regional innovation by contrasting high-tech manufacturing (ICT manufacturing) and knowledge intensive services (ICT service) |
| Country | Korea | EU | USA | Japan | China | Other | Total |
|---|---|---|---|---|---|---|---|
| ICT Manufacturing | 277068 (10.9%) | 350194 (13.8%) | 1039653 (40.9%) | 282468 (11.1%) | 369681 (14.6%) | 220856 (8.7%) | 2539921 (100%) |
| ICT Service | 9396 (0.6%) | 192305 (11.6%) | 1111437 (67.1%) | 68112 (4.1%) | 222116 (13.4%) | 85530 (3.2%) | 1655896 (100%) |
| Health | 8362 (0.4%) | 591757 (26.6%) | 1089259 (49.0%) | 172388 (7.8%) | 60838 (2.7%) | 300892 (13.5%) | 2223497 (100%) |
| Manufacture of motor vehicles and transportation | 56601 (3.4%) | 795317 (47.7%) | 240605 (14.4%) | 424664 (25.5%) | 110945 (6.7%) | 39552 (2.4%) | 1667684 (100%) |
| (manufacturing) industry | 30992 (4.0%) | 206451 (26.9%) | 188392 (24.6%) | 144571 (18.9%) | 149339 (19.5%) | 46685 (6.1%) | 766430 (100%) |
| Chemical industry | 3687 (1.3%) | 68402 (23.3%) | 65787 (22.4%) | 99087 (33.8%) | 19540 (6.7%) | 36859 (12.6%) | 293362 (100%) |
| Aerospace and Defense industry | 4074 (1.5%) | 120838 (45.8%) | 109282 (41.5%) | - (0.0%) | 4331 (1.6%) | 25049 (9.5%) | 263574 (100%) |
| Other | 17839 (1.3%) | 393693 (29.5%) | 233973 (17.5%) | 236951 (17.7%) | 321055 (24.0%) | 131807 (9.9%) | 1335318 (100%) |
| Total | 408019 (3.8%) | 2718957 (25.3%) | 4078388 (38.0%) | 1428242 (13.3%) | 1257847 (11.7%) | 854230 (7.9%) | 10745683 (100%) |
| Hypotheses | |
|---|---|
| H1 | The linkage effect between Korean ICT manufacturing industry and the US one is different. |
| H1a | The backward linkage effect between the Korean ICT manufacturing industry and the US one is different. |
| H1b | The forward linkage effect between the Korean ICT manufacturing industry and the US one is different. |
| H2 | The linkage effect between Korean ICT service industry and the US one is different. |
| H2a | The backward linkage effect between the Korean ICT service industry and the US one is different. |
| H2b | The forward linkage effect between the Korean ICT service industry and the US one is different. |
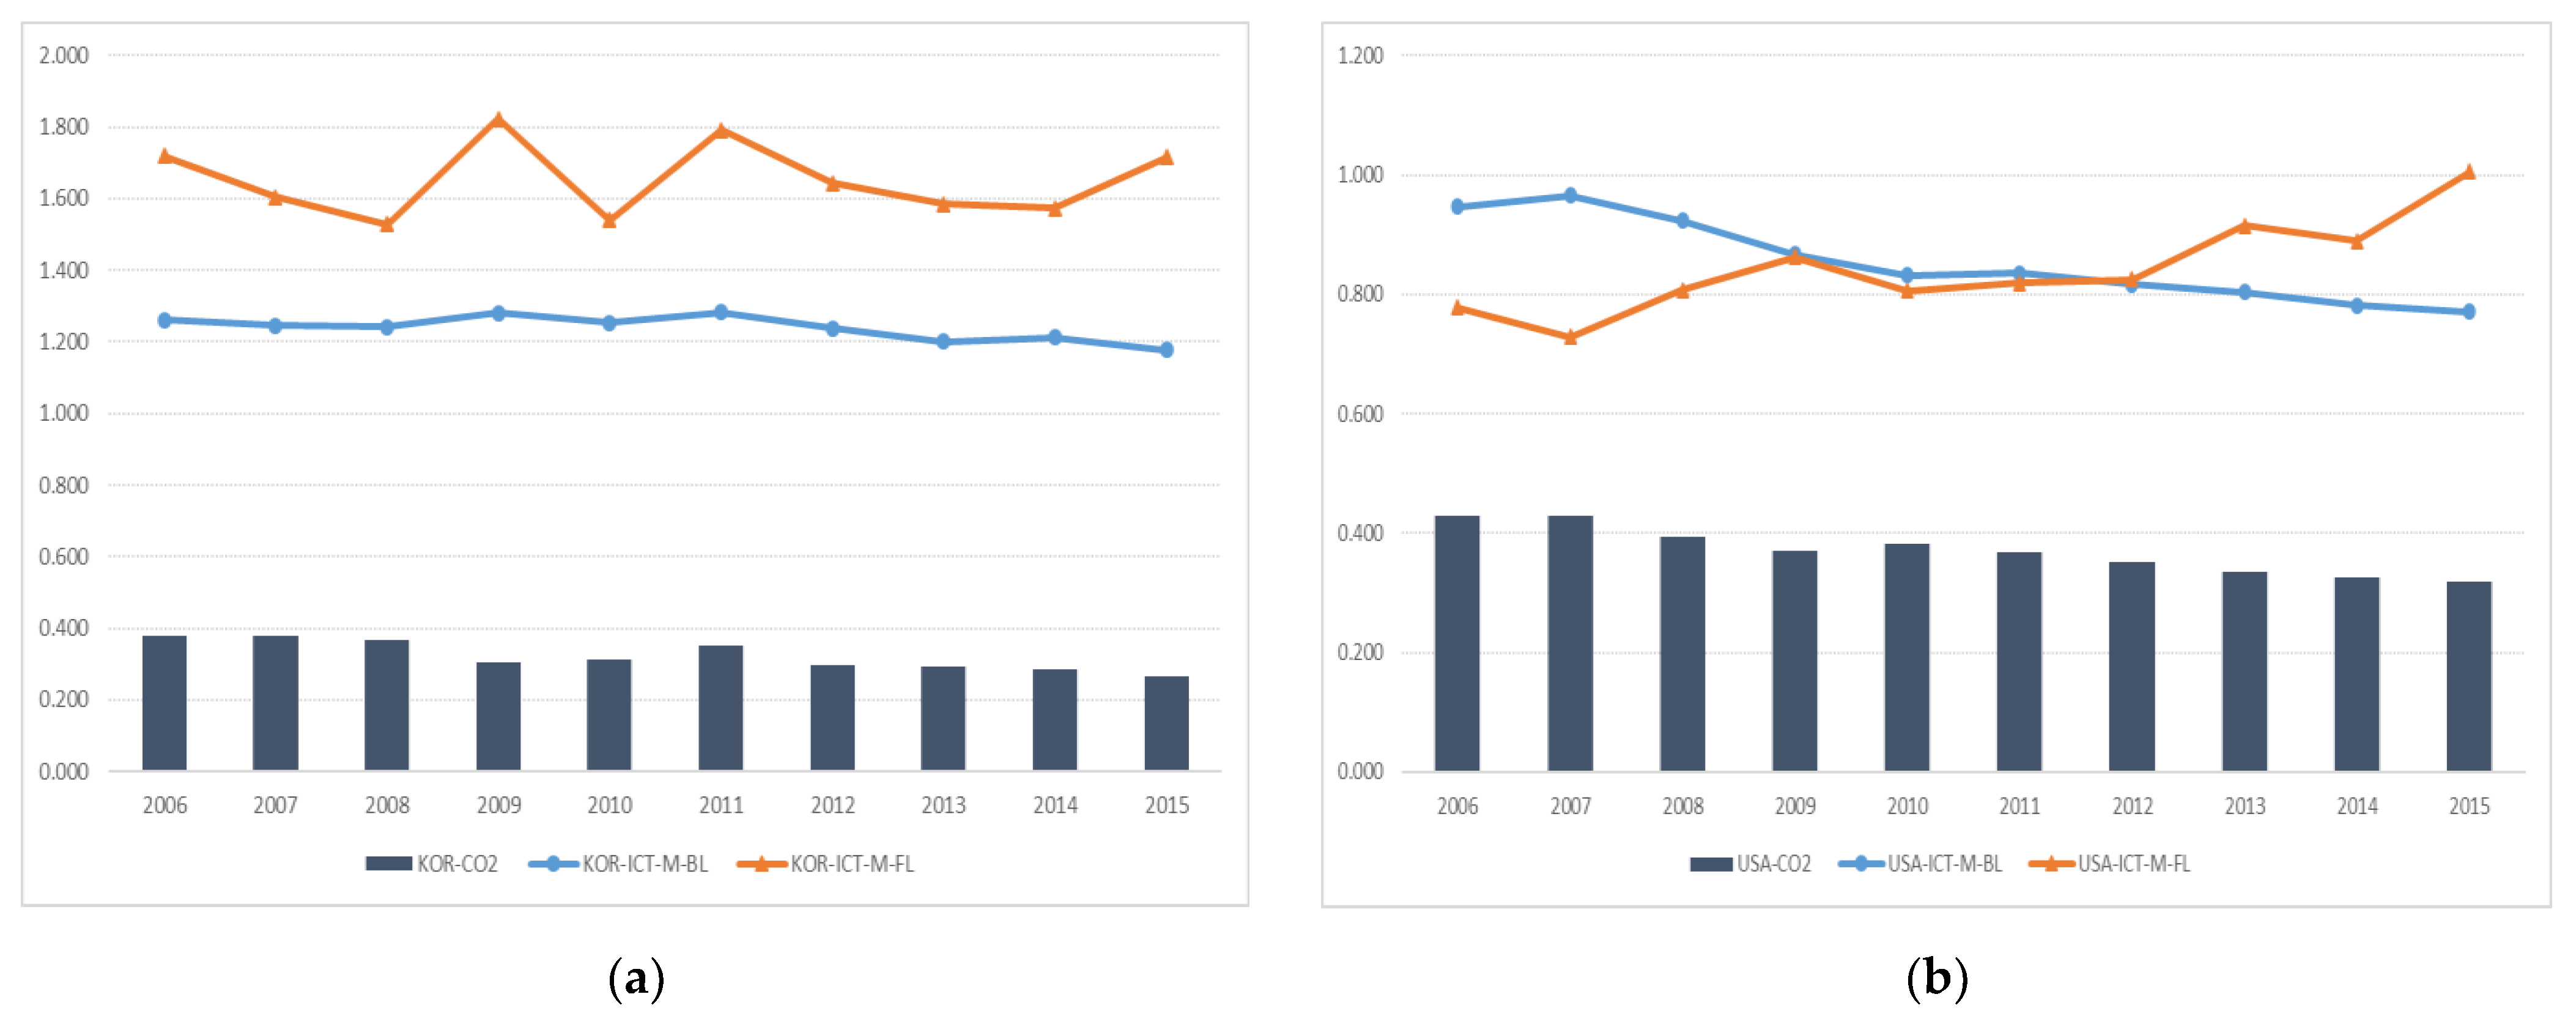
| Year | Forward Linkage of ICT Manufacturing | Backward Linkage of ICT Manufacturing | ||
|---|---|---|---|---|
| Korea | USA | Korea | USA | |
| 2006 | 1.719 | 0.777 | 1.262 | 0.946 |
| 2007 | 1.604 | 0.728 | 1.245 | 0.966 |
| 2008 | 1.528 | 0.807 | 1.241 | 0.923 |
| 2009 | 1.823 | 0.862 | 1.281 | 0.867 |
| 2010 | 1.54 | 0.806 | 1.253 | 0.832 |
| 2011 | 1.791 | 0.819 | 1.282 | 0.835 |
| 2012 | 1.644 | 0.825 | 1.239 | 0.816 |
| 2013 | 1.586 | 0.915 | 1.2 | 0.803 |
| 2014 | 1.573 | 0.889 | 1.213 | 0.781 |
| 2015 | 1.716 | 1.005 | 1.177 | 0.771 |
| Avg. | 1.652 | 0.843 | 1.239 | 0.854 |
| Year | Forward Linkage of ICT Service | Backward Linkage of ICT Service | ||
|---|---|---|---|---|
| Korea | USA | Korea | USA | |
| 2006 | 1.028 | 0.894 | 0.891 | 0.874 |
| 2007 | 1.013 | 0.887 | 0.907 | 0.87 |
| 2008 | 0.939 | 0.897 | 0.897 | 0.86 |
| 2009 | 0.949 | 0.992 | 0.922 | 0.923 |
| 2010 | 0.938 | 0.957 | 0.919 | 0.93 |
| 2011 | 0.917 | 0.929 | 0.933 | 0.936 |
| 2012 | 0.905 | 0.926 | 0.919 | 0.945 |
| 2013 | 0.927 | 0.932 | 0.91 | 0.928 |
| 2014 | 0.947 | 0.933 | 0.918 | 0.94 |
| 2015 | 0.92 | 0.972 | 0.932 | 0.939 |
| Avg. | 0.948 | 0.932 | 0.915 | 0.915 |
| Hypotheses | p-Value | Results | |
|---|---|---|---|
| H1 | The linkage effect between the Korean ICT manufacturing industry and the US is different. | - | Accept |
| H1a | The backward linkage effect between the Korean ICT manufacturing industry and the US is different. | 0.000 | Accept |
| H1b | The forward linkage effect between the Korean ICT manufacturing industry and the US is different. | 0.000 | Accept |
| H2 | The linkage effect between the Korean ICT service industry and the US is different. | - | Reject |
| H2a | The backward linkage effect between the Korean ICT service industry and the US is different. | 0.980 | Reject |
| H2b | The forward linkage effect between the Korean ICT service industry and the US is different. | 0.445 | Reject |
| Year | CO2 Emission of ICT Service | |||
|---|---|---|---|---|
| Korea | USA | Korea | USA | |
| 2006 | 0.379 | 0.430 | 0.490 | 0.417 |
| 2007 | 0.379 | 0.429 | 0.458 | 0.425 |
| 2008 | 0.366 | 0.394 | 0.432 | 0.436 |
| 2009 | 0.304 | 0.370 | 0.471 | 0.488 |
| 2010 | 0.314 | 0.382 | 0.456 | 0.472 |
| 2011 | 0.353 | 0.367 | 0.412 | 0.469 |
| 2012 | 0.298 | 0.352 | 0.417 | 0.466 |
| 2013 | 0.291 | 0.336 | 0.430 | 0.49 |
| 2014 | 0.286 | 0.326 | 0.400 | 0.511 |
| 2015 | 0.267 | 0.319 | 0.420 | 0.518 |
| Avg. | 0.324 | 0.370 | 0.439 | 0.469 |
Publisher’s Note: MDPI stays neutral with regard to jurisdictional claims in published maps and institutional affiliations. |
© 2021 by the authors. Licensee MDPI, Basel, Switzerland. This article is an open access article distributed under the terms and conditions of the Creative Commons Attribution (CC BY) license (https://creativecommons.org/licenses/by/4.0/).
Share and Cite
Mun, J.; Yun, E.; Choi, H. A Study of Linkage Effects and Environmental Impacts on Information and Communications Technology Industry between South Korea and USA: 2006–2015. Processes 2021, 9, 1043. https://0-doi-org.brum.beds.ac.uk/10.3390/pr9061043
Mun J, Yun E, Choi H. A Study of Linkage Effects and Environmental Impacts on Information and Communications Technology Industry between South Korea and USA: 2006–2015. Processes. 2021; 9(6):1043. https://0-doi-org.brum.beds.ac.uk/10.3390/pr9061043
Chicago/Turabian StyleMun, Junhwan, Eungyeong Yun, and Hangsok Choi. 2021. "A Study of Linkage Effects and Environmental Impacts on Information and Communications Technology Industry between South Korea and USA: 2006–2015" Processes 9, no. 6: 1043. https://0-doi-org.brum.beds.ac.uk/10.3390/pr9061043