
Accuracy Improvement of the 14C Method Applied in Biomass and Coal Co-Firing Power Stations


State Key Laboratory of Clean Energy Utilization, Zhejiang University, Hangzhou 310027, China
*
Author to whom correspondence should be addressed.
Processes 2021, 9(6), 994; https://0-doi-org.brum.beds.ac.uk/10.3390/pr9060994
Submission received: 16 May 2021
/
Revised: 27 May 2021
/
Accepted: 2 June 2021
/
Published: 4 June 2021
(This article belongs to the Special Issue Redesign Processes in the Age of the Fourth Industrial Revolution)
Abstract
:The 14C method is an approach used to determine the proportion of carbon derived from biomass and fossil fuel in the co-fired flue gas. Its accuracy is mainly limited by the deviations between the applied biomass fuels’ 14C activity reference value and virtual value. To enrich the theoretical basis of the 14C method when applied to a Chinese biomass and coal co-firing power station, this study performed field sampling experiments and established a new evaluation method based on domestic literature. Unlike previous studies, this study revealed that the 14C activity of biomass far away from fossil carbon sources was 0.7–1.3 pMC lower than the local atmosphere. The 14C activity laws between tree rings and barks, specifically between eucalyptus bark and poplar bark were different, due to different growth models and different bark regeneration cycles, respectively. According to the test results and renewal conclusions, this study proposed a reasonable idea for constructing the prediction equation of referential biomass fuels’ 14C activity. Following this equation, the biomass fuels’ 14C activities of biomass direct-fired power stations at different Chinese cities were obtained.
1. Introduction
Co-firing of coal and biomass has the advantages of partially replacing coal fuel and reducing CO2 emissions. However, the lack of a reliable biomass fuel identification system forces most of the biomass resources for the centralized energy supply to the biomass direct-fired boiler in China [1,2]. Therefore, mature and accurate biomass is necessary to open the market of the Chinese biomass and coal co-firing power station, which may be built based on the 14C method.
The 14C is a natural indicator that can distinguish biomass fuels from fossil fuels, and a radioactive isotope, with a half-life of 5730 years [3]. The 14C activity of fossil fuels decays to 0 percent of modern carbon (pMC) during millions of years of coal formation, while the biomass fuel will have the same level of 14C activity as the atmosphere during its growth period owing to carbon exchange. The 14C method traces the blending ratio of bio-sourced carbon (fbiomass) in the biomass and coal co-firing flue gas by measuring the 14C activity of CO2 in it.
Hämäläinen [4] first proposed that the fbiomass of commercial waste incineration power plants can be measured by the 14C method. They collected and tested flue gas from five industrial power plants, and the 14C activity of flue gas increased with increasing fbiomass. Elsewhere, Mohn et al. [5] used 14C and balance calculation method to study three commercial waste incinerators. The fbiomass results of the two methods were consistent. The simulated co-firing flue gas testing of Quarta et al. [6] and the oxygen bomb co-firing experiments of Tang et al. [7] have confirmed that the samples of 14C activity test technology are accurate to contribute little error to the final results of biomass blending ratio. The research results of Palstra et al. [8] provided a method to eliminate the influence of air CO2 during flue gas sampling and subsequent preparation. Currently, the deviation between the applied 14C activity reference value of the biomass (Abiomass) and the actual value is the main cause of inaccuracy of the 14C method when it is used to calculate the biomass blending ratio of flue gas [9].
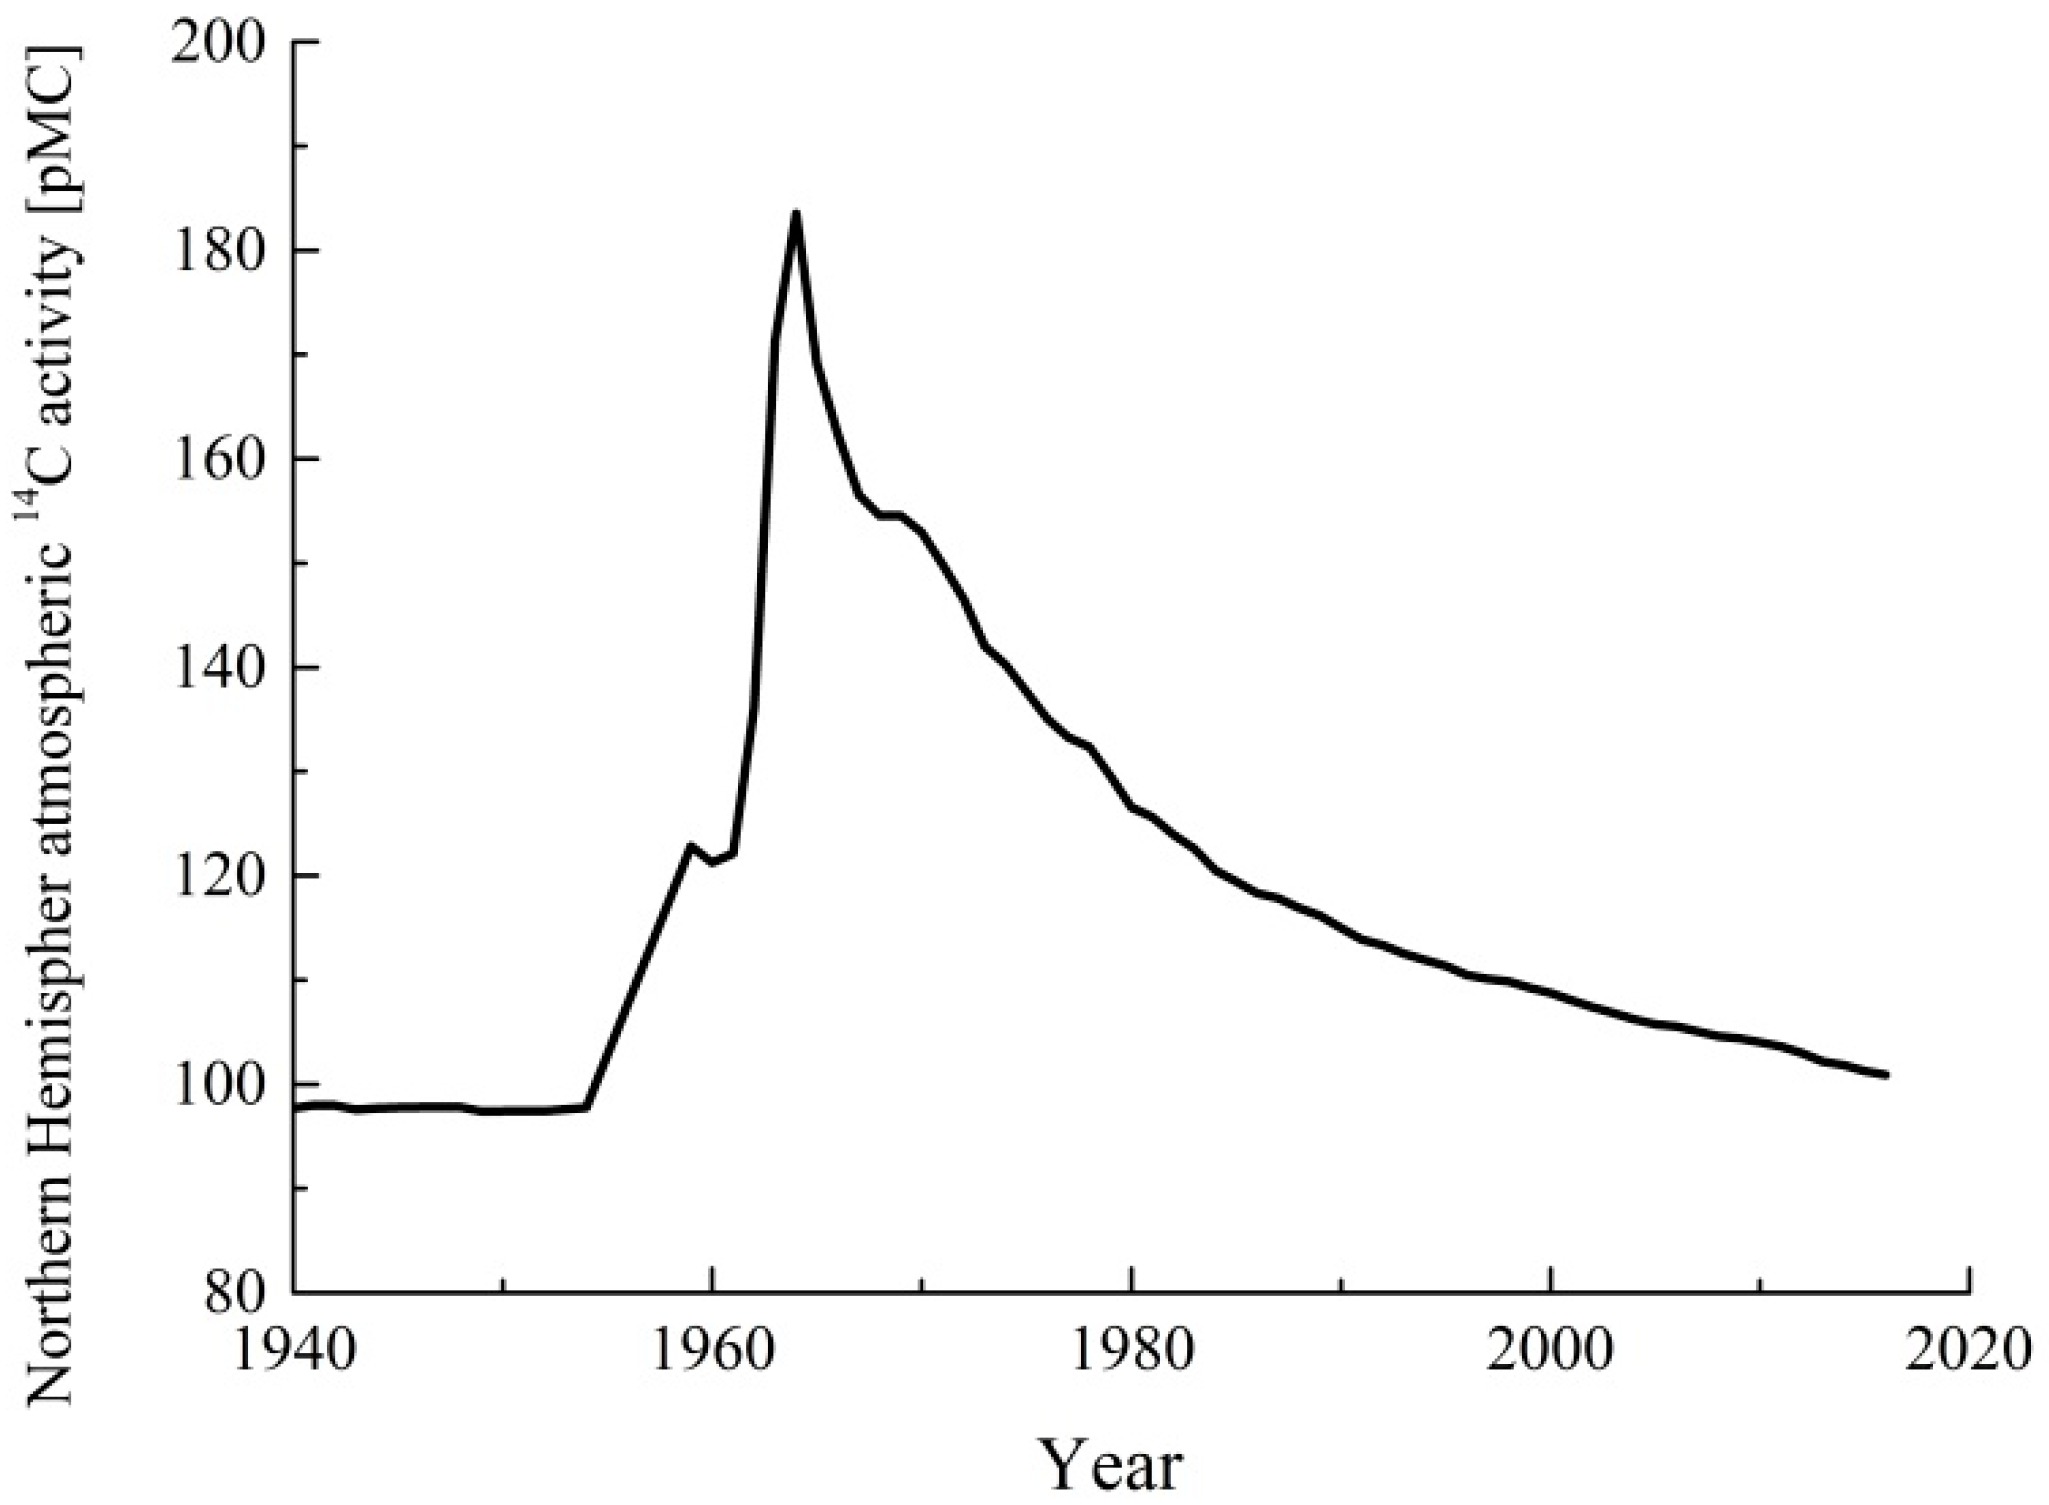
Primarily, the atmospheric 14C activity is not always 100 pMC, which results in the deviation of Abiomass from the actual value. As shown in Figure 1, multiple nuclear explosion tests in the 1960s almost doubled the atmospheric 14C activity in the Northern Hemisphere [10]. Subsequently, industrial development caused a phenomenal rise of fossil fuel carbon in the atmosphere (Suess effect) [11], and the atmospheric 14C activity began to decline in the following years. As of 2016, the atmospheric 14C activity had returned to the same level as 70 years ago. According to some observations, its activity is still decreasing at the rate of 0.3–0.5 pMC/year. Considering the effects of time, some standards such as ASTM [12] recommended that the 14C activity of the current atmospheric background as Abiomass. However, the complex compositions of biomass fuel in the actual industrial power station overestimates fbiomass calculated using ASTM without considering the influence of biomass species. For instance, there are significant differences between the laws of 14C activity in annuals and perennials. For annual crops, it is relatively reasonable to use the current atmospheric 14C activity, whereas, for wood, the changes of the atmospheric 14C activity during the growth of perennial trees will be reflected in each tree ring. Therefore, the 14C activity of wood should be the mass-weighted average of atmospheric 14C activity in the year corresponding to tree rings. Mohn et al. [5] proposed a reasonable calculation method for the 14C activity of wood-based fuels such as waste paper, wood scrap, and board; besides, they presented an available Abiomass for local waste incinerators depending on the bio-based waste structure of the Swiss waste incinerator.
In addition to time and biomass species, fossil carbon emissions also affect plant 14C activity. Hsueh et al. [13] collected and tested the annual crops at 67 sites across North America which confirmed that the higher the local fossil carbon emissions, the lower the local atmospheric 14C activity. However, earlier studies on Abiomass prediction ignored the different impacts of regional fossil carbon emissions. Considering the vast territory of China, the biomass resource structures and fossil carbon emission levels of cities in China may be quite different. So, the reference value of Abiomass given by previous studies could not be directly used at the biomass and coal co-firing fuel power stations in China.
This study aims to improve the accuracy of the 14C method by promoting the domestic Abiomass value closer to the actual value. Some published domestic biomass 14C data are reprocessed and compared with the 14C activity test results of field samples in this work. Based on it, this study explores the impact of local fossil carbon emissions and biomass species on 14C activity, updates the basic theory of Abiomass prediction, and finally proposes a reasonable Abiomass prediction equation.
2. Methods and Prediction Equation
2.1. Data Reprocessing
In 2010, Xi et al. [14] tested annual crops from 12 cities in China to characterize the local atmospheric 14C activity. Moreover, Cheng et al. [15] and Hou et al. [16] have reported the 14C activity data of Yibin, Zunyi, and Xi’an for which the tree ring samples fell on the mountains. However, the National Bureau of statistics only published the population, total energy consumption, GDP, and other data measured by the province, which is difficult to accurately reflect the fossil carbon emission level measured by the city and has poor correlation with the atmospheric 14C activity [17].
In order to reasonably characterize the cities’ fossil carbon emission level, this study calculates the fossil energy consumption density (FCD) of Chinese cities based on the primary energy consumption structure of each province and GDP composition of the sub-regions, as shown in Supplementary Materials Figure S1. The domestic 14C activity data are reprocessed using the cities FCD data to explore the relationship between fossil carbon emission and biomass 14C activity.
2.2. Field Sampling
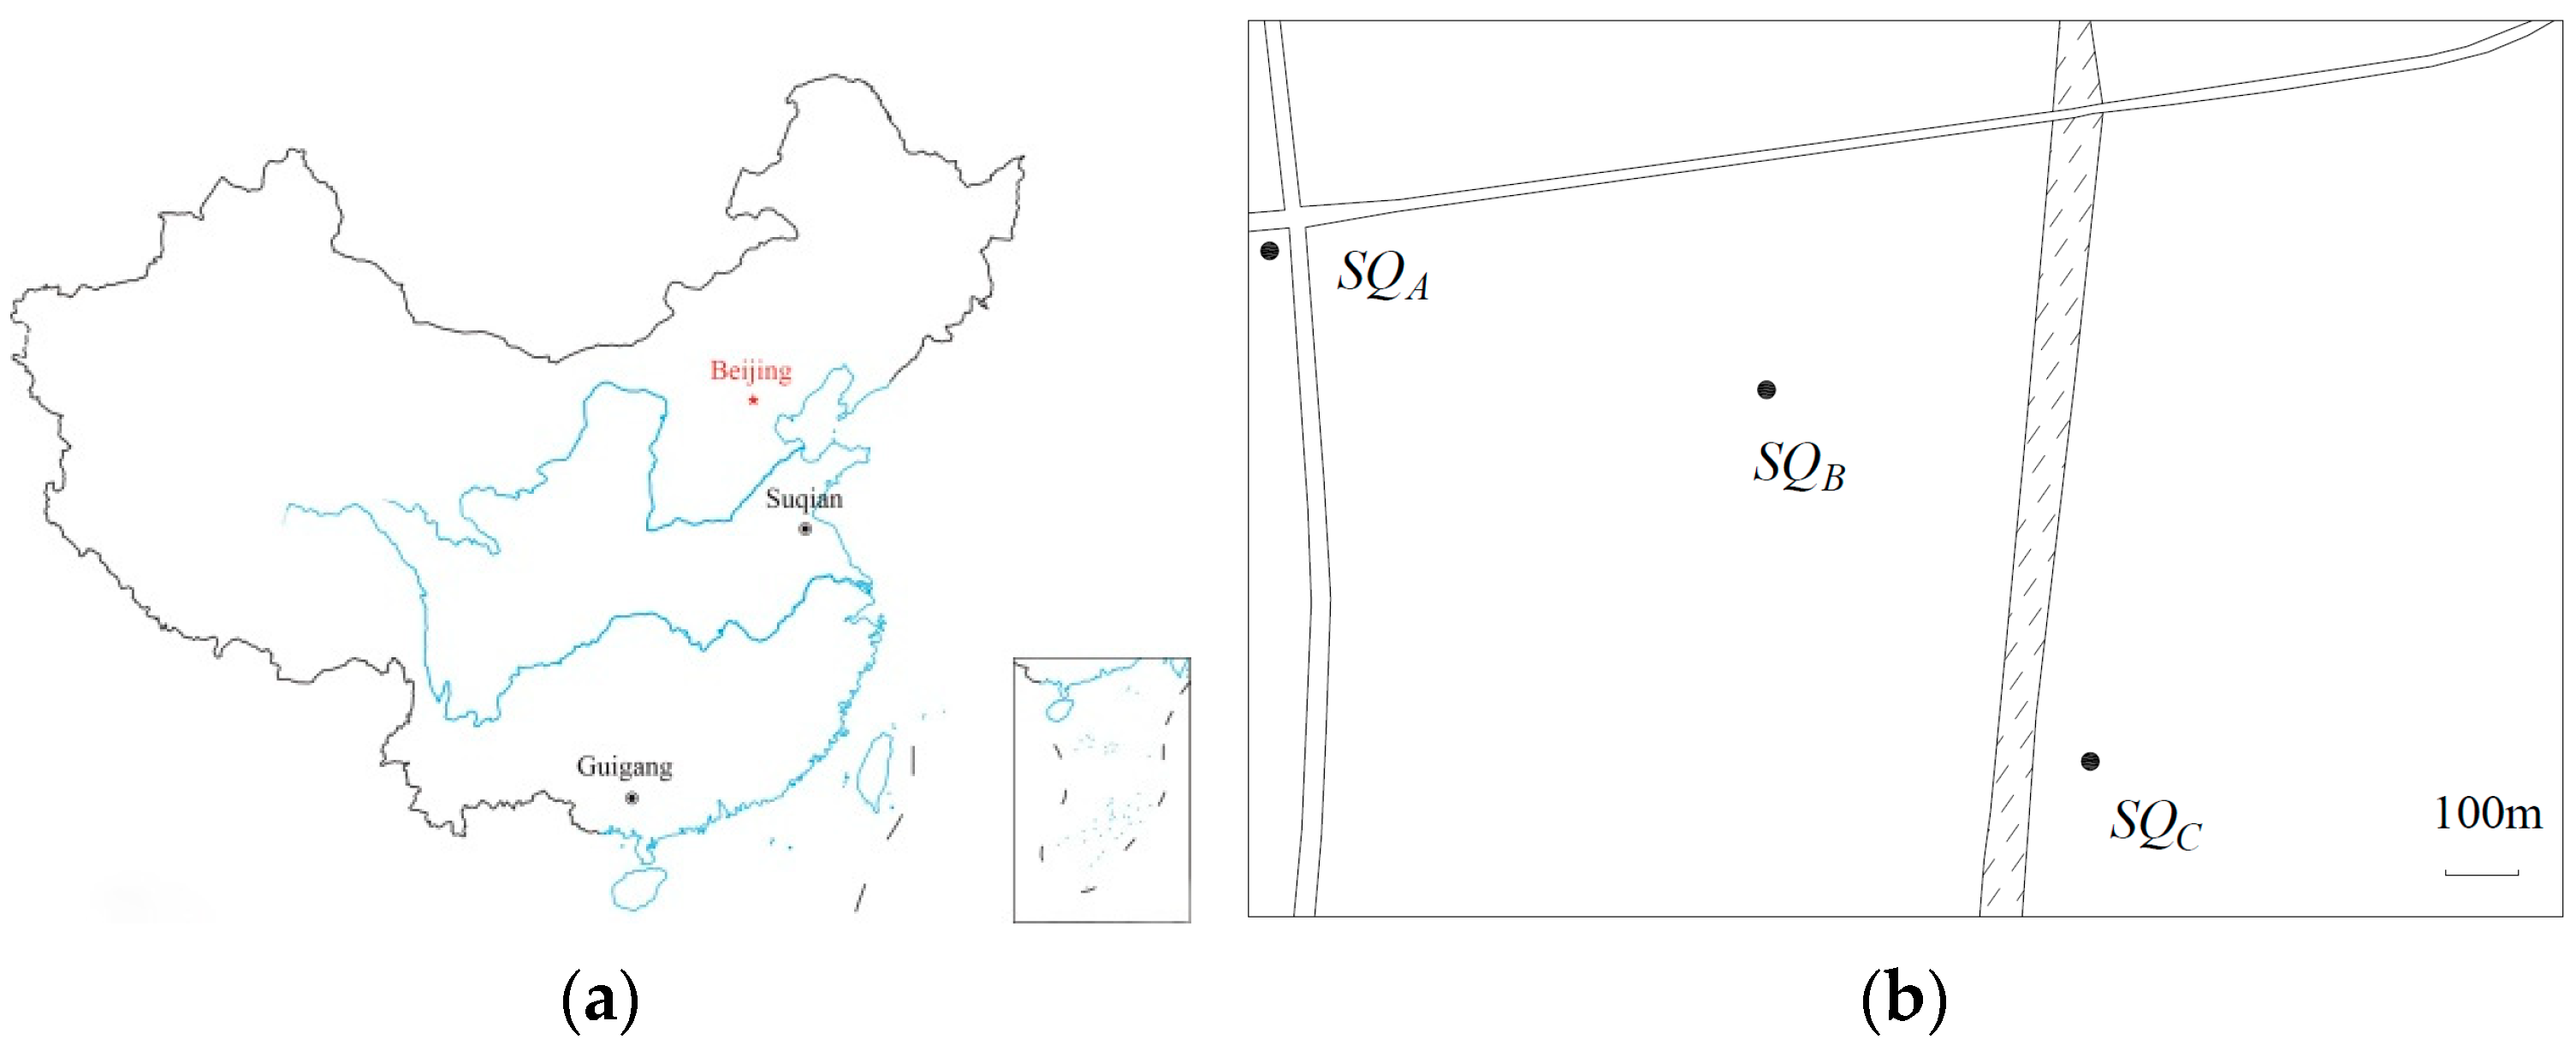
The field sampling experiments are executed for further investigation. This study samples rice straws and tree ring at Suqian (SQ) of Jiangsu Province and Guigang (GG) of Guangxi Province. The geographic locations are shown in Figure 2a. Herein, the collected rice samples were planted in June 2019 and all the biomass samples were harvested in October 2019.
2.2.1. Fossil Carbon Emission
In these researches [13,14], the influence of adjacent fossil carbon sources was avoided for representing the local atmospheric 14C activity, and sampling sites required are more than 1 km from any highway, 100 m from any paved road, and 20 m from houses. However, the relationship of FCD-cities atmospheric 14C activity obtained from these 14C data could not fully reflect the impact of fossil carbon emissions.
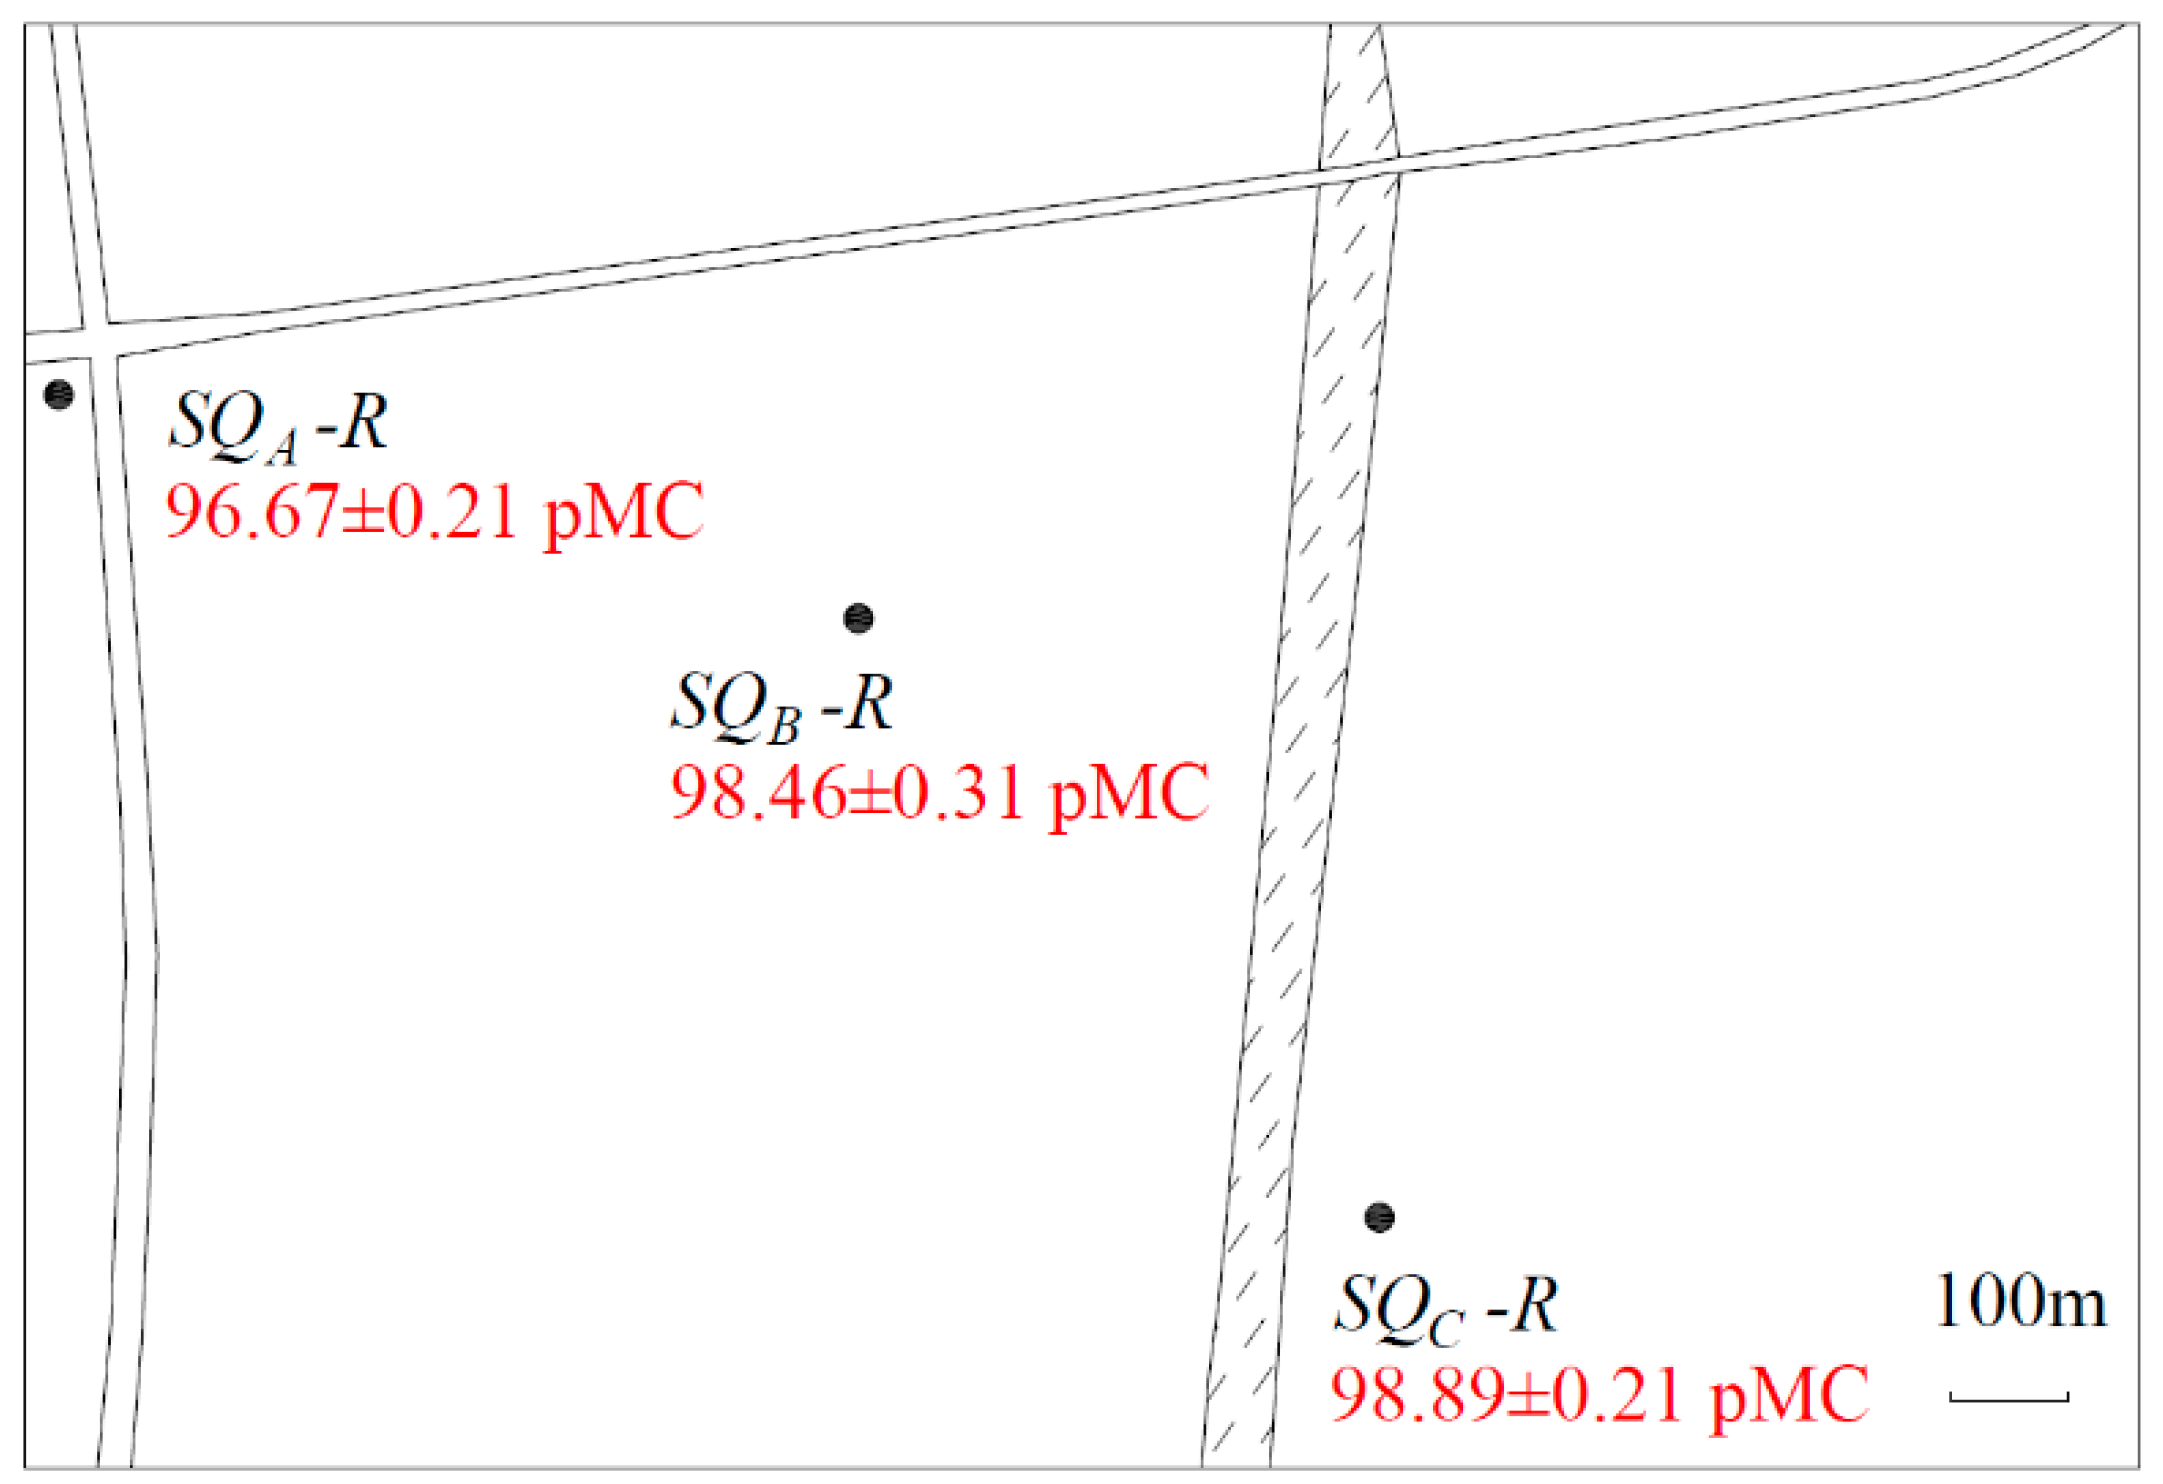
In order to investigate the effects of adjacent fossil carbon sources at SQ, three sites with different distances from the main fossil carbon sources were selected and the rice samples were taken, as shown in Figure 2b. SQA site is adjacent to the intersection of the highway, which is full of large trucks. The sampled rice straws at SQC site were 1 km away from two highways, to compare with SQA site. Between the SQA and SQC, the SQB site is selected.
2.2.2. Biomass Species
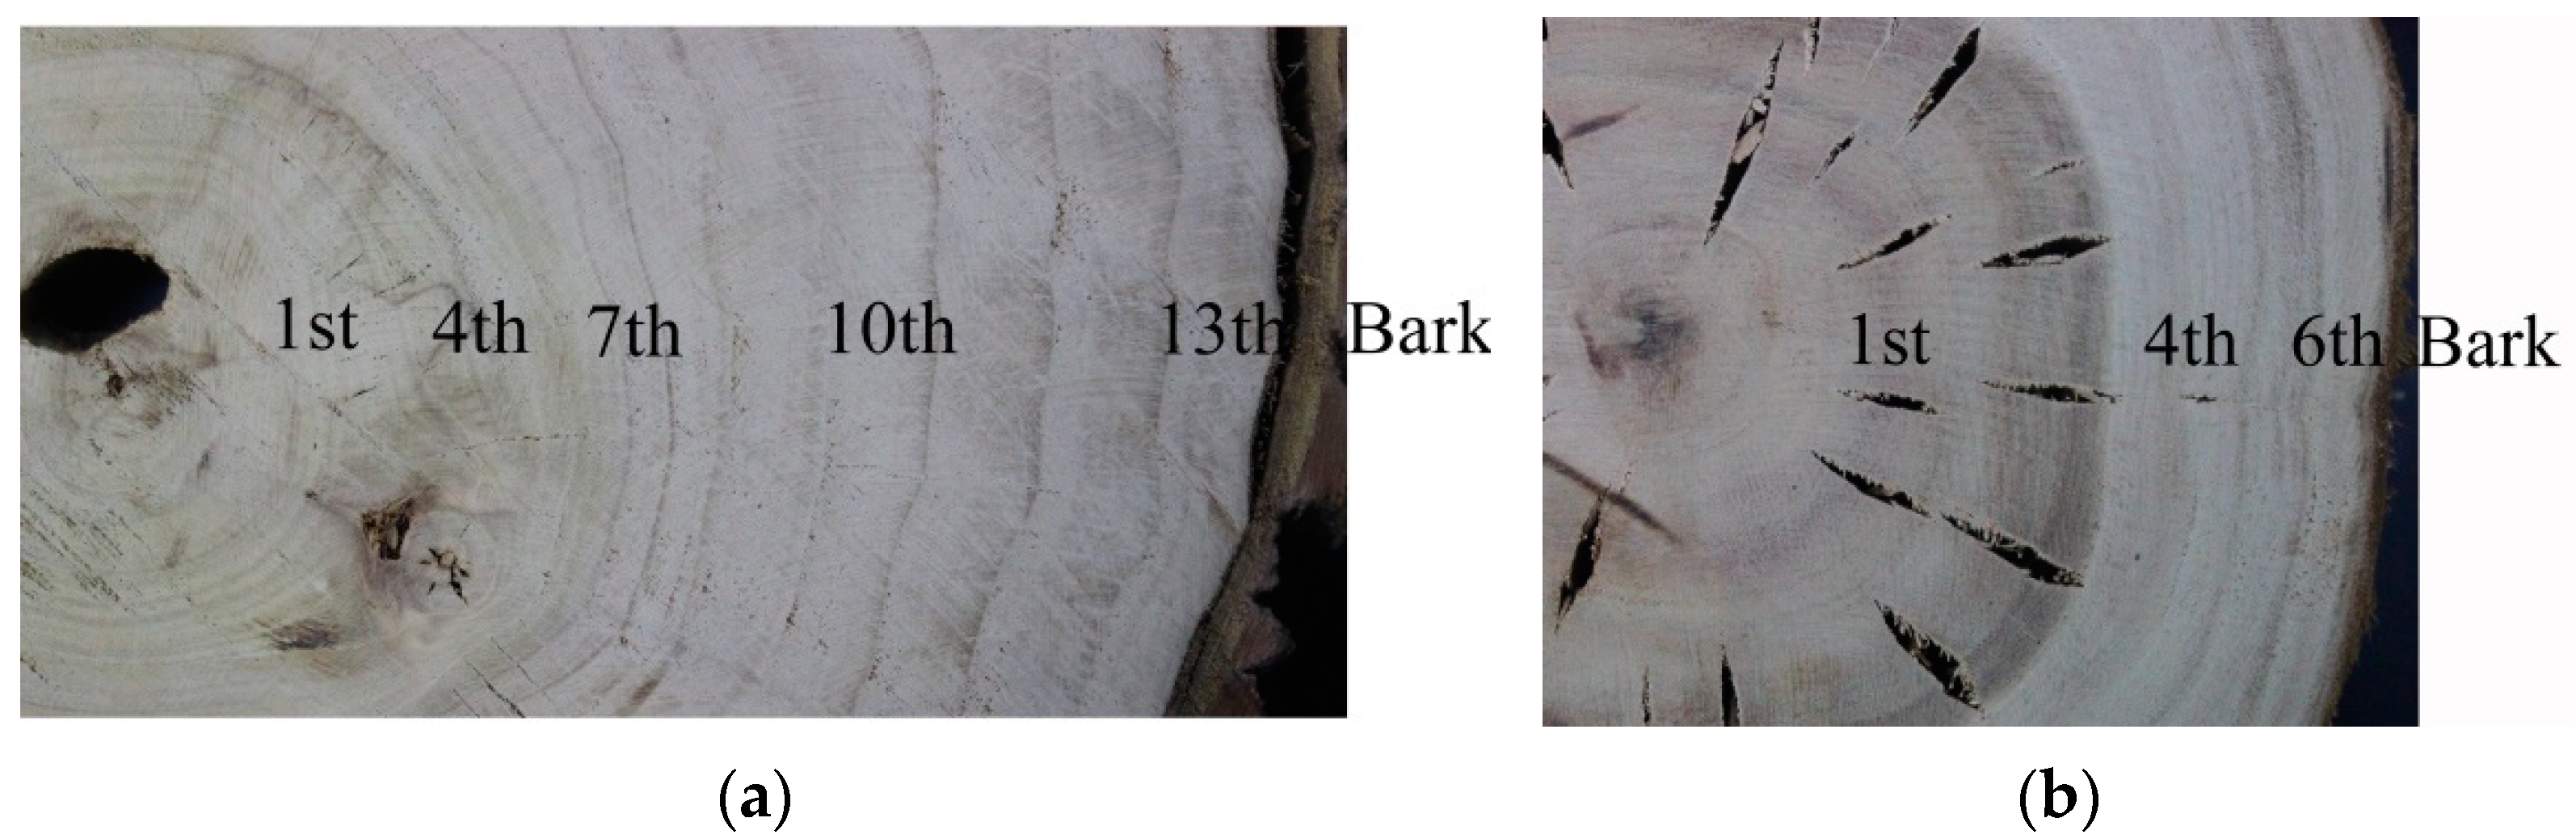
In addition to the different life spans, the different growth habits within plants may also cause the diversity of 14C activity. For example, the bark is a common and cost- effective fuel in domestic biomass energy projects, but its 14C activity law is still unclear. In order to explore the 14C activity law of the bark, tree rings with the bark of poplar and eucalyptus were randomly selected as samples in the local wood processing factories of SQ and GG. Poplars and eucalyptus were the representative timber trees in Northern and Southern China. The time for the mature sapling of fast-growing poplar and fast-growing eucalyptus becomes useful timber is general 12–15 years and 5–7 years, respectively. The photos of poplar rings and eucalyptus rings are shown in Figure 3a,b.
2.3. 14C Detection Method
Following Xu et al. [18], in this study, the field samples were graphitized in a set of high vacuum pipelines as shown in Figure S2. Furthermore, accelerator mass spectrometry (AMS) was chosen to detect 14C activity of the samples. The 14C values of the graphite samples were measured and provided by the Xi’an accelerator mass spectrometry center.
3. Results and Discussion
3.1. Theory Renewal of Factors Influencing Biomass 14C Activity
The 14C activities of biomass samples collected in this study are summarized in Table S1. As depicted in Table S1, the first half of the abbreviation denotes the sampling cities and specific sampling sites. The second half represents the plant species; R, P, and E refer to the rice straws, poplars and eucalyptus, respectively. The subscripts of P and E signify the different parts of the trees—B and R are the tree barks and tree rings, respectively; PR1 and ER1 are the innermost rings of poplars and eucalyptus, respectively; and PR13 and ER6 are the outermost rings of poplars and eucalyptus, respectively.
3.2. Effects of Fossil Carbon Emissions
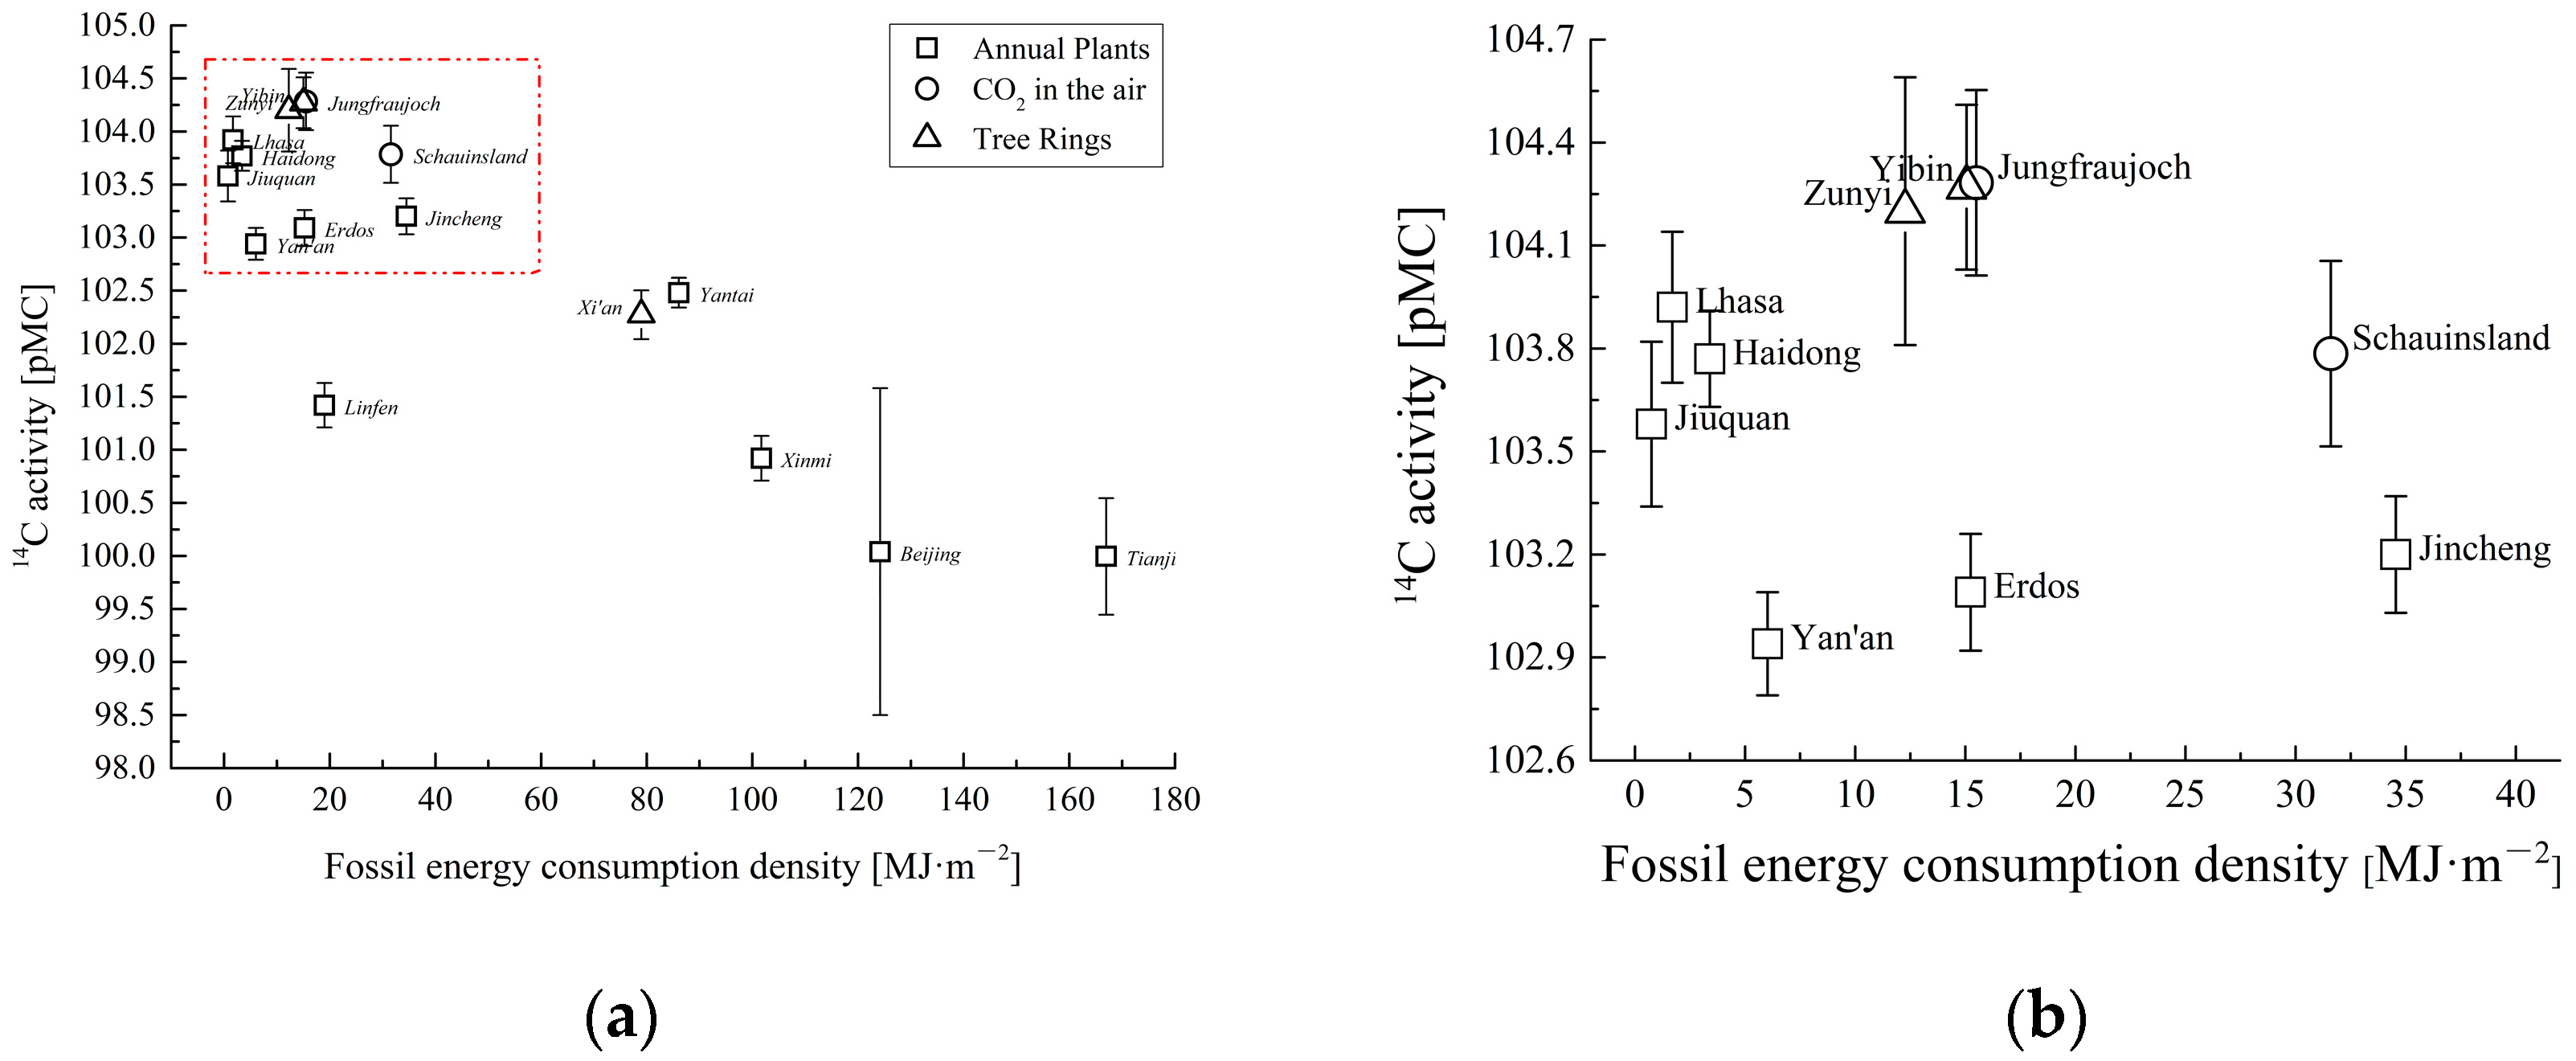
Figure 4 illustrates the 2010 atmospheric 14C activity and FCD data of 14 Chinese cities. The 14C activity data of Yibin, Zunyi and Xi’an are from tree rings felled on the mountains [15,16], while those of the other Chinese cities are from annual plants sampled in the field in 2010 [14]. In order to compare the 14C activity of the Northern Hemisphere atmospheric background, the 14C activity data of Jungfraujoch (JFJ) and Schauinsland (SIL) obtained by collecting atmospheric CO2 with the flasks [10] are also marked in Figure 4. The x-axis corresponds to the FCD data of Switzerland and Germany respectively [19].
Figure 4 shows that the 14C activity of the sample significantly has a negative correlation with the city’s FCD. The points of Yibin and Zunyi coincide with that of JFJ, which is the observation point of the Northern Hemisphere atmospheric background. What is more, the points of high FCD cities, such as Beijing and Tianjin, are significantly lower than the point of JFJ in Figure 4. However, it seems that the local FCD is an effective reference to characterize the local atmospheric 14C activity. Therefore, the annual crops collected in other cities with FCD less than or equal to Yibin and Zunyi, the 14C activity of most samples is still 0.5–1.7 pMC lower than the Northern Hemisphere atmospheric background, even if the sampling sites strictly comply with the aforementioned regulations.
A similar phenomenon appeared in the samples collected in this study. According to the FCD of SQ and GG presented in Figure S1, the local atmospheric 14C activity of these two cities in 2019 should be equivalent to the theoretical background value of 99.68 ± 0.35 pMC in the Northern Hemisphere. Hence, the SQC-R and GGA-R collected far away from the fossil carbon sources are 0.7–1.4 pMC lower than the background value. Perhaps the annual crops in Figure 4 and in this study only represent precisely the atmospheric 14C activities of their habitats, which are usually lower at different degrees than that of the local general atmosphere.
As shown in Figure 5, there is a significant difference in 14C activity of SQA-R, SQB-R and SQC-R. SQA is less than 10 m away from highway crossroads. Fossil carbon without 14C emitted by passing vehicles has a great influence on the 14C activity of SQA-R, only 96.67 ± 0.21 pMC. SQC is at least 1 km away from highways. The 14C activity of SQC rice stalk samples is 98.89 ± 0.21 pMC, which is much higher than that of SQA-R. The distance from SQB to the fossil carbon source is between SQA and SQC. As expected, the 14C activity of SQB-R is between SQA and SQC, 98.46 ± 0.31 pMC. This result matches the expectation that the atmospheric 14C activities are lower while closer to the fossil carbon sources. However, the reason why the 14C activity of SQC-R is 0.91 pMC lower than the background value should be clarified.
Perhaps, keeping a certain horizontal distance from the fossil carbon source such as SQC-R can avoid been directly affected by fossil carbon source such as SQA-R. However, due to the horizontal diffusion of the atmosphere, the fossil carbon concentration of SQC will be higher than the local general atmospheric value, so SQC is not a representative site. It can be inferred that the insufficient representativeness of the selected sampling sites caused the different discrete degrees on the y-axis of the cities with close FCD in Figure 4, indicating that the sampling method needs improvements.
This study considers that the mountains with a certain altitude are the representative sampling sites. The upper atmosphere is not only horizontally, but also vertically away from the fossil carbon sources. Fewer obstacles, as well as higher wind speeds, make the atmosphere more uniform, so these sampling points can represent a wider spatial range. Some studies have mentioned that the higher the altitude, the ‘cleaner’ the air [20]. This is also the reason why the sites above 3500 m are selected as sampling sites for the atmospheric background purpose.
In fact, in China, the location distribution of most biomass habitats such as farmlands and common fossil carbon sources such as highways are staggered and adjacent. Therefore, conclusions can be drawn here. Firstly, the requirements of sampling sites should be stricter when measuring the local atmospheric 14C activity in Chinese cities. Mountains with a certain altitude and without fossil carbon sources may be a good choice. Secondly, the correction for the influence of fossil carbon diffusion should be considered when predicting the 14C activity of biomass based on the local atmospheric 14C activity. Generally, this study data shows that the 14C activity of annual biomass grown in the plains open to traffic is lower than the local atmospheric 14C activity by about 0.7–1.4 pMC.
3.3. Effects of Biomass Species
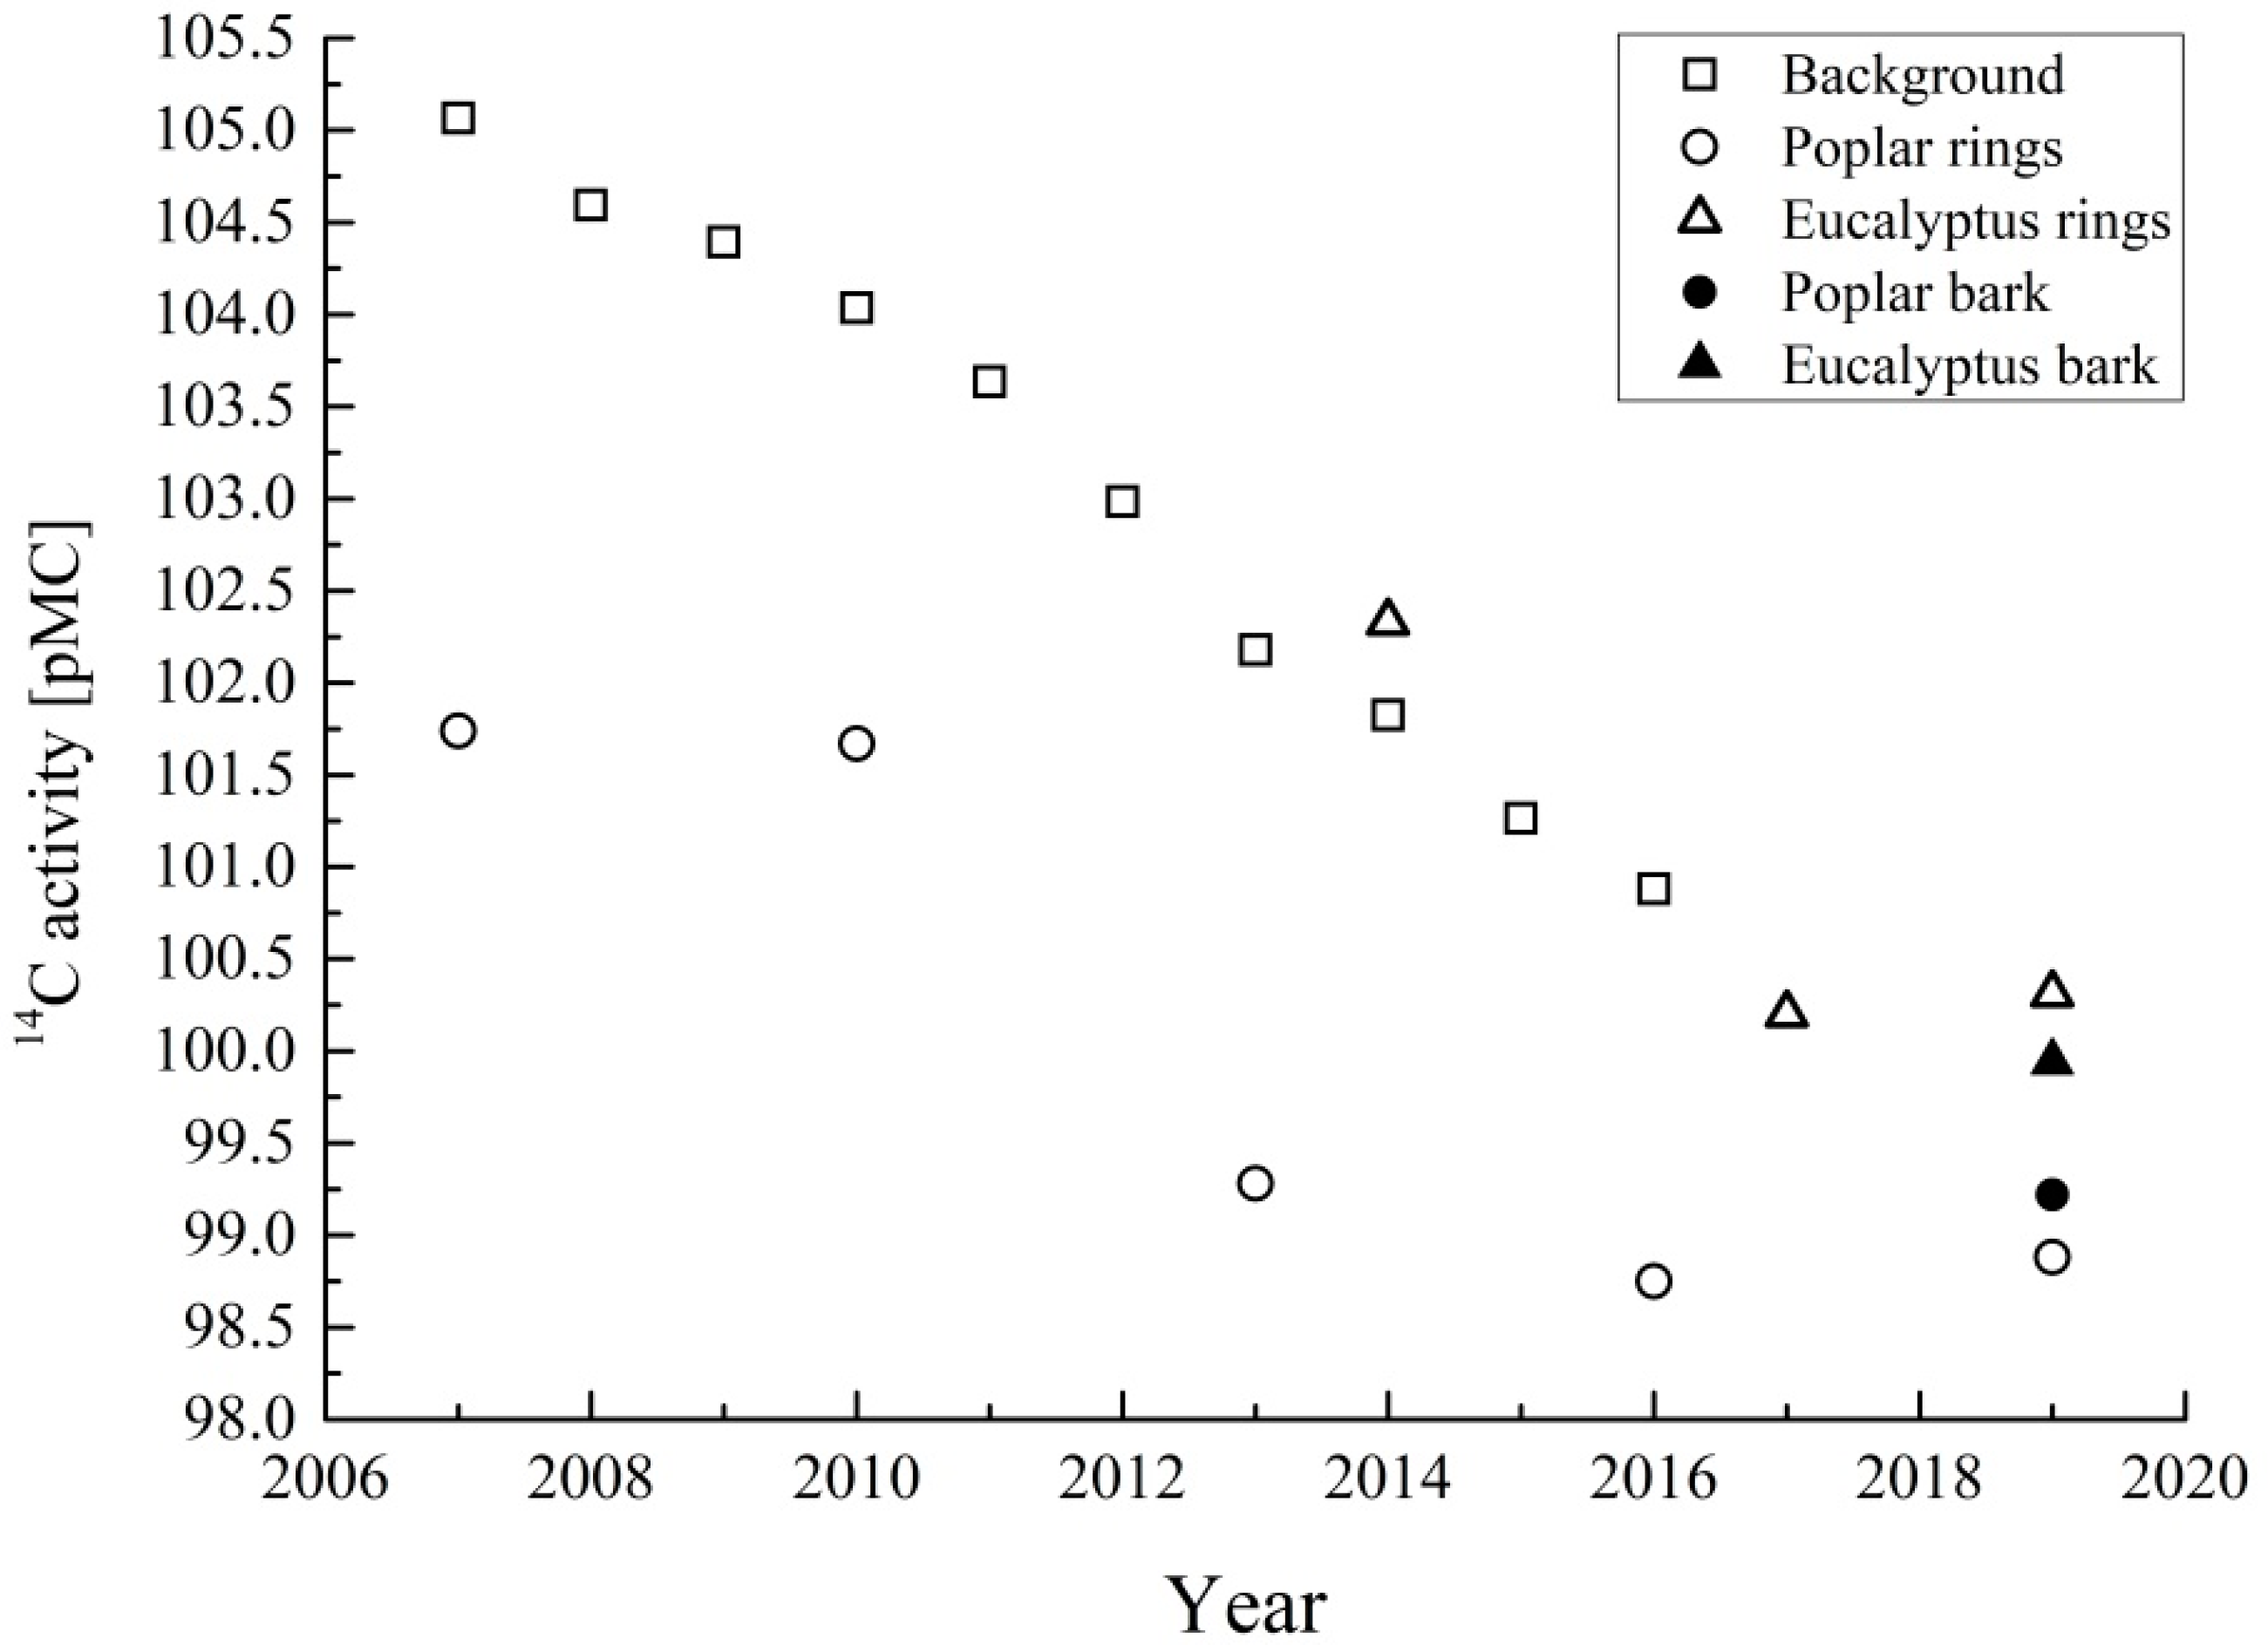
The 14C activity of bark has a special pattern. Herein, the tree rings used are taken from local wood processing factories; their growth periods can be determined, but the specific planting sites are unknown. However, it can be assumed based on the discussion of fossil carbon emissions. Figure 6 compares the 14C activity of sampled poplar and eucalyptus tree rings with the 14C activity of the Northern Hemisphere atmospheric background from 2007 to 2019. The 14C activity of SQ-PR and GG-ER decreases as the year increases.
The phenomenon whereby the bark periodically falls off provides a special pattern of the bark 14C activity. Traditional theory [21] agrees that the shedding of bark is due to the formation of the new periderm. Therefore, the original periderm dies and falls off under weathered action. Liu [22] summarized the shedding law of eucalyptus bark. New periderm forms in the fresh bark of eucalyptus once a year. After the programed death of the original periderm, the cell layer between the new and old periderm will degrade under the action of pectinase. Subsequently, the periderm loses its connection with the trunk, breaking and falling off under weathered action.
As shown in Figure 6, the 14C data points in 2019 correspond to the outermost tree ring of eucalyptus, bark of eucalyptus, the outermost tree ring of poplar and the bark of poplar from top to bottom. The 14C activity of GG-EB is lower than that of the outermost tree ring, which confirms the conclusion of Liu’s study. This eucalyptus bark was generated in 2019. While predicting the 14C activity of eucalyptus bark, only the felling year’s atmosphere of the sampling site should be considered.
The poplar bark has the opposite behavior. The 14C activity of SQ-PB is higher than that of the outermost tree ring. The original periderm of Populus can survive for 20–30 years, so the timber poplar with 10–15 years of tree-age may not have a renewed bark before fell off. Therefore, the atmospheric trends during the whole growth period should be taken into account when predicting the 14C activity of poplar bark. The bark is not as well defined as the tree ring, and there is little research on the growth of bark.
In the study, the age-weighted and mass-weighted average 14C activity of these poplar tree rings are calculated and compared with the measured value of bark. A linear fit is performed on the 14C activity of the poplar tree rings, and the median of the growth year is taken to obtain the age-weighted average 14C activity (99.96 ± 0.61 pMC), which is over 0.7 pMC higher than SQ-PB. It is difficult to be used as a reference to predict the 14C activity of poplar bark. The mass-weighted average 14C activity is calculated following Mohn et al. [5]. Assuming that the tree rings are a series of homogeneous ideal concentric circles, the average of the inner and outer diameters of each tree ring in multiple directions is used to calculate the rings area ratio. The mass-weighted average 14C activity of the poplar tree is obtained by combining the rings area ratio with the above fitting curve (98.88 ± 2.95 pMC), which is about 0.3 pMC lower than SQ-PB. This reveals that the general tree ring growth model could not predict the bark accurately. However, the mature age of the timber poplar is short, and the deviation between the mass-weighted average 14C activity of the tree rings and the actual 14C activity of the bark is within an acceptable range in this study.
3.4. Prediction Equation of Abiomass
Considering the effects of time, fossil carbon emissions, and biomass species on Abiomass, the prediction equation of Abiomass in domestic industrial co-firing power station can be expressed as follows:
where Pre.Abiomass is the predicted value of biomass fuel 14C activity [PMC]; EC.fuel and EC.fossil are the correction coefficients of biomass species and fossil carbon emissions respectively; f(year) is the 14C activity–time variation equation of the background atmosphere in the Northern Hemisphere, which can be obtained from the data in Figure 1.
In this study, the atmospheric 14C activities from 1991 to 2016 are linearly fitted and f(year) can be expressed as follows:
However, the data of atmospheric 14C activity after 2016 have not been published and the applicability of Equation (2) in 2017 to present period cannot be verified. So, two possibilities for f(year) after 2016 are suggested: 1. Due to the Susse effect [11], the atmospheric 14C activity continues to decline, and Equation (2) is still applicable with the correction coefficient; 2. The atmospheric 14C activity has reached the equilibrium value, which will fluctuate in the range of 100.50–99.50 pMC just like the periods before 1950. So far, f(year) can be characterized as:
where A and B are the correction coefficients based on the actual atmospheric 14C activities after 2017, and at this stage, both A and B are considered to be 1.0.
In this study, ±0.50 pMC is used as the 95% confidence interval standard deviation of f(year).
3.4.1. Correction Coefficient of Fossil Carbon Emission
The results show that the effects of fossil carbon emissions on atmospheric 14C activity are mainly reflected in two aspects: 1. According to the increase of FCD, the cities’ atmospheric 14C activity is lower at different degrees than that of the Northern Hemisphere background atmosphere; 2. The adjacent fossil carbon sources of the specific plant habitats will further reduce the atmospheric 14C activity. If equation f(FCD) is used to characterize the ratio changing of 14C activity between cities’ atmosphere and background atmosphere with the cities’ FCD; the coefficient Ff can be used to characterize the direct impact of adjacent fossil carbon sources, therefore, EC.fossil can be expressed as:
The mountains with a certain altitude are the representative sampling points used in this study. By fitting the data points that meet this requirement, f(FCD) can be characterized as:
In China, the main sources of biomass fuel, such as farmland and woodland, are often staggered with fossil carbon sources such as highways and households. For example, the fossil carbon without 14C emitted from vehicles will spread to the places 1 km away from the horizontal direction. Then this fossil carbon dilutes the atmospheric 14C activities of the plant habitats near the highway, and finally reduces the 14C activity of biomass. This is also the reason why the sampling points near the ground are difficult to reflect the real atmospheric 14C activity. According to the existing data and the test results of the field sampling in this study, it is suggested that 0.991 ± 0.004 should be a reasonable range for Ff.
This study takes ±0.005 as the 95% confidence interval standard deviation of EC.fossil.
3.4.2. Correction Coefficient of Biomass Species
The EC.fuel is expressed as:
where ffuel_i is the ratio of specific biomass i in the biomass fuels, which could be obtained directly from the power station; Ffuel_i is the correction coefficient of specific biomass i. Table 1 provides the 4 categories of common biomass fuels and the recommended range of Ffuel_i.
Type I is annual fresh biomass, of which 14C activity should be consistent with the atmospheric 14C activity in theory. The Ffuel_i of type I is determined after considering the influence of plants’ growth season span and photosynthetic efficiency. Essentially, the atmospheric 14C activity fluctuates slightly with seasons. The heating demand in winter temporarily increases the local FCD, so the atmospheric 14C activity in winter is lower than that in summer [23]. Moreover, in another study [24], it was concluded that different photosynthetic efficiency among plants can also lead to slight segregation of 14C in plants, such as corn and rice.
Type II is perennial fresh biomass, which is generally the waste wood from wood processing factories. The change of the atmospheric 14C activity will reflect in the tree rings. According to the tree growth model proposed by Chapman Richards and the atmospheric 14C activity in the past 30 years, the tree age range of 5–30 years is given in Table 1. For example, the age of timber eucalyptus is generally 5–7 years, and 1.007 is a reasonable coefficient for eucalyptus. The age of timber poplar is 12–15 years and the coefficient recommended in this study is 1.023.
This study shows that the growth patterns and 14C activity laws of fresh bark are unique. Therefore, the bark is classified as type III biomass. The eucalyptus barks will fall off and renew every year, so the 14C activity of the eucalyptus bark is consistent with that of type I biomass. However, the poplar barks will not fall off before the timber poplar felled, but the growth mode of poplar barks is unknown. According to the field sampling results, Table 1 shows the possible value range of Ffuel_i of 12–15-year-old poplar bark.
Generally, wood board refers to waste furniture or waste wood left by demolished buildings. Similarly, the variation of atmospheric 14C activity with time should be considered while predicting the wood board’s 14C activity. However, it is difficult to grasp the specific growth period of the wood boards, which causes the low reliability of the prediction results. Due to the lack of research data on domestic wood boards, the conclusion of Mohn et al. [5] is directly used in this study as the Ffuel_i of type IV biomass.
The standard deviation of EC.fuel is decided according to ffuel_i.
3.4.3. Calculation Examples of the Prediction Equation
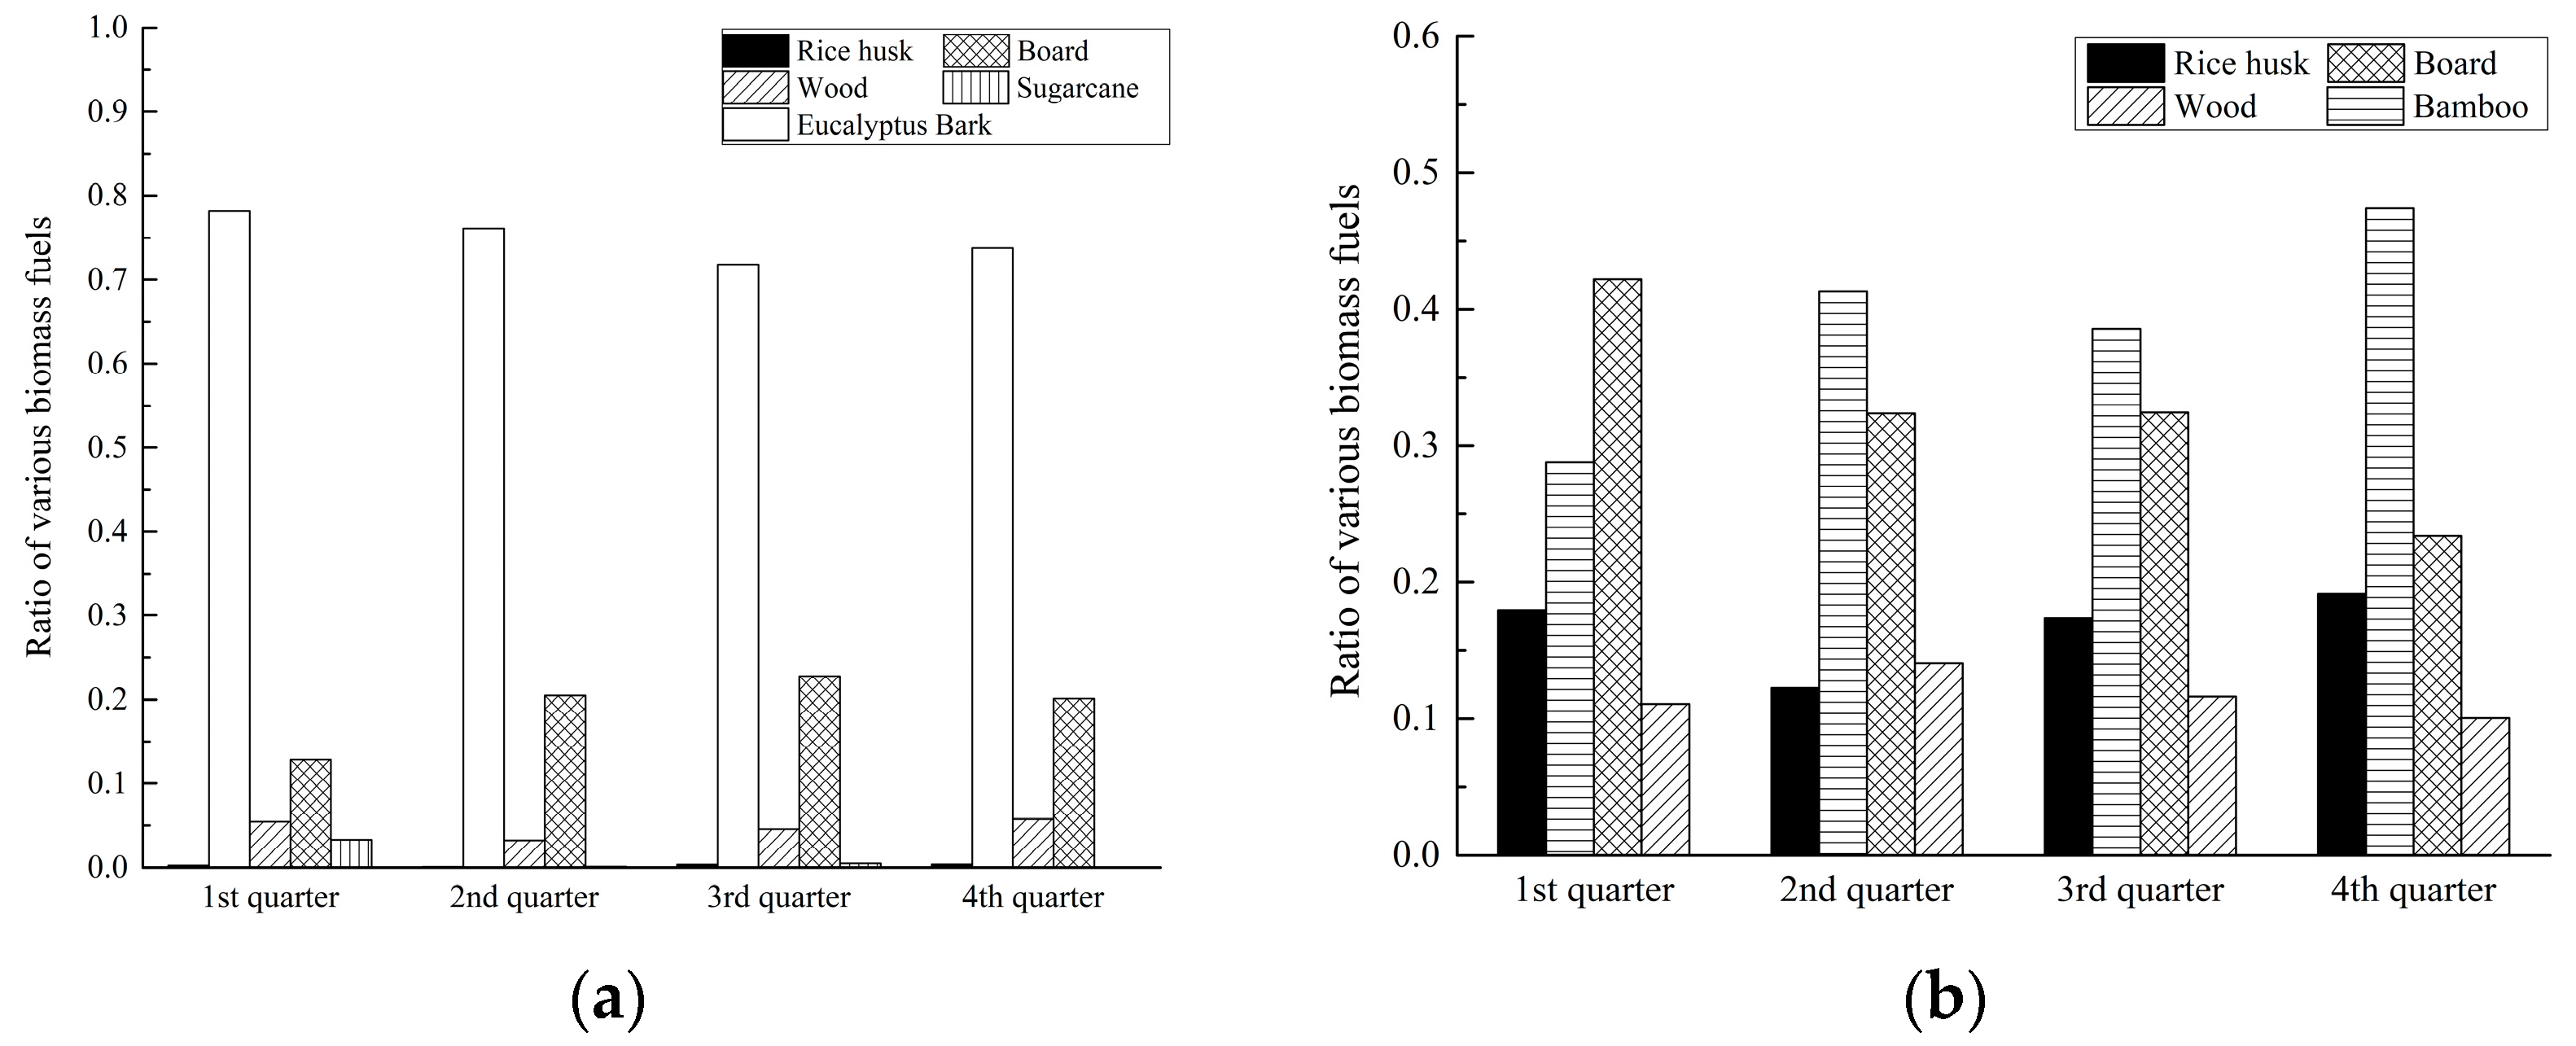
Figure 7a shows the biomass fuel composition of a biomass direct-fired power station at Guigang in 2018, which accounted for 75% eucalyptus barks, 19% wood boards, 4.8% fresh woods and 1.2% sugarcane leaves. The Pre.Abiomass is calculated step by step according to the prediction equations.
- f(year): Assuming that the atmospheric 14C activity remains the same downward trend in 2018, then f(year) would be 99.80 ± 0.50 pMC calculated using Equation (2).
- EC.fossil: The FCD value of Guigang in 2018 is 13.22 MJ/m2. According to Equation (5), the atmospheric 14C activity at Guigang should be the same as that of the Northern Hemisphere. Considering the influence of common fossil carbon sources nearby such as highways and households, the EC.fossil should be 0.991 ± 0.005 pMC.
- EC.fuel: Corresponding to Table 1, the correction coefficient of the various biomass fuels of the power station at Guigang can be obtained. The Ffuel_i of eucalyptus bark, wood board and sugarcane leaf are 1.000 ± 0.001, 1.200 ± 0.090, and 1.002 ± 0.001, respectively. The fresh wood is mainly the processed waste of eucalyptus, for which the age is 5–7 years, and its Ffuel_i can be taken as 1.007 ± 0.002. Combining with ffuel_i in Figure 7a, the EC.fuel is calculated as 1.038 ± 0.018.
- Pre.Abiomass: The above f(year), EC.fossil, and EC.fuel are substituted into Equation (1), and 102.66 ± 2.81 pMC is obtained as the Abiomass of the biomass direct-fired power station at Guigang in 2018.
In the same way, 105.77 ± 4.22 pMC is predicted as the Abiomass of the biomass direct-fired power station at Hengyang in 2018. Figure 7b shows the biomass fuel composition, which accounted for 16.8% rice husks, 39.4% bamboo wastes, 32.2% wood boards, and 11.6% fresh woods. The FCD value of Hengyang in 2018 is 24.18 MJ/m2.
At the present stage, the most accurate Abiomass can be obtained by taking and testing the biomass fuel samples directly from the power station. However, with the support of more works and data samples in the future, this prediction equation would be a applicable method with better economy and timeliness.
4. Conclusions
This study established a new evaluation method of the relationship between biomass 14C and FCD based on the published domestic data, which is more in line with the Chinese situation. The results were compared with the 14C activity of several typical Chinese biomass fuels obtained by field sampling at Guigang and Suqian. Additionally, the renewal effects of fossil carbon emissions and biomass species on biomass 14C activity were clarified. In order to improve the accuracy of the 14C method for biomass fuel ratio testing in a Chinese co-firing power station, a reasonable prediction equation of Abomass was proposed.
It was found that the 14C activity of the cities local atmosphere has a negative correlation with the cities’ FCD. Partly, this relationship could explain the effects of fossil carbon emissions. The parts left are common fossil carbon sources such as highways that intersect most biomass habitats, and the diffusion of fossil carbon causes its atmospheric 14C activity to be 0.5–1.7 pMC lower than that of the local general atmosphere. Besides, different 14C activity laws induced by biomass species are important. For example, bark has a special shedding mechanism and growth law, which should be distinguished from the tree ring when predicting its 14C activity.
Finally, this article preliminarily proposed a prediction equation based on the atmospheric 14C activity–time variation equation and corrected by the correction coefficients of biomass species and fossil carbon emissions, which can cause Abiomass to be closer to the actual value. In the future, more works should be implemented to optimize this equation.
Supplementary Materials
The following are available online at https://0-www-mdpi-com.brum.beds.ac.uk/article/10.3390/pr9060994/s1, Figure S1: (a) Local fossil energy consumption density (FCD) of Guigang (GG), Suqian (SQ) and other places in the period of 2005–2018; (b) 14C activity of samples from Cuihua mountain (CHM) in Xi’an [16], Fenghuang mountain (FHM) in Zunyi [15], Jungfraujoch (JFJ) in Switzerland and Schauinsland (SIL) in Germany [10], and these places’ local Fossil energy consumption density (FCD) [17,19], in the period of 2005–2018. Figure S2: Graphitization system. H2O trap cooled with ethanol at −65 °C; CO2 trap cooled with liquid nitrogen; V1–V5: valves. Table S1: 14C activity of sampled annual crops and tree rings.
Author Contributions
Conceptualization, Y.T. and Z.L.; methodology, Y.T., Z.L. and C.Y.; experimental studies, Y.T.; writing—original draft, Y.T.; writing—review and editing, Z.L. and C.Y.; funding acquisition, Z.L. and C.Y. All authors have read and agreed to the published version of the manuscript.
Funding
This work is funded by the U.S. National Science Foundation, namely, the NSFC-NSF project (Grant No. 51661125012).
Institutional Review Board Statement
Not applicable.
Informed Consent Statement
Not applicable.
Data Availability Statement
No extral data. All the data reported in this study were in the Supplementary Materials Figure S1.
Conflicts of Interest
The authors declare no conflict of interest.
References
- Chen, S.; Feng, H.; Zheng, J.; Ye, J.; Song, Y.; Yang, H.; Zhou, M. Life Cycle Assessment and Economic Analysis of Biomass Energy Technology in China: A Brief Review. Processes 2020, 8, 1112. [Google Scholar] [CrossRef]
- Jia, C.H. Combustion Characteristics and Kinetic Analysis of Biomass Pellet Fuel Using Thermogravimetric Analysis. Processes 2021, 9, 868. [Google Scholar] [CrossRef]
- Yang, H.C.; Lee, M.W.; Eun, H.C.; Kim, H.J.; Lee, K.; Seo, B.K. Thermal Decontamination of Spent Activated Carbon Contaminated with Radiocarbon and Tritium. Processes 2020, 8, 1359. [Google Scholar] [CrossRef]
- Hämäläinen, K.M.; Jungner, H.; Antson, O.; Räsänen, J.; Tormonen, K.; Roine, J. Measurement of biocarbon in flue gases using 14C. Radiocarbon 2007, 49, 325–330. [Google Scholar] [CrossRef] [Green Version]
- Mohn, J.; Szidat, S.; Zeyer, K.; Emmenegger, L. Fossil and biogenic CO2 from waste incineration based on a yearlong radiocarbon study. Waste Manag. 2012, 32, 1516–1520. [Google Scholar] [CrossRef] [PubMed]
- Quarta, G.; Calcagnile, L.; Cipriano, D.; D’Elia, M.; Maruccio, L.; Ciceri, G.; Martinotti, V. AMS-14C Determination of the Biogenic-Fossil Fractions in Flue Gases. Radiocarbon 2018, 60, 1327–1333. [Google Scholar] [CrossRef] [Green Version]
- Tang, Y.X.; Luo, Z.Y.; Yu, C.J.; Cen, J.M.; Chen, Q.Y.; Zhang, W.N. Determination of biomass-coal blending ratio by 14C measurement in co-firing flue gas. J. Zhejiang Univsc. A 2019, 20, 475–486. [Google Scholar] [CrossRef]
- Palstra, S.W.L.; Rabou, L.P.L.M.; Meijer, H.A.J. Radiocarbon-based determination of biogenic and fossil carbon partitioning in the production of synthetic natural gas. Fuel 2015, 157, 177–182. [Google Scholar] [CrossRef]
- Fuglsang, K.; Pedersen, N.H.; Larsen, A.W.; Astrup, T.F. Long-term sampling of CO2 from waste-to-energy plants: 14C determination methodology, data variation and uncertainty. Waste Manag. Res. 2016, 32, 115. [Google Scholar] [CrossRef] [PubMed]
- Hammer, S.; Levin, I. Monthly Mean Atmospheric D14CO2 at Jungfraujoch and Schauinsland from 1986 to 2016. heiDATA Dataverse 2017, V2. [Google Scholar] [CrossRef]
- Suess, H.E. Radiocarbon concentration in modern wood. Science 1955, 122, 415–417. [Google Scholar] [CrossRef]
- ASTM International. Method D 6866-16: Determining the Biobased Content of Solid, Liquid, and Gaseous Samples Using Radiocarbon Analysis; National Standards of American: West Conshohocken, PA, USA, 2016. [Google Scholar]
- Hsueh, D.Y.; Krakauer, N.Y.; Randerson, J.T.; Xu, X.; Trumbore, S.E.; Southon, J.R. Regional patterns of radiocarbon and fossil fuel-derived CO2 in surface air across North America. Geophys. Res. Lett. 2007, 34, 155–164. [Google Scholar] [CrossRef] [Green Version]
- Xi, X.T.; Ding, X.F.; Fu, D.P.; Zhou, L.P.; Liu, K.X. Δ14C level of annual plants and fossil fuel derived CO2 distribution across different regions of China. Nucl. Instrum. Meth. B 2013, 294, 515–519. [Google Scholar] [CrossRef]
- Cheng, P.; Zhou, W.; Burr, G.S.; Fu, Y.; Fan, Y.; Wu, S. Authentication of Chinese vintage liquors using bomb-pulse 14C. Sci. Rep. 2016, 6, 38381. [Google Scholar] [CrossRef] [PubMed]
- Hou, Y.; Zhou, W.; Cheng, P.; Xiong, X.; Du, H.; Niu, Z.; Yu, X.; Fu, Y.; Lu, X. 14C-AMS measurements in modern tree rings to trace local fossil fuel-derived CO2 in the greater Xi’an area, China. Sci. Total Environ. 2020, 715, 136669. [Google Scholar] [CrossRef] [PubMed]
- Mao, S.Y.; Ye, Z.C.; Jiang, L.G. China Statistical Yearbook 2019; China Statistics Press: Beijing, China, 2019. [Google Scholar]
- Xu, X.; Trumbore, S.E.; Zheng, S.; Southon, J.R.; McDuffee, K.E.; Luttgen, M.; Liu, J.C. Modifying a sealed tube zinc reduction method for preparation of AMS graphite targets: Reducing background and attaining high precision. Nucl. Instrum. Methods Phys. Res. Sect. B Beam Interact. Mater. Atoms 2007, 259, 320–329. [Google Scholar] [CrossRef] [Green Version]
- British Petroleum. BP Statistical Review of World Energy 2020; British Petroleum: London, UK, 2020. [Google Scholar]
- Turnbull, J.; Rayner, P.; Miller, J.; Naegler, T.; Ciais, P.; Cozic, A. On the use of 14CO2 as a tracer for fossil fuel CO2: Quantifying uncertainties using an atmospheric transport model. J. Geophys. Res. Space Phys. 2009, 114, 22. [Google Scholar] [CrossRef]
- Okla, M.K.; Alamri, S.A.; Salem, M.Z.; Ali, H.M.; Behiry, S.I.; Nasser, R.A.; Alaraidh, I.A.; Al-Ghtani, S.M.; Soufan, W. Yield, Phytochemical Constituents, and Antibacterial Activity of Essential Oils from the Leaves/Twigs, Branches, Branch Wood, and Branch Bark of Sour Orange (Citrus aurantium L.). Processes 2019, 7, 363. [Google Scholar] [CrossRef] [Green Version]
- Liu, X.M. Study on the Abscission Bark Formation Process and Mechanism of Eucalyptus grandis × E. urophylla. Ph.D. Thesis, Fujian Agriculture and Forestry University, Fuzhou, China, 2013. [Google Scholar]
- Shi, T.; Huang, R.M.; Ding, C.B. Research on the Optimal Configuration of Regional Integrated Energy System Based on Production Simulation. Processes 2020, 8, 892. [Google Scholar] [CrossRef]
- Shankarappa, S.K.; Muniyandi, S.J.; Chandrashekar, A.B.; Singh, A.K.; Nagabhushanaradhya, P.; Shivashankar, B.; El-Ansary, D.O.; Wani, S.H.; Elansary, H.O. Standardizing the Hydrogel Application Rates and Foliar Nutrition for Enhancing Yield of Lentil (Lens culinaris). Processes 2020, 8, 420. [Google Scholar] [CrossRef] [Green Version]
Figure 1.
The 14C activity of the Northern Hemisphere atmospheric background, from 1940–2016 [10].
Figure 1.
The 14C activity of the Northern Hemisphere atmospheric background, from 1940–2016 [10].

Figure 2.
(a) Map of China and the direction of Suqian and Guigang; (b) Detailed sampling sites distribution at Suqian (SQ).
Figure 2.
(a) Map of China and the direction of Suqian and Guigang; (b) Detailed sampling sites distribution at Suqian (SQ).

Figure 3.
(a) The photo of poplar rings; (b) the photo of eucalyptus rings. The barks and each ring are marked on the photos.
Figure 3.
(a) The photo of poplar rings; (b) the photo of eucalyptus rings. The barks and each ring are marked on the photos.

Figure 4.
(a) Fossil energy consumption density of multiple cities in China, 2010 and 14C activity of plant samples representing atmosphere in these cities; (b) the zoom graph of the defined part, FCD from 0 to 40 MJ·m−2 and 14C activity from 102.6 to 104.7 pMC.
Figure 4.
(a) Fossil energy consumption density of multiple cities in China, 2010 and 14C activity of plant samples representing atmosphere in these cities; (b) the zoom graph of the defined part, FCD from 0 to 40 MJ·m−2 and 14C activity from 102.6 to 104.7 pMC.

Figure 5.
14C activity of Suqian (SQ) rice straw samples in different positions from fossil carbon sources.
Figure 5.
14C activity of Suqian (SQ) rice straw samples in different positions from fossil carbon sources.

Figure 6.
Comparison of Suqian poplar, Guigang eucalyptus and Northern Hemisphere atmospheric background in the period of 2007–2019.
Figure 6.
Comparison of Suqian poplar, Guigang eucalyptus and Northern Hemisphere atmospheric background in the period of 2007–2019.

Figure 7.
Fuel structure of biomass direct-fired power stations in (a) Guigang, Guangxi and (b) Hengyang, Hunan (in quarters, 2018).
Figure 7.
Fuel structure of biomass direct-fired power stations in (a) Guigang, Guangxi and (b) Hengyang, Hunan (in quarters, 2018).


Table 1.
Categories and correction coefficients of common biomass fuels.
| Type | Ffuel_i | Examples | |
|---|---|---|---|
| I | Annual fresh biomass | 0.997–1.003 | Rice husk, rice/corn/wheat straw, sugarcane leaf/bagasse, cotton straw, etc. |
| II | Perennial fresh biomass | 1.005–1.060 | Processing wastes of pine, bamboo, timber eucalyptus and poplar, etc. |
| III | Fresh bark | 1.000, 1.019–1.041 | Eucalyptus bark, poplar bark, etc. |
| IV | Wood board | 1.110–1.290 | Waste furniture, construction waste, etc. |
Publisher’s Note: MDPI stays neutral with regard to jurisdictional claims in published maps and institutional affiliations. |
© 2021 by the authors. Licensee MDPI, Basel, Switzerland. This article is an open access article distributed under the terms and conditions of the Creative Commons Attribution (CC BY) license (https://creativecommons.org/licenses/by/4.0/).
Share and Cite
MDPI and ACS Style
Tang, Y.; Luo, Z.; Yu, C. Accuracy Improvement of the 14C Method Applied in Biomass and Coal Co-Firing Power Stations. Processes 2021, 9, 994. https://0-doi-org.brum.beds.ac.uk/10.3390/pr9060994
AMA Style
Tang Y, Luo Z, Yu C. Accuracy Improvement of the 14C Method Applied in Biomass and Coal Co-Firing Power Stations. Processes. 2021; 9(6):994. https://0-doi-org.brum.beds.ac.uk/10.3390/pr9060994
Chicago/Turabian StyleTang, Yuxing, Zhongyang Luo, and Chunjiang Yu. 2021. "Accuracy Improvement of the 14C Method Applied in Biomass and Coal Co-Firing Power Stations" Processes 9, no. 6: 994. https://0-doi-org.brum.beds.ac.uk/10.3390/pr9060994
Note that from the first issue of 2016, this journal uses article numbers instead of page numbers. See further details here.