
Residual Life Prediction for Induction Furnace by Sequential Encoder with s-Convolutional LSTM


Major in Industrial Data Science & Engineering, Department of Industrial Engineering, Pusan National University, 2, Busandaehak-ro 63beon-gil, Geumjeong-gu, Busan 46241, Korea
*
Author to whom correspondence should be addressed.
Processes 2021, 9(7), 1121; https://0-doi-org.brum.beds.ac.uk/10.3390/pr9071121
Submission received: 1 June 2021
/
Revised: 21 June 2021
/
Accepted: 25 June 2021
/
Published: 28 June 2021
(This article belongs to the Special Issue Application of Big Data Analysis and Advanced Analytics in Sustainable Production Process)
Abstract
:Induction furnaces are widely used for melting scrapped steel in small foundries and their use has recently become more frequent. The maintenance of induction furnaces is usually based on empirical decisions of the operator and an explosion can occur through operator error. To prevent an explosion, previous studies have utilized statistical models but have been unable to generalize the problem and have achieved a low accuracy. Herein, we propose a data-driven method for induction furnaces by proposing a novel 2D matrix called a sequential feature matrix(s-encoder) and multi-channel convolutional long short-term memory (s-ConLSTM). First, the sensor data and operation data are converted into sequential feature matrices. Then, N-sequential feature matrices are imported into the convolutional LSTM model to predict the residual life of the induction furnace wall. Based on our experimental results, our method outperforms general neural network models and enhances the safe use of induction furnaces.
1. Introduction
A furnace is a device used to melt metal through heat. Stable conditions and maintenance to avoid failures are key elements in the industrial use of furnaces. Furnace maintenance methods depend on the type and numerous furnace classifications exist. The general description and classification [1] of furnaces are in the Table 1.
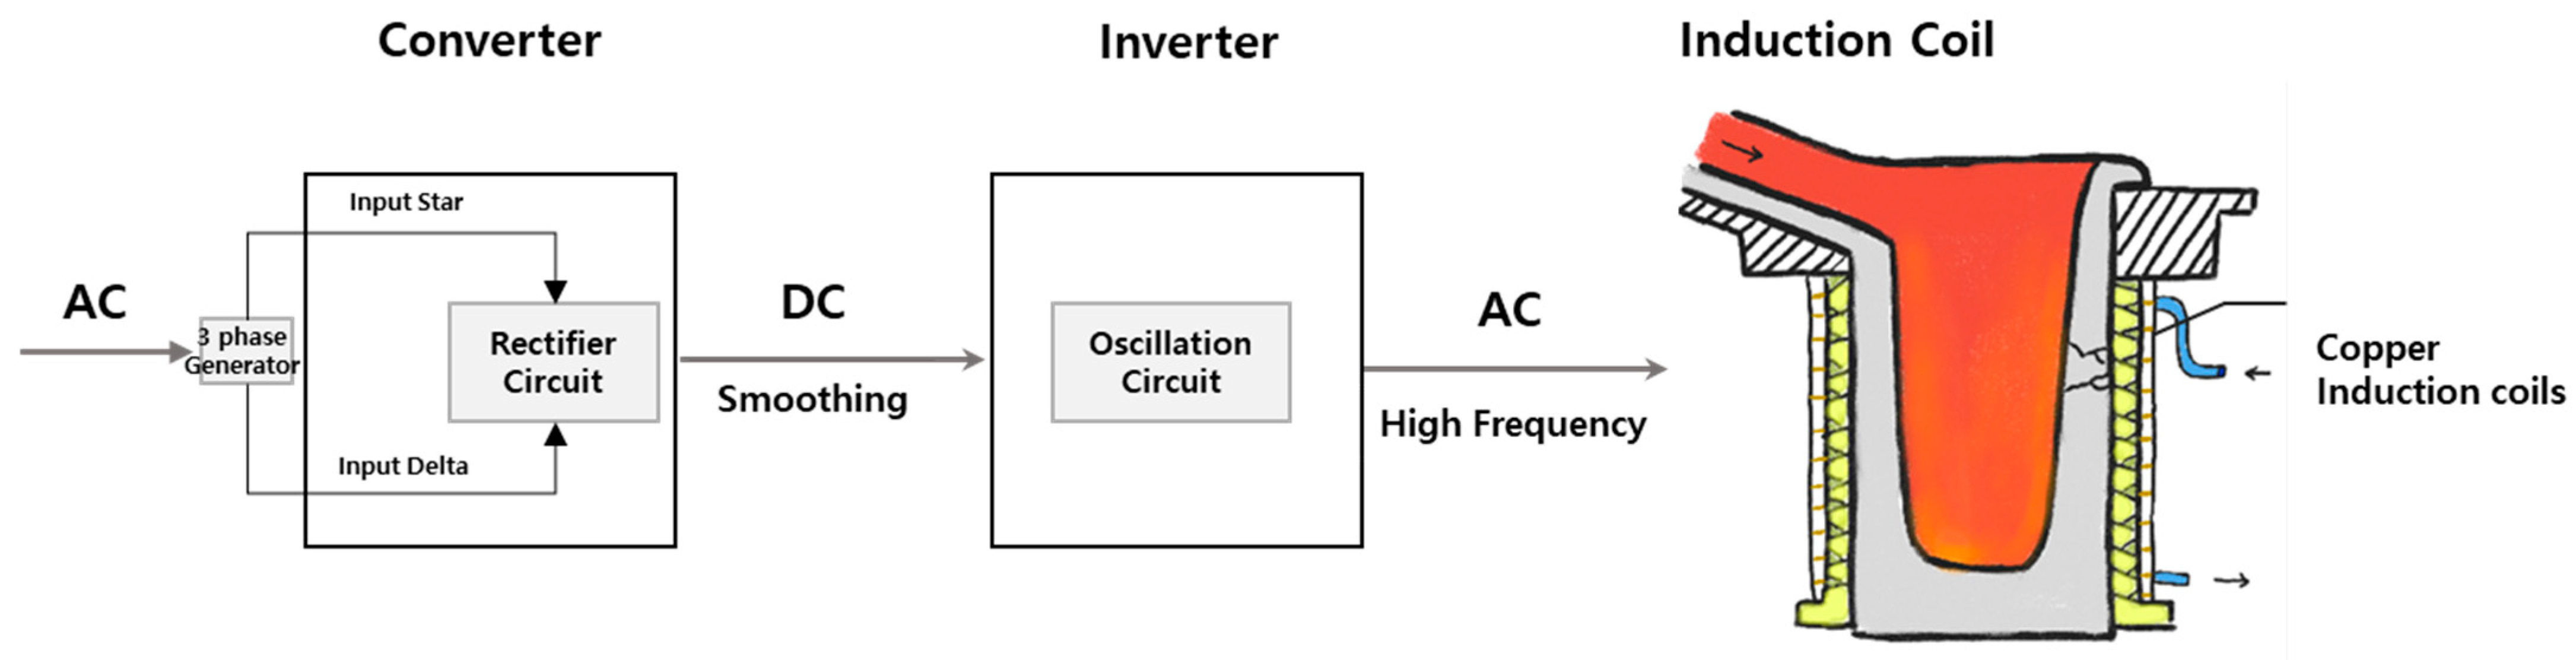
The electric furnace was developed during the 19th century. Such furnaces are divided into electric arc furnaces, which generate electricity directly through the metal, and induction furnaces, which generate heat indirectly by inducing electricity. An electric furnace is cylindrical in shape for energy efficiency and there is no need to maintain a stable condition, unlike with a blasting furnace. Electric furnaces are adequate for small-volume production, special types of steel, and alloy production, rather than large-scale metal production use for pig iron. An electric arc furnace melts the metal using the energy generated by an arc between electrodes. By contrast, an induction furnace produces heat by inducing a high-frequency current. The configurations of the electrical parts of the system are the converter, inverter, and induction coil (furnace). The external current flows in the form of an alternating current. The alternative current is then converted from the rectifier circuit in the converter, to a smoothed direct current. Subsequently, the inverter re-converts a direct current into an alternating current with a high frequency. Finally, a high-frequency current is fed into the induction coil. The whole electricity flow process is shown in Figure 1.
It is known that the speed and efficiency of an induction furnace are higher and better than those of a blasting furnace. Induction furnaces are widely used in small foundries.
Maintenance of the furnace is essential for efficiency and operational performance. Maintenance of a blasting furnace is conducted to prevent the stoppage of an operation. Therefore, maintaining a stable condition during the congestion process or a continuous operation is crucial. In studies related to the maintenance of a blasting furnace, the state of such a furnace based on real-time monitoring [2] or the condition of the furnace [3] has been predicted. By contrast, electric furnaces are mainly focused on preventing cracks or steam explosions. Maintenance includes the regular inspection, monitoring, and prediction of explosions. These differences in the maintenance result from a schematic of an electric furnace, consisting of electrical and cooling parts. To prevent heat generation in an electric furnace (induction coil or electrodes) from heat, the coolant needs to circulate the heat generator.
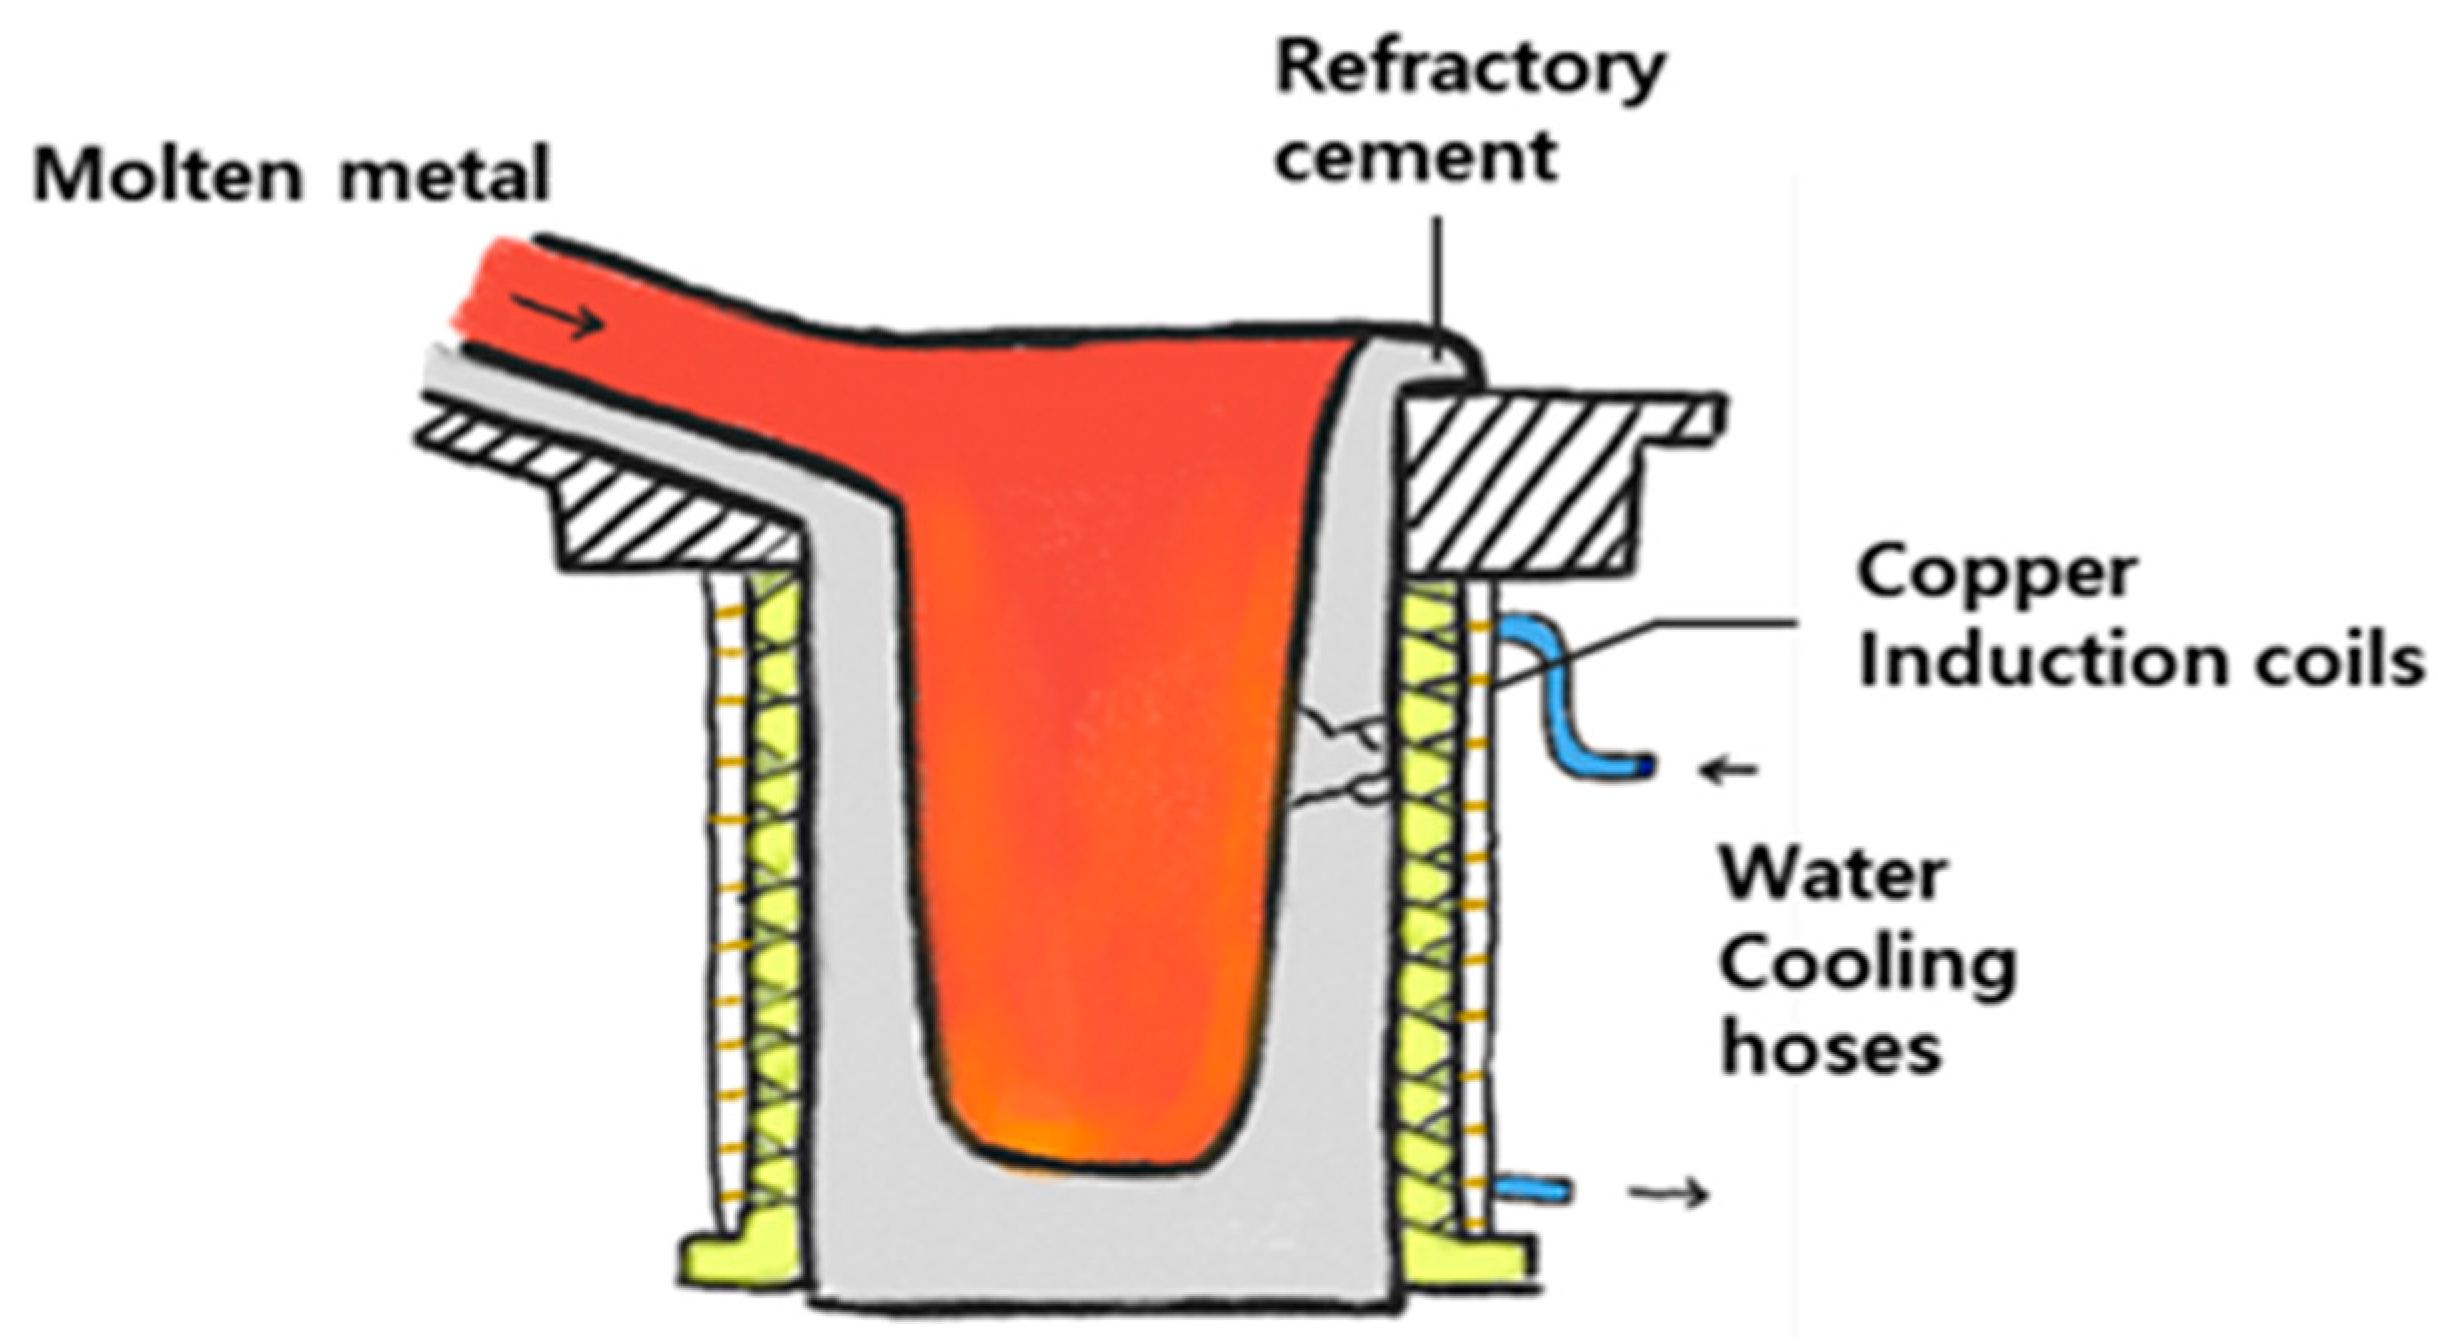
In the Figure 2, the induction furnace consists of three parts: refractory cement, copper induction coils, water cooling hoses. A copper induction coil functions as a heat generator. To cool the induction coils, the water cooling hoses cover the induction coils. Refractory cement protects the induction coils and water cooling hoses. However, after some melting operations, the furnace walls crack or erode. Molten metal flows through the cracks and eventually meets with water cooling hoses, melting them. Contact between the coolant and molten metal results in a steam explosion. It is known that such explosions rarely occur. However, such an explosion will have a fatal impact on both businesses and workers. A previously known solution to this problem is regular maintenance. However, the solution has raw accuracy for predicting an explosion and is insensitive to the rapid transition of a furnace.
For this reason, many studies have introduced data-driven predictive maintenance of the machine or systematic component to prevent a fault in advance [4]. Similar research has been conducted through the fault diagnosis method [5,6]. As an example, signal-based diagnosis methods have a wide application in real-time monitoring and diagnosis for an electronic device or mechanical components [5]. Our paper focuses on the signal from the electrical system. These methods can be classified into three categories, the time-domain signal-based method, frequency-domain signal-based method, and the time-frequency signal-based method [5]. Among these categories, the time-domain signal-based method is most similar to our approach. A statistical approach [5] is often used for the time-domain signal-based method. Recently, a two-dimensional approach was proposed [7].
When it comes to induction furnaces, there is still a lack of existing research. We began by predicting the residual life of the furnace based on the operation and maintenance data to develop a new data-driven time-domain signal-based approach. This paper is an extension from our previous paper [8], which described the prediction of the residual life of an induction furnace based on representative values using the multi-layer perceptron (MLP), recurrent neural network (RNN), and long short-term memory (LSTM). In our previous paper, we conducted two experiments, i.e., choosing the best representative value among four statistics (1Q, Mean, Median, and 3Q), and choosing the best target value (remaining time and remaining number of maintenance), and comparing the performance of neural networks (MLP, RNN, and LSTM). As the results indicated, 3Q, RT, and MLP exhibited the best performance.
In this paper, we propose sequential encoder and s-Convolutional LSTM. The proposed method predicts the residual life by converting n-sensor data into an n-channel 2D matrix and inputting it into a convolutional LSTM. The methodology consists of preprocessing, s-encoder, and predictive models of the data. The contributions of this study are as follows: (1) We provide a data-driven residual life prediction method that reflects the operation of induction furnaces where multiple sensor attributes and operation data are recorded independently; (2) We provide a data preprocessing technique for long-term time-series sensor data. In millions of data collected from the induction furnace, we captured the operation and predicted the long-term furnace conditions; (3) We propose a novel 2D sequential matrix to predict independent operations, along with a proper prediction model; (4) Finally, we enhance the safety of the induction furnace to prevent a steam explosion for worker safety in a foundry. The remainder of this paper is organized as follows. Section 2 provides related studies on data-driven predictive maintenance. The proposed idea is introduced in Section 3. Section 4 addresses the experimental results and provides descriptions of an actual induction furnace. Section 5 discusses the methodology and experimental results. Finally, Section 6 gives some concluding remarks regarding this research.
2. Related Work
Maintenance is defined as the work needed to maintain a road, building, and machine in good condition. Susto et al. [9] classified maintenance into four categories: (1) run to failure; (2) preventive maintenance; (3) condition-based maintenance; and (4) predictive maintenance. Among these four categories, predictive maintenance has been a promising result.
Predictive maintenance will determine whether maintenance activity is required in the future. There are two methods to predictive maintenance for predictive maintenance methodologies. The first is statistical predictive maintenance [10]. The second is data-driven predictive maintenance [11]. Statistical-based predictive maintenance uses information from the system, i.e., the development of statistical models for predicting a failure and enables preventive measures to be undertaken through a planned maintenance policy [12]. However, in the case of insufficient information or samples, another type of maintenance, data-driven predictive maintenance, is required. Data-driven predictive maintenance involves collecting a state from the system component during operation. Owing to the increased use of IoT devices and big data analytics, data-driven predictive maintenance using data has become a mainstream research topic.
Many researchers have used machine-learning techniques [4] based on plentiful data. In this study, we handle data-driven predictive maintenance using a machine-learning technique. In addition, we summarize data-driven predictive maintenance using the machine-learning technique. The summarized results of the related studies are as follows.
- (1)
- Predictive maintenance for the mechanical component: This is the most common topic of predictive maintenance. Research has been conducted on bearings [13], engines [14], turbines [15], fans [16], pumps [17], gearboxes [18], milling machines [19], and centrifugal pumps [18]. Usually, the mechanical component fault includes vibration, sound, or abnormal patterns of sensor data. These data have a long time window. Methodologies such as logistic regression [13], support vector machines [17,18], artificial neural networks [14,15], and convolutional neural networks [19,20] are used for the predictive maintenance of the mechanical component.
- (2)
- Predictive maintenance for the systematic component: A system is a combination of subsystems or components. In this case, multiple components or attributes are simultaneously operated. Data, such as historical operations [21,22], processes [23], and sensor data [24,25], are analyzed in merged form. Multivariate characteristics lead to the use of random forest [25] and DNN [23,24]. Table 2 summarizes the predictive maintenance studies.
Among the related studies, the method most similar to our approach was developed by Wen et al. [20], who provided a fault diagnosis based on the convolutional neural network. For the input data, they convert the time-domain signal into a gray pixel image and import it into a convolutional neural network. Consequently, the neural network outputs the fault classification. Another similar approach was developed by Zhao et al. [19], who attached a convolutional layer and bi-directional LSTM to predict the wear of the machine tool. Collecting data from a CNC milling machine, they merge the force, vibration, and direction data, and extract features using the convolutional model. In addition, output from the convolutional model is transferred to the LSTM layers. Finally, the bi-directional LSTM and fully connected layers predict the tool wearing.
These similar studies have common characteristics in which features are extracted by the convolutional layer and the residual life is predicted using a 2D matrix. Despite the similarity in the overall concept, in this study, there are three different parts from similar papers.
- (1)
- Channel configuration: This affects the dimensionality of the input data. For a higher dimensionality, our approach divides the sensor data attributes into multiple channels of the convolutional layer. Previous studies have configured a single channel.
- (2)
- Data conversion: The input data form determines the neural network structure. In Wen’s study, sensor data were converted into an image, whereas in Zhao’s approach, machine movement and sensor data were imported without a conversion. In our study, data converted into a 2D representation reflect the operation sequence.
- (3)
- Target: Similar papers have handled the mechanical components. However, in our study, induction furnaces are operated in a noisy environment. This distinguishes our approach from those of previous studies.
For a similar study on the maintenance of an induction furnace, a statistical approach was attempted. Christer et al. [26] proposed condition-based maintenance by predicting the induction furnace erosion. The furnace conditions were based on the operation (temperature, melt rate, operation time, and mechanical features), and these conditions were used to build up the state-space model using a Karman filter. Our study has the same objective. Although various types of research in this area have been conducted, research on data-driven predictive maintenance for induction furnaces has not been fully covered. Our study is unique in predicting the residual life of a furnace wall by using a sequential feature matrix and providing data-driven method.
3. Proposed Method
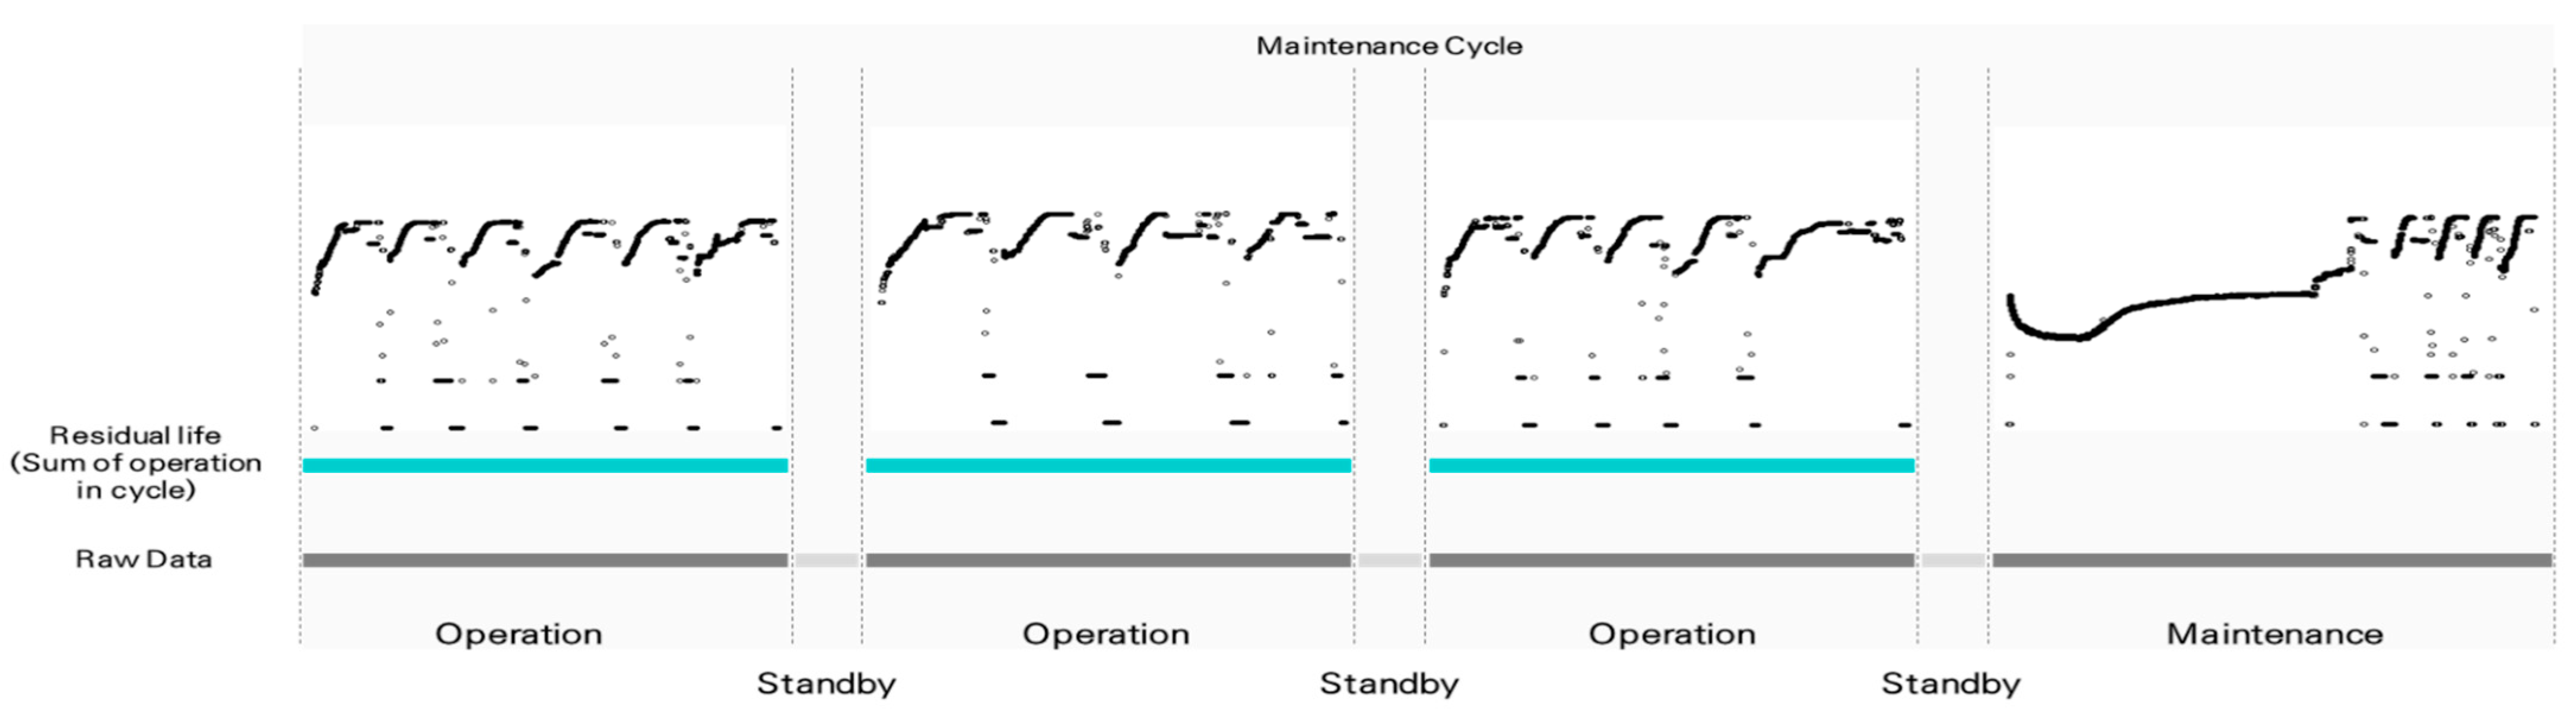
In this study, we provide a prognostics approach using the data generated from the electrical system of the induction furnace. The raw data were recorded 3 times per second, and data were continuously recorded even with the operation stoppage. During operation, the system components were generating the data by following the sequence. Each operation was independent and could be delimited by using an operation sequence. Based on the operation sequence, standby state data could be excluded during the preprocessing. After several operations, the operator performed maintenance based on the condition of the furnace wall. This process was defined as a maintenance cycle. A brief diagram of the maintenance process is as follows.
Owing to the absence of specific maintenance records (date, time, duration) in the raw data, we analyzed the frequency pattern and operation event logs to extract such information. In the frequency data from raw data, we were able to distinguish maintenance and patterns, which are shown in Figure 3. We calculated the residual life in a particular operation until the latest maintenance. The calculated residual life times were then used as a label in the training data for neural network models.
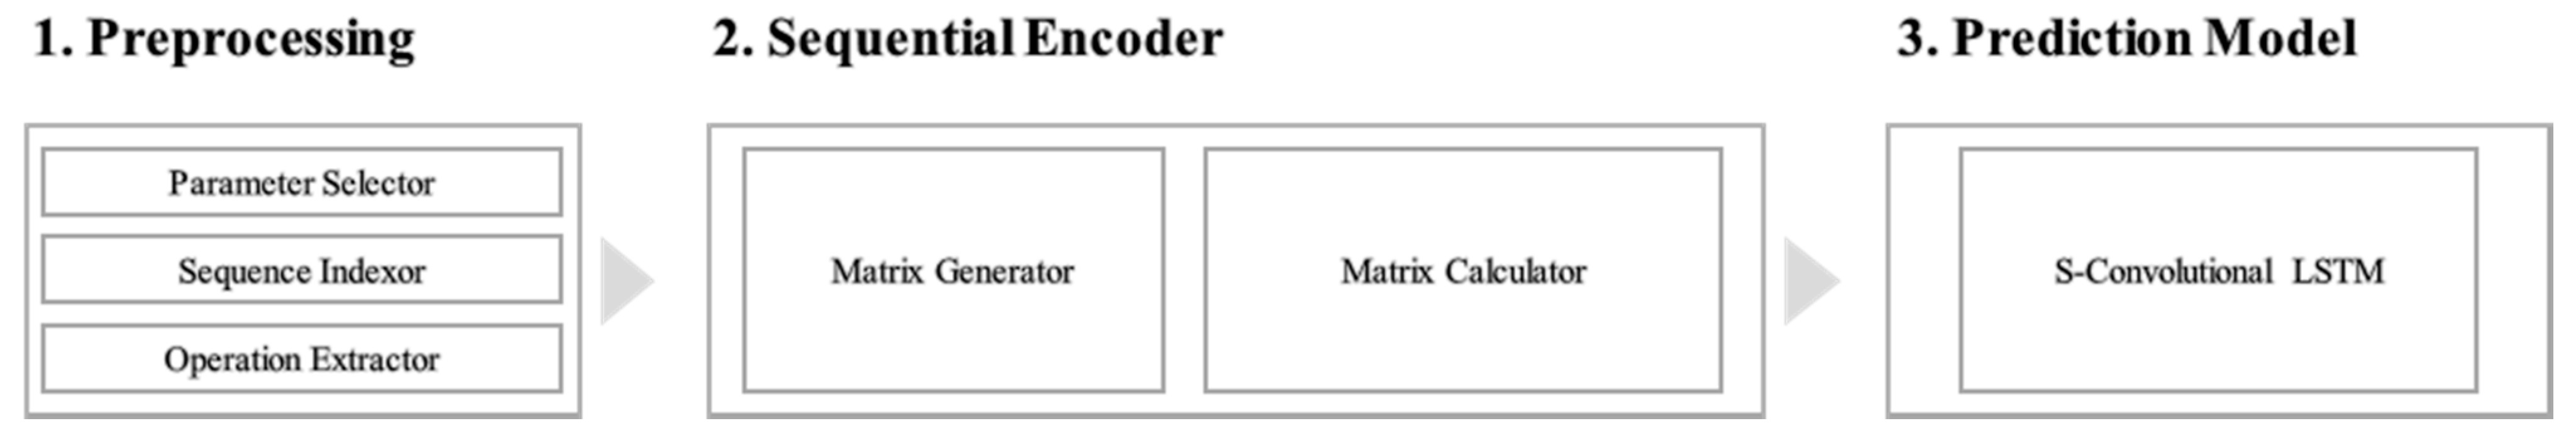
Figure 4 is the overall flow of proposed idea. The proposed method consists of three steps and components of each stage and detailed explanation are as follows.
- (1)
- Data preprocessing: Active operation data are extracted from raw data and noise is removed from the sensor data. Raw data are split into individual operations.
- (2)
- Sequential encoder: Individual operations are converted into two matrices, an adjacent matrix and a feature matrix. Operation sequence data are used for the adjacent matrix, and sensor data are used for the feature matrices. Each feature matrix reflects a single-sensor attribute. Sequential feature matrices are derived by dividing the adjacent matrix by the feature matrix.
- (3)
- Prediction model (s-convLSTM): Sequential feature matrices are distributed and input over n-channels. The prediction model consists of a convolutional layer and an LSTM layer [27]. After the prediction is complete, the model exports the residual life of the induction furnace. In the field application, the manager is able to plan the optimal maintenance schedule by using this prognosis results. These actions keep the system healthy. As an application in the field, the manager can easily plan the optimal maintenance schedule by using the prognosis results. These processes can help the manager keep track of the system’s health. A further explanation of the methodology is as follows.
3.1. Data Preprocessing
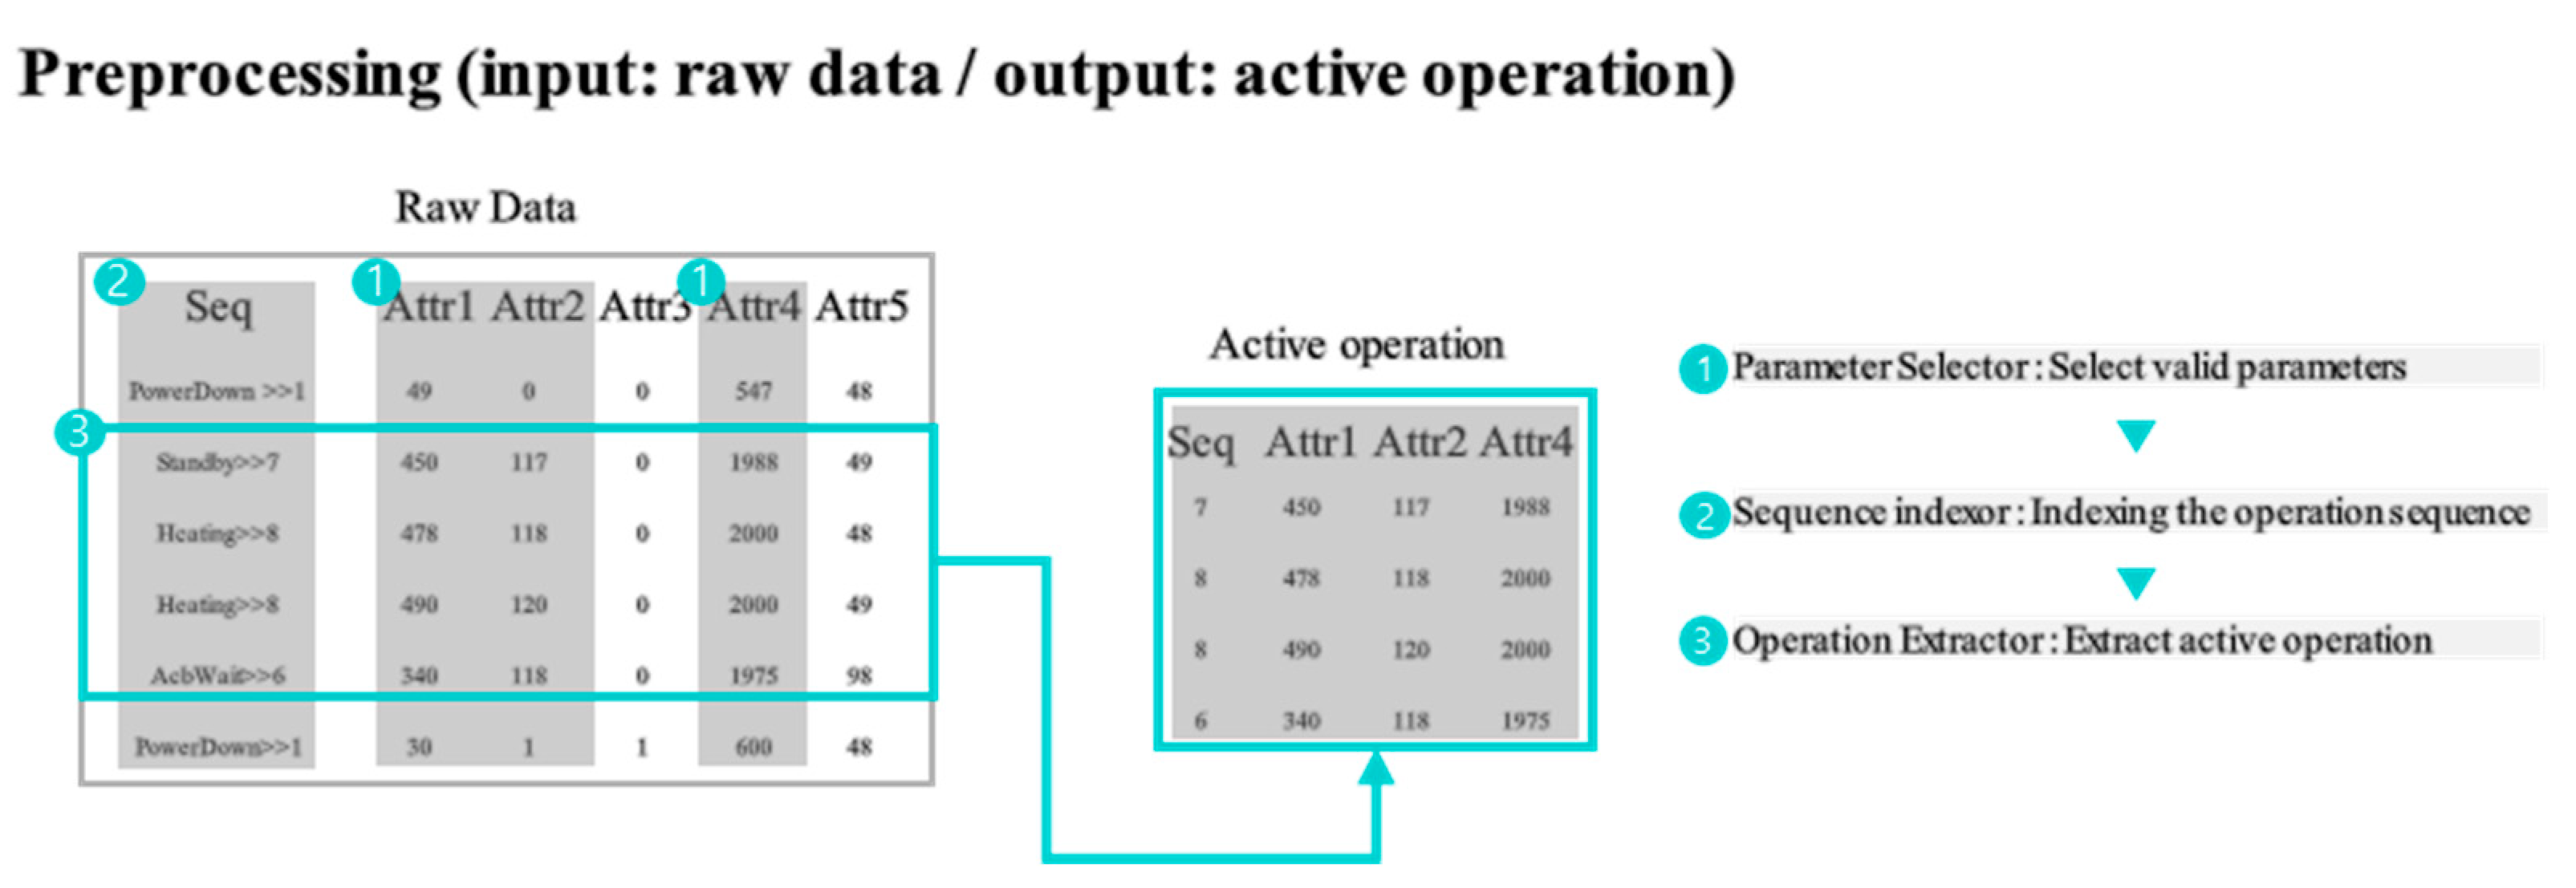
Preprocessing is the process of removing noise from raw data and separating the operation. Induction furnaces generate noise while receiving electricity and noise generated during an operation. The noise removal and extraction of operational data are mandatory. Figure 5 illustrated the procedure of the preprocessing. The preprocessing contains the following procedures: (1) parameter selection, (2) sequence indexing, and (3) operation extraction. The detailed explanations are as follows:
- (1)
- Parameter selection: Valid furnace parameters were selected. To select the valid parameters, we considered the patterns and correlations of the data. The raw data scheme is described in Table 3.
The raw data included invalid or similar parameters. Excluding the time and sequence, the following figure shows four sensor attributes: (1) voltage (D04, D05, D08, and D24), (2) power or current (D03, D12, D22, and D25), (3) output (D26 and D27), and (4) other attributes (D23, frequency; and D30, heating time). Each category (except frequency and heating time) showed a high correlation in their group. Considering the correlation in the category, we removed duplicate parameters in each group and selected valid parameters. The selected parameters are as follows: D03, D08, D23, D26, D27, and D30, as displayed in Figure 6.
- (2)
- Sequence Indexing: The operation sequence was indexed, and the operation sequence was recorded in a text format. For further processing, the operation sequence was changed to a numerical form. Table 4 is the index of the event sequence:
We determined the conditions that existed at the start or end of the operation by referring to the frequency pattern and event sequence. Usually, a particular combination of event sequences was recorded (e.g., start: 1-2-7, 1-6-7). The index of the data that starts and ends the operation was saved from the raw data. This index counts and delimits individual operations.
- (3)
- Operation Extraction: An operation was extracted from raw data using frequency and event sequences. The event sequence was the separator between the active and standby. The frequency reflected the operating state of the furnace. By using the frequency pattern, we could distinguish between maintenance and operation. The extracting algorithm starts with event indexing. After extraction, the noise was removed from the operation. Noise removal after separation was due to the loss of the delimiting point during removal. After the preprocessing step, individual operations are prepared without noise.
3.2. Sequential Encoder
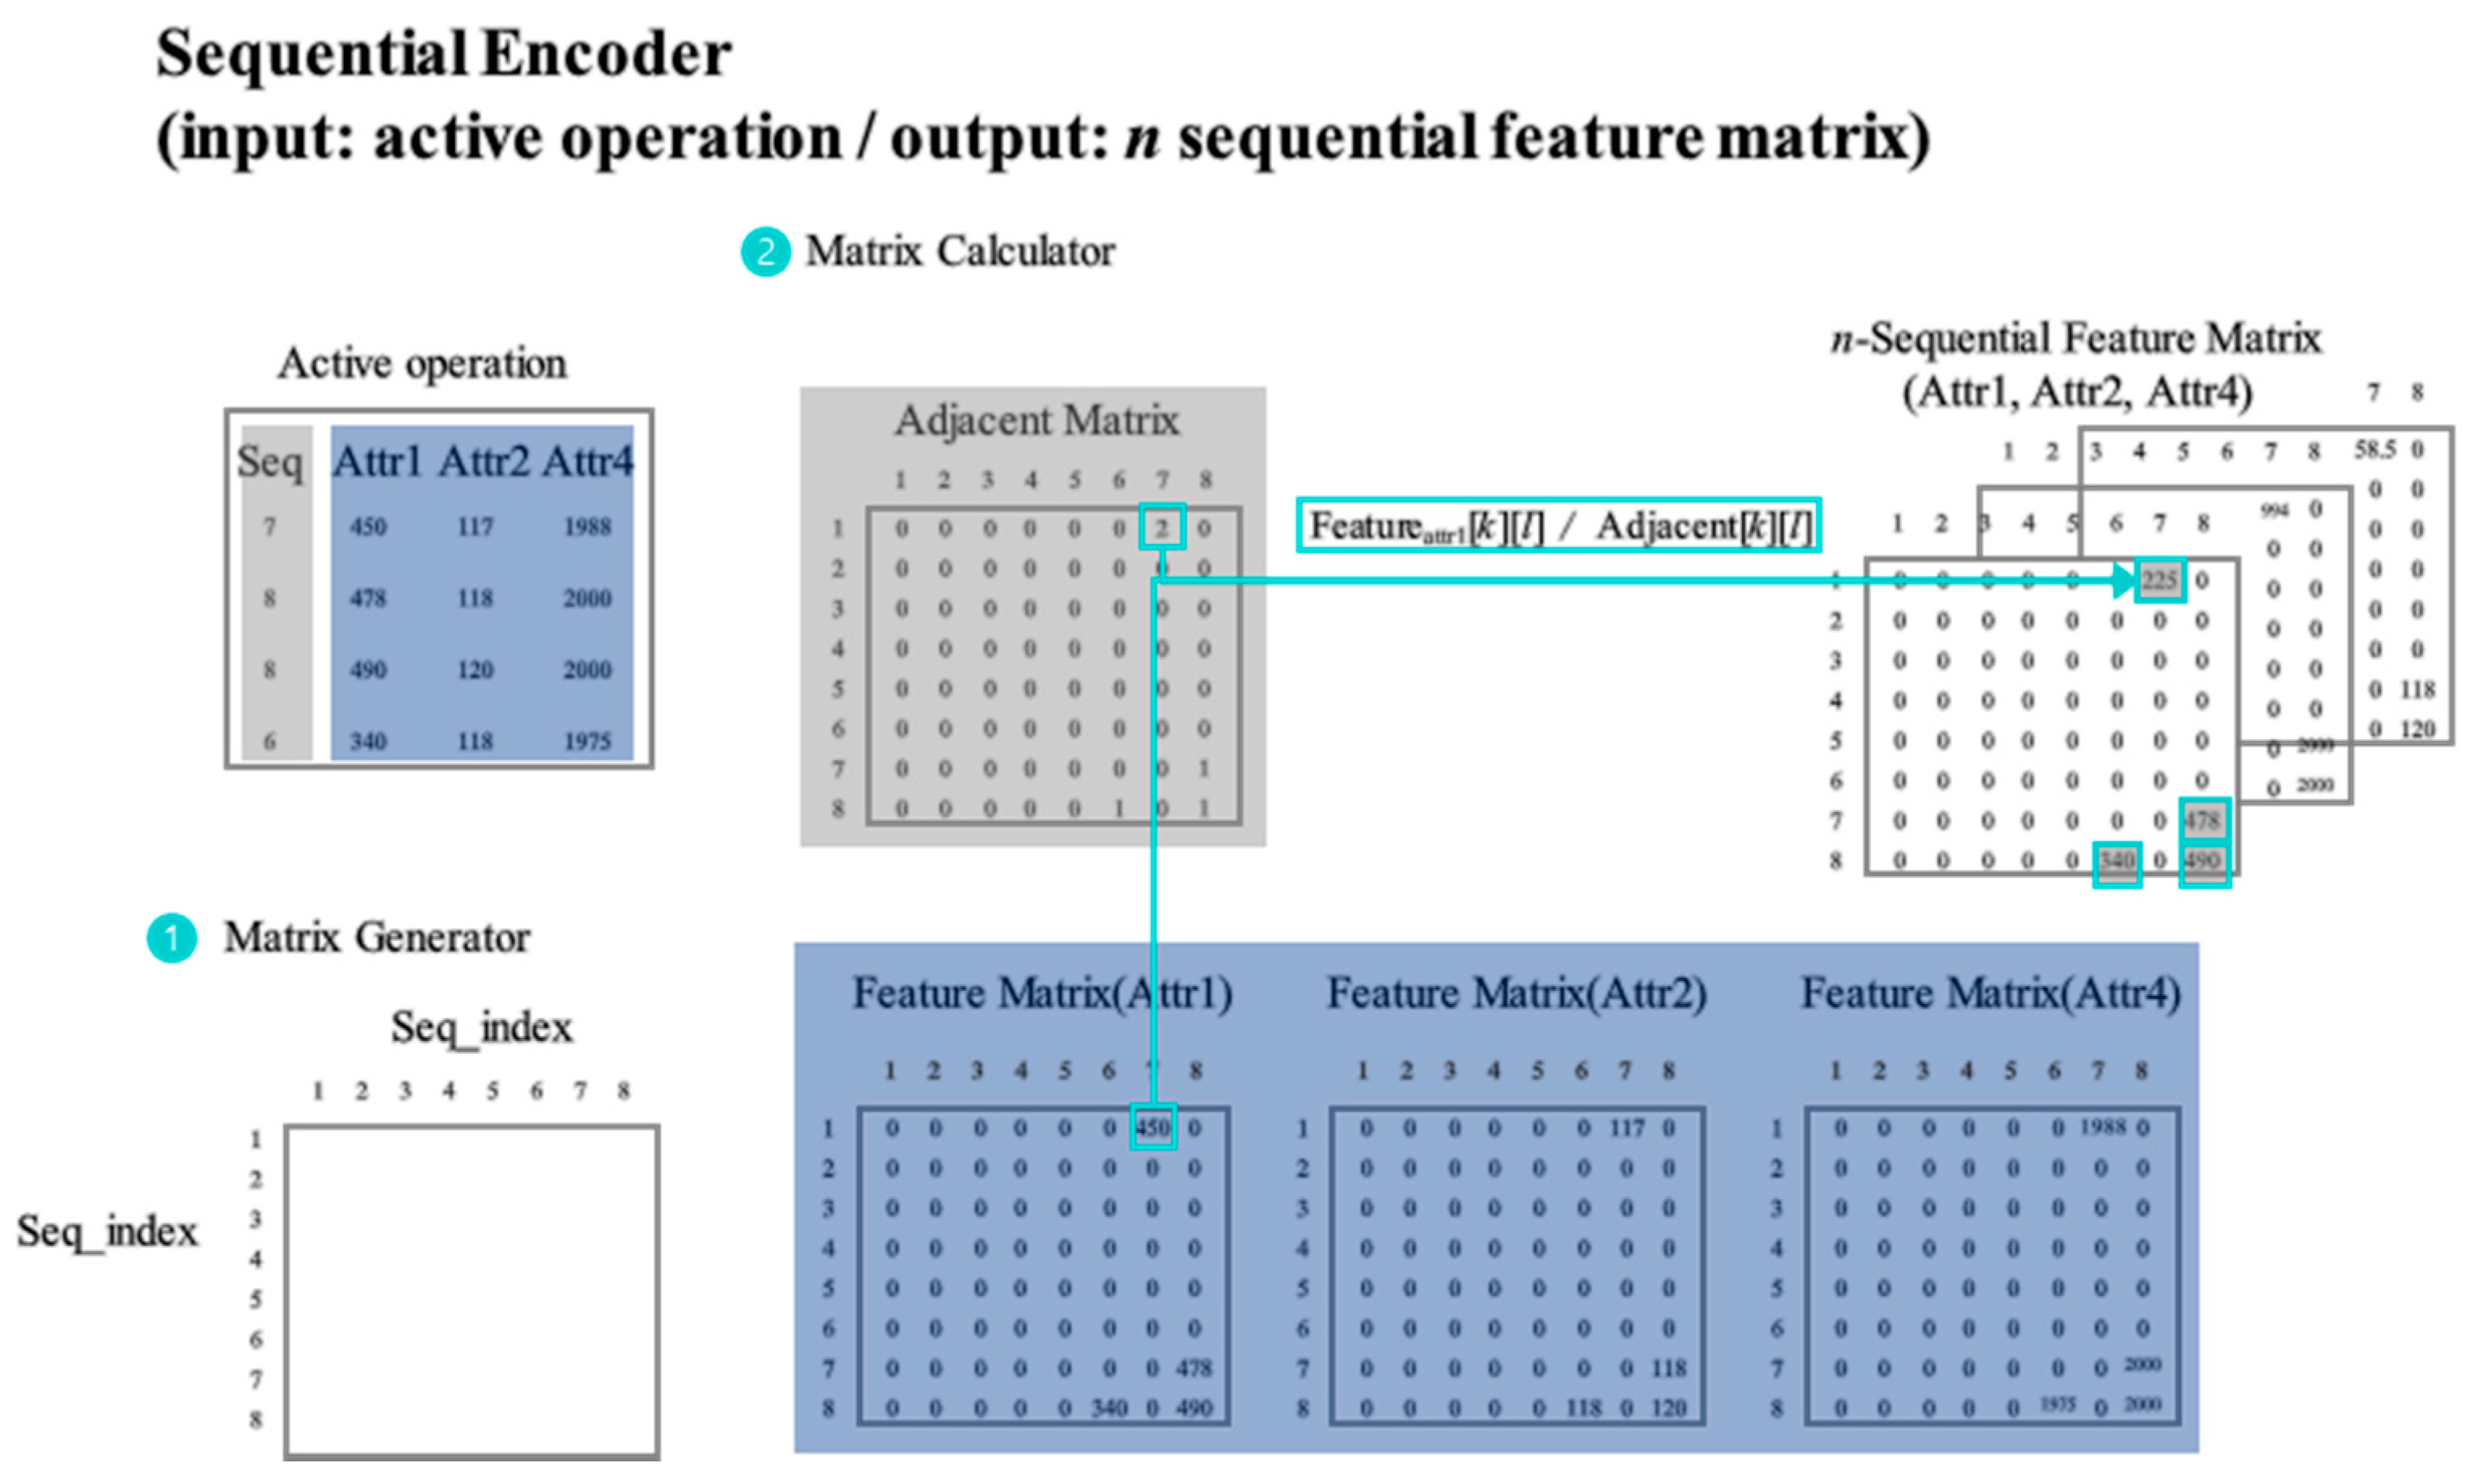
During the preprocessing process, individual operations have different lengths and values. Therefore, it is not possible to generalize and use them as an input of the neural network. In this paper, we propose a sequential encoder and data structure, so called sequential feature matrix, that can deliver an individual operation value without loss. The sequential feature matrix is a 2D form of n attributes.
In the Figure 7, the sequential encoder consists of three parts. First is active operation for input data. Second is matrix generator. And third is matrix calculator. The conversion procedure is as follows: First, the matrix generator defines the matrix size. The number of operational events defines the size of the matrix. Second, the matrix calculator calculates the adjacent and feature matrices and derives the sequential feature matrix. In the operational data, the sequence is converted into an adjacent matrix, and the other attributes are converted into feature matrices based on the adjacent matrix. The sequential feature matrices obtained through this process reflect both the length and attribute values of each operation and attribute. Third, the adjacent matrix and feature matrix are divided. The pseudo-code for the matrix conversion is as follows:
Through Algorithm 1, we could contain multiple attribute features in each sequential feature matrix. After this step, N sequential feature matrices were generated for each operation.
| Algorithm 1. SequencialEncoder |
| Input: dataset O{E, SN} (E, operation sequence data; S, sensor data; I, number of operation data; N, number of sensor attribute), matrix Z[D][D] (NULL matrix with size D × D) Output : matrix SFN[D][D](sequential feature matrix with N channel) FOR n := 1 TO N DO SFn := Z FOR i :=1 TO I-1 DO ADZn := Z FEAn := Z IF E [i] = E[i+1] THEN SP := E[i] ADZn [SP][SP] := ADZn [SP][SP] +1 FEAn [SP][SP] := FEAn [SP][SP] + Sn [i] ELSE SP :=E[i] EP :=E[i+1] ADZn [SP][EP] := ADZn [SP][EP] +1 FEAn [SP][EP] := FEAn [SP][EP] + Sn [i] FOR k :=1 TO D DO FOR l :=1 TO D DO SFn [k][l] := FEAn [k][l]/ADZn [k][l] END FOR END FOR END FOR END FOR Return SFN |
3.3. Prediction Model and Neural Network Layer
In the Figure 8, the prediction model is configured with two types of layers: a CNN and LSTM. The CNN converts a multi-channel sequential feature matrix into a feature map, and the LSTM enables a prediction through the feature map. The descriptions of each layer and the prediction model are as follows:
3.3.1. LSTM Layer
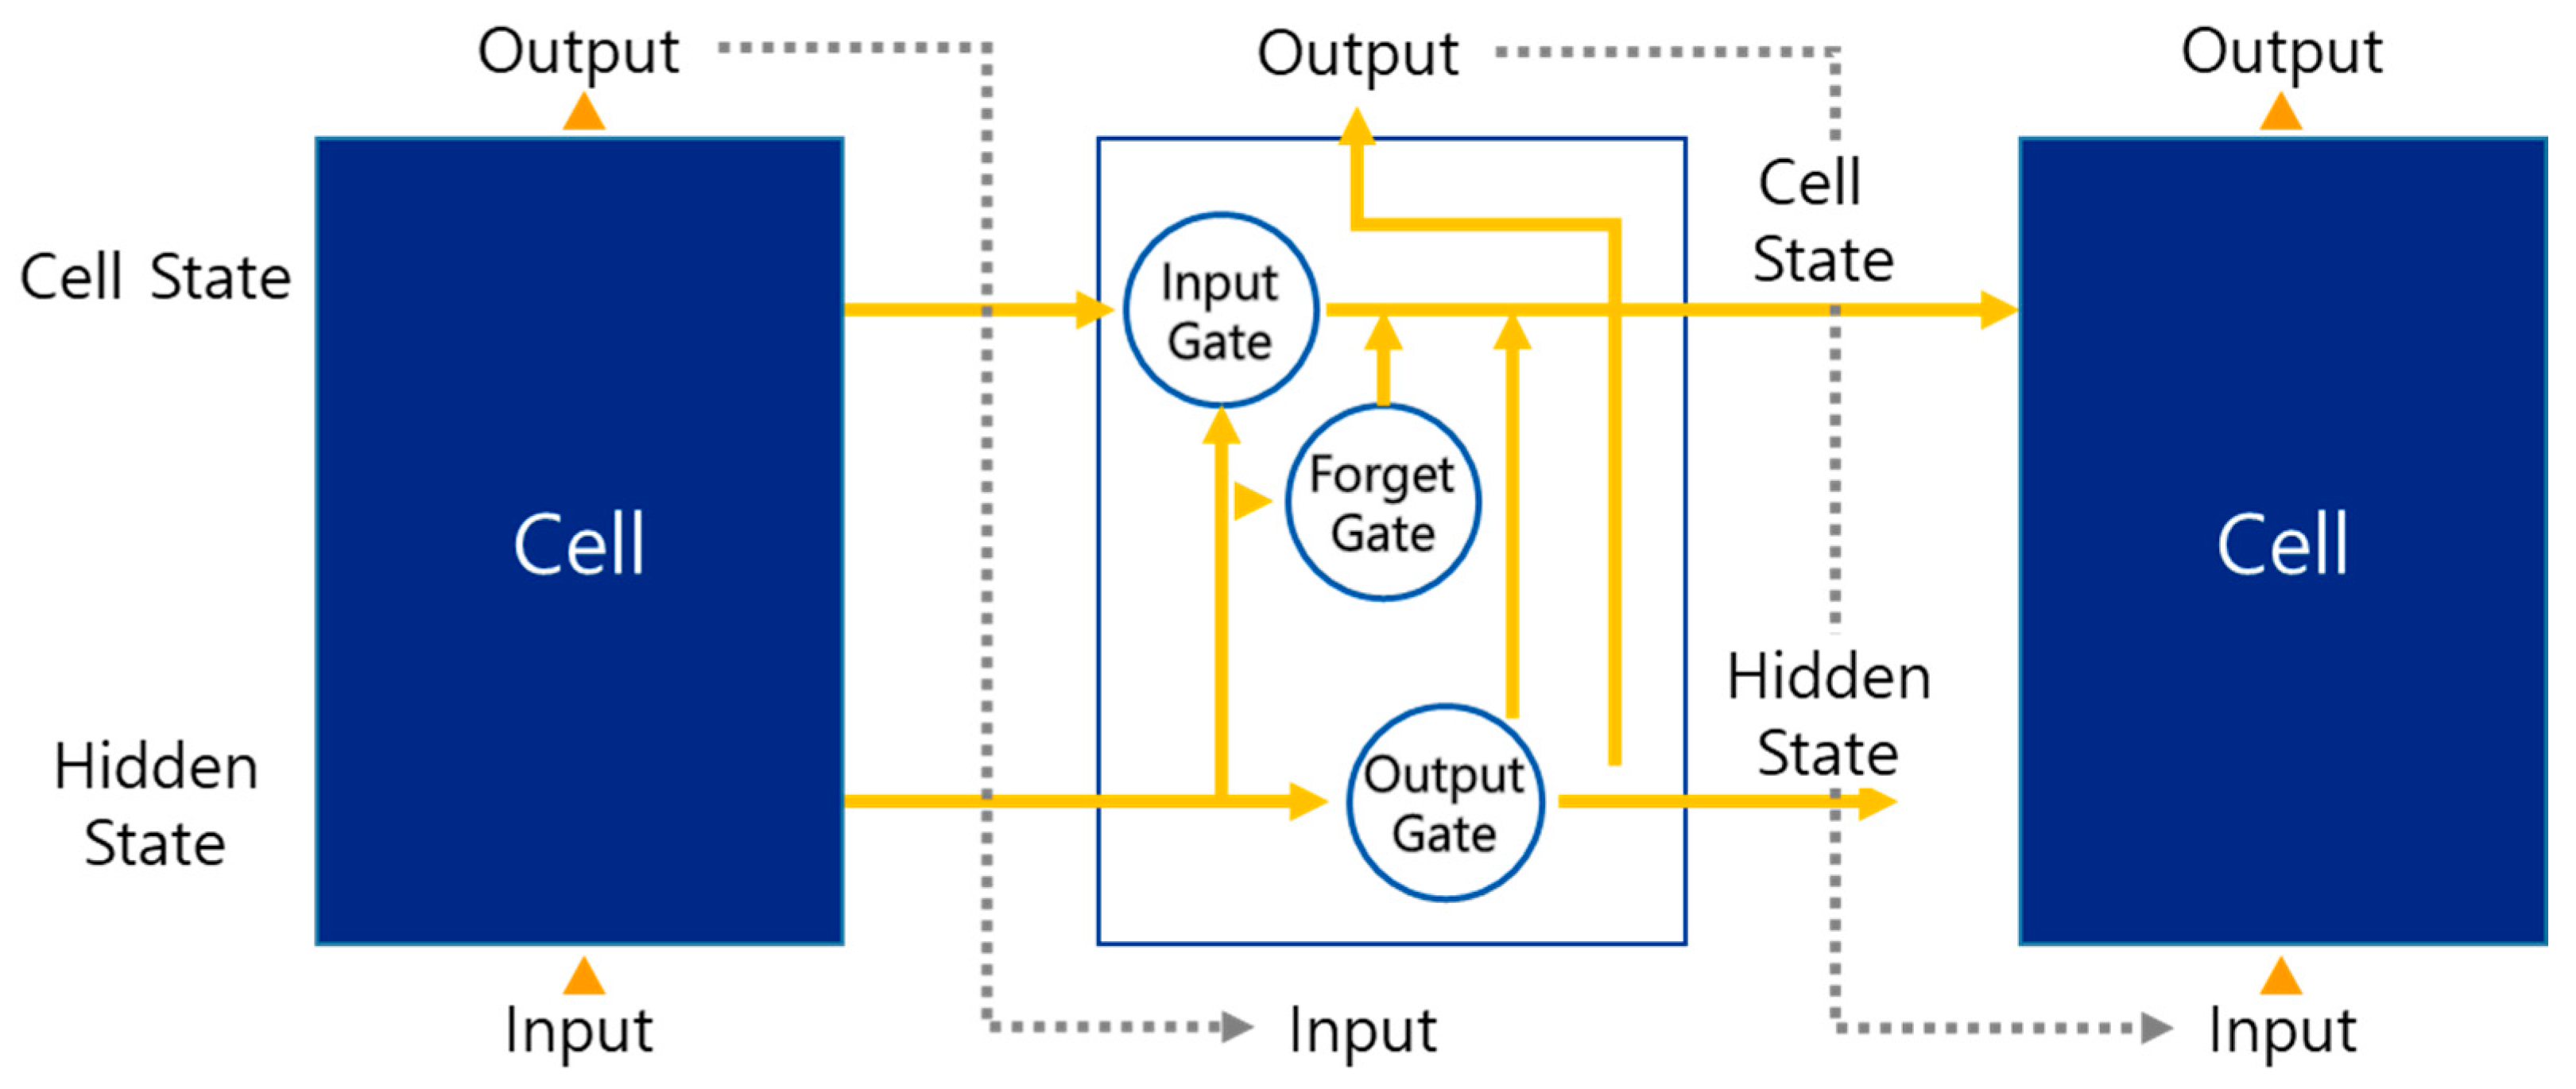
LSTM is a type of recurrent neural network (RNN) [28]. Introduced by Hopfield [29], an RNN is a neural network architecture that primarily deals with sequential data, including time-series data. The distinctive feature of an RNN from feedforward neural networks is the loop in the layer. This makes the RNN memorize previous data while training. Continuous multiplication in an RNN causes gradient vanishing problems [30]. To solve this problem, an LSTM was developed. The LSTM layer generates feedback through a sum operation, and solves the gradient vanishing problem [30]. The general structure of the LSTM is shown in Figure 9.
The LSTM layer consists of a memory block and three gates (input, output, and forget). In the Figure 9, the forget gate decides whether to forget the cell state. The input gate decides whether to update the input to the cell state. Finally, the output gate determines whether the cell state is added to the hidden state. In this study, the LSTM layer received concatenated operation features from the convolutional layer and predicted the residual life of the furnace.
3.3.2. Convolutional Layer
A convolutional neural network (CNN) is a neural network that is mainly used for image processing. It was first proposed by LeCun et al. in 1989 [31] and defined in LeCun et al., 1998 [32], as the current widely known form. A CNN consists mostly of three types of layers: convolution, pooling, and multilayer perceptron [33]. Convolution operations refer to the output of images or matrices with the height and width multiplied by each image and kernel value, moving by stride to a specific size kernel. A feature map is derived from a convolution operation. When this feature map passes through the activation function, this combination is called the convolution layer. The pooling layer down-samples the size of the feature map created in the convolution operation. In general, a convolutional neural network consists of combining the convolution and pooling layers, and the prediction is then performed using a multi-layer perceptron with a down-sampled feature map. In our prediction model, the convolutional layer converted individual operations into feature maps and down-samples the multi-channel sensor data.
3.3.3. Prediction Model
In this study, time-series predictions were conducted using a 2D matrix. Two methods of the convolutional LSTM approach were considered. One was developed by Donahue et al. [27], and is the so-called long-term recurrent convolution (LRCN). For the second, Xingjian et al. [34] inserted a convolution operation in the LSTM gate operation. If we adapt the Xingjian approach to our data, the model output is then not interpreted for labeling because of the inconsistency of the data. In our study, we used the LRCN approach. Similar to the LRCN approach, a CNN layer was inserted in front of the LSTM layer to process 2D data with multiple channels, and the feature map was input into the LSTM layer. Batch normalization was applied and dropout layers were inserted between LSTM layers. Adam was used as the optimizer. The configuration of the prediction model is described in the Figure 10:
4. Experiment
The computing environment was Windows 10 run on a GTX2070 GPU and Python 3.7. The neural network models were configured using the Keras.R framework. The experiment used data generated during a production period of approximately 24 months from October 2017 to September 2019 in a 3000-kW powered induction melting furnace. The raw data of the induction furnace were generated three times per second. The data included 181 production and 13 maintenance cycles. Among these data, incomplete maintenance cycles were excluded (three maintenance cycles). The dataset is divided into three parts: 70% of the data as a training set, 15% as a validation set, and 15% as a test set. Each experiment dataset is configured randomly. The sequential feature matrix had a size of 8 × 8, with 6 channels. The noise was filtered out from the 5th to 95th percentiles.
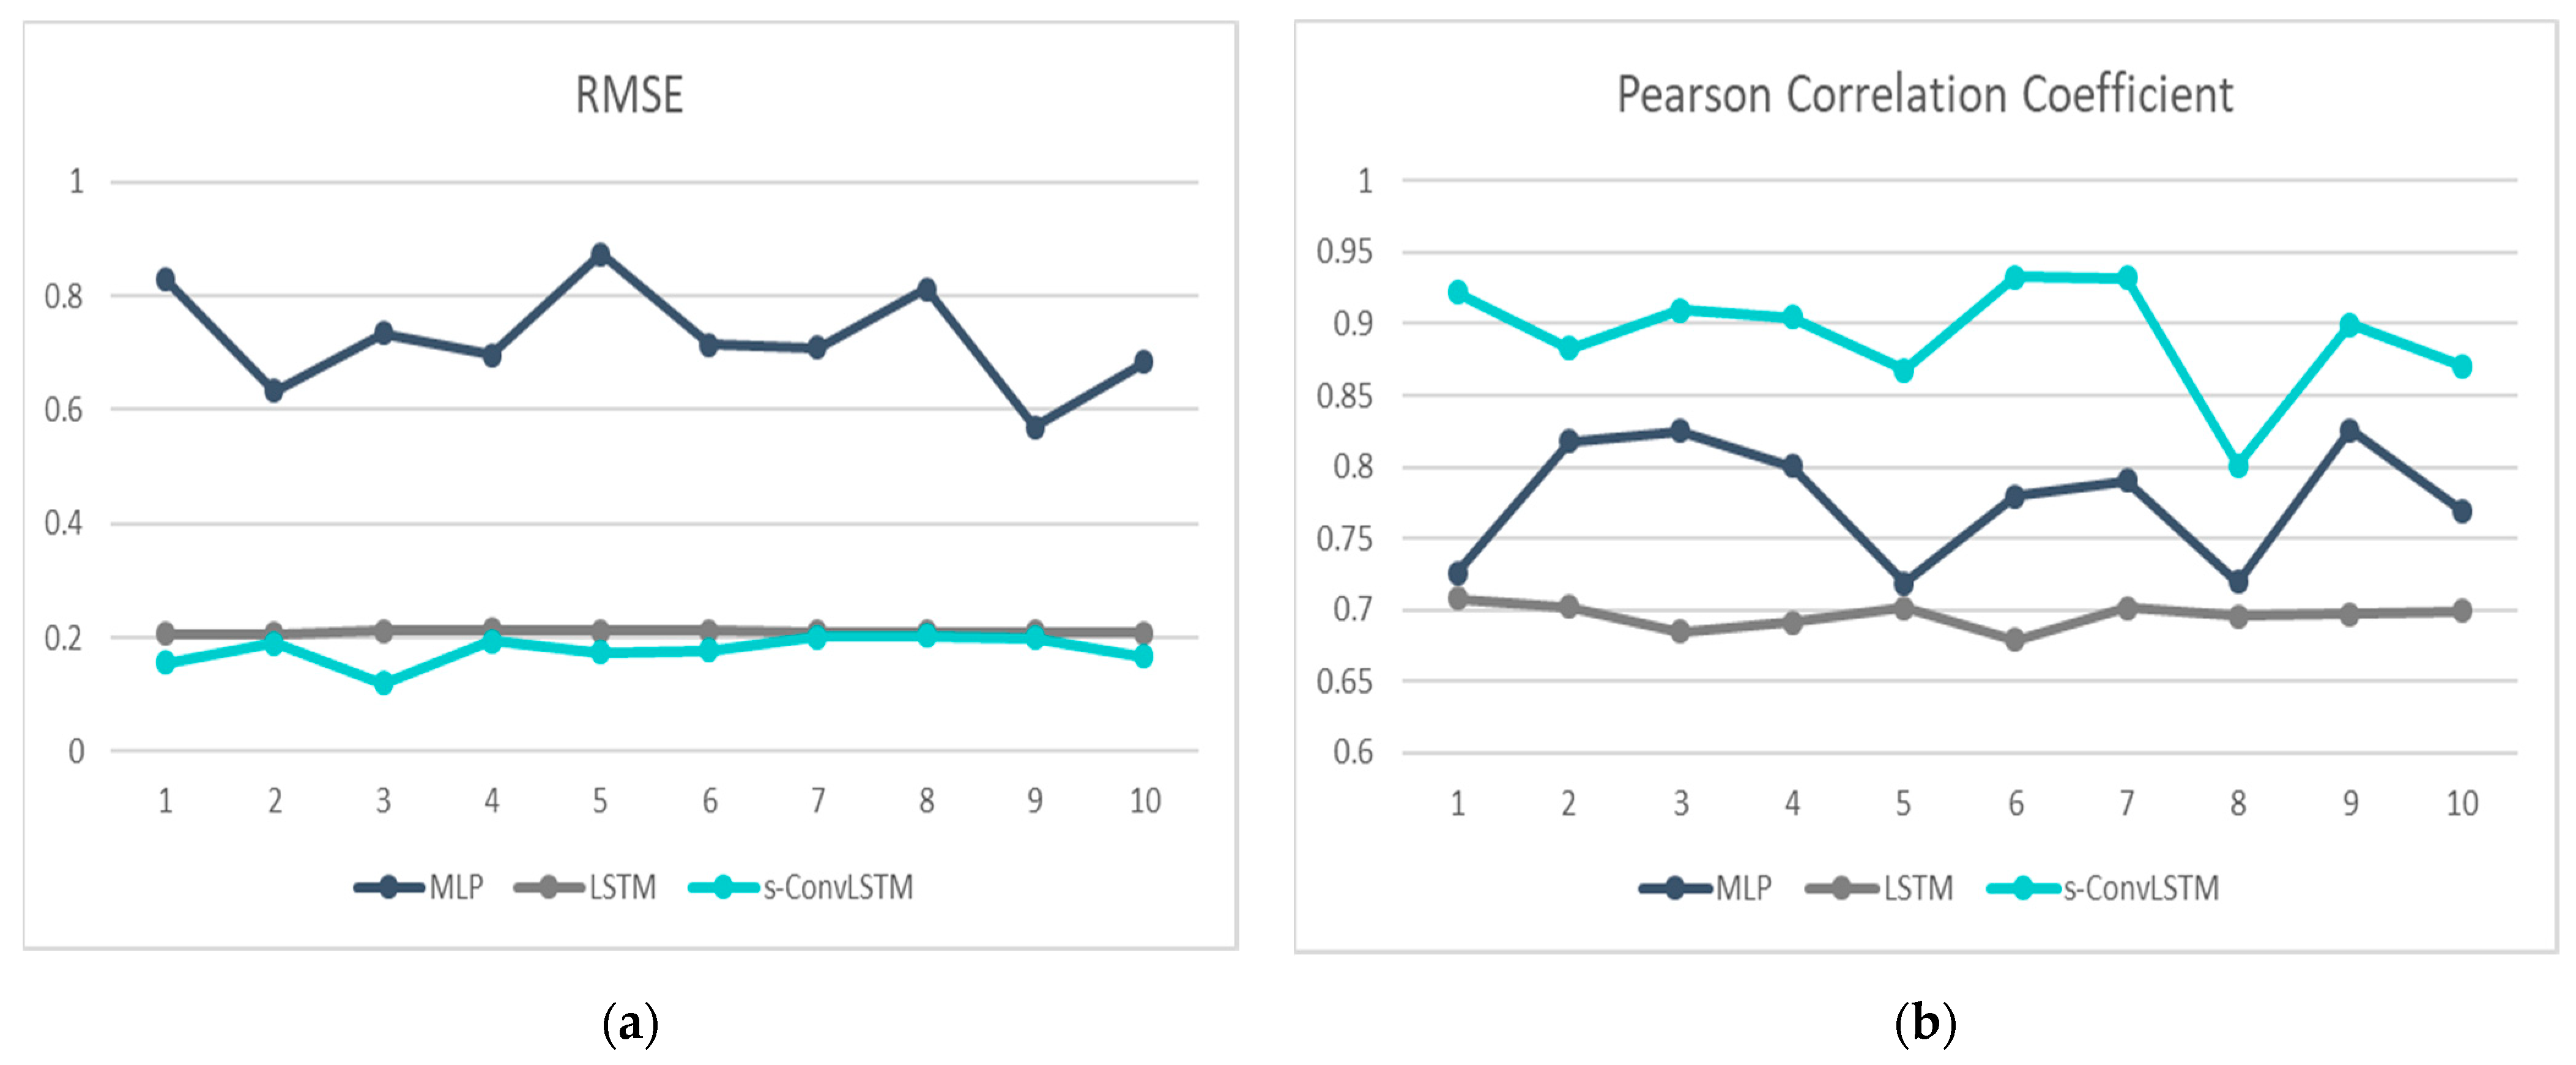
For the model evaluation, the root-mean-square error (RMSE) and Pearson’s correlation coefficient (PCC) were used to check the neural network performance (Table 5 and Table 6). The experiment compared three methodologies: a multi-layer perceptron model, an LSTM model, and a sequential feature convolution-LSTM. The first and second models use the representative values of each operation referred to from our previous study [8]. The representative value captures the third quantile from each operation. The experiments were repeated 10 times. The experimental results are as follows:
RMSE is a measure of the difference between the actual and predicted values [35]. From the results table, the mean value of the proposed method was the lowest among the three neural network models. The LSTM is slightly inferior to the proposed method. MLP achieved the highest RMSE. Regardless of the RMSE, the standard deviation was minimal in the LSTM model.
PCC represents the tendency between the actual and predicted values. The higher the PCC value, the better the performance of the neural network. The proposed methodology performed best, on average, followed by MLP and LSTM. In summary, although the proposed methodology showed the best performance, on average, for both RMSE and PCC, but the LSTM on the standard deviation showed marginal or better results. The following is a graph of the result table. In the Figure 11, s-convLSTM shows best performance for both metrics.
5. Discussion
In this study, the performance of the proposed methodology was validated experimentally to predict the maintenance points based on data generated from a 3000-kW scale induction furnace. The proposed method showed a good performance based on the experiment results, and we validated that the accuracy of the proposed methodology was valid for both metrics (RMSE and PCC). There are two discussion points: a performance transition through the input dimension and the quantity of data. The detailed contents for discussion are as follows:
First, the performance changes as the input dimension increases. In our experimental data, the individual operation had different lengths and independent values. On average, one operation was recorded daily. Therefore, the number of operations included in the data was relatively small and unique. In our previous research [8], the individual operation data were partially used. Therefore, it is difficult to enhance the performance of neural network models. Multi-sensor attributes are imported into individual channels, and the matrix changes into a structured form. This procedure increases the dimensions of the input data. Although the data are compressed by passing through a convolutional layer, the increase in dimension leads to an enhancement. A similar result was reported by Liu et al. [33]. The convolutional layer is used to compress and enhance the performance of the algorithm for multiple attributes.
The second is the algorithm performance, which depends on the number of data. The relatively small number of operations and maintenance were included in our data. In Table 5 and Table 6, the standard deviations of both metrics are relatively small. We assume that the performances of the standard deviation of the LSTM and convolutional LSTM are derived from the insufficiency. In this domain, metrics and performance changes based on the amount of data are still unknown. Thus far, there is a limit to generalizing our proposed method. It is necessary to observe the data accumulation and identify these changes through subsequent studies. Our study achieved an accurate performance through the unique data structure for the induction furnace and the proper quantity and input dimensions of the data required for our approach, which will also be addressed in our future research.
6. Conclusions
The previous maintenance method for induction furnace was based on range of leak current or inverter frequency. The maintenance activities done passively (exceed range-shut down-maintenance), without any consideration of system health. In this paper, we proposed a prognostics approach for induction furnaces by using a novel multi-channel sequential feature matrix based on a convolutional LSTM. This method varies the channels imported into a convolutional LSTM model. Individual operation sensor attributes were standardized using this procedure without loss. The proposed method showed a better performance in RMSE and PCC compared to MLP and LSTM. As a time-domain signal-based fault diagnosis method, our method is unique for using the multi-channel for multi-attribute. An independent channel provides preservation of features and structured IoT data provides the standardized form for different operations. Referring to these features, the proposed method can be used in different domains and different objects. As the utilization of scraps and special steel products increases, the use of induction furnaces will increase. It is necessary to provide data-driven approaches for the safe use of induction furnaces. The proposed method allows us to obtain a high predictive performance in environments where data are insufficient and independent.
Future studies will focus on two factors. The first is the trainless neural network model for induction furnaces. Depending on the size, the work of induction furnaces takes a long time. It is difficult to obtain a trained neural network model. A generative model for creating data or transfer learning is needed to solve this problem. Related research can accelerate a practical approach for the predictive maintenance of induction furnaces. The second is a complementary method during operation. In our case, the individual operation took 4 h on average. The proposed method showed a good performance for a complete operation. However, it does not cover ongoing operations. Research to distinguish and predict the status of ongoing studies is required. Although such research does not need to be sophisticated, it is important to improve the safety of induction furnaces through a dual configuration. Our future studies will focus on the generalized application of induction furnaces. Moreover, these will be key for the practical applications of such furnaces.
Author Contributions
Conceptualization, H.B.; methodology, Y.C.; software, H.K.; validation, Y.C., H.K. and H.B.; formal analysis, Y.C.; investigation, Y.C.; resources, D.K.; data curation, H.K.; writing—original draft preparation, Y.C.; writing—review and editing, E.L. and H.B; visualization, D.K. and Y.C.; supervision, H.B.; project administration, H.B.; funding acquisition, H.B. All authors have read and agreed to the published version of the manuscript.
Funding
This work was partly supported by a National Research Foundation of Korea (NRF) grant funded by the Korean Government (MSIT) (No. 2020R1A2C110229411) and the project titled ‘Development of IoT Infrastructure Technology for Smart Port’ funded by the Ministry of Oceans and Fisheries, Korea.
Conflicts of Interest
The authors declare no conflict of interest.
References
- Jenkins, B.; Mullinger, P. Industrial and Process Furnaces: Principles, Design and Operation, 2nd ed.; Elsevier: Amsterdam, The Netherlands, 2014; pp. 5–6. [Google Scholar]
- Karandaev, A.; Evdokimov, S.; Saribaev, A.A.; Lednov, R. Requirements to the monitoring system of ultra-high power electric arc furnace transformer performance. Russ. Internet J. Ind. Eng. 2016, 2, 58–68. [Google Scholar]
- Chen, L. A multiple linear regression prediction of concrete compressive strength based on physical properties of electric arc furnace oxidizing slag. Int. J. Appl. Sci. Eng. 2010, 7, 153–158. [Google Scholar]
- Carvalho, T.P.; Soares, F.A.; Vita, R.; Francisco, R.D.P.; Basto, J.P.; Alcalá, S.G. A systematic literature review of machine learning methods applied to predictive maintenance. Comput. Ind. Eng. 2019, 137, 106024. [Google Scholar] [CrossRef]
- Gao, Z.; Cecati, C.; Ding, S.X. A Survey of Fault Diagnosis and Fault-Tolerant Techniques—Part I: Fault Diagnosis with Model-Based and Signal-Based Approaches. IEEE Trans. Ind. Electron. 2015, 62, 3757–3767. [Google Scholar] [CrossRef] [Green Version]
- Nandi, S.; Toliyat, H.A. Fault diagnosis of electrical machines—A review. In Proceedings of the IEEE International Electric Machines and Drives Conference (IEMDC’99), Seattle, WA, USA, 9–12 May 1999; pp. 219–221. [Google Scholar] [CrossRef]
- Chong, U.P. Signal model-based fault detection and diagnosis for induction motors using features of vibration signal in two-dimension domain. Stroj. Vestn. 2011, 57, 655–666. [Google Scholar]
- Choi, Y.; Kwun, H.; Kim, D.; Lee, E.; Bae, H. Method of predictive maintenance for induction furnace based on neural network, In Proceedings of the 2020 IEEE International Conference on Big Data and Smart Computing (BigComp), Busan, Korea, 19–22 February 2020.
- Susto, G.A.; Beghi, A.; De Luca, C. A predictive maintenance system for epitaxy processes based on filtering and prediction techniques. IEEE Trans. Semicond. Manuf. 2012, 25, 638–649. [Google Scholar] [CrossRef]
- Clifton, R.H.; Clifton, R.H. Principles of Planned Maintenance; Arnold(Taylor & Fransis): London, UK, 1974. [Google Scholar]
- MaCarmen, C. An evaluation system of the setting up of predictive maintenance programmes. Reliab. Eng. Syst. Saf. 2006, 91, 945–963. [Google Scholar]
- Edwards, D.J.; Holt, G.D.; Harris, F.C. Predictive maintenance techniques and their relevance to construction plant. J. Qual. Maint. Eng. 1998, 4, 25–37. [Google Scholar] [CrossRef]
- Pandya, D.H.; Upadhyay, S.H.; Harsha, S.P. Fault diagnosis of rolling element bearing by using multinomial logistic regression and wavelet packet transform. Soft Comput. 2014, 18, 255–266. [Google Scholar] [CrossRef]
- Ahmed, R.; El Sayed, M.; Gadsden, S.A.; Tjong, J.; Habibi, S. Automotive internal-combustion-engine fault detection and classification using artificial neural network techniques. IEEE Trans. Veh. Technol. 2015, 64, 21–33. [Google Scholar] [CrossRef]
- Biswal, S.; Jithin, D.G.; Sabareesh, G.R. Fault size estimation using vibration signatures in a wind turbine test-rig. Procedia Eng. 2016, 144, 305–311. [Google Scholar] [CrossRef]
- Balabanov, T.; Hadjiski, M.; Koprinkova-Hristova, P.; Beloreshki, S.; Doukovska, L. Neural network model of mill-fan system elements vibration for predictive maintenance. In Proceedings of the 2011 International Symposium on Innovations in Intelligent Systems and Applications, Istanbul, Turkey, 15–18 June 2011; pp. 410–414. [Google Scholar] [CrossRef]
- Rapur, J.S.; Tiwari, R. On-line time domain vibration and current signals based multi-fault diagnosis of centrifugal pumps using support vector machines. J. Nondestruct. Eval. 2019, 38, 6. [Google Scholar] [CrossRef]
- Zhong, J.; Yang, Z.; Wong, S.F. Machine condition monitoring and fault diagnosis based on support vector machine. In Proceedings of the 2010 IEEE International Conference on Industrial Engineering and Engineering Management, Macao, China, 7–10 December 2010; pp. 2228–2233. [Google Scholar] [CrossRef]
- Zhao, R.; Yan, R.; Wang, J.; Mao, K. Learning to monitor machine health with convolutional bi-directional LSTM networks. Sensors 2017, 17, 273. [Google Scholar] [CrossRef] [PubMed]
- Wen, L.; Li, X.; Gao, L.; Zhang, Y. A new convolutional neural network-based data-driven fault diagnosis method. IEEE Trans. Ind. Electron. 2018, 65, 5990–5998. [Google Scholar] [CrossRef]
- Li, H.; Parikh, D.; He, Q.; Qian, B.; Li, Z.; Fang, D.; Hampapur, A. Improving rail network velocity: A machine learning approach to predictive maintenance. Transp. Res. Part C Emerg. Technol. 2014, 45, 17–26. [Google Scholar] [CrossRef]
- Susto, G.A.; Schirru, A.; Pampuri, S.; McLoone, S.; Beghi, A. Machine learning for predictive maintenance: A multiple classifier approach. IEEE Trans. Ind. Inf. 2015, 11, 812–820. [Google Scholar] [CrossRef] [Green Version]
- Hu, H.; Tang, B.; Gong, X.; Wei, W.; Wang, H. Intelligent fault diagnosis of the high-speed train with big data based on deep neural networks. IEEE Trans. Ind. Inf. 2017, 13, 2106–2116. [Google Scholar] [CrossRef]
- Miao, H.; Li, B.; Sun, C.; Liu, J. Joint learning of degradation assessment and RUL prediction for aeroengines via dual-task deep LSTM networks. IEEE Trans. Ind. Inf. 2019, 15, 5023–5032. [Google Scholar] [CrossRef]
- Kulkarni, K.; Devi, U.; Sirighee, A.; Hazra, J.; Rao, P. Predictive maintenance for supermarket refrigeration systems using only case temperature data. In Proceedings of the 2018 Annual American Control Conference (ACC), Milwaukee, WI, USA, 27–29 June 2018; pp. 4640–4645. [Google Scholar] [CrossRef]
- Christer, A.H.; Wang, W.; Sharp, J.M. A state space condition monitoring model for furnace erosion prediction and replacement. Eur. J. Oper. Res. 1997, 101, 1–14. [Google Scholar] [CrossRef]
- Donahue, J.; Anne Hendricks, L.; Guadarrama, S.; Rohrbach, M.; Venugopalan, S.; Saenko, K.; Darrell, T. Long-term recurrent convolutional networks for visual recognition and description. In Proceedings of the IEEE Conference on Computer Vision and Pattern Recognition, Boston, MA, USA, 8–10 June 2015. [Google Scholar]
- Chung, J.; Gulcehre, C.; Cho, K.; Bengio, Y. Empirical evaluation of gated recurrent neural networks on sequence modeling. arXiv 2014, arXiv:1412.3555. [Google Scholar]
- MacKay, D.J.; Mac Kay, D.J. Information Theory, Inference and Learning Algorithms; Cambridge University Press: Cambridge, MA, USA, 2003. [Google Scholar]
- Hochreiter, S. The vanishing gradient problem during learning recurrent neural nets and problem solutions. Int. J. Uncertain. Fuzziness Knowl. Based Syst. 1998, 6, 107–116. [Google Scholar] [CrossRef] [Green Version]
- LeCun, Y.; Boser, B.; Denker, J.S.; Henderson, D.; Howard, R.E.; Hubbard, W.; Jackel, L.D. Backpropagation applied to handwritten zip code recognition. Neural Comput. 1989, 1, 541–551. [Google Scholar] [CrossRef]
- LeCun, Y.; Bottou, L.; Bengio, Y.; Haffner, P. Gradient-based learning applied to document recognition. Proc. IEEE 1998, 86, 2278–2324. [Google Scholar] [CrossRef] [Green Version]
- Liu, C.L.; Hsaio, W.H.; Tu, Y.C. Time series classification with multivariate convolutional neural network. IEEE Trans. Ind. Electron. 2018, 66, 4788–4797. [Google Scholar] [CrossRef]
- Shi, X.; Chen, Z.; Wang, H.; Yeung, D.Y.; Wong, W.K.; Woo, W.C. Convolutional LSTM network: A machine learning approach for precipitation nowcasting. arXiv 2015, arXiv:1506.04214. [Google Scholar]
- Hogg, R.V.; McKean, J.; Craig, A.T. Introduction to Mathematical Statistics, 6th ed.; Pearson Education: Upper Saddle River, NJ, USA, 2005; p. 119. [Google Scholar]
Figure 1.
Electrical flow of induction furnace.

Figure 2.
Schematic of induction furnace.

Figure 3.
Process diagram of the maintenance cycle.

Figure 4.
Overall flow of proposed idea.

Figure 5.
Data preprocessing procedure and I/O.

Figure 6.
Pattern of available parameters and selected parameters (blue).

Figure 7.
Sequential encoder and I/O.

Figure 8.
Proposed model configuration and I/O.

Figure 9.
LSTM and memory block structure.

Figure 10.
Prediction model layer configuration.

Figure 11.
Graph of experiment: (a) RMSE of prediction models and (b) Pearson’s correlation coefficient.
Figure 11.
Graph of experiment: (a) RMSE of prediction models and (b) Pearson’s correlation coefficient.


Table 1.
Furnace heat sources.
| Heat Source | Description | Operation | Raw Materials | Form Factor | Example |
|---|---|---|---|---|---|
| Chemical | Melt metal by the combustion process | Continuous | Ores, coke, flux | Vertical shaft | Blasting furnace |
| Electrical | Melt metal by electricity | Discrete | Scrapped metal | Large cylinder | EAF, Induction furnace |
Note: EAF, electric arc furnace.
Table 2.
Summary of exiting methods for predictive maintenance.
| Object Type | Object | Type of Input Data | Methodology | Reference |
|---|---|---|---|---|
| Mechanical component | Bearing | Vibration | Logistic Regression | Pandya et al., 2014 [13] |
| Engine | Vibration | ANN | Ahmed et al., 2015 [14] | |
| Turbine | Vibration | ANN | Biswal et al., 2016 [15] | |
| Fan | Vibration | Echo State Network | Balabanov et al., 2011 [16] | |
| Pump | Vibration, motor line data | SVM | Rapur et al., 2019 [17] | |
| Gearbox | Vibration | SVM | Zhong et al., 2010 [18] | |
| CNC milling machine | Force, vibration, directions | CNN+Bi-LSTM | Zhao et al., 2017 [19] | |
| Pump, motor bearing, pump | Grey imaged signal | CNN | Wen et al., 2018 [20] | |
| Systematic component | Rail Network | Historical data Maintenance record | SVM | Li et al., 2014 [21] |
| High-speed train system | Fault information of bogies | DNN | Hexuan, et al., 2017 [23] | |
| Aeroengine | Trajectory, Operation, Fault, Life span | LSTM | Miao et al., 2019 [24] | |
| Semiconductor manufacturing | Maintenance record | SVM, k-NN | Susto et al., 2015 [22] | |
| Refrigeration System | Temperature, Defrost state | Random Forest | Kulkarni et al., 2018 [25] |
Note: ANN, artificial neural network; SVM, support vector machine; DNN, deep neural network; LSTM, long short-term memory; CNN, convolutional neural network.
Table 3.
Scheme of raw data.
| Column Name | Heat Source | Description | Operation |
| D03 | Total power (current) | Converter power usage | A |
| D04 | Delta Input Voltage (A.C.) | Delta input voltage | V |
| D05 | Star Input Voltage (A.C.) | Star input voltage | V |
| D06 | Delta Input Current | Delta input current | A |
| D07 | Start Input Current | Star input current | A |
| D08 | Converter Voltage (D.C.) | Converter voltage | V |
| D12 | Commanded Inverter Power | Commanded inverter power | K.W. |
| D22 | Actual Inverter Power | Actual inverter power | K.W. |
| D23 | Frequency | Inverter frequency | Hz |
| D24 | Inverter Input Voltage (D.C.) | Inverter input voltage | V |
| D25 | Inverter Input Current | Inverter input current | A |
| D26 | Inverter Output Voltage (A.C.) | Inverter output voltage | V |
| D27 | Inverter Output Current | Inverter output current | A |
| D29 | Event Sequence | Furnace event sequence | N/A |
| D30 | Last Heating Time | Last heating time | Min |
| DT | Date Time | Recorded date and time | N/A |
Table 4.
Index of event sequence.
| Seq_index | 1 | 2 | 3 | 4 | 5 | 6 | 7 | 8 |
| Event seq | PowerDownSeq | SelfTestSeq | InterlockSeq | FaultSeq | PrechgSeq, | AcbWaitSeq | StandbySeq | HeatingSeq |
Table 5.
Experiment results (RMSE).
| Index | MLP | LSTM | s-ConvLSTM |
|---|---|---|---|
| 1 | 0.828057831 | 0.206931 | 0.156686 |
| 2 | 0.63402467 | 0.207138 | 0.190867 |
| 3 | 0.734765453 | 0.212748 | 0.120577 |
| 4 | 0.696998674 | 0.213947 | 0.194754 |
| 5 | 0.873012705 | 0.212426 | 0.173549 |
| 6 | 0.714811902 | 0.212015 | 0.177297 |
| 7 | 0.709106769 | 0.210401 | 0.200828 |
| 8 | 0.812086075 | 0.21038 | 0.20231 |
| 9 | 0.570165822 | 0.211098 | 0.199597 |
| 10 | 0.683984788 | 0.208985 | 0.166552 |
| Mean | 0.725701469 | 0.210607 | 0.178302 |
| Stdev | 0.086761715 | 0.002226 | 0.024345 |
Table 6.
Experiment results (PCC).
| Index | MLP | LSTM | s-ConvLSTM |
|---|---|---|---|
| 1 | 0.725906 | 0.708037 | 0.921909 |
| 2 | 0.817845 | 0.702439 | 0.882984 |
| 3 | 0.825011 | 0.684612 | 0.909343 |
| 4 | 0.800784 | 0.691447 | 0.904265 |
| 5 | 0.718954 | 0.701471 | 0.867883 |
| 6 | 0.779492 | 0.678868 | 0.932762 |
| 7 | 0.790403 | 0.701468 | 0.931963 |
| 8 | 0.7198 | 0.695576 | 0.801254 |
| 9 | 0.82586 | 0.69687 | 0.899124 |
| 10 | 0.769335 | 0.699486 | 0.870275 |
| Mean | 0.777339 | 0.696027 | 0.892176 |
| Stdev | 0.040523 | 0.008386 | 0.037449 |
Publisher’s Note: MDPI stays neutral with regard to jurisdictional claims in published maps and institutional affiliations. |
© 2021 by the authors. Licensee MDPI, Basel, Switzerland. This article is an open access article distributed under the terms and conditions of the Creative Commons Attribution (CC BY) license (https://creativecommons.org/licenses/by/4.0/).
Share and Cite
MDPI and ACS Style
Choi, Y.; Kwun, H.; Kim, D.; Lee, E.; Bae, H. Residual Life Prediction for Induction Furnace by Sequential Encoder with s-Convolutional LSTM. Processes 2021, 9, 1121. https://0-doi-org.brum.beds.ac.uk/10.3390/pr9071121
AMA Style
Choi Y, Kwun H, Kim D, Lee E, Bae H. Residual Life Prediction for Induction Furnace by Sequential Encoder with s-Convolutional LSTM. Processes. 2021; 9(7):1121. https://0-doi-org.brum.beds.ac.uk/10.3390/pr9071121
Chicago/Turabian StyleChoi, Yulim, Hyeonho Kwun, Dohee Kim, Eunju Lee, and Hyerim Bae. 2021. "Residual Life Prediction for Induction Furnace by Sequential Encoder with s-Convolutional LSTM" Processes 9, no. 7: 1121. https://0-doi-org.brum.beds.ac.uk/10.3390/pr9071121
Note that from the first issue of 2016, this journal uses article numbers instead of page numbers. See further details here.