Article

Simulation and Optimisation of Integrated Anaerobic-Aerobic Bioreactor (IAAB) for the Treatment of Palm Oil Mill Effluent

1
Department of Chemical and Environmental Engineering, Faculty of Science and Engineering, University of Nottingham Malaysia, Semenyih 43500, Selangor, Malaysia
2
Civil and Environmental Engineering Department, Centre for Urban Resource Sustainability, Institute of Self-Sustainable Building, Universiti Teknologi PETRONAS, Seri Iskandar 32610, Perak Darul Ridzuan, Malaysia
3
Faculty of Bioengineering and Technology, Universiti Malaysia Kelantan, Jeli Campus, Jeli 17600, Kelantan, Malaysia
4
Chemistry Section, School of Distance Education, Universiti Sains Malaysia, 11800 Minden, Penang, Malaysia
5
Department of Chemical Engineering, College of Engineering, Khalifa University, Abu Dhabi P. O. Box 127788, United Arab Emirates
6
Center for Catalysis and Separation (CeCaS), Khalifa University, Abu Dhabi P. O. Box 127788, United Arab Emirates
7
Department of Fundamental and Applied Sciences, HICoE-Centre for Biofuel and Biochemical Research, Institute of Self-Sustainable Building, Universiti Teknologi PETRONAS, Seri Iskandar 32610, Perak Darul Ridzuan, Malaysia
*
Author to whom correspondence should be addressed.
Submission received: 31 May 2021 / Revised: 14 June 2021 / Accepted: 16 June 2021 / Published: 28 June 2021
(This article belongs to the Special Issue Anaerobic Processes, Monitoring and Intelligence Control)

Abstract

:
This study highlights an innovative piece of hybrid technology, whereby the combination of anaerobic and aerobic processes into a single reactor, namely, the integrated anaerobic–aerobic bioreactor (IAAB) can surpass the limits of conventional methods treating palm oil mill effluent (POME). Optimisation of IAAB using SuperPro Designer V9 simulator for maximum biogas yield while addressing its economic and environmental trade-offs was conducted for the first time. Parameters such as hydraulic retention time (HRT) and organic loading rate (OLR) were optimised in the anaerobic compartment from 10 days and 6.2 g COD/L day to 9 days and 6.9 g COD/L day, respectively. Furthermore, sludge recycle ratio was optimised from 20% to 50% in the aerobic compartment. The optimisation was successful where the biogas yield increased from 0.24 to 0.29 L CH4/g CODremoved with excellent Chemical Oxygen Demand (COD), and Biological Oxygen Demand (BOD) removal efficiencies up to 99% with 5.8% lower net expenditure. This simulation results were comparable against the pre-commercialized IAAB with 11.4% increase in methane yield after optimisation. Economic analysis had proven the optimised process to be feasible, resulting in return on investment (ROI), payback time, and internal rate of return (IRR) of 24.5%, 4.1 years, and 17.9%, respectively.

Graphical Abstract

1. Introduction

To date, oil palm is one of the commodities among the third world countries and it is dominated by Malaysia, contributing to 28% of world palm oil production and 33% for world exports [1]. According to Chen et al. [2], the global population will continue to rise to 9.5 billion by year 2050 according to the medium-growth projection scenario of the United Nations. The positive response to global population growth will most likely increase the worldwide demand for food, water, and drink. Adding on, the global demand for fats and oils are estimated to rise up to 360 million tonnes by 2043 thus, the amount of palm oil mill is predicted to increase along with the consumption of lipids for global needs [1]. Every ton of crude palm oil (CPO) produced will generate 2.5–3.0 m3 of palm oil mill effluent (POME), which is known as a colloidal suspension containing 95–96% water, 0.6–0.7% oil, 4–5% total solids (TS), and 2–4% total suspended solids (TSS) [3]. The disposal of POME is one of the main problems faced by the industries since the final products will cause severe environmental issues. A study by Zaied et al. [4] stressed that untreated POME is the main cause of environmental pollution due to its characteristics to be able to dissolve easily in water, and subsequently, release suspended particles, which generates a high volume of contaminant wastes and odours after degradation process by microbes. Furthermore, POME had been reported to have high biological oxygen demand (BOD) (25,000–65,000 mg/L), chemical oxygen demand (COD) (44,300–102,696 mg/L), total solids (TS) (40,500–72,058 mg/L), and volatile solids (VS) (34,000–49,000 mg/L) [5]. Hence, an economical feasible approach for the treatment of POME to an acceptable discharge limit is a struggle for many palm oil mills.
In Malaysia, about 85% of the palm oil mills are still depending on conventional ponding biological treatment methods such as anaerobic digestion, aerobic digestion, and acidification since POME is mostly biodegradable. However, conventional anaerobic system requires long hydraulic retention time (HRT) and large area for effective treatment [6]. Moreover, the unfavourable performance of conventional ponding system for POME treatment has resulted in less economic feasibility due to several factors such as excessive organic load, low pH, and suspended solids colloidal nature in POME. In addition, conventional ponding treatment is not sustainable and environmentally friendly in the long run due to the open system that releases toxic gases, causing a greenhouse effect [7]. An improvement has been made to overcome these limitations by implementing various high-rate anaerobic bioreactors such as up-flow anaerobic sludge blanket (UASB) reactor, expanded granular sludge bed (EGSB) reactor, anaerobic baffled reactor, anaerobic sequencing batch reactor (ASBR), continuous stirred tank reactor (CSTR), and up-flow anaerobic sludge fixed-film (UASFF) reactor [8]. A study conducted by Yacob et al. [9] stressed that the experimental results obtained from these high-rate anaerobic bioreactors outperformed the conventional approach, resulting in better treatment efficiencies along with shorter HRT. However, these high-rate anaerobic bioreactors are still limited in terms of up-scaling due to high operating cost and unfavourable technological performance [10].
Originally, an anaerobic digester is utilized for the treatment of high strength organic wastes and sludge in the absence of oxygen. In fact, anaerobic degradation of organic matter is beneficial due to lower biomass concentration and increase in methane gas for the production of energy supply [11]. In addition, anaerobic digestion has proven to be low cost in terms of energy, reactor volume, and nutrient addition as compared with aerobic digestion. However, the effluent quality is not as good as compared to an aerobic system, and hence, pre-treatment with anaerobic digestion is commonly employed prior to aerobic digestion [11]. According to Vögeli et al. [12] anaerobic systems could be distinguished into two operating temperatures such, namely, mesophilic (30–40 °C) and thermophilic (45–60 °C). Temperature range below 20 °C is not suitable for anaerobic digestion as the rate of reaction for organic waste is very low [13]. Although, thermophilic digestion facilitates have a higher rate of reaction along with higher methane gas production, mesophilic digestion is more stable and requires less energy input. Nonetheless, anaerobic digestion is a complex process and time consuming as the bacteria consortia responsible for the degradation process require some time to familiarize to the new environment prior consuming organic wastes [14]. There are four stages for the anaerobic degradation process: (1st phase) Hydrolysis, (2nd phase) Acidogenesis, (3rd phase) Acetogenesis, and (4th phase) Methanogenesis. Methanogenesis is a vital step for the production of biogas which contains 60–65% methane, 30–35% carbon dioxide, 2–3% hydrogen sulphide, 1% hydrogen, and water vapour [15].
Aerobic digestion works in the presence of oxygen and widely used in treating organic wastewater and preventing the accumulation of organic matters from clarified treated effluents. The biodegradable organic matters are hydrolysed by means of heterotrophic bacteria, then produce carbon dioxide, water, and active biomass as by-products [16]. Aerobic digestion is applied in waste-activated sludge, mixtures of waste-activated sludge, trickling-filter sludge and primary sludge, or waste sludge from extended aeration plants [11]. As indicated by Lokman et al. [1], aerobic treatment process is less favoured for the treatment of POME due to limitation to handle high organic loading and requires high energy aeration in order to solubilize the organic substances. Furthermore, the POME’s BOD:N (nitrogen):P (phosphorus) ratio of 100:3:0.8 does not meet the nutrient requirements for aerobic digestion process as the minimum nutrient threshold is at a BOD:N:P ratio of 100:5:1 [11]. Even though simultaneous process of anaerobic followed by aerobic digestion can treat POME efficiently, several factors such as long HRT and vast space requirement and facilities to capture biogas are still hindering the operational efficiency [17].
A novel and innovative approach by Chan et al. [10], combining the anaerobic and aerobic process into a single reactor is called the integrated anaerobic–aerobic bioreactor (IAAB). This concept has proven to can further improve the overall degradation efficiency of POME due to low cost, optimum bacterial populations, smaller footprints, and shorter HRT, which results in overall COD, BOD, and TSS removal efficiencies of more than 99% with organic loading rate (OLR) up till 20 kg COD/m3 day along and methane yield of 0.26 L CH4/g COD removed [18]. The capability of IAAB has shown promising results and performance in terms of POME treatment and biogas production, yet it is still in its infancy where more research and study are encouraged to promote the potential of up-scaling. Therefore, the main aim of this work is to analyse the techno-economic feasibility of IAAB treatment by optimising several major parameters affecting the production of biogas such as HRT, OLR, and sludge recycle ratio. There are a few advantages of simulated optimisation process as compared with experimental-based, such as less time consumption, low cost, and high accuracy. In order to ensure a successful simulation, the IAAB treatment process was simulated using a software called SuperPro Designer V9. This software was founded by a company called “INTELLIGEN” in 1991, to commercialize computer-aided process design technology that was developed by PhD certified members in Bio/Chemical Engineering from MIT [19]. It is a software that facilitates modelling, evaluation, and optimisation of integrated processes in a wide range of industries including biological process. It is a useful tool as it provides environmental properties of the streams such as the BOD and COD values as well as the reactions kinetic models required in this study, i.e., anaerobic and aerobic digestions. This work mainly focused on the optimisation of IAAB by taking into account the system performance (BOD removal efficiency) and the trade-off between capital cost, operating cost, and revenue, while adhering to the environmental effluent discharge limit.

2. POME Treatment

2.1. IAAB (Integrated Anaerobic-Aerobic Bio-Reactor) Technology

The basic configuration of IAAB comprises of four compartments as follows, (i) anaerobic compartment, (ii) aerobic compartment, (iii) settling compartment, and (iv) treated effluent compartment. As illustrated in Figure 1, some modifications for the configuration of simulated IAAB by alternating the settling tank and the treated effluent tank with the clarification tank and granular media filtration, respectively, whereas the sludge holding tank is replaced with a centrifugation and sludge dryer. The raw POME is stored in the transfer sump to enable constant supply of POME, followed by the installation of recirculation system at the bottom of the anaerobic tank to achieve homogenous mixture. Next, biogas is collected at the top of anaerobic tank during methanogenesis reaction. Moreover, POME substrate is further digested in the aerobic tank with the presence of dissolved oxygen and subsequently overflow into the settling tank by gravity. In the clarification tank, a desired ratio of activated sludge is recirculated back into the aerobic tank, while the remaining unrecycled sludge is further dewatered in the centrifuge under gravitational force and subsequently dried prior sold as fertilizer. Lastly, the treated POME will be discharged as clean water into the environment. Further and in-depth operation of pre-commercialized IAAB can be found in Chan et al. [18].

2.2. Biogas Production

Biogas is a colourless and odourless gas which composed of methane (CH4), carbon dioxide (CO2), small amount of hydrogen sulphide (H2S), hydrogen (H2), and a trace amount of carbon monoxide (CO) and oxygen (O2) [20]. Biogas is a promising source of green energy as compared with fossil fuels, which can be utilized in daily applications such as fuels for transportation, electricity, and heat generation while mitigating the emission of greenhouse gases (GHGs) [20]. Besides, the abundance of POME has great potential for low-cost biogas production through anaerobic digestion using microorganism, especially bacteria to degrade organic matters such as carbohydrates, proteins, oil, and lipids into valuable gases such as CH4, CO2, and slurry, which can be sold as fertilizers. Nonetheless, production of biogas also results in trace amount of H2S, which must be reduced to a permissible level, generally below 200 ppm prior to usage for power generation to avoid corrosion, efficient operation, and lengthen the lifetime of biogas engines [21]. Based on Yang et al. [22], there are several possible alternatives to remove H2S from biogas such as physical, chemical, biological, and water scrubbing. Among these biogas cleaning technologies, a biological scrubber is much preferable due to lower operating cost, compact footprint, efficient H2S removal (>98%), solvent-free, and simple operation. The biological scrubber treats gaseous contaminants in an airstream by passing it through a bed of microorganisms from Thiobacillus genus that feed on the H2S molecules and other compounds, then removing them from the outlet airstream [23]. After biogas purification, a gas dehumidifier such as dryer, chiller, or cyclone are subjected for the removal of moisture from CH4 gas till below 80% relative humidity in order to maintain the engine efficiency while reducing fuel gas consumption [21].
In IAAB, the production of biogas is affected by several parameters such as temperature, solid retention time (SRT), HRT, system pH, mixed liquor volatile suspended solids (MLVSS) concentration, and OLR. The biological treatment of POME usually is performed in the absence of oxygen for the advantage of sludge reduction and biogas production [24]. HRT represents the size of the digestor, thus, lowering HRT for higher biogas production. OLR is defined as the amount of organic matter, which is measured by the COD of substrate that are treated by specific volume of digestor in particular time. OLR is related to HRT in which shorter HRT would result in a higher OLR, thus more biogas production [24]. According to Lok et al. [25], high SRT ensured a stable performance along and able to withstand shock loading and high toxicity, while low SRT enhances the flow of material, but reduces in the biogas yield. In addition, long HRT promotes longer contact duration between the microorganisms and substrates; however, larger reactor volume is required, which is subjected to higher equipment cost. Lastly, a high OLR will reduce the efficiency of COD removal.
In this design, process optimisation is mainly focusing on the anaerobic bio-reactor to generate biogas while reducing the discharge of COD and BOD based on the discharge standard of 20 mg/L [26]. Several parameters such as OLR, HRT, and sludge recycle ratio are manipulated and discussed in the latter section and thus, to determine the optimised results of biogas generation, overall POME treatment cost, and fulfilling the environmental quality regulations.

3. Simulation Methodology

The simulation for the treatment of POME using IAAB was performed by using the SuperPro Designer V9 software which is illustrated in Figure 2. The input values for the feed composition of POME in industrial scale were adopted from Lok et al. [25] (Table 1).
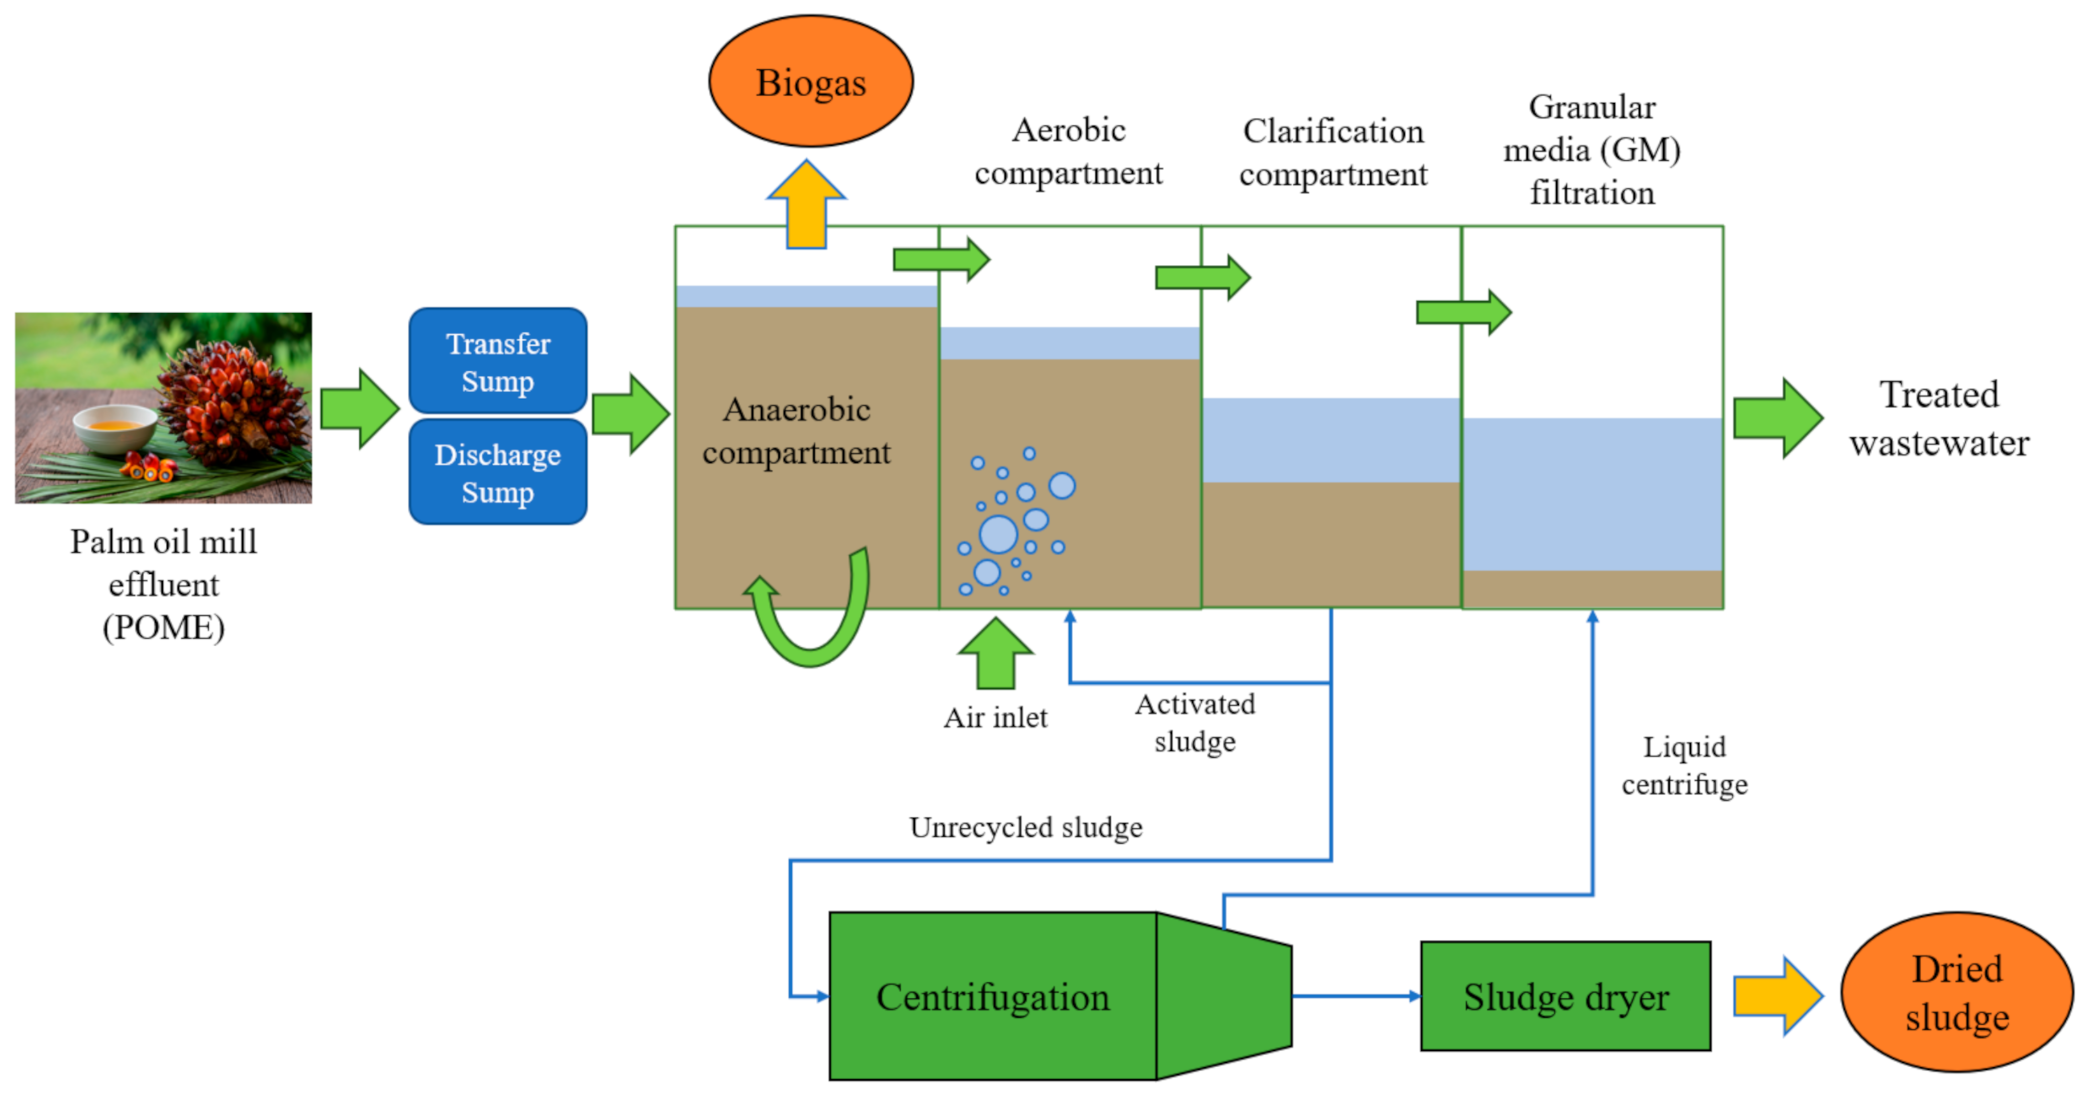
Based on the capacity of 60 ton/h of fresh fruit bunch (FFB) of a typical palm oil mill in Malaysia, and a ratio of 0.67 FFB/POME, the feed inlet is equivalent to 40,200 kg/h of POME. At the starting point of the simulation, POME with feed flowrate of 40,200 kg/h was utilized, which then generated COD and BOD of 62,488 mg/L and 39,139 mg/L, respectively (Table 1). Since SuperPro Designer V9 does not offer the unit operation for IAAB, the individual anaerobic, aerobic, and clarification tank are connected in series in order to mimic IAAB configuration. First, POME feed enters the anaerobic digestion system (AD-101) in which it undergoes a process of solubilization of organic matter in four different phases (i.e., hydrolysis, acidogenesis, acetogenesis, methanogenesis) using different microbial species. During anaerobic digestion of POME, the generation of gases such as CH4, CO2, and H2S enter the bio-trickling filter (TF-101) via a blower (M-101) for the removal of H2S. Next, O2 is constantly supplied into the bio-trickling filtration (TF-101) for the oxidation of H2S into sulphur (S), H2O, and sulphuric acid (H2SO4) as by-product (see details for oxidation process of H2S in Appendix A). Subsequently, the biogas is further treated in the chiller (HX-101) for the removal of moisture content prior utilization for power generation purposes. The moisture or water removal in the chiller is assumed to be 90% efficiency in order to comply with the desired biogas production [21].
The reaction kinetics for pilot scale and stoichiometry involved in the anaerobic and aerobic digestion systems are obtained from Yap et al. [27] (Table A2) and A Aziz et al. [20] (Table A1), respectively (see details in Appendix A). The reaction kinetics for industrial scale are determined using SuperPro Designer V9 via the trial-and-error method. This is to ensure that the simulated results could be matched to the pre-commercialised scale’s results reported by Chan et al. [18]. In the anaerobic compartment, the construction of recirculation flow (FSP-102) is connected from outlet of AD-101 back into the POME feed mixture via recirculation pump (PM-101). The purpose of POME feed recirculation being part of the design is to enhance the mixing behaviour in the anaerobic tank [10]. Furthermore, the digestate will then overflow to the aerobic digestion tank (AB-101) to further perform decomposition of POME substrate and stabilization of waste sludge. The aerobic sludge or effluent then overflow into the clarification tank (CL-101) for the separation of suspended solids. The POME substrate will settle to the bottom of the clarifier via gravitational forces. The activated sludge generated will be partially recycled back to the aerobic compartment (AB-101). The remaining IAAB effluent will be discharged at the top surface for further purification. In the clarification section, biomass and dead biomass are assumed at a removal rate of 99% in order to maximise the efficiency of POME treatment [25]. The activated sludge is separated into two streams (FSP-101), where a portion of sludge will be recycled back to aerobic system and the remaining of the unrecycled sludge will proceed to the centrifugation (DC-101) for the separation of solid (sludge) and liquid (POME effluent). The solid components removal rate for biomass and dead biomass are assumed to be 99% along with 10% of water and the remaining POME effluent will be further treated [28]. The sludge content along with 10% water content will undergo dehydration in the sludge dryer (SLDR-101) and the subsequent dried sludge can be sold as fertilizer. Lastly, the treated POME effluent from TF-101, CL-101, and DC-101 will proceed to the final treatment in the granular media filtration (GMF-101). The process flow is setup in a way that it abides to the environmental regulations whereby the discharge limit of BOD is prescribed at 20 mg/L and below [26]. An overview of simulated equipment setup is listed in Appendix A (Table A4). The biogas yield calculation is shown in Equations (1) and (2):
  B i o g a s   y i e l d   L   C H 4 / g   C O D   r e m o v e d = Q CH 4 Q in × COD in × COD removal   %
B i o g a s   y i e l d   L   CH 4 / kg   POME   fed = Q CH 4 Q in
where,
Q CH 4 = Biogas   production   rate m 3 h
Q in = POME   influent   flowrate m 3 h
COD in = COD   of   POME g L
COD out , an = COD   of   anaerobic   digested   POME g L
COD removal   % = COD in COD out , an COD in × 100 %

4. Results and Discussion

4.1. Simulation Results

The treatment of POME using IAAB is simulated in the steady state condition. In this simulation, the main aim is to eliminate the environmental pollutants such as COD and BOD using IAAB configuration while maximising biogas production. Based on the pre-commercialized IAAB settings, the current IAAB parameters such as HRTan (HRT for anaerobic process) and HRTa (HRT for aerobic process) are taken as 10 days and 4 days, respectively, which are adopted from Chan et al. [18] while the activated sludge recycle ratio is set at 20%. As mentioned by Chan et al. [29], the Stover–Kincannon model is the most suitable model to describe the performance of anaerobic compartment of IAAB, while the Monod model is more suitable for the evaluation of aerobic system. Therefore, the Monod kinetic model is utilised in this study (Table A3), which is appropriate for commercial scale application. The simulated base case results in methane composition of 64%, which proved that the kinetic models, stoichiometry, and coefficient applied are correct and considered as reasonable estimation to proceed for further process optimisation.
The sludge recycle ratio is to retain at 20% as it only affects the overall BOD effluent discharge rate and the plant costing, unlike the conventional setting where the activated sludge is recycled back to the anaerobic digestion tank. According to Andreoli et al. [30], aerobic digestion is utilized in extended aeration mode and simultaneously the microorganisms undergo endogenous phase in which the sludge from POME is aerobically oxidised to CO2, ammonia (NH3), and water. Aerobic digestion is utilized as post-treatment process after anaerobic digestion to further polish the POME effluent so that it is safe for discharge. On the other hand, recycling of activated sludge back into the aerobic tank will significantly increase the amount of microorganisms compared to raw water influent and thus the acceleration of biological degradation in a confined space [31].
In this study, the base case simulation results in COD and BOD removal from 97.8–98.6% with OLR of 6.2 g COD/L day producing methane yield of 0.24 L CH4/g CODremoved. The POME effluent discharge environmental properties, composition of biogas, purified biogas, and final POME effluent discharge composition are shown in Table 2. This simulation results show good agreement to those of pre-commercialised IAAB, which achieved COD and BOD removal of more than 99% at OLR range of 7–10 g COD/L day and methane yield of 0.24 L CH4/g CODremoved. Similarly, in a pilot scale IAAB (1.8 m3) study reported by Yap et al. [27], high overall COD and BOD removals of at least 90% at OLR of 8.0 g COD/L day were obtained. Thus, the values obtained during the simulation of IAAB in industrial scale can be considered appropriate and reliable in order to further proceed in the latter optimisation study.
The overview of equipment setup and related specification in the simulation process flow is specified in the Appendix A. The sludge recycle ratio, OLR, and HRT will be investigated further in the latter subsection of process optimisation.

4.2. Process Optimisation

In this optimisation process, parameters such as HRT and OLR will be manipulated in the anaerobic compartment and sludge recycle ratio will be manipulated in the aerobic compartment. This is to determine the maximum biogas production and COD removal efficiency while considering the trade-off between capital cost, operating cost, and revenue besides adhering to the environmental effluent discharge limit. Net expenditure will be considered for the evaluation of economic feasibility and the formulas are shown as Equations (A3) and (A4) in Appendix A. However, there are some assumptions to be made prior to discussion to allow for reasonable estimates and accurate optimisation for the treatment of POME when using IAAB in the following sub-sections.

4.2.1. Effect of HRT and OLR of Anaerobic Compartment on CH4 Production, COD Removal % and Total Cost

A previous study reported by Chan et al. [17] has indicated that the highest COD removal can be obtained at HRT of not more than 10 days. Therefore, the first analysis will be conducted using different HRT, varying from 1–10 days. The HRT of aerobic compartment (HRTa) and sludge recycle ratio will be kept constant at 4 days and 20%, respectively. As shown in Figure 3a, it can be seen that as HRT increases, methane production will start to increase as well as the efficiency of COD removal. As described by Rahayu et al. [21], HRT is the average length of time a biodegradable matter remains in the anaerobic digester, whereby the operation of the digester must be managed to allow sufficient substrate degradation without increasing the digester volume too much. Moreover, too low of an HRT will subject it to an incomplete degradation process or bacteria wash-out. Moreover, Ren et al. [32] mentioned that the longer the HRT could significantly increase the microorganism activity in the system thus, producing more biogas. Although, increasing HRT would result in higher biogas yield, it would not be feasible for large-scale biogas plant as a shorter HRT with smaller digester volume and investment cost would be much economically feasible [33].
In Figure 3a, the maximum anaerobic COD removal is found to be at 96.6% at HRT of 9 days due to increase in microbial activity which leads to higher methane gas production and POME substrate solubilisation. Besides, the discharge POME effluent from anaerobic compartment is further polished in the subsequent aerobic compartment which results in higher aerobic COD removal of 99.5%. The aforementioned results are comparable to the study by Chan et al. [18], whereby the aerobic compartment promotes higher and more stable COD removal efficiency than that of anaerobic compartment along with higher microorganism activity. Therefore, the integration of anaerobic and aerobic system results in an efficient overall COD removal % of >99% and maximum methane production of 740.5 kg/h shown in Figure 3a.
Furthermore, the relationship between HRT and CH4 production along with COD removal efficiency % are also discussed in terms of economic evaluation. In Figure 3b, the annual operating cost (AOC) reduces as HRT increases from 1–9 days due to the significant increase in total annual revenue which is associated with positive CH4 production. The net expenditure is observed the highest at the beginning of HRT of 1 day, then reduces to the lowest at HRT of 9 days, which determined the best economic feasibility. In addition, a slight reduction in total capital investment as HRT increases from 1–9 days. It is because long HRT will have to compromise with larger digester volume that will incur additional capital and total annual revenue cost [25], which can be observed at HRT of 10 days and OLR of 6.2 kg COD/L day. Therefore, the optimal HRT value of 9 days is selected as the minimum net expenditure is located at HRT of 9 days with 3.4 million USD/year.
As mentioned by Azzahrani et al. [34], OLR is usually increased slowly towards the desired condition to enable the microbes to adapt to the environment and required frequent regulation to avoid organic overloading and acidification. A similar study by Chan et al. [10] gradually reduced the dilution of POME substrate towards the end of the experiment to allow the microbial consortium to acclimate itself and gain self-regulation capability inherent to the increased OLR in the anaerobic digestion system. However, in the simulation there is no such function to alter the parameter for OLR. Instead, the equation adopted from Yap et al. [27] is used to represent the relationship between HRT and OLR to study the behaviour of methane gas production shown in Equation (3).
OLR an = COD in HRT an
where,
COD in = Chemical   oxygen   demand   inlet   g / L
OLR an = Organic   loading   rate   in   anaerobic   digestion   system   g   COD / L   day
HRT an = Hydraulic   retention   time   in   anaerobic   digestion   system   days
The OLR is closely related to the HRT in which OLR is inversely proportional to HRT [35]. The understanding of the OLR is critical to ensure the generation of biogas in anaerobic digestion system. Nonetheless, a balance between the acidogenesis and methanogenesis reaction are considered, whereby the accumulation of volatile fatty acids (VFAs) is regulated accordingly to the optimum pH for most microbial growth ranging from (6.8–7.4) [14]. On the other hand, the OLR must be accommodated as high as possible in order to maximise the biogas yield, however, in excess of OLR will result in system failure due to excessive of VFAs (high acidity) [36]. Figure 4a shows the performance of anaerobic compartment for various COD removal %. The anaerobic COD removal efficiency is stable and consistent over 96.2–96.6% as OLR increases from 6.9–10.4 kg COD/L day, respectively. However, further increasing in OLR from 12.5–62.5 kg COD/L day results in drastic drop in COD removal from 95.9–42.8%. Similar trend can be observed as compared with pre-commercialized IAAB. The lowest methane gas generated at OLR of 62.5 kg COD/L day (corresponding HRT of 1 day) is mainly due to the insufficient contact time and mass transfer between the microorganism and POME substrate to generate methane gas or in other context, microbial cell washout at an early stage [35]. According to Ohimain and Izah [37], the methane gas is intensified as OLR increases, but excess OLR could hinder the production of biogas. Furthermore, excessive OLR will lead to drastic loss in total annual revenue and increase in AOC shown in Figure 4b. Additionally, as OLR decreases the total capital investment reduces slightly. However, Ohimain and Izah [37] discussed that the optimisation of OLR depends on the technology configuration and generally the common anaerobic technology will generate higher methane gas at lower OLR. Therefore, this agrees with the current results where methane production declines as OLR increases as shown in Figure 4a.
In this optimisation study, OLR range from 6.9–10.4 kg COD/L day shows significant improvement in the overall COD removal efficiency up to >99%, which signifies the efficiency and reliability of integrated anaerobic and aerobic system as seen in Figure 4a. The final optimum OLR is chosen at 6.9 kg COD/L day as it achieves high methane purity of 64% at the least net expenditure.

4.2.2. Effect of Aerobic Sludge Recycle Ratio (%) on Total Cost, and Overall BOD Discharge

The parameter for sludge recycle ratio (%) will be mainly focussed on the aerobic digestion system. In this subsection, sludge recycle ratio varying from 5–90% will be observed to study its effect on total annual revenue, AOC, total capital investment, and final treated BOD concentration. The HRT in the anaerobic compartment (HRTan) will be fixed at 9 days.
The role of activated sludge in aerobic compartment is considered a post-treatment after the anaerobic digestion. In the aerobic digestion, microorganism is responsible to further solubilise the organic matter in order to reduce the concentration of pollutants such as COD, BOD, odour, pathogens, and other constituents down to an acceptable level (20 mg/L and below) to abide to the environmental regulations prior discharging into the open environment. Based on Figure 5, as the sludge recycle ratio increased, the BOD effluent begins to drop and reached the minimum at 90% recycle ratio, whereas a slight decrease in AOC and revenue trend can be observed. An increase in BOD above 100 mg/L can be observed as sludge recycle ratio decreases from 40% onwards which dictates that, the rate of degradation from the microorganism decreases due to the insufficient amount of sludge recycle back to the aerobic digester. To add on, the portion of recycled sludge back to the aerobic compartment is insufficient to maintain the desired biomass concentration [18]. The total annual revenue is almost constant, yet a slight decrease can be seen as sludge recycle ratio increases from 5–90% due to lesser sludge is converted into dry sludge to be sold as fertilizer. Positively, AOC along with total capital investment decreases as recycle ratio increases due to lesser unrecycled sludge passing through the centrifugation and sludge drying system. Higher operating cost is subjected for phase separation in centrifuge and especially drying is considered as an energy intensive unit operation.
The optimum parameter for sludge recycle ratio would be 50% which results in BOD removal efficiency of more than 99% and BOD discharge effluent of 97 mg/L. Overall, sludge recycle ratio of 50% results in minimal net expenditure of 4.2 million USD/year.

4.3. Summary for Process Optimisation

Table 3 represents the summary of experimental values obtained from Chan et al. [18], base case values (simulated using SuperPro Designer V9, Intelligen, Cambridge, Massachusetts and United States) and optimum values for different process parameters. The simulation is successful as the simulated base case values are very close to the experimental values with less than 10% deviation. In this optimisation study, methane yield, methane composition, overall COD removal, and overall BOD removal are improved by 17.2%, 1.5%, 1.9%, and 1.2%, respectively, which is considered to be a successful optimisation process for the production of biogas in IAAB. The improvements achieved in overall COD removal and methane yield after process optimisation are mainly contributed by the following reasons: (i) adequate OLR applied in this project results in sufficient substrate concentration favourable for the bacteria to produce more biogas; (ii) adequate OLR can provide the correct balance between acetogenesis and methanogenesis; and (iii) higher sludge recycle ratio tends to accommodate sufficient bacteria population in the aerobic compartment.

4.4. Economic Analysis

The economic performance of POME treatment using IAAB is evaluated in order to determine if this project has better financial attractiveness as compared with other alternative POME treatment projects [38]. The capital cost of the major and auxiliary equipment is obtained mainly from the default price given in the simulation, which is based on the mass and energy balances and part of it from Lok et al. [25]. In terms of economic evaluation, the most critical capital cost would be the major equipment. Since POME is a waste product and required for treatment prior discharging into the environment, no cost will be taken. The labour cost would be taken as per default from the simulation which account for USD 2.0/h. The carbon emission is assumed to provide a treatment cost of USD 0.3/kg from the aerobic digester [25]. Lastly, the sources of revenue will include biogas production (sold for power generation at 0.5068 USD/kg) [39], and dried sludge production (sold as fertilizer at 0.05 USD/kg) [25].
The economic analysis for base case includes the capital investment, operating cost, revenues, credits, and savings listed in Table 4. According to Rahayu et al. [21], a desirable internal rate of return (IRR) for POME-to-energy project must be in the range of 11–23%, in which IRR of 13.2% in base case is in an acceptable range and can further proceed for process optimisation. The cost for major equipment of IAAB is listed in Appendix A (Table A5).
The economic analysis mentioned in Table 4 is based on 60 tons/h of FFB processed. As mentioned by Loh et al. [40], a typical 60 tons/h of POME treatment plant using anaerobic lagoon and closed digester tank will result in an IRR of 12.1–25.5% for captured biogas on-grid electricity generation. In addition, the total capital investment of the digester tank and covered lagoon are lower than the base case study due to the advancement in IAAB technology.
After process optimisation, the plant is projected to provide a higher NPV (7% interest) of 4.4 million USD, IRR of 17.9%, ROI of 24.5%, gross margin of 31.9%, and lower payback period of 4.1 years. This has proven the current IAAB plant appears to be more economically feasible and profitable as compared with both covered lagoon and digester tank as presented in Table 4.

5. Conclusions

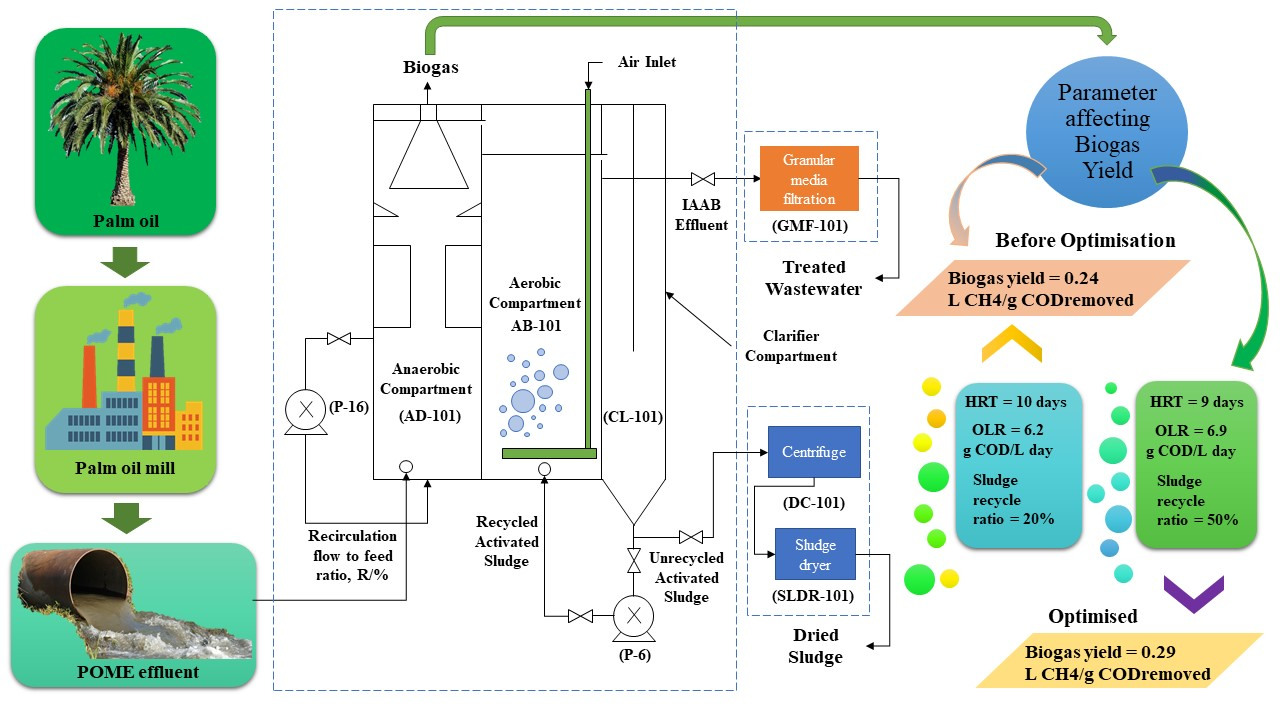
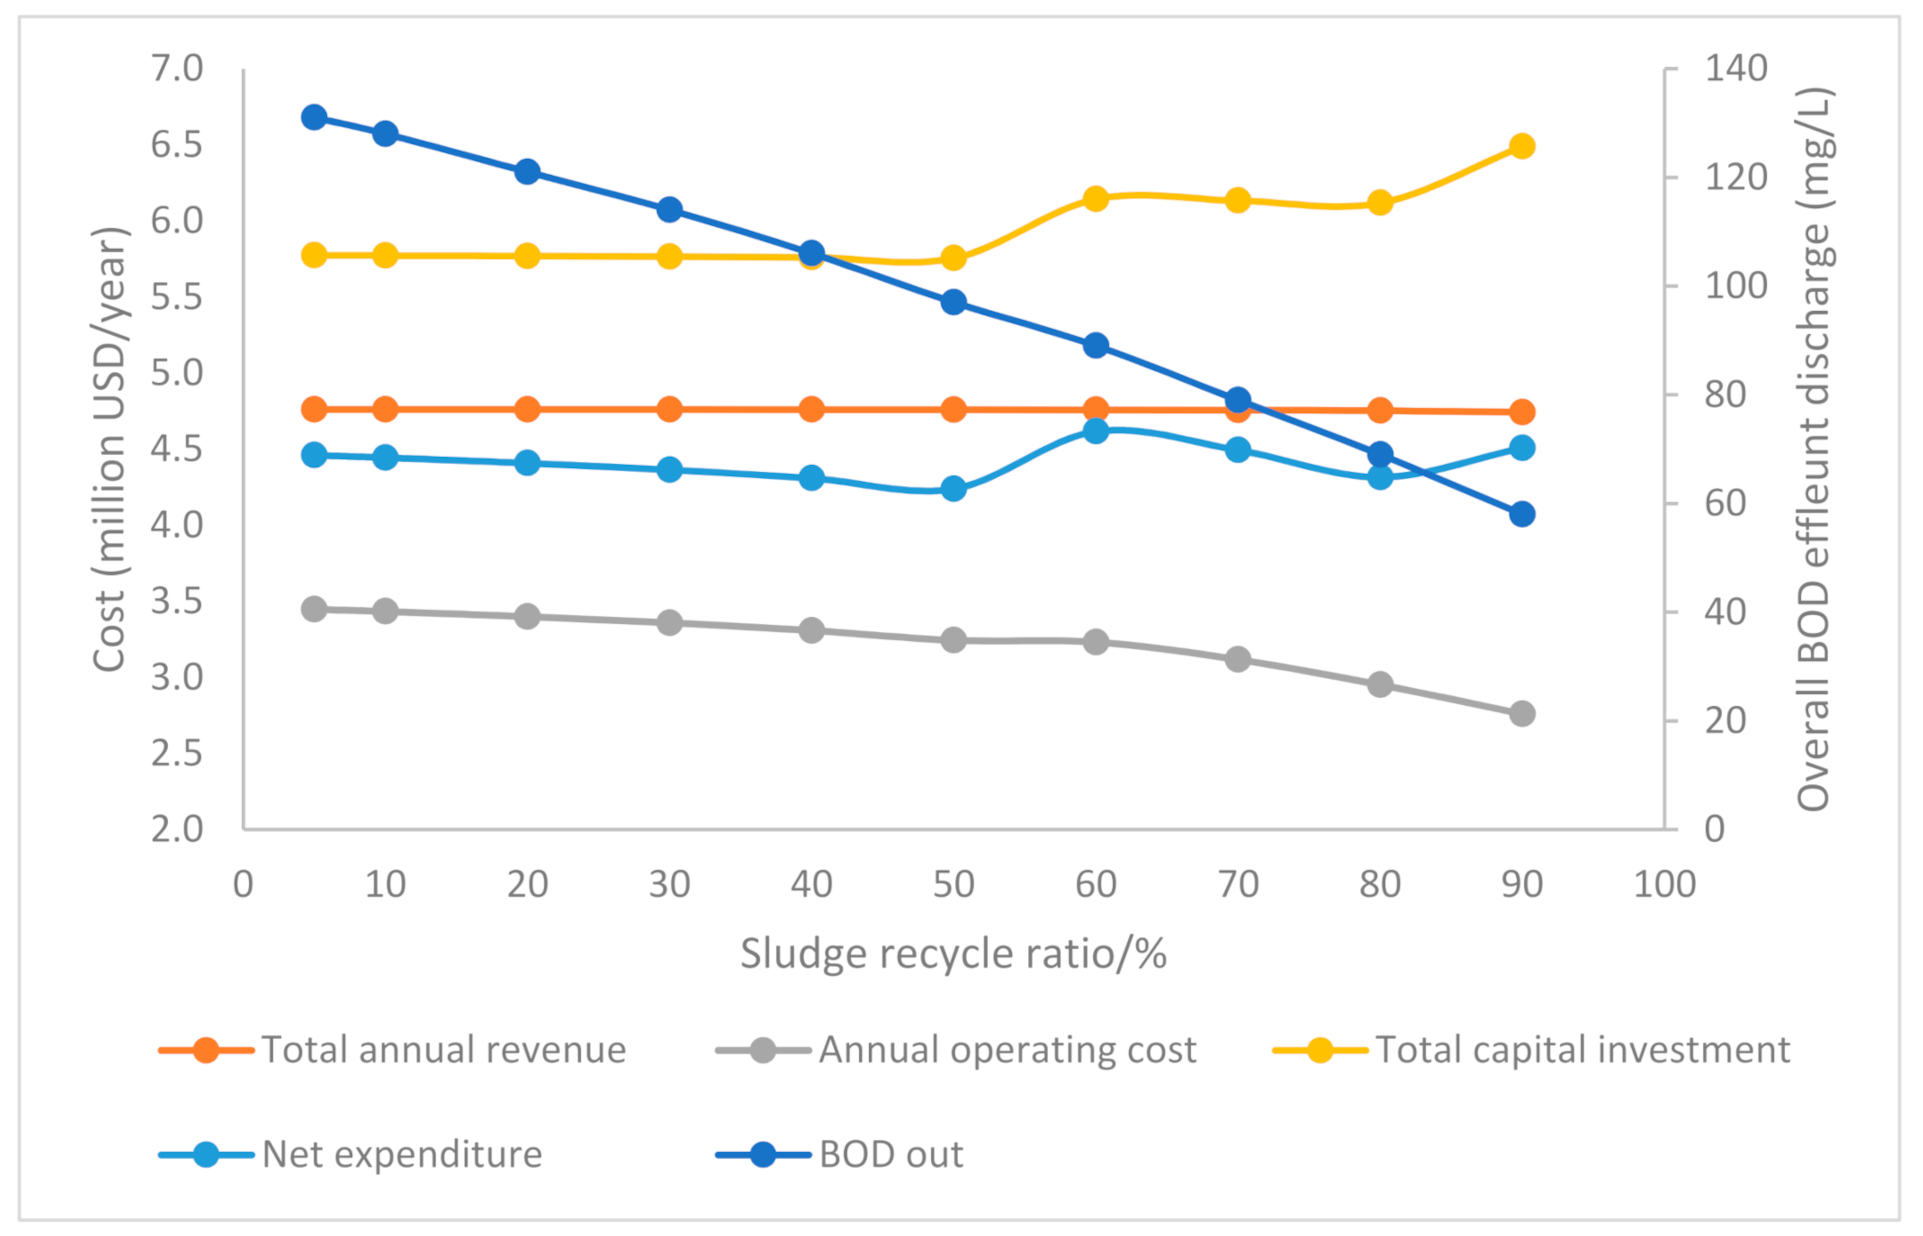
The simulation for complete treatment of POME using IAAB has been successfully conducted by SuperPro Designer V9. An efficient dual strategy of POME treatment and enhanced biogas production have been accomplished by means of performing effective optimisation study on several major parameters including HRT, OLR, and sludge recycle ratio. Prior to optimisation, the base case as per pre-commercialized IAAB setting is simulated with HRT, OLR, and sludge recycle ratio of 10 days, 6.2 g COD/L day and 20%, respectively, which results in biogas yield of 0.24 L CH4/g CODremoved along with COD and BOD removal of 97.8–98.6%. After optimisation, parameters such as HRT, OLR, and sludge recycle ratio of 9 days, 6.9 g COD/L day, and 50%, respectively (corresponding aerobic HRT and OLR of 8 days and 1.7 g COD/L day, respectively), results in biogas yield of 0.29 L CH4/g CODremoved along with COD and BOD removal of more than 99%. The optimised IAAB has yet to achieve BOD discharge effluent limit of 20 mg/L yet, falls below 100 mg/L as per pre-commercialized IAAB study. Nonetheless, the treated effluent from the IAAB will be further purified in the GM filtration and can be reused for the mill. Moving on, the economic analysis for optimised results have deemed to be feasible and promising, resulting in gross margin, ROI, payback time, IRR, and NPV of 31.9%, 24.5%, 4.1 years, 17.9 %, and 4.3 million USD, respectively. Overall, the biogas production of 30.4 L CH4/kg POMEfed are obtained after the process optimisation which results in an overall improvement of 11.4% as compared to those of pre-commercialized IAAB. A trade-off is considered between higher total capital investment and AOC with two times higher total annual revenue of 4.8 million USD/year after process optimisation, which results in lower net expenditure of 5.8% as compared to that of base case. For future improvement, parameters such as SRT, recirculation flow to feed flow ratio (R), and system temperature can be reconsidered for optimisation process for the future and innovation of IAAB to be realised in the commercial setting.

Author Contributions

Conceptualization and Writing—Original Draft Preparation, J.W.R.C.; Supervision and Writing—Review and Editing, Y.J.C.; Writing—Review and Editing and Funding Acquisition, J.W.L.; Formal Analysis, S.C.; Methodology, J.W.R.C.; Data Curation, Y.C.H.; Visualization, M.M.; Project Administration, W.N.T.; Resources, C.K.C. All authors have read and agreed to the published version of the manuscript.

Funding

Financial supports received from HICoE-Center for Biofuel and Biochemical Research with the cost center of 015MA0-052, Universitas Islam Riau (UIR), Indonesia via International Grant with the cost center of 015ME0-164, Universitas Pertamina, Indonesia via International Grant with the cost center of 015ME0-196 and Research Collaboration Grant UTP-UMP-UMT-UCTS with the cost center of 015MD0-019 are gratefully acknowledged.

Institutional Review Board Statement

Not applicable.

Informed Consent Statement

Not applicable.

Data Availability Statement

Acknowledgments

The authors would like to express their deep gratitude to University of Nottingham Malaysia for supporting and providing funds.

Conflicts of Interest

The authors declare no conflict of interest.

Appendix A

The stoichiometry for the oxidation reaction of H2S for the purification of biogas is taken from, shown in Equations (A1) and (A2).
H 2 S + 0.5 O 2 S 0 + H 2 O
H 2 S + 2 O 2 S O 4 2 + 2 H +
The reaction stoichiometry balance for the main components of POME in anaerobic digestion (i.e., carbohydrates, proteins, and lipids) for the potential of biogas production is adopted from A Aziz et al. [20], shown in Table A1.
Table A1. Stoichiometry balance for POME in anaerobic digestion [20].
Main ComponentStoichiometryBiogas Production (L/g)Methane Content (%)
CarbohydrateC6H10O5 + H2O → 3CH4 + 3CO20.8350.0
ProteinC16H24O5N4 + 14.5H2O → 8.25CH4 + 3.75CO2 + 4NH+4 + 4HCO30.9268.8
LipidC50H90O6 + 24.5H2O → 34.75CH4 + 15.25CO21.4369.5
The kinetics for anaerobic and aerobic digestion compartment is obtained from Yap et al. [27] shown in Table A2. The notation for Ks, µmax, and Kd denotes half-velocity constant, maximum specific growth rate, and endogenous decay coefficient, respectively [29].
Table A2. Monod kinetic model for anaerobic and aerobic digestion [27].
CompartmentKinetic ModelKinetic Coefficients
Ks (mg/L)µmax (day−1)Kd (day−1)
AnaerobicMonod94110.17640.1088
AerobicMonod5000.24650.0154
Table A3. Monod kinetic model for anaerobic and aerobic digestion for current study.
CompartmentKinetic ModelKinetic Coefficients
Ks (mg/L)µmax (day−1)Kd (day−1)
AnaerobicMonod4501.200.48
AerobicMonod3110.720.53
Table A4. An overview of simulated equipment setup and related specification. Note: Other parameters not specified is claimed to be as per SuperPro Designer V9 default settings.
EquipmentParameterValue SpecificationRemarks
Anaerobic Digestion (AD-101)Volume (m3)11,258.3-
HRT/residence time (days)10.0Adopted from [18]
--
CH4 production (kg/h)592.3-
CH4 mass composition (%)64.0-
Aerobic Bio-Oxidation (AB-101)Volume (m3)4985.7-
HRT/residence time (days)4.0Adopted from [18]
--
Centrifugation (DC-101)Particulate component removal (%)99Set to allow maximum efficiency
(Biomass and dead biomass)
30
(Water)
Sludge Drying (SLDR-101)Evaporation data
Evaporation efficiency (%)
Evaporate water.
75
Set to allow maximum efficiency
GM Filtration
(GMF-101)
Overall removal efficiency (%)95Set to allow maximum efficiency in order to adhere to the environmental discharge limit
Chiller (HX-101)Component liquid phase distribution (%)90 (Water)Adopted from [25]
Operating temperature (°C)5
Cooling agentFreon
Bio-Trickling Filtration (TF-101)Operating temperature (°C)26.1-
Blower (M-101)Pressure change (bar)3.5 × 10⁻²Adopted from [25]
Recirculation Pump (PM-101)Pressure change (bar)1.1-
Table A5. Major equipment cost of IAAB for the treatment of POME and biogas production. Note: Other equipment not specified is claimed to be as per SuperPro Designer V9 default settings.
EquipmentDimensionUnit Cost/USDReference
Centrifuge (DC-101)30.0 × 10³ L/h90,000SuperPro Designer V9 default setting (Adjusted for year 2021)
Sludge dryer (SLDR-101)8.8 × 10³ kg/h (evaporative capacity)37,000SuperPro Designer V9 default setting (Adjusted for year 2021)
Aerobic Bio-oxidation (AB-101)5.0 × 10⁶ L55,000Adopted from [25] with slight modification
Anaerobic digestion (AD-101)11.3 × 106130,000Adopted from [25]
Bio-Trickling Filtration (TF-101)1.1 × 10⁻¹ m2 (cross sectional area)241,000SuperPro Designer V9 default setting (Adjusted for year 2021)
GM Filtration (GMF-101)1.4 L20,000Adopted from [25] with slight modification
Chiller (HX-101)3.5 m2 (heat transfer area)15,000Adopted from [25]
Clarifier (CL-101)38.9 m2 (surface area)72,500Adopted from [25]
The net expenditure calculation is determined by the summation of annualised capital cost (ACC) and AOC and the difference of total revenue [41]. It is assumed that i would be taken as 0.07 and n to be 5 years. Equations (A3) and (A4) represents the ACC and net expenditure, respectively:
A C C = capital   cost × i 1 + i n i 1 + i n 1
where,
i = fractional   interest   rate   per   year
n = number   of   years
Net   expenditure = A C C + A O C total   revenue

References

  1. Lokman, N.A.; Ithnin, A.M.; Yahya, W.J.; Yuzir, M.A. A brief review on biochemical oxygen demand (BOD) treatment methods for palm oil mill effluents (POME). Environ. Technol. Innov. 2021, 21, 101258. [Google Scholar] [CrossRef]
  2. Chen, J.; Shi, H.; Sivakumar, B.; Peart, M.R. Population, water, food, energy and dams. Renew. Sustain. Energy. Rev. 2016, 56, 18–28. [Google Scholar] [CrossRef]
  3. Hasanudin, U.; Sugiharto, R.; Haryanto, A.; Setiadi, T.; Fujie, K. Palm oil mill effluent treatment and utilization to ensure the sustainability of palm oil industries. Water Sci. Technol. 2015, 72, 1089–1095. [Google Scholar] [CrossRef]
  4. Zaied, B.K.; Nasrullah, M.; Siddique, M.N.I.; Zularisam, A.W.; Singh, L.; Krishnan, S. Co-digestion of palm oil mill effluent for enhanced biogas production in a solar assisted bioreactor: Supplementation with ammonium bicarbonate. Sci. Total. Environ. 2020, 706, 136095. [Google Scholar] [CrossRef]
  5. Ding, G.T.; Mohd Yasin, N.H.; Takriff, M.S.; Kamarudin, K.F.; Salihon, J.; Yaakob, Z.; Mohd Hakimi, N.I.N. Phycoremediation of palm oil mill effluent (POME) and CO2 fixation by locally isolated microalgae: Chlorella sorokiniana UKM2, Coelastrella sp. UKM4 and Chlorella pyrenoidosa UKM7. J. Water Process. Eng. 2020, 35, 101202. [Google Scholar] [CrossRef]
  6. Loh, S.K.; Lai, M.E.; Ngatiman, M.; Lim, W.S.; Choo, Y.M.; Zhang, Z.; Salimon, J. Zero discharge treatment technology of palm oil mill effluent. J. Oil Palm Res. 2013, 25, 271–281. [Google Scholar]
  7. Lim, K.S.; Sethu, V.; Selvarajoo, A. Natural plant materials as coagulant and flocculants for the treatment of palm oil mill effluent. Mater. Today Proc. 2021. [Google Scholar] [CrossRef]
  8. Ahmed, Y.; Yaakob, Z.; Akhtar, P.; Sopian, K. Production of biogas and performance evaluation of existing treatment processes in palm oil mill effluent (POME). Renew. Sustain. Energy. Rev. 2015, 42, 1260–1278. [Google Scholar] [CrossRef]
  9. Yacob, S.; Ali Hassan, M.; Shirai, Y.; Wakisaka, M.; Subash, S. Baseline study of methane emission from anaerobic ponds of palm oil mill effluent treatment. Sci. Total Environ. 2006, 366, 187–196. [Google Scholar] [CrossRef] [PubMed]
  10. Chan, Y.J.; Chong, M.F.; Law, C.L. An integrated anaerobic–aerobic bioreactor (IAAB) for the treatment of palm oil mill effluent (POME): Start-up and steady state performance. Process Biochem. 2012, 47, 485–495. [Google Scholar] [CrossRef]
  11. Tchobanoglous, G.; Burton, F.L.; Stensel, H.D. Metcalf & Eddy—Wastewater Engineering—Treatment and Reuse, 4th ed.; McGraw-Hill Education: New York, NY, USA, 2004. [Google Scholar]
  12. Vögeli, Y.; Lohri, C.R.; Gallardo, A.B.; Diener, S.; Zurbruegg, C. Anaerobic Digestion of Biowaste in Developing Countries. Practical Information and Case Studies; Eawag—Swiss Federal Institute of Aquatic Science and Technology Department of Water and Sanitation in Developing Countries (Sandec): Dubendorf, Switzerland, 2014. [Google Scholar]
  13. Wang, S.; Ma, F.; Ma, W.; Wang, P.; Zhao, G.; Lu, X. Influence of Temperature on Biogas Production Efficiency and Microbial Community in a Two-Phase Anaerobic Digestion System. Water 2019, 11, 133. [Google Scholar] [CrossRef] [Green Version]
  14. Poh, P.E.; Chong, M.F. Development of anaerobic digestion methods for palm oil mill effluent (POME) treatment. Bioresour. Technol. 2009, 100, 1–9. [Google Scholar] [CrossRef]
  15. Isa, M.H.; Wong, L.P.; Bashir, M.J.K.; Shafiq, N.; Kutty, S.R.M.; Farooqi, I.H.; Lee, H.C. Improved anaerobic digestion of palm oil mill effluent and biogas production by ultrasonication pretreatment. Sci. Total Environ. 2020, 722, 137833. [Google Scholar] [CrossRef] [PubMed]
  16. Dotro, G.; Langergraber, G.; Molle, P.; Nivala, J.; Puigagut, J.; Stein, O.; von Sperling, M. Treatment Wetlands; IWA Publishing: London, UK, 2017. [Google Scholar]
  17. Chan, Y.J.; Chong, M.F.; Law, C.L.; Hassell, D.G. A review on anaerobic–aerobic treatment of industrial and municipal wastewater. Chem. Eng. J. 2009, 155, 1–18. [Google Scholar] [CrossRef]
  18. Chan, Y.J.; Hue, F.S.; Chong, M.F.; Ng, D.K.S.; Lim, D.L.K. Pre-Commercialized Integrated Anaerobicaerobic Bioreactor (IAAB) for Palm Oil Mill Effluent (pome) Treatment & Biogas Generation. J. Oil Palm Environ. 2020, 11. [Google Scholar] [CrossRef]
  19. Intelligen, I. Company Information. Available online: https://www.intelligen.com/company-info/ (accessed on 15 June 2021).
  20. Aziz, M.M.; Kassim, K.A.; El Sergany, M.; Anuar, S.; Jorat, M.E.; Yaacob, H.; Ahsan, A.; Imteaz, M.A. Recent advances on palm oil mill effluent (POME) pretreatment and anaerobic reactor for sustainable biogas production. Renew. Sustain. Energy. Rev. 2020, 119, 109603. [Google Scholar] [CrossRef]
  21. Rahayu, A.S.; Karsiwulan, D.; YuwonoIra, H.; Trisnawati, I.; Mulyasari, S.; Rahardjo, S.; Hokermin, S.; Paramita, V. Handbook POME-to-Biogas Project Development in Indonesia. Winrock Int. 2015, 2, 1–100. [Google Scholar]
  22. Yang, L.; Ge, X.; Wan, C.; Yu, F.; Li, Y. Progress and perspectives in converting biogas to transportation fuels. Renew. Sustain. Energy. Rev. 2014, 40, 1133–1152. [Google Scholar] [CrossRef]
  23. Armatec Environmental. Biological Scrubbers—Armatec Environmental Ltd. Available online: https://armatec.squarespace.com/biological-scrubbers (accessed on 9 June 2021).
  24. Saad, M.S.; Wirzal, M.D.H.; Putra, Z.A. Review on current approach for treatment of palm oil mill effluent: Integrated system. J. Environ. Manage. 2021, 286, 112209. [Google Scholar] [CrossRef]
  25. Lok, X.; Chan, Y.J.; Foo, D.C.Y. Simulation and optimisation of full-scale palm oil mill effluent (POME) treatment plant with biogas production. J. Water Process Eng. 2020, 38, 101558. [Google Scholar] [CrossRef]
  26. Chin, M.J.; Poh, P.E.; Tey, B.T.; Chan, E.S.; Chin, K.L. Biogas from palm oil mill effluent (POME): Opportunities and challenges from Malaysia’s perspective. Renew. Sustain. Energy. Rev. 2013, 26, 717–726. [Google Scholar] [CrossRef]
  27. Yap, C.C.; Chan, Y.J.; Loh, S.K.; Supramaniam, C.V.; Soh, A.C.; Chong, M.F.; Lim, L.K. Pilot-Scale Investigation of the Integrated Anaerobic–Aerobic Bioreactor (IAAB) Treating Palm Oil Mill Effluent (POME): Startup and Performance Evaluation. Ind. Eng. Chem. Res. 2021, 60, 3839–3859. [Google Scholar] [CrossRef]
  28. Brandt, M.J.; Johnson, K.M.; Elphinston, A.J.; Ratnayaka, D.D. Chapter 13—Energy Use, Sustainability and Waste Treatment. In Twort’s Water Supply, 7th ed.; Brandt, M.J., Johnson, K.M., Elphinston, A.J., Ratnayaka, D.D., Eds.; Butterworth-Heinemann: Boston, MA, USA, 2017; pp. 553–580. [Google Scholar]
  29. Chan, Y.J.; Chong, M.F.; Law, C.L. Performance and kinetic evaluation of an integrated anaerobic-aerobic bioreactor in the treatment of palm oil mill effluent. Environ. Technol. 2017, 38, 1005–1021. [Google Scholar] [CrossRef]
  30. Andreoli, C.V.; Sperling, M.V.; Fernandes, F. Sludge Treatment and Disposal; IWA: London, UK, 2007; Volume 6, pp. 1–237. [Google Scholar]
  31. AET. Activated Sludge Process and IFAS–Design Rules + Guideline. Available online: https://www.aqua-equip.com/blog/activated-sludge-process-and-ifas-design-rules-guideline/ (accessed on 10 June 2021).
  32. Ren, Y.; Yu, M.; Wu, C.; Wang, Q.; Gao, M.; Huang, Q.; Liu, Y. A comprehensive review on food waste anaerobic digestion: Research updates and tendencies. Bioresour. Technol. 2018, 247, 1069–1076. [Google Scholar] [CrossRef] [PubMed]
  33. Zhang, W.; Lang, Q.; Pan, Z.; Jiang, Y.; Liebetrau, J.; Nelles, M.; Dong, H.; Dong, R. Performance evaluation of a novel anaerobic digestion operation process for treating high-solids content chicken manure: Effect of reduction of the hydraulic retention time at a constant organic loading rate. Waste Manag. 2017, 64, 340–347. [Google Scholar] [CrossRef]
  34. Azzahrani, I.N.; Davanti, F.A.; Millati, R.; Cahyanto, M.N. Effect of Hydraulic Retention TIME (HRT) and Organic Loading Rate (OLR) to the Nata De Coco Anaerobic Treatment Eficiency and Its Wastewater Characteristics. Agritech J. Fak. Teknol. Pertan. UGM 2018, 38, 160–166. [Google Scholar] [CrossRef] [Green Version]
  35. Arimi, M.M.; Knodel, J.; Kiprop, A.; Namango, S.S.; Zhang, Y.; Geißen, S.-U. Strategies for improvement of biohydrogen production from organic-rich wastewater: A review. Biomass Bioenergy 2015, 75, 101–118. [Google Scholar] [CrossRef]
  36. Choong, Y.Y.; Chou, K.W.; Norli, I. Strategies for improving biogas production of palm oil mill effluent (POME) anaerobic digestion: A critical review. Renew. Sustain. Energy Rev. 2018, 82, 2993–3006. [Google Scholar] [CrossRef]
  37. Ohimain, E.I.; Izah, S.C. A review of biogas production from palm oil mill effluents using different configurations of bioreactors. Renew. Sustain. Energy Rev. 2017, 70, 242–253. [Google Scholar] [CrossRef] [Green Version]
  38. Towler, G.; Sinnott, R. Chapter 9—Economic Evaluation of Projects. In Chemical Engineering Design, 2nd ed.; Towler, G., Sinnott, R., Eds.; Butterworth-Heinemann: Boston, MA, USA, 2013; pp. 389–429. [Google Scholar]
  39. Eia.gov. United States Natural Gas Industrial Price (Dollars per Thousand Cubic Feet). Available online: https://www.eia.gov/dnav/ng/hist/n3035us3m.htm (accessed on 10 June 2021).
  40. Loh, S.K.; Nasrin, A.B.; Mohamad Azri, S.; Nurul Adela, B.; Muzzammil, N.; Daryl Jay, T.; Stasha Eleanor, R.A.; Lim, W.S.; Choo, Y.M.; Kaltschmitt, M. First Report on Malaysia’s experiences and development in biogas capture and utilization from palm oil mill effluent under the Economic Transformation Programme: Current and future perspectives. Renew. Sustain. Energy Rev. 2017, 74, 1257–1274. [Google Scholar] [CrossRef]
  41. Smith, R. Chemical Process: Design and Integration; John Wiley & Sons: Hoboken, NJ, USA, 2005. [Google Scholar]
Figure 1. Configuration of IAAB system for the treatment of POME at industrial scale adapted from Chan et al. [18].
Processes 09 01124 g001
Figure 2. Process flow model for IAAB for the treatment of POME using SuperPro Designer V9.
Processes 09 01124 g002
Figure 3. (a) Effect of HRT against methane production and COD removal %, (b) Effect of HRT on economic feasibility.
Processes 09 01124 g003
Figure 4. (a) Effect of OLR against methane production and COD removal % (b) Effect of OLR on economic feasibility.
Processes 09 01124 g004
Figure 5. Effect of sludge recycle ratio% on economic feasibility and overall BOD effluent discharge rate.
Processes 09 01124 g005
Table 1. Feed composition for POME [23].
ComponentFlowrate (kg/h)Mass Composition (%)Concentration (g/L)
Biomass130.00.33.1
Carbohydrates577.01.413.8
Lipids160.00.43.8
Proteins482.01.211.5
Sulphur500.01.212.0
Water40,000.095.6957.0
Concentration (mg/L)
COD62,488
BOD39,139
TP 1568
TN 23656
TS28,455
TSS3110
TDS 325,335
TOC 416,752
1 TP: Total phosphorus; 2 TN: Total nitrogen; 3 TDS: Total dissolved solids; 4 TOC: Total organic carbon.
Table 2. Simulated environment properties of POME effluent and biogas composition.
DescriptionComponentsFlowrate (kg/h)Mass Composition (%)Concentration (g/L)
Biogas from anaerobic digestionNH30.40.07.0 × 10−4
CO2309.028.55.5 × 10−1
H2S126.511.72.3 × 10−1
CH4596.255.01.1
H2O52.64.89.4 × 10−2
Purified biogasNH30.40.04.0 × 10−4
CO2308.432.93.0 × 10−1
H2S1.30.11.2 × 10−3
CH4596.263.55.8 × 10−1
O225.12.72.4 × 10−2
H2O7.00.76.7 × 10−3
Concentration (mg/L)
Aerobically treated POME effluentCOD 1359
BOD 850
TP 1 14
TN 2 85
TS 745
TSS 723
TDS 3 21
TOC 4 364
Final treated POME effluent (after GM filtration)COD 3.0
BOD 1.9
TP 1 0.1
TN 2 0.2
TS 1.6
TSS 1.1
TDS 3 0.5
TOC 4 0.8
1 TP: Total phosphorus; 2 TN: Total nitrogen; 3 TDS: Total dissolved solids; 4 TOC: Total organic carbon.
Table 3. Comparison of process parameters between base case and optimum value.
ParameterUnitExperimental ValueBase Case ValueOptimum Value
HRTan 1Days10109
OLRan 2g COD/L day6.36.26.9
Sludge recycle ratio%202050
HRTa 3Days4.148
OLRa 4g COD/L day6.05.91.7
Methane gas flow ratekg/h-592.3675.3
Methane gas composition%636465
CO2 composition%313433
Biogas production ratem3/h-10361270
Biogas yieldL CH4/g CODremoved0.240.240.29
L CH4/ kg POMEfed 525.725.730.4
COD removal, overall%97.097.899.8
BOD removal, overall%98.098.699.8
1 HRTan: HRT of anaerobic compartment; 2 OLRan: OLR of anaerobic compartment; 3 HRTa: HRT of aerobic compartment; 4 OLRa: OLR of aerobic compartment; 5 POMEfed: POME feed inlet.
Table 4. Executive summary of POME treatment using IAAB (Current study). Note: MP (Main Product) = Total flow of stream “Treated Biogas” (Based on 60 tons/h palm oil mill).
ParameterTechnologyUnit
IAAB (Base Case)Digester TankCovered LagoonIAAB (Optimum Case)
Value
Total capital investment5.35.04.05.8Million USD
Annual operating cost (AOC)3.0--3.2Million USD/year
Total annual revenue3.8--4.8Million USD/year
Unit production reference rate7.4--9.0Million kg MP/year
Unit production cost4.0 × 10−1--3.6 × 10⁻¹USD/kg MP
Unit production revenue5.3 × 10−1--5.3 × 10⁻¹USD/kg MP
Gross margin24.4--31.9%
Return on investment (ROI)19.6--24.5%
Payback time5.15.13.94.1years
IRR (after tax)13.212.1–19.716.1–25.517.9%
Net present value (NPV) (7% interest)2.10.91.04.4Million USD
Publisher’s Note: MDPI stays neutral with regard to jurisdictional claims in published maps and institutional affiliations.

