
Chemical Composition and Low-Temperature Fluidity Properties of Jet Fuels


1
Grupo de Yacimientos de Hidrocarburos, Departamento de Procesos y Energía, Facultad de Minas, Universidad Nacional de Colombia, Sede Medellín, Medellín 050034, Colombia
2
Grupo de Investigación en Fenómenos de Superficie—Michael Polanyi, Departamento de Procesos y Energía, Facultad de Minas, Universidad Nacional de Colombia, Sede Medellín, Medellín 050034, Colombia
*
Authors to whom correspondence should be addressed.
Processes 2021, 9(7), 1184; https://0-doi-org.brum.beds.ac.uk/10.3390/pr9071184
Submission received: 22 May 2021
/
Revised: 23 June 2021
/
Accepted: 30 June 2021
/
Published: 7 July 2021
(This article belongs to the Special Issue Redesign Processes in the Age of the Fourth Industrial Revolution)
Abstract
:The physicochemical properties of petroleum-derived jet fuels mainly depend on their chemical composition, which can vary from sample to sample as a result of the diversity of the crude diet processed by the refinery. Jet fuels are exposed to very low temperatures both at altitude and on the ground in places subject to extreme climates and must be able to maintain their fluidity at these low temperatures otherwise the flow of fuel to turbine engines will be reduced or even stopped. In this work, an experimental evaluation of the effect of chemical composition on low-temperature fluidity properties of jet fuels (freezing point, crystallization onset temperature and viscosity at −20 °C) was carried out. Initially, a methodology based on gas chromatography coupled to mass spectrometry (GC–MS) was adapted to determine the composition of 70 samples of Jet A1 and Jet A fuels. This methodology allowed quantifying the content, in weight percentage, of five main families of hydrocarbons: paraffinic, naphthenic, aromatic, naphthalene derivatives, and tetralin- and indane-derived compounds. Fuel components were also grouped into 11 classes depending on structural characteristics and the number of carbon atoms in the compound. The latter compositional approach allowed obtaining more precise model regressions for predicting the composition–property dependence and identifying individual components or hydrocarbon classes contributing to increased or decreased property values.
1. Introduction
The differences in the physicochemical properties of jet-type aviation fuels can be explained as a consequence of their varied chemical composition. In particular, jet fuels derived from petroleum are complex mixtures of hydrocarbons belonging to the three main families present in crude oils: paraffinic, naphthenic, and aromatic [1]. Additionally, these fuels can contain olefins formed in chemical refining process and hydrocarbons of greater complexity such as indanes and tetralin-derived compounds. The need to know the detailed chemical composition of aviation fuels has become essential. This requirement stems from two main aspects: the search for alternative fuels that allow a transition to cleaner energy sources and the desire to design and operate high-performance engines using knowledge of fuel composition as a control criterion [2]. This has led to the development of improved analytical techniques for aviation fuel analysis [3,4,5,6] and the development of correlations and mathematical models for predicting fuel properties as a function of chemical composition [7,8].
To characterize jet-type aviation fuels, five key technical attributes must be considered: composition, volatility, fluidity, combustion, and other group of aspects including corrosion, thermal stability, pollutants, and additives [9]. In particular, the fluidity properties are critical for the application of jet fuels in environments with low temperatures and high altitudes. Long-duration, high-altitude aircraft flights expose jet fuel to extremely low ambient temperatures (below −70 °C). The low-temperature fluidity of jet fuels is routinely evaluated according to their freezing point and the viscosity at −20 °C, which are properties strongly dependent on intermolecular forces and, therefore, molecular structure.
Several research works have been performed to develop reliable composition–property relationships of petroleum-derived fuels, especially jet and diesel fuels. However, it is still difficult to accurately predict the fuel properties due to the complexity in fuel composition [8]. With respect to jet fuels, it is worth mentioning the pioneering work of Cookson and his colleagues [10,11]. Cookson and Smith [11] developed simple linear relationships between properties, including the freezing point and composition for a set of 51 jet fuels. The composition of the jet fuels was determined by 13C NMR spectroscopy and was expressed in terms of the fraction of aromatic and n-alkyl carbons. Moses et al. [12] studied the effect of the normal/iso-paraffin ratio on the properties of synthetic jet fuels and their blends with a Jet A fuel of fossil origin. They found that the synthetic fuels with larger fractions of normal paraffins required a lighter boiling point distribution to comply with the freezing point specification criteria. Shi et al. [5] analyzed the detailed chemical composition of seventeen kerosene-based hydrocarbon fuels using the comprehensive two-dimensional gas chromatography coupled with quadruple mass spectrometry and flame ion detector (GC×GC-MS/FID) and classified the components into 10 hydrocarbons classes (n-paraffins, monobranched isoparaffins, highly branched isoparaffins, monobranched alkylmonocycloparaffins, highly branched alkylmonocycloparaffins, di- and tricycloparaffins, monobranched alkylbenzenes, highly branched alkylbenzenes, indene, alkylindene, naphthalenes, alkylnaphthalenes, polycyclic aromatics, indane, alkylindane, tetralins, and alkyltetralins) and carbon numbers (C7–C19) forming a series of composition matrices of their mass percentages. The relationships between the detailed composition and the measured freezing point and other properties of those kerosene-based hydrocarbon fuels were then established using the composition matrices and several correlation algorithms. Vozka et al. [6] presented an analytical approach for the determination of the density of jet fuels based on the chemical composition of the fuel determined via two-dimensional gas chromatography with electron ionization high-resolution time-of-flight mass spectrometry detection (GC×GC-TOF/MS) and flame ionization detection (GC×GC-FID). The composition matrix obtained from those techniques included seven hydrocarbon classes (n-paraffins, isoparaffins, monocycloparaffins, di- and tricycloparaffins, alkylbenzenes, cycloaromatic compounds (indans, tetralins, indenes, etc.), and alkylnaphthalenes), each divided according to pertinent carbon numbers. Al-Nuaimi et al. [13] developed an experimental and property-integration framework for the design of synthetic jet fuels from GTL-based kerosene derived by evaluating the role of aromatics on resultant fuel properties. They proposed several multiple nonlinear correlations between the freezing point and the composition of fuel blends for the design of optimum fuel compositions that meet the ASTM specifications. To simplify the relationship between the freezing point and molecular structure of aviation fuels, Wang et al. [8] attempted to correlate the freezing point with H/C molar ratios and molecular weight; however, they found difficulties in obtaining a suitable model, probably given the difficulty of reflecting molecular symmetry and intermolecular forces. Joubert [14] developed a QSAR (structure–activity relationship (SAR) and quantitative structure–activity relationship) model to predict the freezing point of different classes of hydrocarbons. Joubert reported that the model could predict the freezing point of longer carbon chain length n-paraffins accurately; however, results obtained for shorter carbon chain length n- and iso-paraffins were unsatisfactory. He finally concluded that the proposed model was not able to predict the freezing points of structurally diverse paraffinic molecules in the C4–C20 carbon number range accurately. According to Joubert, the freezing point is influenced by the strength of the crystal lattice which in turn is controlled by various factors, including molecular symmetry and intermolecular forces [14]. More recently, Vozka and Kilaz [7] carried out a review of aviation turbine fuel chemical composition–property relations. They provided an overview of correlation techniques and methods (from 1955 to 2019) organized according to four main categories: NMR spectroscopy (alone and in combination with chromatographic techniques), IR spectroscopy (NIR and FTIR), Raman spectroscopy, and gas chromatography (one-dimensional and two-dimensional). These techniques and their predictive capability were compared according to several criteria, specifically the coefficient of determination (R2) and the measure of the uncertainty of future predictions.
In this work, an experimental evaluation of the effect of chemical composition on low-temperature fluidity properties of jet fuels (freezing point, crystallization onset temperature, and viscosity at −20 °C) was carried out. The analytical methodology followed to determine fuel composition allowed to quantify the content in weight percentage of five main families of hydrocarbons: paraffinic, naphthenic, aromatic, naphthalene derivatives and tetralin and indane-derived compounds. Fuel components were also grouped into 11 classes depending on structural characteristics and the number of carbon atoms in the compound. To evaluate the composition–property relationships, statistical analysis was performed selecting composition as the input variable and fluidity properties as response variables. To identify patterns in the analyzed data, a correlation matrix was calculated. Since it is widely accepted that the freezing point behavior of the various hydrocarbon classes is mostly erratic, as no clear behavioral trends have been clearly identified [7,8,9,10,11,12,13,14], the main aim of this work is to provide a tool that allows identifying individual or types of hydrocarbon components that directly affect the low-temperature fluidity properties of jet fuels. This information can be especially useful for manufactures of additives or conventional or alternative aviation fuels.
2. Materials and Methods
2.1. Jet Fuel Samples
Seventy samples of jet fuel collected in a period of 15 months during the years 2018 and 2019 were tested. Most of the samples (66 samples of Jet A1) were collected in four regions of Colombia and provided by a local wholesale distributor. The other samples (Jet A) came from the United States of America and included three samples of fossil origin and a synthetic one. The length of the sampling period, the sample size, and the differences in the sampling points ensured that a set of samples with adequate differences in chemical composition and physicochemical properties was obtained such that detailed statistical analysis could be carried out. Fuel samples (500 to 700 mL) were freshly sourced, and their homogeneity and stability were guaranteed by storing them in amber-type glass containers with a controlled environment between 20 and 23 °C.
2.2. Fuel Composition Analysis
The procedure for composition quantification implemented in this study was based on the method described in the ASTM D2425 Standard Test Method for Hydrocarbon Types in Middle Distillates by Mass Spectrometry [15] and the method developed by Gehron and Yost, Hydrocarbon-Type Analysis of Jet Fuel with Gas Chromatography/Mass Spectrometry [3]. Samples were analyzed using an Agilent Technologies 7890A gas chromatograph linked to a 5975C mass selective detector. A nonpolar DB-5HT GC column (length: 30 m; inner diameter: 0.25 mm; and film thickness: 0.10 μm) manufactured from (5%-phenyl)-methylpolysiloxane was used. The injection temperature was 250 °C and the oven temperature was set at 45 °C for 10 min and then increased to 300 °C at the heating rate of 5 °C/min. The total time of the program was 47 min. Samples were prepared using a standard solution of methyl palmitate in carbon disulfide (0.37 mg/mL). Three drops of the fuel sample were weighed in a vial and then transferred to the cold chain for 10 min. Finally, 1 mL of the standard solution was added to the vial with the weighed sample, shaken vigorously, and injected into the chromatograph. The integration parameters were properly modified to get between 140 and 160 peaks in the chromatogram and facilitate the identification of compounds in agreement with the NIST Mass Spectral Database 2017. The quantification method allowed determining the content in weight percent (wt%) of five hydrocarbon families: paraffinic, naphthenic, aromatic or benzenic compounds, naphthalene compounds, and tetralin- and indane-derived compounds. The analytical standards Supelco n-paraffin mix 47,100 and n-paraffin mix 47,102 were used for the analysis of the first family. In the case of the second and third families, the analytical standards Restek DHA Naphthene 30,728 and DHA Aromatic Standard 30,729 were used, respectively. Naphthalene of analytical grade was used for analyzing the fourth and fifth families. During the preparation and weighing of the standards, liquid nitrogen was used to cool the vials and ensure temperatures below −50 °C. Several mass-to-charge ratios (m/z) were used to allow identifying different hydrocarbon classes (m/z = 85 for linear and branched paraffins, olefins, and cycloparaffins; m/z = 91 for alkyl benzene compounds; m/z = 141 for naphthalene compounds, and m/z = 128 specifically for indanes).
Fuel components were also grouped into 11 classes depending on structural characteristics and the number of carbon atoms in the compound as described in Table 1.
2.3. Low-Temperature Fluidity Properties
The freezing point is the lowest temperature at which the fuel is kept free of hydrocarbon crystals that can restrict the flow of fuel through the ducts that make up the aircraft’s fuel supply system. This parameter was measured by the standard test method for freezing point of aviation fuels ASTM D2386-19 which determines the temperature under which solid hydrocarbon crystals can form in aviation fuels [16]. The crystallization onset temperature (Tco) was determined by differential scanning calorimetry (DSC). DSC curves were recorded in a DSC-Q20 model (TA Instruments). Appropriate amounts of fuel (8–10 mg) were sealed in aluminum pans and cooled from 0 to −80 °C at a scanning rate of 10 °C/min. The DSC cell was calibrated with a standard of pure indium (melting point of 156.6 °C; heat of fusion of 28.71 J/g). The kinematic viscosity at −20 °C was evaluated by the standard test method for kinematic viscosity of transparent and opaque liquids Standard ASTM D445-19 [17]. The measured values of the freezing point and the kinematic viscosity of the tested fuels were contrasted with the specifications for aviation fuels established in the ASTM D1655 standard [18]. This standard establishes maximum limits for freezing point of −40 and −47 °C for Jet A and Jet A1 fuels, respectively. In the case of the kinematic viscosity at −20 °C, the established maximum limit is 8.0 mm2/s for both fuels.
3. Results and Discussion
3.1. Fuel Composition
As mentioned in Section 2.1, a synthetic sample of Jet A was tested. As expected, this sample showed an especial composition characterized by a high content of paraffinic hydrocarbons (99.65 wt%). Table 2 shows the composition by hydrocarbon families for the other 69 fuel samples tested. Paraffinic compounds showed the highest variation from 57.67% to 75.08%. Naphthenic and aromatic compounds presented similar variations. There were samples with higher values of aromatic than naphthenic compounds and other samples with opposite behavior. The families with lower content and variability were the naphthalenes and the tetralin and indane compounds. The variations in composition found are an essential aspect to evaluate the effect of the composition on the physicochemical properties.
Identification of individual hydrocarbon constituents was also carried out. Initially, more than 100 different hydrocarbons were identified in each fuel sample. Then, the compositional data were filtered and only the main individual components were considered, which were defined as those present in at least 50% of the samples and/or with a weight percent greater than 35%. This criterion was met by 20 paraffinic, 10 naphthenic, and 7 aromatic and 4 naphthalene components (see Table 3, Table 4, Table 5 respectively). In the case of tetralin and indane compounds, an evaluation of main components was not performed since they were only present in small amounts.
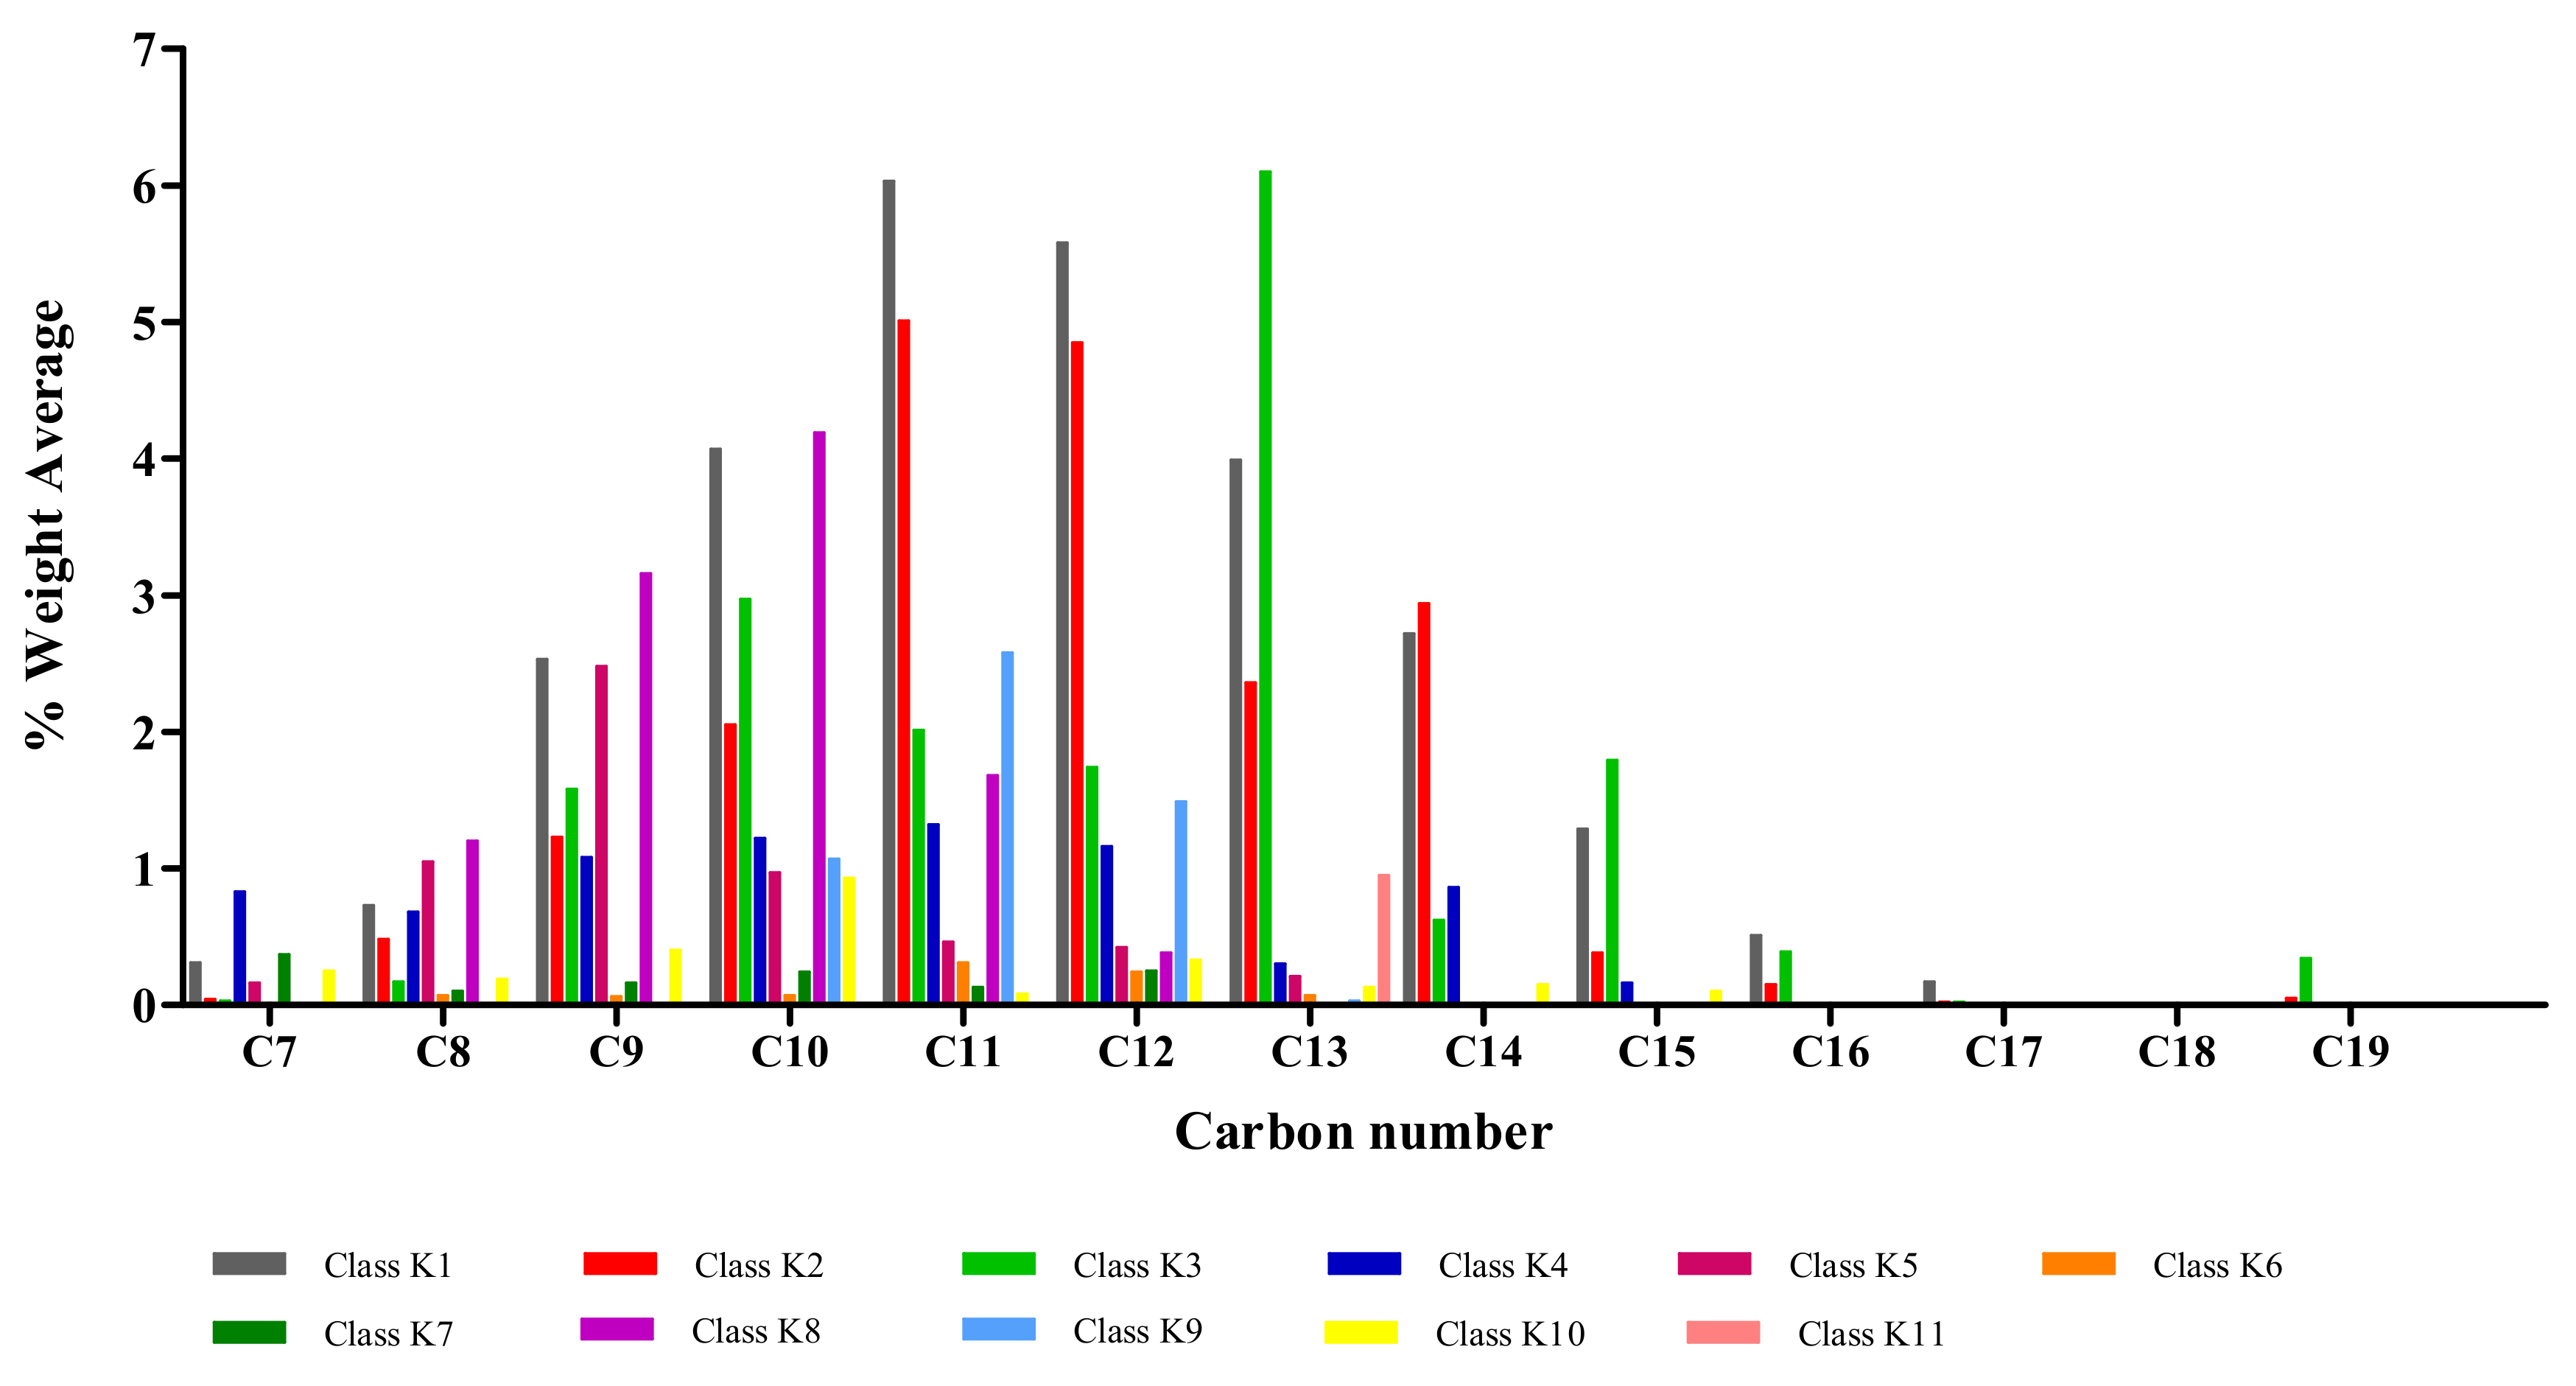
Figure 1 shows the composition of the set of fuel samples tested according to the classes or groups defined in Table 1. It can be seen in Figure 1 that most of the components of the fuels tested are hydrocarbons with a range between 9 and 14 atoms of carbon per molecule, accounting for a weight percent of 87.97%. In the C9–C10 range, the predominant hydrocarbon classes are n-alkanes (class K1) and highly branched alkylbenzenes (class 8). In the case of hydrocarbons with 11, 12, and 14 carbon atoms per molecule, the predominant classes are n-alkanes (class 1) and monobranched isoalkanes (class K2), while for hydrocarbons with 13 carbon atoms per molecule the predominant class is highly branched isoalkanes (class K3). These results are in agreements with those reported by several researchers. Vand der Westhuizen et al. [4] performed a quantification of hydrocarbon classes in synthetic and petroleum-derived jet fuels by means of comprehensive two-dimensional gas chromatography (GC×GC-FID). They reported that the components within a range between 9 and 14 carbon atoms per molecule accounted for a weight percent of 91.21%. More recently, Shi et al. [5] analyzed the detailed chemical composition of kerosene-based jet fuels using comprehensive two-dimensional gas chromatography coupled with quadruple mass spectrometry and flame ion detector (GC×GC–MS/FID). They classified fuel components by hydrocarbon classes and carbon numbers and reported that the components within a range between 9 and 14 carbon atoms per molecule represented a percentage by weight close to 88%.
3.2. Composition–Property Relationships of Low-Temperature Fluidity
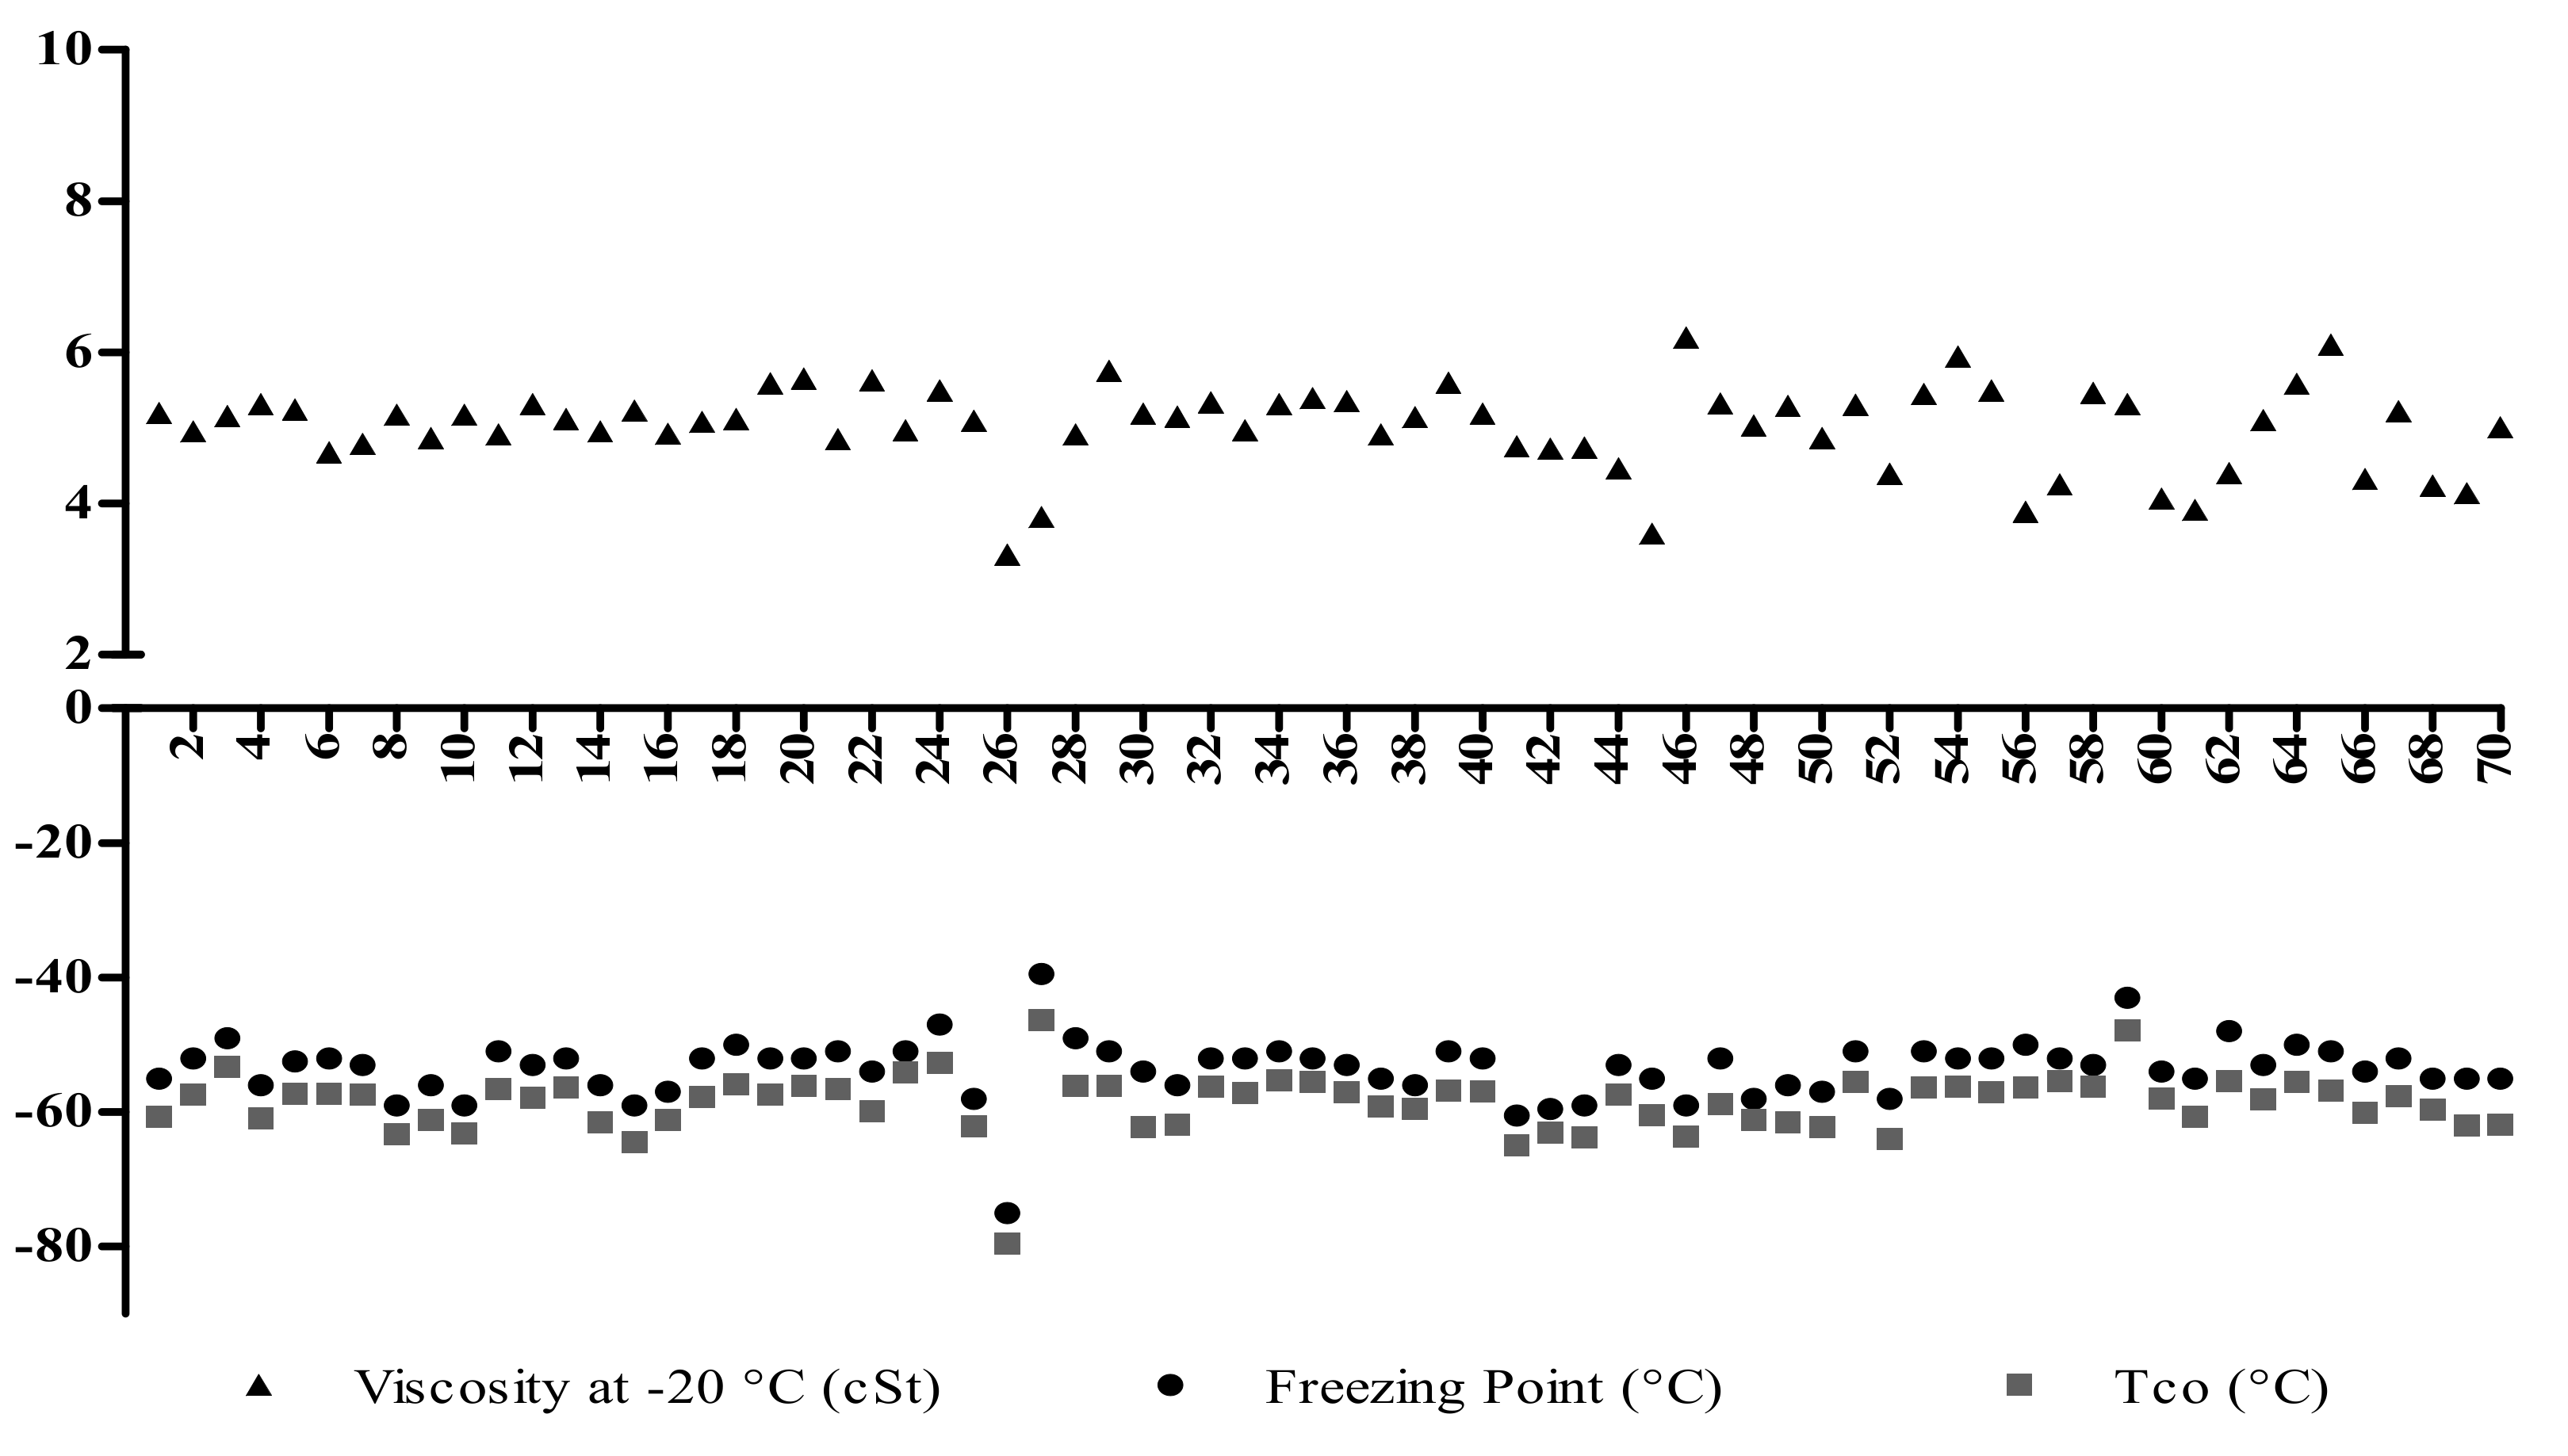
Figure 2 shows the experimental value of the low-temperature fluidity properties of the seventy fuel samples tested. By comparing the values of the properties related to the formation of hydrocarbon crystals, it is observed that the freezing point was always higher than the crystallization onset temperature. On average this difference was 5.1 °C. The results showed maximum values of −39.5 and −46.4 °C and minimum values of −75 and −79.5 °C for the freezing point and the crystallization onset temperature, respectively. The crystallization onset temperature gives more accurate information about the physical process of interest since the DSC technique is not based on visual inspection, as in the case of the freezing point but, rather, the measured temperature is causally related with the energy transferred from the fuel sample undergoing the physical change. Regarding the viscosity measurements, it can be inferred from Figure 2 that all samples were below the maximum specified limit of 8.0 mm2/s with a mean value of 5.0 mm2/s and maximum and minimum values of 6.2 and 3.3 mm2/s, respectively. It is important to highlight that the minimum values obtained for the three properties correspond to sample number 26, which was the only synthetic fuel tested. This special fuel is basically composed of paraffinic hydrocarbons. The classes of hydrocarbons with greater weight percent were K2 (monobranched isoparaffinic) and K3 (highly branched isoparaffinic). In particular, the hydrocarbons of class 3 with a carbon number between C9 and C13 (K3C9–K3C13) had a weight percentage greater than 8.7%. According to Wang et al. [8], the low-temperature fluidity properties strongly depend on the hydrocarbon class. For a given carbon number, n-paraffins exhibit the highest freezing point and so crystallization onset temperature was comparable with those of other hydrocarbon classes, whereas iso-paraffins with more compact and symmetry molecular structure start to form crystals at lower temperatures. Coetzer et al. [19] and Elmalik et al. [20] reported similar observations and showed that increasing iso-paraffin concentration can reduce the freezing point. These results indicate that the catalytic hydroisomerization of n-paraffins to iso-paraffins is an alternative to decrease the freezing point of aviation fuels.
To evaluate the composition–property relationship, statistical analysis was performed selecting composition as the input variable and fluidity properties as the output or response variables. To identify patterns in the analyzed data, a correlation matrix was calculated. Regarding the output variables, it was determined that all the variables had significant linear relationships, direct (positive coefficient) or inverse (negative coefficient). In the case of the input variables, most (26) had significant direct or inverse linear relationships. Given the strong correlation between the variables, dimension reduction methods were applied to obtain variables that did not violate the assumption of non-existence of multicollinearity of the regression. The dimension reduction method chosen was principal components, which is a mathematical procedure that transforms a set of correlated variables into a set of new uncorrelated variables to reduce the size of the data and facilitate its interpretation and analysis [21]. Following this approach, regressions of each response variable against the main components and hydrocarbon families as input variables were obtained with a confidence level of 90% and p values < 0.1. It is important to highlight that all regressions were validated according to the required assumptions of no multicollinearity in the input variables, homoscedasticity, no autocorrelation, and normality of the residuals. The resulting linear regression models are shown in Table 6. Regression variables represent the weight fraction of the individual components which are identified in the same way than in Table 3, Table 4, Table 5. In the regression equation for viscosity, the variable IT represents the weight fraction of the total indane and tetralin compounds.
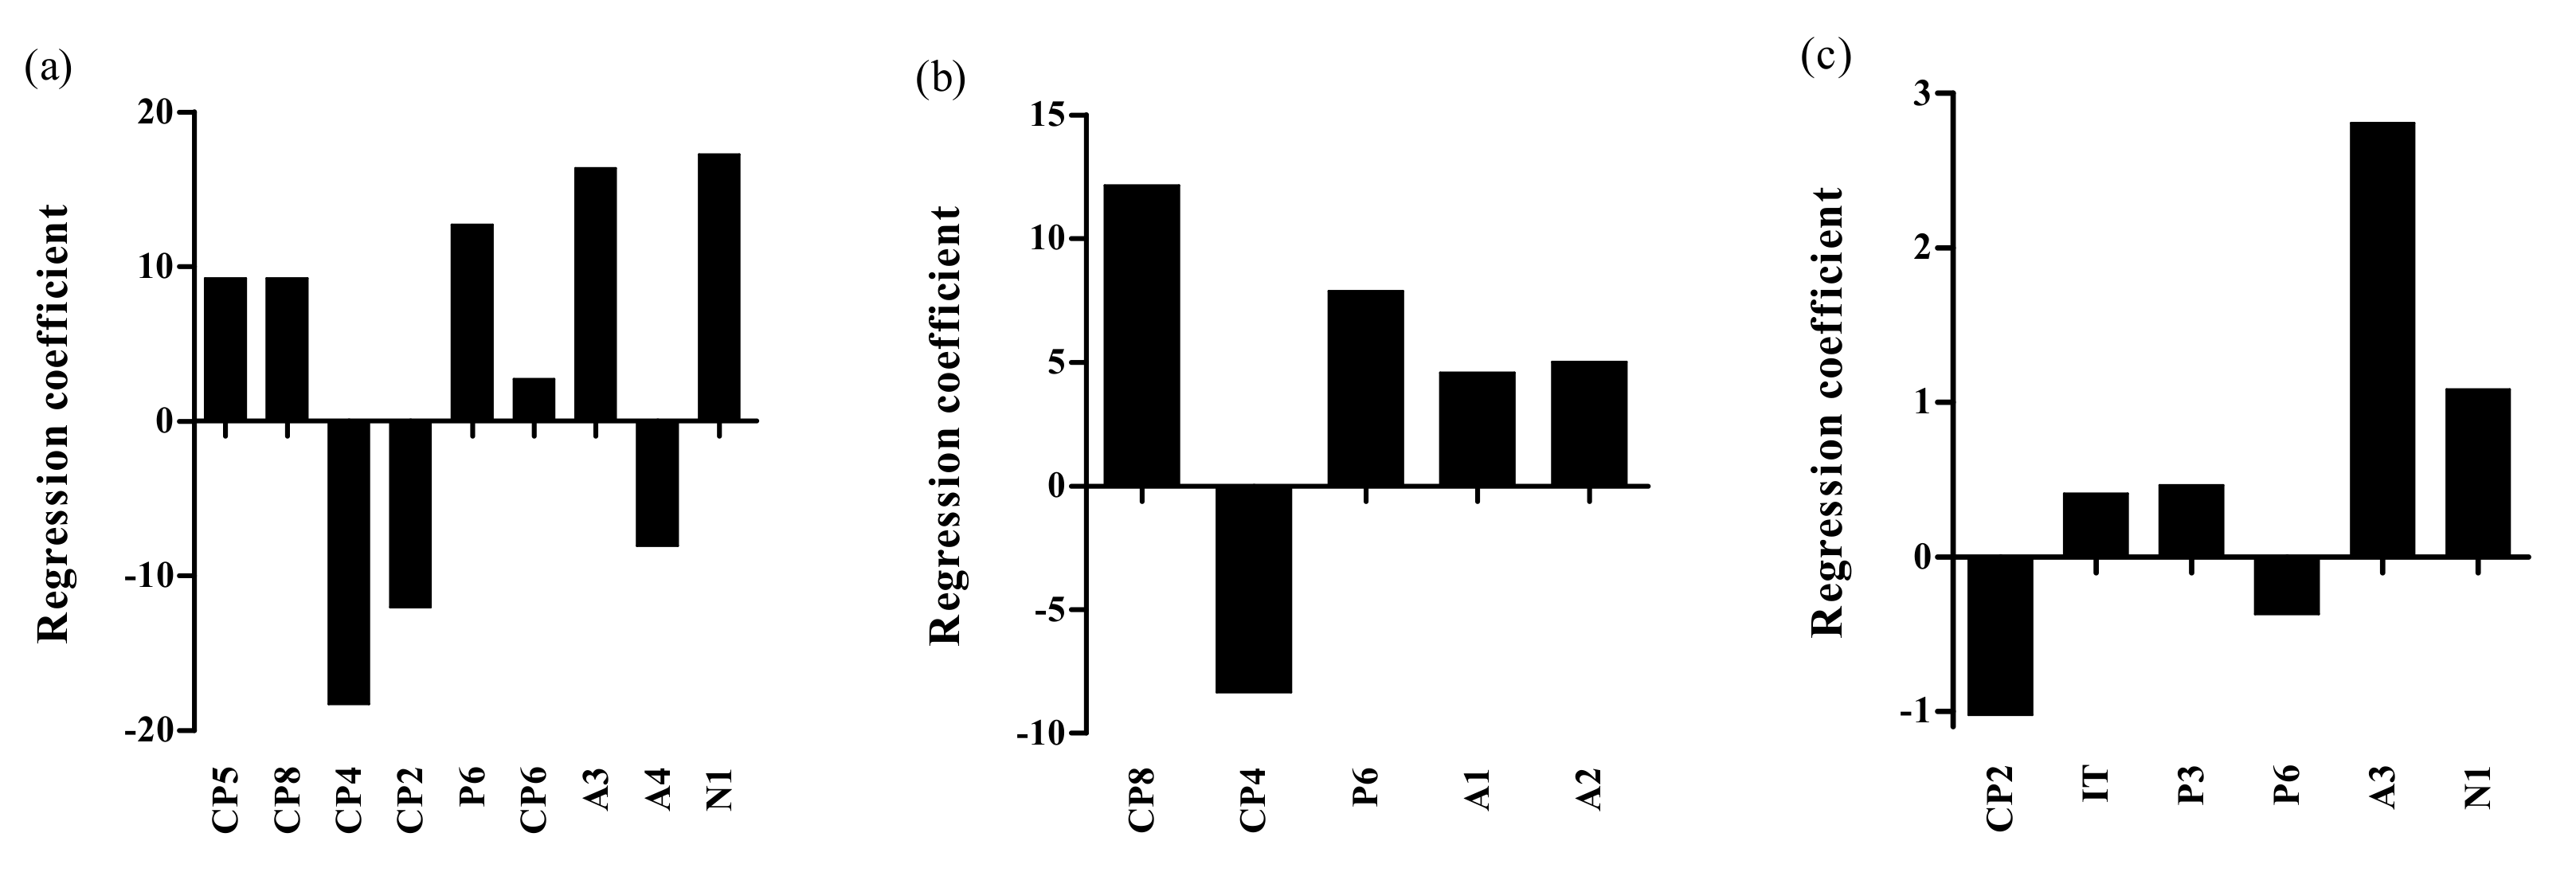
Figure 3 was created according to the information supplied by the regression models and allows identifying and visualizing the individual hydrocarbon components with the greatest effect on the values of the fluidity properties. For the freezing point (see Figure 3a), 9 main components were identified and those with the greatest effect were CP4 or butyl-cyclohexane (C10H20: 10-carbon monobranched cyclosaturated compound) with a negative coefficient (decreasing freezing point) and N1 or trans-decahydronaphthalene (C10H18: 10-carbon naphthalene compound) with a positive coefficient (increasing freezing point). These compounds have melting points of −74.7 and −30.4 °C, respectively (ASTM DS 4B, 1991). In the case of the crystallization onset temperature (see Figure 3b), 5 main components were identified and those with the greatest effect were butyl-cyclohexane with a positive effect and CP8 or 1,1,3-trimethyl-cyclohexane (C9H18: 9-carbon branched cyclosaturated component) with a negative effect. Results indicated that the freezing point and the crystallization onset temperature of branched cycloparaffins were mainly influenced by the type of alkyl group instead of their carbon number. This observation is in agreement with results reported by Han et al. [22] and Nie et al. [23], who affirmed that although the effect of cycloparaffin content on the freezing point has no visible regularity, the mono alkyl-substituted cycloparaffins generally exhibit low freezing point. In the case of the kinematic viscosity at −20 °C (see Figure 3c), six main components were identified and those with the greatest effect were A3 or 1-ethyl-2-methyl-benzene (C9H12: 9-carbon branched aromatic hydrocarbon) and N1 or trans-decahydronaphthalene (C10H18: 10-carbon naphthalene compound) with a positive coefficient, and CP2 or ethyl-cyclohexane (C8H16: 8-carbon monobranched cyclosaturated hydrocarbon) with a negative coefficient.
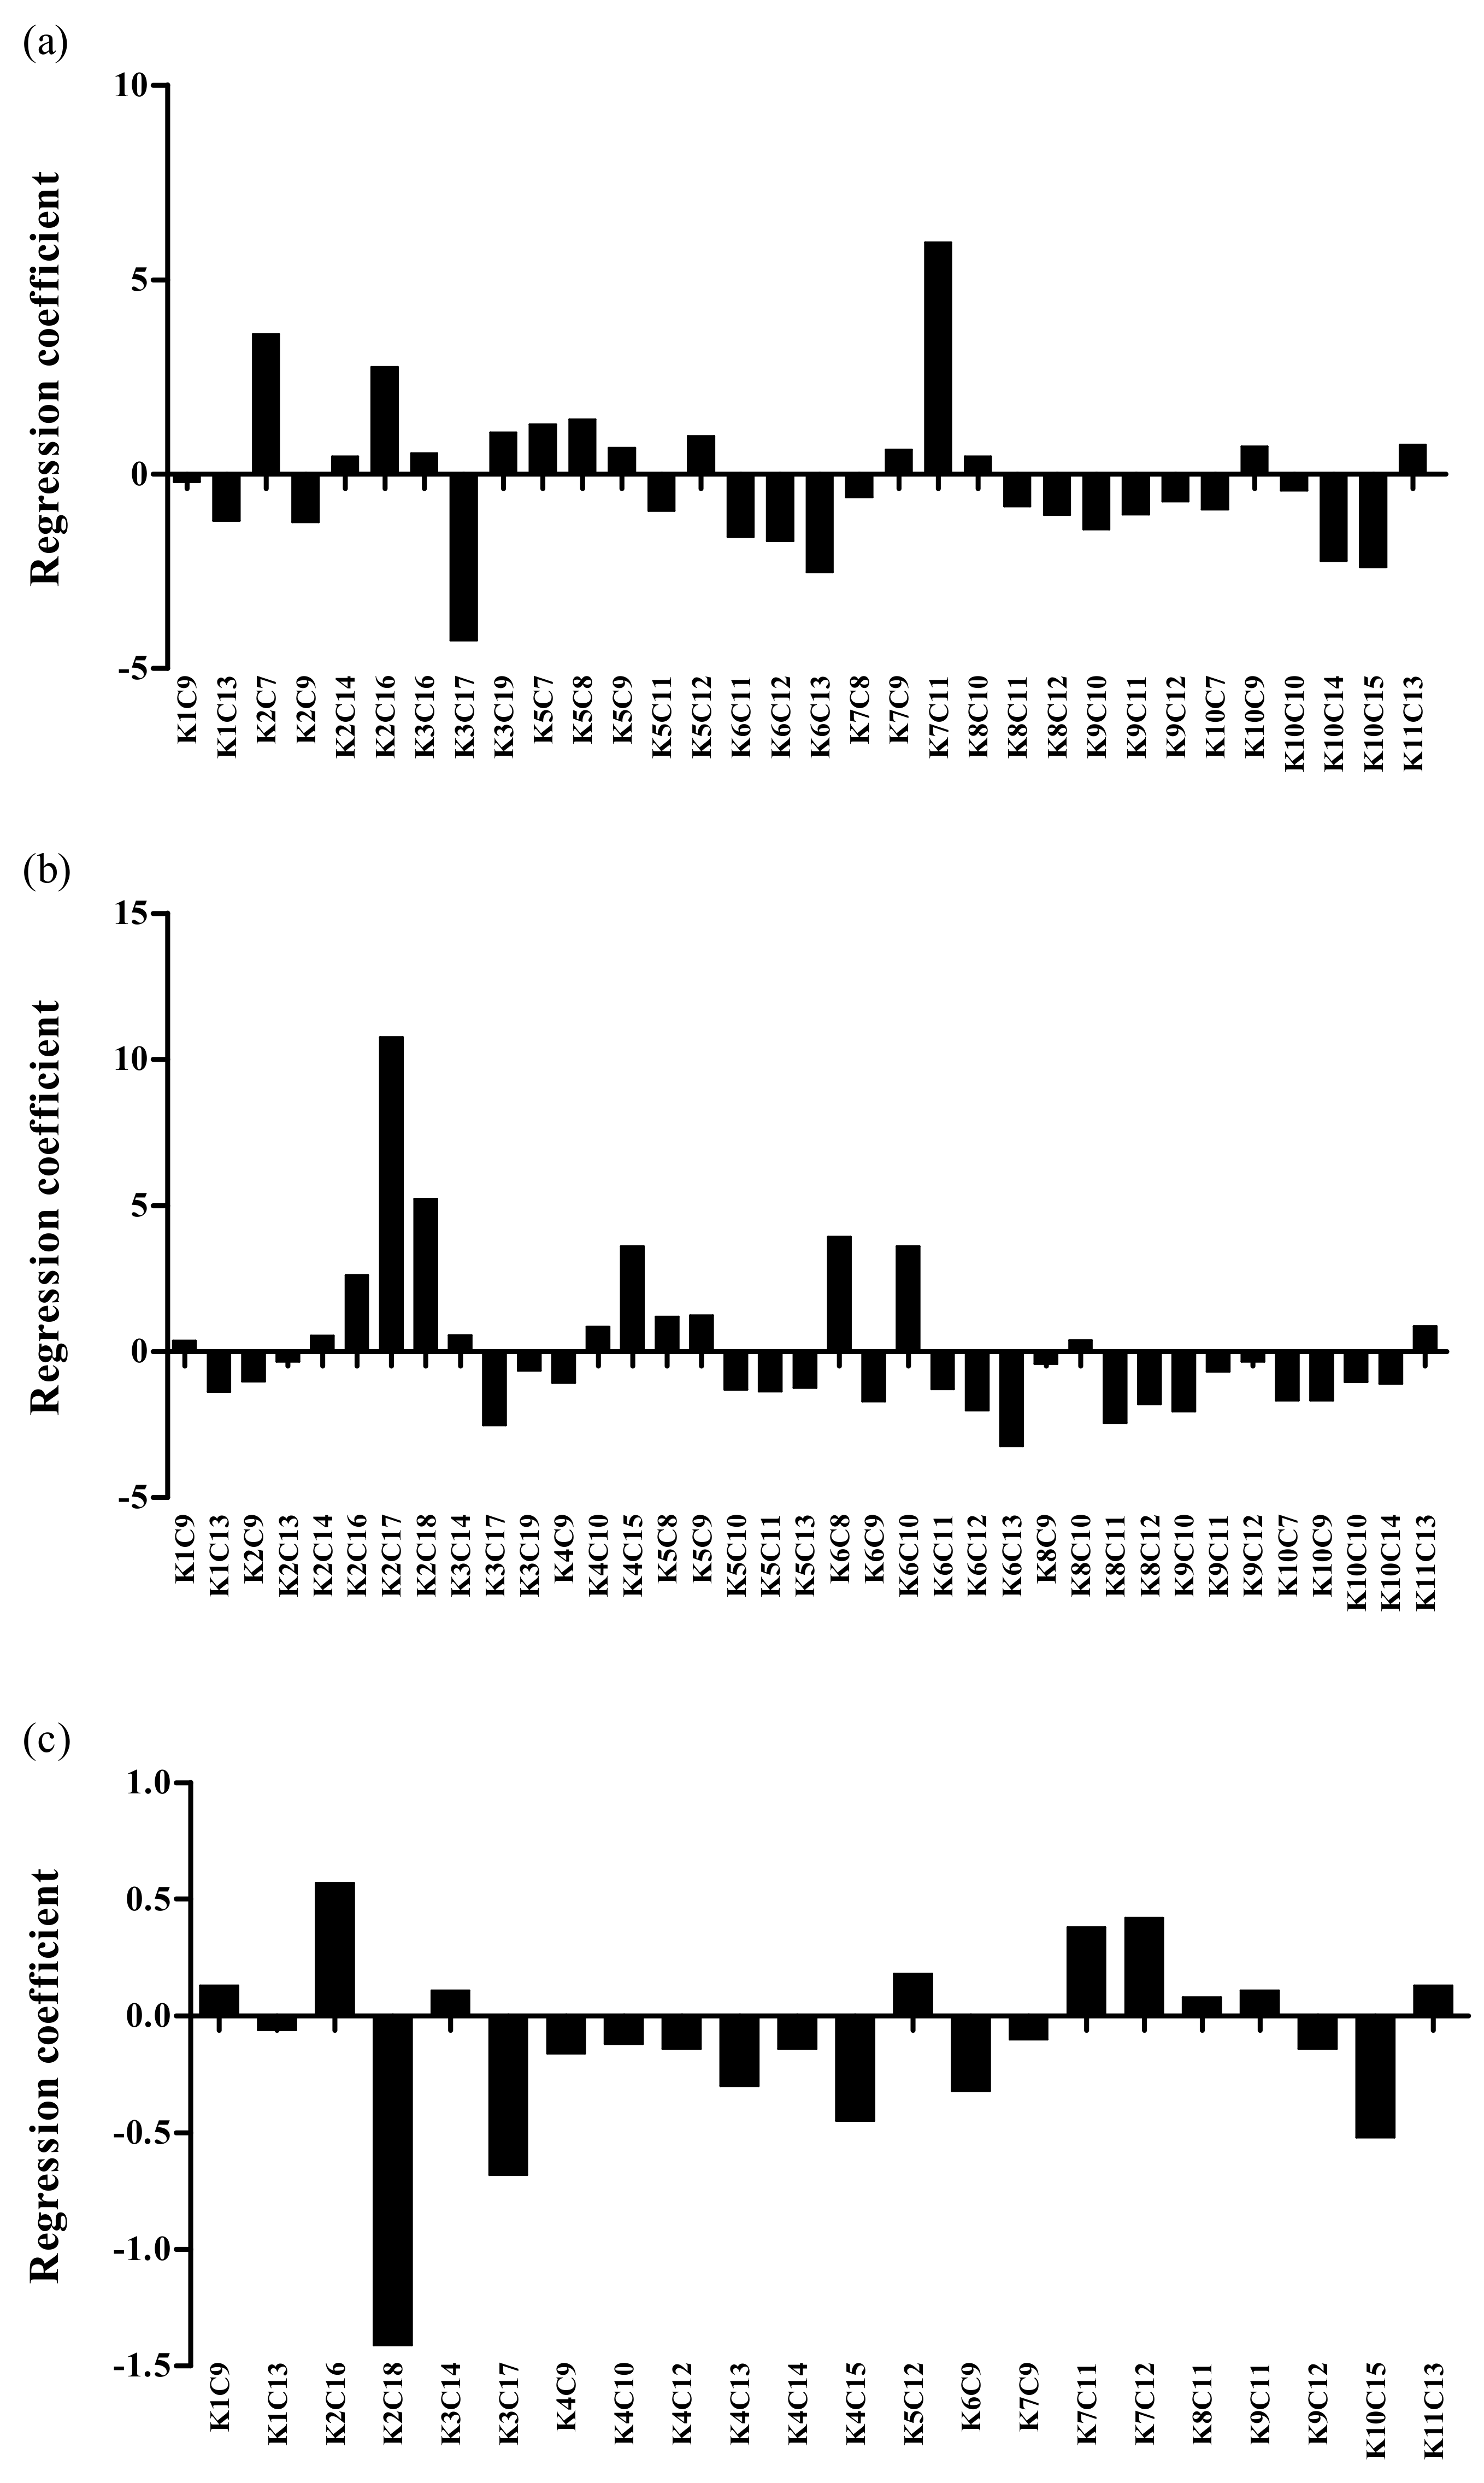
As shown in Table 6, the values of the correlation coefficients (R squared values) of the linear regression models were between 60% and 68%. As explained above, the linear regression models allow estimating the fluidity properties as a function of the composition of the fuels tested expressed as a weight fraction of the main individual compounds and hydrocarbon families. To improve the performance of the regression models, a similar statistical analysis was performed by selecting the fuel composition expressed as a weight fraction of the hydrocarbon classes defined in Table 1 as input variables. It is worth mentioning that the latter compositional approach considers a greater number of individual components than does the identification of the main individual components. The linear regression models obtained by using the chosen approach are shown in Table 7. Regression variables represent the weight fraction of the component or group of components belonging to the different hydrocarbon classes which are denoted in the same way than in Table 1 (for the KiCj notation the subscript i indicates the hydrocarbon class and the subscript j the carbon number of the component or the group of components belonging to the class i or Ki). Figure 4 shows the KiCj components with the greatest effect on the values of the fluidity properties, 32 for the freezing point, 37 for the Tco and 22 for the kinematic viscosity.
In the case of the crystallization onset temperature (see Figure 4b), the KiCj components with the greatest effect were K2C17 and K2C18 (17 and 18 carbon monobranched isoparaffinic compounds) with a positive coefficient (increasing the value of the property) and K6C13 (13 carbon naphthenic hydrocarbons with multiple rings) with a negative coefficient. These results indicate the negative effect of the presence of long chain monobranched isoparaffinic compounds on the crystallization onset temperature despite being present in extremely low concentrations (see Figure 1). This observation agrees with results reported by Coetzer et al. [19] and Vozka et al. [24], who argued that the freezing point of hydrocarbons increases with the number of total carbon atoms and therefore catalytic hydrocracking of aviation fuels could be a promising method to reduce the freezing point by shortening the carbon chain length. On the other hand, the results indicate that the presence of cycloparaffins with multiple rings can allow obtaining low crystallization onset temperatures. According to Nie et al. [23], branched decalins are promising jet fuel components with high density, high thermal stability, and low freezing point (from −51 to −110 °C), but their accessibility is limited by fossil resources. In the case of the freezing point (see Figure 4a), the KiCj components with the greatest effect were K7C11 (11 carbon monobranched alkyl aromatic compounds) with a positive coefficient (negative effect on the property) and K3C17 (17-carbon highly branched isoparaffinic compounds) with a negative coefficient (positive effect on the property).
Regarding the viscosity at −20 °C, it is particularly useful to identify individual components or hydrocarbon classes contributing to increase this property. High viscosity values can cause difficulties in fuel pumpability from aircraft fuel tanks and filter plugging. Figure 4c shows that the KiCj components with the greatest contribution in increasing the viscosity at −20 °C were K2C16 (16-carbon monobranched isoparaffinic compounds) and K7C11 and K7C12 (7-carbon mono branched alkyl benzenes). The K2C16 components are present in jet fuels at low weight percentages. However, they have high potential to increase the fuel viscosity due to their long carbon chain [6]. With respect to alkyl benzenes, it has been identified that those compounds have a significant effect on viscosity. According to Jeihouni et al. [25], a reduction of the aromatic content of the fuel leads to a dramatically drop-off on its viscosity.
4. Conclusions
The detailed composition of a set of seventy jet fuel samples was quantified by gas chromatography/mass spectrometry (GC–MS). Fuel composition was expressed as weight percent of main individual components and of hydrocarbon classes. The average paraffinic content of the tested fuels was 67.39% and the components within a range between 9 and 14 carbon atoms per molecule accounted for an average weight percent of 87.97%. To evaluate the composition–property relationship, statistical analysis using a dimension reduction method was performed to obtain linear regressions of each response variable as a function of fuel composition with a confidence level of 90% and p values < 0.1. More precise regression models were obtained when the fuel composition was expressed as weight percentage of the different components belonging to the 11 hydrocarbon classes considered in this study. High values of the correlation coefficients (R squared values) were obtained while complying with the required assumptions of no multicollinearity in the input variables, homoscedasticity, no autocorrelation, and normality of the residuals. The methodology developed in this study can be used as a tool for identifying individual components or hydrocarbon classes contributing to increase or decrease the low-temperature fluidity properties. It is worth mentioning that the main factor affecting the performance of low-temperature fluidity property–composition models is the erratic behavior of the values of those properties for the various hydrocarbon classes, as no clear behavior trends could be identified.
Author Contributions
Conceptualization, A.B. and P.B.; methodology, A.B. and P.B.; software, A.B. and P.B.; validation, A.B., F.B.C. and P.B.; formal analysis, A.B., F.B.C. and P.B.; investigation, A.B. and P.B.; resources, A.B. and M.A.R.; data curation, A.B. and P.B.; writing—original draft preparation, A.B., and P.B.; writing—review and editing, all authors; visualization, all authors; supervision, all authors; project administration, all authors; funding acquisition, all authors. All authors have read and agreed to the published version of the manuscript.
Funding
This research received funding from the Ministry of Sciences and Technology of Colombia-Call 727/2015.
Institutional Review Board Statement
Not applicable.
Informed Consent Statement
Not applicable.
Conflicts of Interest
The authors declare no conflict of interest.
References
- Coordinating Reseach Council. Handbook of Aviation Fuel Properties; CRC Report No. 635; CRC Press: Boca Raton, FL, USA, 2004. [Google Scholar]
- Liu, G.; Wang, L.; Qu, H.; Shen, H.; Zhang, X.; Zhang, S.; Mi, Z. Artificial neural network approaches on composition-property relationships of jet fuels based on GC-MS. Fuel 2007, 86, 2551–2559. [Google Scholar] [CrossRef]
- Gehron, M.J.; Yosi, R.A.; Gehron, R.; Yost, M.J. Hydrocarbon-Type Analysis of Jet Fuel with Gas Chromatography/Mass Spectrometry. In Novel Techniques in Fossil Fuel Mass Spectrometry; Wood, K., Ashe, T., Eds.; ASTM International: West Conshohocken, PA, USA, 1989. [Google Scholar]
- Van der Westhuizen, R.; Ajam, M.; De Coning, P.; Beens, J.; de Villiers, A.; Sandra, P. Comprehensive two-dimensional gas chromatography for the analysis of synthetic and crude-derived jet fuels. J. Chromatogr. A 2011, 1218, 4478–4486. [Google Scholar] [CrossRef] [PubMed]
- Shi, X.; Li, H.; Song, Z.; Zhang, X.; Liu, G. Quantitative composition-property relationship of aviation hydrocarbon fuel based on comprehensive two-dimensional gas chromatography with mass spectrometry and flame ionization detector. Fuel 2017, 200, 395–406. [Google Scholar] [CrossRef]
- Vozka, P.; Modereger, B.; Park, A.; Zhang, W.; Triced, R.; Kenttämaa, H.; Kilaz, G. Jet fuel density via GC×GC-FID. Fuel 2019, 235, 1052–1060. [Google Scholar] [CrossRef]
- Vozka, P.; Kilaz, G. A review of aviation turbine fuel chemical composition-property relations. Fuel 2020, 268, 117391. [Google Scholar] [CrossRef]
- Wang, X.; Jia, T.; Pan, L.; Liu, Q.; Fang, Y.; Zoul, J.; Zhang, X. Review on the relationship between liquid aerospace fuel composition and their physicochemical properties. Trans. Tianjin Univ. 2021, 27, 87–109. [Google Scholar] [CrossRef]
- Hemighaus, G.; Bacha, J.; Barnes, F.; Franklin, M.; Gibbs, L.; Hogue, N.; Lesninni, D.; Lind, J.; Maybury, J.; Morris, J. Aviation Fuels Technical Review; Chevron Corporation: San Ramom, CA, USA, 2006. [Google Scholar]
- Cookson, D.J.; Lloyd, C.P.; Smith, B.E. Investigation of the chemical basis of kerosene (jet fuel) specification properties. Energy Fuels 1987, 1, 438–447. [Google Scholar] [CrossRef]
- Cookson, D.J.; Smith, B.E. Calculation of jet and diesel fuel properties using carbon-13 NMR spectroscopy. Energy Fuels 1990, 4, 152–156. [Google Scholar] [CrossRef]
- Moses, C.A.; Roets, P.N.J.; Viljoen, C.L.; Wilson, G.R. Effect of chemistry and boiling-point distribution on the properties and characteristics of synthesized paraffinic kerosene and blends with Jet A. In Proceedings of the 11th International Conference on Stability, Handling and Use of Liquid Fuels 2009, Prague, Czech Republic, 18–22 October 2019. [Google Scholar]
- Al-Nuaimi, I.A.; Bohra, M.; Selam, M.; Choudhury, H.A.; El-Halwagi, M.M.; Elbashir, N.O. Optimization of the aromatic/paraffinic composition of synthetic jet fuels. Chem. Eng. Technol. 2016, 39, 2217–2228. [Google Scholar] [CrossRef]
- Joubert, T.S. Relationship between Degree of Branching, Carbon Number Distribution and the Low Temperature Fluidity of Jet Fuel; North-West University: Potchefstroom, South Africa, 2018. [Google Scholar]
- ASTM. ASTM D2425—17 Standard Test Method for Hydrocarbon Types in Middle Distillates by Mass Spectrometry; ASTM: West Conshohocken, PA, USA, 2017. [Google Scholar]
- ASTM. ASTM D2386—19 Standard Test Method for Freezing Point of Aviation Fuels; ASTM: West Conshohocken, PA, USA, 2019. [Google Scholar]
- ASTM. ASTM D445—19a Standard Test Method for Kinematic Viscosity of Transparent and Opaque Liquids (and Calculation of Dynamic Viscosity); ASTM: West Conshohocken, PA, USA, 2019. [Google Scholar]
- ASTM. ASTM D1655—20 Standard Specification for Aviation Turbine Fuels; ASTM: West Conshohocken, PA, USA, 2020. [Google Scholar]
- Elmalik, E.; Raza, B.; Warrag, S.; Ramadhan, H.; Alborzi, E.; Elbashir, N. Role of hydrocarbon building blocks on gas-to-liquid derived synthetic jet fuel characteristics. Ind. Eng. Chem. Res. 2014, 53, 1856–1865. [Google Scholar] [CrossRef]
- Coetzer, R.; Joubert, T.; Viljoen, C.; Nel, R.; Strydem, C. Response surface models for synthetic jet fuel properties. Appl. Petrochem. Res. 2018, 8, 39–53. [Google Scholar] [CrossRef]
- Rencher, A.C.; William, F.C. Methods of Multivariate Analysis, 3rd ed.; Wiley: Hoboken, NJ, USA, 2012. [Google Scholar] [CrossRef]
- Han, P.; Nie, G.; Xie, J.; Feng, E.X.; Pan, L.; Zhang, X.; Zou, J. Synthesis of high-density biofuel with excellent low-temperature properties from lignocellulose-derived feedstock. Fuel Process. Technol. 2017, 163, 45–50. [Google Scholar] [CrossRef]
- Nie, G.; Zhang, X.; Pan, L.; Wang, M.; Zou, J. One-pot production of branched decalins as high-density jet fuel from monocyclic alkanes and alcohols. Chem. Eng. Sci. 2018, 180, 64–69. [Google Scholar] [CrossRef]
- Vozka, P.; Šimáček, P.; Kilaz, G. Impact of HEFA feedstocks on fuel composition and properties in blends with jet A. Energy Fuels 2018, 32, 11595–11606. [Google Scholar] [CrossRef]
- Jeihouni, Y.; Pischinger, S.; Ruhkamp, L.; Koerfer, T. Relationship between Fuel Properties and Sensitivity Analysis of Non-Aromatic and Aromatic Fuels Used in a Single Cylinder Heavy Duty Diesel Engine; SAE Technical Paper 2011-01-0333; SAE: Warrendale, PA, USA, 2011. [Google Scholar]
Figure 1.
Fuel composition by hydrocarbon classes and carbon numbers.

Figure 2.
Experimental values of the measured low-temperature fluidity properties.

Figure 3.
Effect of the main individual components and hydrocarbon families on fluidity properties. (a) freezing point, (b) Tco, and (c) viscosity at −20 °C.
Figure 3.
Effect of the main individual components and hydrocarbon families on fluidity properties. (a) freezing point, (b) Tco, and (c) viscosity at −20 °C.

Figure 4.
Effect of the hydrocarbon class on fluidity properties: (a) freezing point, (b) Tco, and (c) viscosity at −20 °C.
Figure 4.
Effect of the hydrocarbon class on fluidity properties: (a) freezing point, (b) Tco, and (c) viscosity at −20 °C.


Table 1.
Grouping of fuel components by carbon number and structural characteristics.
| Class | Structural Characteristic and Number of Carbon Atoms Per Molecule | Nomenclature |
|---|---|---|
| K1 | Normal paraffinic (alkanes) with between 7 and 19 carbon atoms | K1C7 to K1C19 |
| K2 | Monobranched isoparaffinic (isoalkanes) with between 7 and 19 carbon atoms | K2C7 to K2C19 |
| K3 | Highly branched isoparaffinic (isoalkanes) with between 7 and 19 carbons | K3C7 to K3C19 |
| K4 | Monobranched alkyl-mono-naphthenic with between 7 and 19 carbons | K4C7 to K4C19 |
| K5 | Highly branched alkyl-mono-naphthenic between 7 and 19 carbons | K5C7 to K5C19 |
| K6 | Di-naphthenics, alkyl-di-naphthenics, tri-naphthenics, and alkyl-tri-naphthenics with between 7 and 19 carbons | K6C7 to K6C19 |
| K7 | Monobranched alkylbenzenes with between 7 and 19 carbons | K7C7 to K7C19 |
| K8 | Highly branched alkylbenzenes with between 7 and 19 carbons | K8C7 to K8C19 |
| K9 | Indanes, alkyl-indanes, indenes, alkyl-indenes, naphthalenes, alkyl-naphthalenes and polycyclic aromatics, and tetralin and alkyl-tetralin with between 7 and 19 carbons | K9C7 to K9C19 |
| K10 | Normal, monobranched, and highly branched olefins (alkenes) with between 7 and 19 carbons | K10C7 to K10C19 |
| K11 | Normal, monobranched, highly branched and 13-carbon cycloalkenes | K11C13 |
Table 2.
Jet fuel composition by hydrocarbon family.
| Statistic Data | Hydrocarbon Family (wt%) | ||||
|---|---|---|---|---|---|
| Paraffinic | Naphthenic | Aromatic | Naphthalene | Tetralin and Indane Compounds | |
| Mean | 67.39 | 15.33 | 12.03 | 3.96 | 1.29 |
| Maximum value | 75.08 | 21.60 | 17.74 | 6.17 | 3.10 |
| Minimum value | 57.67 | 8.56 | 7.13 | 1.90 | 0.24 |
Table 3.
Main individual components. Paraffinic family.
| Compound Name | Mean (wt%) | Maximum Value (wt%) | |
|---|---|---|---|
| P1 | Heptane | 0.31 | 0.52 |
| P2 | 3-Methyl-heptane | 0.14 | 0.79 |
| P3 | Octane | 0.73 | 1.58 |
| P4 | 2,6-Dimethyl-heptane | 0.33 | 0.5 |
| P5 | 2,3-Dimethyl-heptane | 0.29 | 1.31 |
| P6 | 2-Methyl-octane | 0.58 | 1.45 |
| P7 | 3-Methyl-octane | 0.38 | 1.34 |
| P8 | Nonane | 2.53 | 5.49 |
| P9 | 3,6-Dimethyl-octane | 0.49 | 1.83 |
| P10 | 2-Methyl-nonane | 0.77 | 1.58 |
| P11 | n-Decane | 4.07 | 7.45 |
| P12 | 2-Methyl-decane | 1.46 | 2.01 |
| P13 | 3-Methyl-decane | 1.13 | 2.18 |
| P14 | n-Undecane | 6.03 | 8.70 |
| P15 | 2-Methyl-undecane | 1.23 | 1.64 |
| P16 | 3-Methyl-undecane | 1.11 | 2.07 |
| P17 | n-Dodecane | 5.58 | 7.98 |
| P18 | n-Tridecane | 3.99 | 5.67 |
| P19 | n-Tetradecane | 2.72 | 4.94 |
| P20 | n-Pentadecane | 1.29 | 3.61 |
Table 4.
Main individual components. Naphthenic family.
| Compound Name | Mean (wt%) | Maximum Value (wt%) | |
|---|---|---|---|
| CP1 | Methyl-cyclohexane | 0.54 | 0.85 |
| CP2 | Ethyl-cyclohexane | 0.39 | 0.94 |
| CP3 | Propyl-cyclohexane | 0.62 | 1.23 |
| CP4 | Butyl-cyclohexane | 0.62 | 0.96 |
| CP5 | Pentyl-cyclohexane | 0.76 | 1.39 |
| CP6 | Hexyl-cyclohexane | 0.72 | 1.43 |
| CP7 | Octyl-cyclohexane | 0.22 | 0.51 |
| CP8 | 1,1,3-Trimethyl-cyclohexane | 0.61 | 1.73 |
| CP9 | 1,3,5-Trimethyl-cyclohexane | 0.21 | 1.02 |
| CP10 | 1-Ethyl-4-methyl-cyclohexane | 0.43 | 1.15 |
Table 5.
Main individual components. Aromatic and naphthalene compounds.
| Compound Name | Mean (wt%) | Maximum Value (wt%) | |
|---|---|---|---|
| A1 | 1,2,4-Trimethyl-benzene | 0.77 | 1.83 |
| A2 | 1,2,3-Trimethyl-benzene | 0.48 | 1.08 |
| A3 | 1-Ethyl-2-methyl-benzene | 0.23 | 0.58 |
| A4 | 1-Methyl-3-propyl-benzene | 0.33 | 0.63 |
| A5 | Toluene | 0.37 | 0.65 |
| A6 | o-Xylene | 0.49 | 1.73 |
| A7 | p-Xylene | 0.52 | 1.36 |
| N1 | trans-Decahydronaphthalene | 0.27 | 0.44 |
| N2 | Decahydro-2-methyl-naphthalene | 0.32 | 0.53 |
| N3 | 2-Methyl-naphthalene | 0.51 | 1.29 |
| N4 | 1-Methyl-naphthalene | 0.22 | 0.57 |
Table 6.
Linear regression models for the low-temperature fluidity properties as a function of the weight fraction of the main individual components and hydrocarbon families.
Table 6.
Linear regression models for the low-temperature fluidity properties as a function of the weight fraction of the main individual components and hydrocarbon families.
| Input Variable | Regression | F Statistic | p-Value | |
|---|---|---|---|---|
| Freezing point, FP (°C) | 5.064 | 0.001056 | 68% | |
| Crystallization onset temperature, Tco (°C) | 7.45 | 0.000213 | 60% | |
| Viscosity at −20 °C, KV (mm2/s) | 8.403 | 5.69 | 67% |
Table 7.
Linear regression models for fluidity properties as a function of weight fraction of hydrocarbon classes.
Table 7.
Linear regression models for fluidity properties as a function of weight fraction of hydrocarbon classes.
| Input Variable | Regression | F Statistic | p-Value | |
|---|---|---|---|---|
| Freezing point, FP (°C) | 52.69 | 2.2 | 98% | |
| Crystallization onset temperature, Tco (°C) | 42.67 | 2.2 | 98% | |
| Kinematic viscosity at −20 °C, KV (mm2/s) | 22.09 | 2.2 | 91% |
Publisher’s Note: MDPI stays neutral with regard to jurisdictional claims in published maps and institutional affiliations. |
© 2021 by the authors. Licensee MDPI, Basel, Switzerland. This article is an open access article distributed under the terms and conditions of the Creative Commons Attribution (CC BY) license (https://creativecommons.org/licenses/by/4.0/).
Share and Cite
MDPI and ACS Style
Benavides, A.; Benjumea, P.; Cortés, F.B.; Ruiz, M.A. Chemical Composition and Low-Temperature Fluidity Properties of Jet Fuels. Processes 2021, 9, 1184. https://0-doi-org.brum.beds.ac.uk/10.3390/pr9071184
AMA Style
Benavides A, Benjumea P, Cortés FB, Ruiz MA. Chemical Composition and Low-Temperature Fluidity Properties of Jet Fuels. Processes. 2021; 9(7):1184. https://0-doi-org.brum.beds.ac.uk/10.3390/pr9071184
Chicago/Turabian StyleBenavides, Alirio, Pedro Benjumea, Farid B. Cortés, and Marco A. Ruiz. 2021. "Chemical Composition and Low-Temperature Fluidity Properties of Jet Fuels" Processes 9, no. 7: 1184. https://0-doi-org.brum.beds.ac.uk/10.3390/pr9071184
Note that from the first issue of 2016, this journal uses article numbers instead of page numbers. See further details here.