
Hydrodynamic Analysis of a Multibody Wave Energy Converter in Regular Waves


1
Department of Ocean System Engineering, Jeju National University, Jeju 63243, Korea
2
Multidisciplinary Graduate School Program for Wind Energy, Jeju National University, Jeju 63423, Korea
*
Author to whom correspondence should be addressed.
Processes 2021, 9(7), 1233; https://0-doi-org.brum.beds.ac.uk/10.3390/pr9071233
Submission received: 11 June 2021
/
Revised: 12 July 2021
/
Accepted: 14 July 2021
/
Published: 16 July 2021
(This article belongs to the Special Issue Wave Energy Technologies in Korea)
Abstract
:A performance assessment of wave power absorption characteristics of isolated and multiple wave energy converter (WEC) rotors was presented in this study for various wave-heading angles and wave frequencies. Numerical hydrodynamic analysis of the WEC was carried out using the three-dimensional linear boundary element method (BEM) and nonlinear computational fluid dynamics (CFD). Experimental results were used to validate the adopted numerical models. Influence with and without power take-off (PTO) was estimated on both isolated and multiple WEC rotors. Furthermore, to investigate the interaction effect among WECs, a q-factor was used. Incorporation of viscous and PTO damping into the linear BEM solution shows the maximum reduction focused around peak frequency but demonstrated an insignificant effect elsewhere. The q-factor showed both constructive and destructive interactions with the increase of the wave-heading angle and wave frequencies. Further investigation based on the prototype WEC rotor was carried, and calculated results of the linear BEM and the nonlinear CFD were compared. The pitch response and q-factor of the chosen wave frequencies demonstrated satisfactory consistency between the linear BEM and nonlinear CFD results, except for some wave frequencies. Estimated optimal time-averaged power using linear BEM show that the maximum extracted power close to the zero wave-heading angle around the resonance frequency decreases as the wave-heading angle increases. Overall, the linear BEM on the extracted power is overestimated compared with the nonlinear CFD results.
1. Introduction
Commercial development of many applications in the field of wave energy converter (WEC) is motivated to deploy in arrays for creating WEC farms. Understanding the hydrodynamic behavior in such arrays can determine the optimum configuration of multiple WECs and maximize wave power extraction. Wave approach angle and large-scale interference among WECs are important in multiple WEC spacing of hydrodynamic interaction of waves. A q-factor can be used to quantify the interaction among WEC, which is defined as the ratio of the total response/power extracted from a multiple of n WECs to n times the response/power extracted from an isolated WEC, where n is the number of WECs. Interaction effects may be constructive (q-factor > 1) or destructive (q-factor < 1) depending on the configuration of multiple WECs and sea conditions.
In the past, many studies on multiple WECs have been analytically, numerically, and experimentally explored [1,2,3,4,5,6]. Linear potential flow theory is an adopted numerical approach that has been extensively used in over 90% of existing numerical methods since 1969 [7,8,9,10] and the standard approach for analyzing multiple WECs in both frequency [11,12,13,14,15,16,17] and the linear time domain [18,19,20,21,22]. The linear time domain models directly use frequency-dependent hydrodynamic coefficients in their motion equation. Nonlinear hydrodynamic approaches, such as the fully nonlinear potential flow theory, computational fluid dynamics (CFD), and SPH, are suitable for WEC modelers because of their increased computational power in recent years [6,8,9]. CFD can provide a rigorous nonlinear treatment of Navier–Stokes equations to analyze multiple WECs. Extensive investigations on multiple WECs using CFD were performed by [6,10,23,24]. Windt et al. [25] investigated CFD-based numerical simulations using OpenFOAM on a model scale Wavestar point-absorber and validated the laboratory experiments. The study includes the effect of PTO damping and it is implemented in the CFD by the spring-damper model.
The present study considers the WEC on the basis of Salter’s duck (rotor), which was patented in 1974 [26]. The cross-section of the WEC rotor is illustrated in Figure 1. Front shape (paunch) of the WEC rotor resembles the fluid particle displacement and wave dynamic pressure forces the rotor to move up and down a fixed axis (Figure 1). In comparison, the rear part (stern) of the WEC rotor is mostly circular and reflects no waves in the leeward side. The nonsymmetric shape and hydrodynamic behavior of the WEC rotor improves its efficiency by extracting 90% of the wave energy in two-dimensional sinusoidal waves [26]. An optimal motion performance of the WEC rotor has been designed to suit the western part of the Jeju Island in South Korea by performing systematic design parameters using linear BEM [27]. Poguluri et al. [28] carried out a thorough CFD-based sensitivity analysis using quasi-2D wave generation and its interaction with the WEC rotor. They concluded that the simulation parameters with wave forcing zone of one wavelength, grid aspect ratio of four, interface momentum dissipation (IMD) with artificial viscosity = 1.0 along with high resolution interface capturing method, and standard low-Re k-ε model can predict highly accurate long-term simulations of wave and WEC rotor interactions. These were validated with the experimental results and extended the study to the prototype scale model. Later, Poguluri et al. [29] performed a numerical investigation using a linear boundary element method (BEM) and a CFD analysis to find the response of multiple arrayed rotors and its effect due to the rotor spacing without PTO damping.
With the presented background, the modeling of multiple WEC rotors is considered an extension of the framework of isolated WEC rotors carried out in previous studies [27,28,29,30,31]. The interaction of multiple WEC rotors is investigated in regular waves on the basis of linear boundary element method (BEM) (using WAMIT) and nonlinear CFD (using Star-CCM+). Each WEC rotor has one degree of freedom that includes pitch alone along the y-axis, as shown in Figure 1. The rest of this paper is organized as follows. The mathematical model and experimental details of a WEC rotor are outlined in Section 2. The CFD methodology and numerical settings use to simulate the wave and its interaction with multiple WEC rotors are discussed in Section 3. The validation, results, and discussion are presented in Section 4. Finally, conclusions of this study are drawn in Section 5.
2. Mathematical Model and Experimental Setup
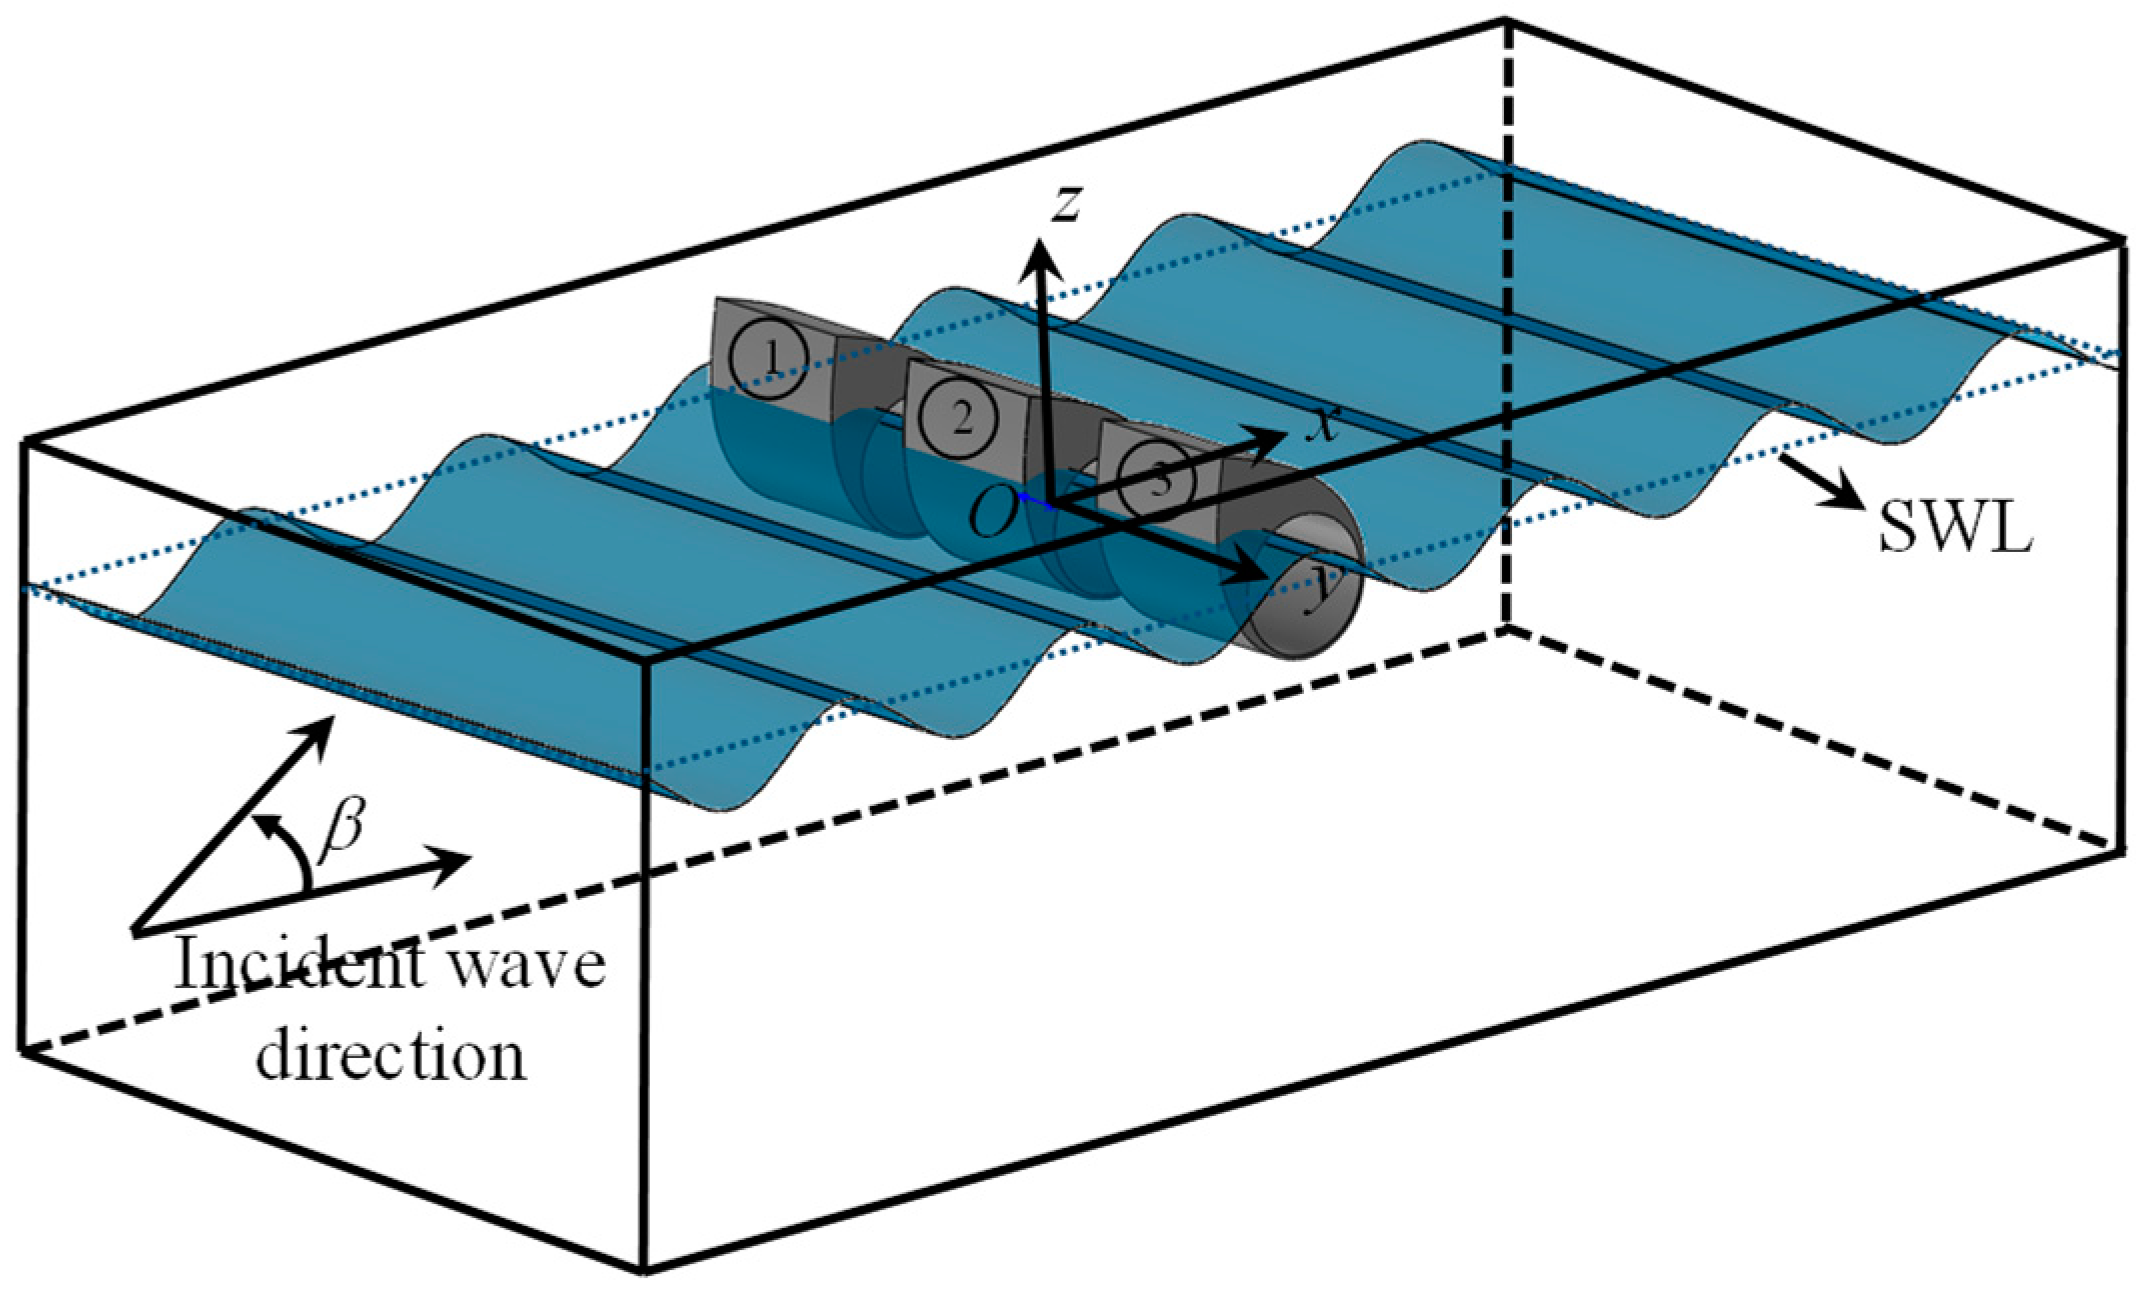
The configuration of multiple WEC rotors in the present study is shown in Figure 2. Three WEC rotors with a width (W) in the y-direction are considered. A fixed coordinate system is taken at the center of rotation (O) with a vertical upward z-axis, and the wave propagates from the negative x-direction to the positive x-direction. The rotor tip is placed in the “negative” x and approach wave angle (β) is set to 0°, 30°, and 60° to allow waves to hit the WEC rotor. Each rotor rotates around its own center of rotation. Geometry details of principle particulars; moment of inertia in x-, y-, and z-directions; and hydrostatic properties are listed in Table 1.
This study primarily deals with the hydrodynamic response of oscillating multiple WEC rotors within the framework of the linear BEM model under the assumption of irrotational flow, inviscid and incompressible fluid, linearized kinematic and dynamic boundary conditions on the free surface, and smaller body motions compared with their characteristic length.
All variables can be expressed as complex amplitude multiplied by under these assumptions. Angular oscillation amplitude ξj as a harmonic function of time is expressed as follows:
Hydrodynamic response of the Mth WEC excited by waves with amplitude “a” angular frequency ω along the pitch direction (denoted subscript 5) can be expressed as
where
- n is the total number of WECs (n = 3 in the present study),
- is the mass moment of inertia of the Mth WEC in the pitch direction,
- is the hydrodynamic-added mass inertia of the Mth WEC in the pitch direction induced by the Sth motion of the Nth WEC,
- is the hydrodynamic radiation damping of the Mth WEC in the pitch direction induced by the Sth motion of the Nth WEC,
- is the viscous damping of the Mth WEC in the pitch direction,
- is the power take-off (PTO) damping of the Mth WEC in the pitch direction,
- is the hydrostatic stiffness moment of the Mth WEC in the pitch direction, and
- is the wave excitation moment acting on the Mth WEC in the pitch direction.
The energy that can be extracted from the WEC rotor is captured by the PTO. The constant PTO () damping obtained from the isolated WEC rotor was used for multiple WEC rotors. Free decay tests were conducted on the isolated WEC rotor to obtain the viscous damping moment from laboratory tests in Jeju National University [31]. Logarithmic decrement method is used to obtain the damping ratio. The viscous damping can be estimated by subtracting radiation damping from actual damping. The actual damping is defined as the product of the damping ratio and critical damping , where is the undamped natural frequency of the isolated WEC rotor. Viscous damping values from experiments, hydrodynamic coefficients from the linear BEM analysis, and PTO damping from Equation (5) were used to solve the motion Equation (2).
The time-averaged Mth WEC power based on linear theory can be expressed as follows:
where is the optimal power take-off given by Mth WEC rotor satisfying , is the pitch response amplitude operator (RAO) (from Equation (2)) and are expressed as
is the undamped natural frequency of the pitch direction, is given by .
The interaction factor known as q-factor was used to evaluate the interaction effect of multiple WEC rotors. The energy yield can be quantified because the extracted power is directly proportional to the square of the response amplitude. Interactions are constructive with respect to energy yield when q-factor > 1, and the energy diminishes if q-factor < 1 because destructive effects appear. The q-factor response amplitude from “M” WECs () can be expressed as follows:
where is the isolated WEC rotor pitch RAO.
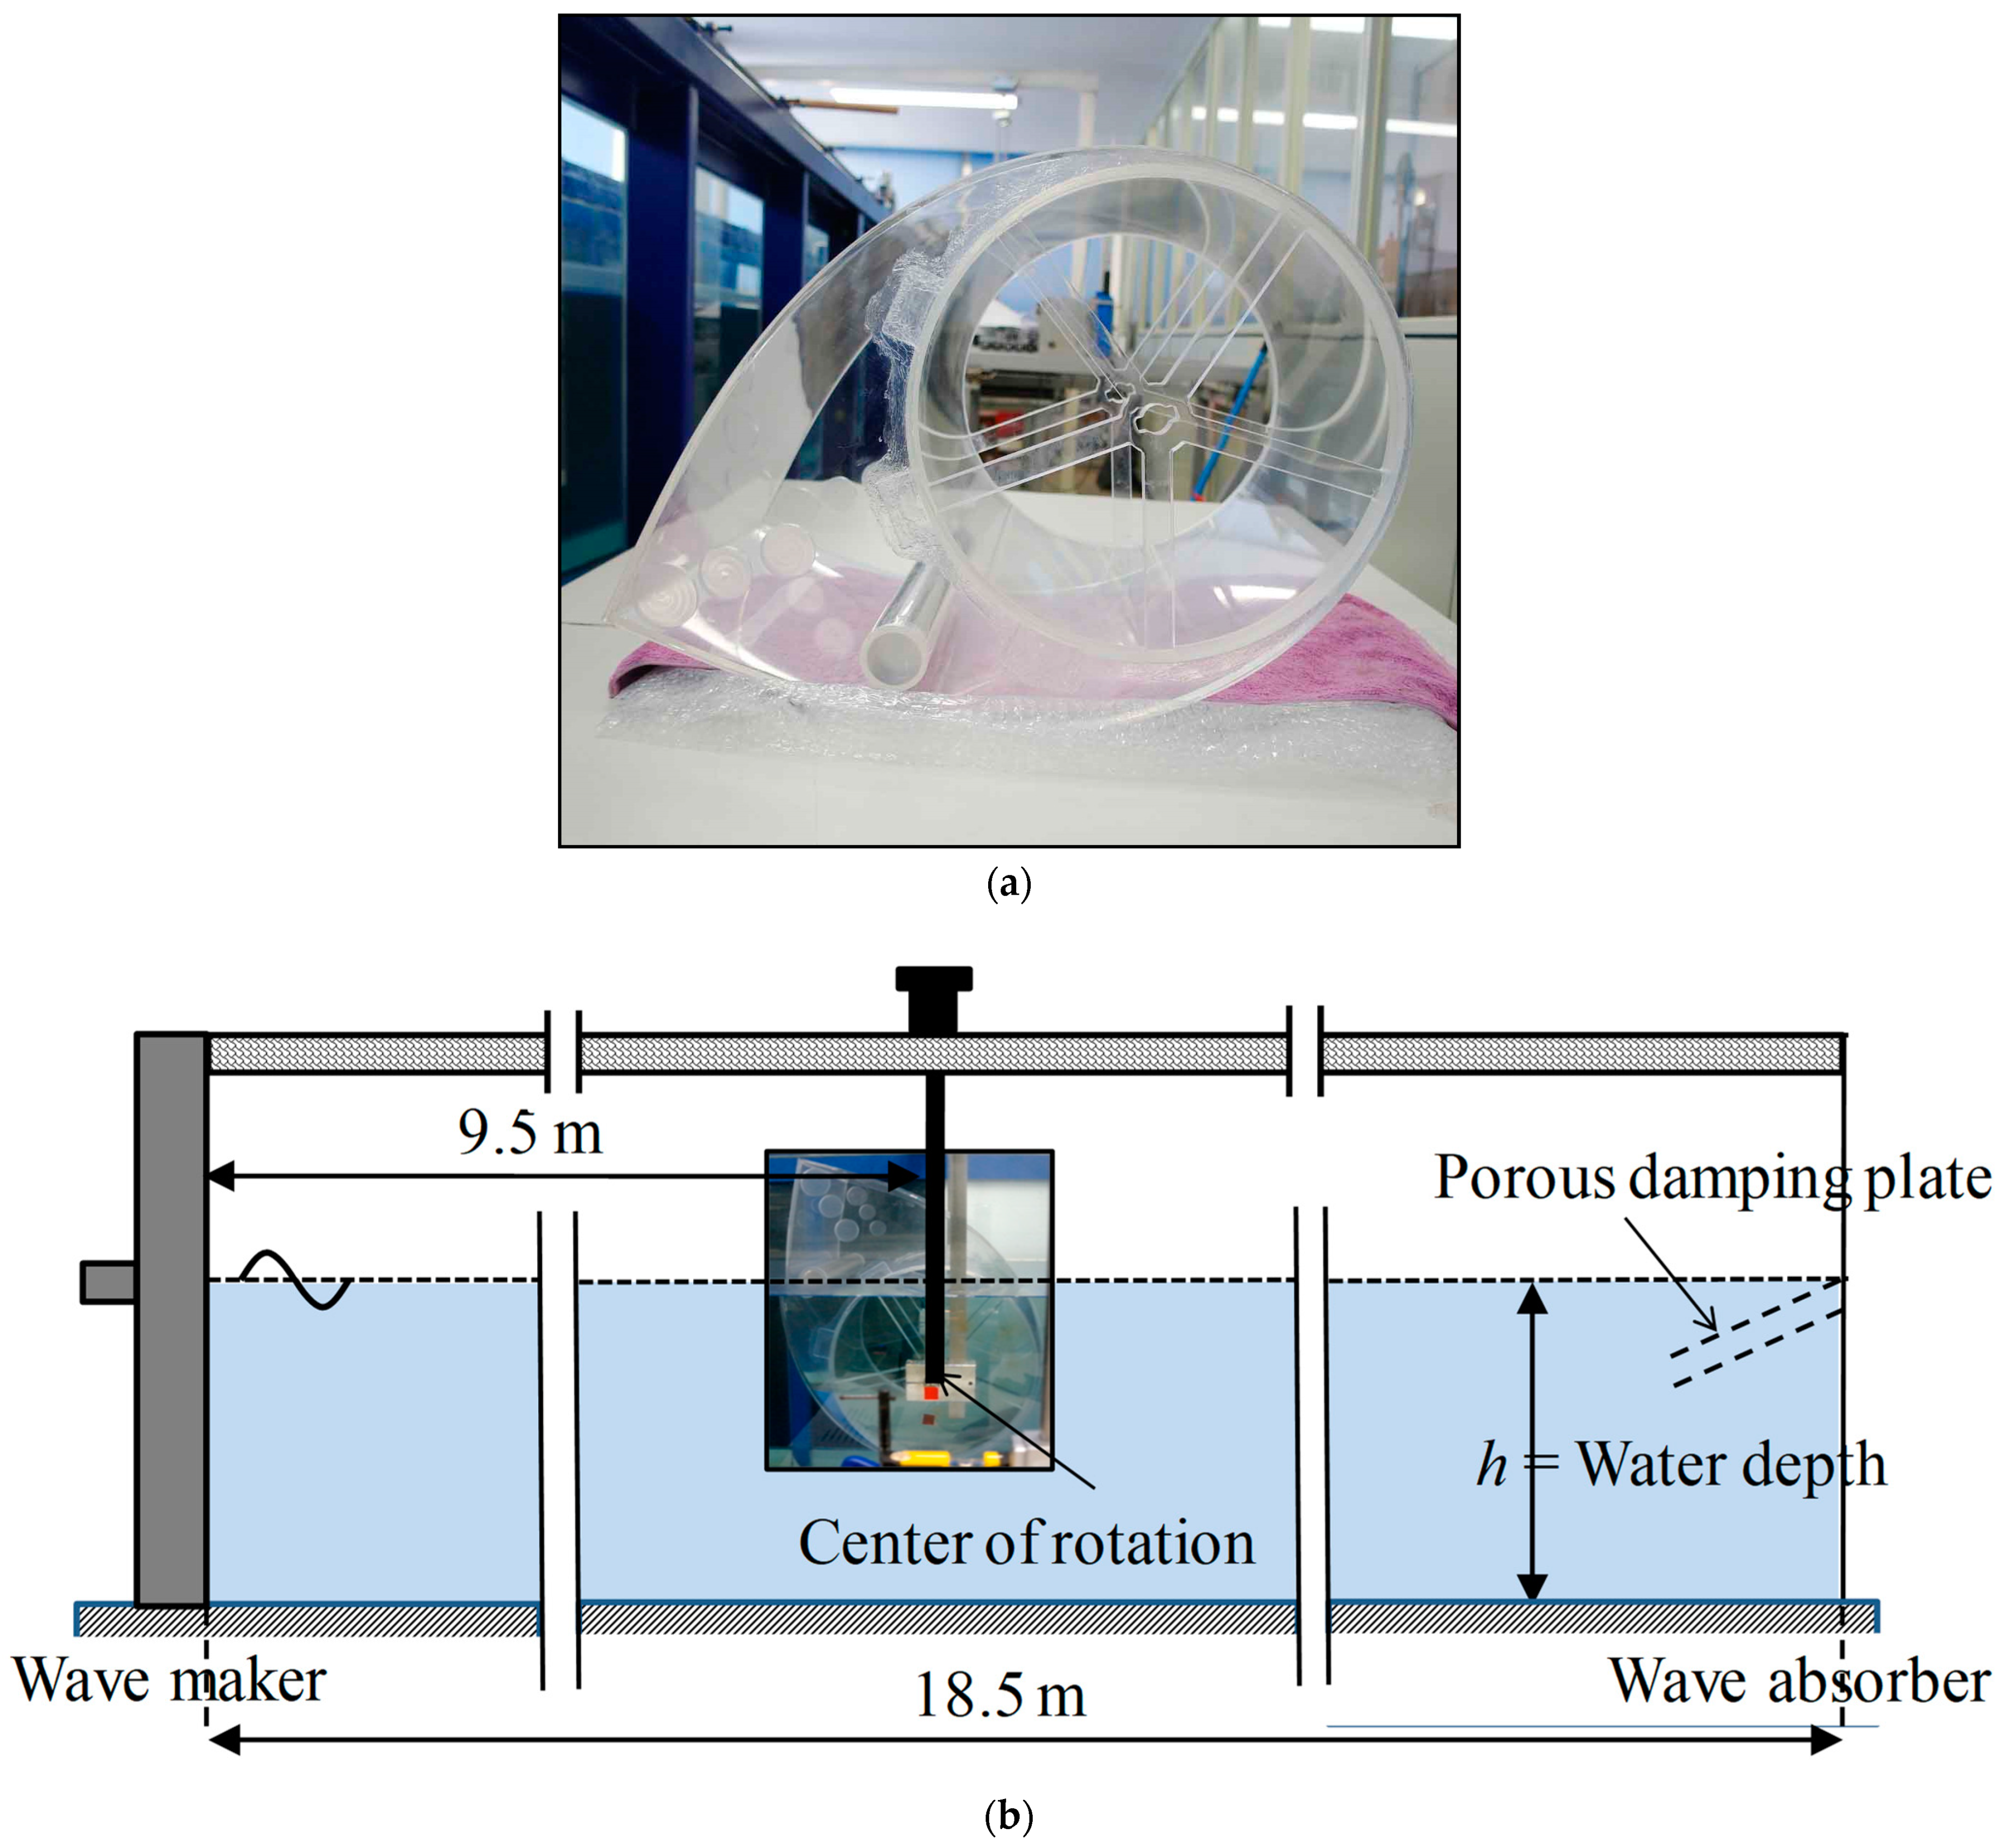
A full-scale prototype WEC rotor (see Table 1) was proposed for real-time testing at the west coast of Jeju Island, South Korea. Initial validation of numerical models on the model-scale WEC rotor is compared with the experimental results prior to the analysis of the prototype WEC rotor. Properties of the 1:11 scale-down model of the WEC rotor experimentally investigated in Jeju National University are presented in Table 1. The experimental setup of the model made of acrylic material is illustrated in Figure 3. The experimental setup consists of the following:
- The wave tank is equipped with a hydraulic piston-type wave maker at one end to generate waves and a wave absorber at the other end.
- The WEC rotates due to wave excitation around a fixed-axis shaft (y-direction) located below the waterline, and both ends of the shaft are connected to vertical rods, which are supported from the fixed frame along the wave flume.
- A ball bearing mechanism is provided for smooth rotation in the pitch motion.
- An image processing technique is used to measure the pitch motion of the WEC rotor.
3. Computational Fluid Dynamics
The problem domain is solved using three-dimensional implicit, unsteady, and incompressible Navier–Stokes equations. The computational domain is discretized into a small number of finite control volumes with a grid, which uses integral form of conservation equation. Quantities in governing equations are decomposed into their mean (Ui, P) and fluctuating () components, where Reynolds-averaged Navier–Stokes (RANS) equations along with the continuity are expressed as follows:
where the velocity field is , P is pressure, ρ is the constant density of the fluid, δij is Kronecker delta function and is the kinematic viscosity of the fluid.
The WEC is allowed to move by only a single degree-of-freedom in the pitch around the y-axis where the rigid body motion was carried out using dynamic fluid body interaction. The motion equation of the Mth WEC rotor is expressed as follows:
where is the moment of inertia of the Mth WEC rotor, is the angular velocity of the Mth WEC rotor, is the resultant moment acting on the Mth WEC rotor, and is the external damping moment of the Mth WEC rotor.
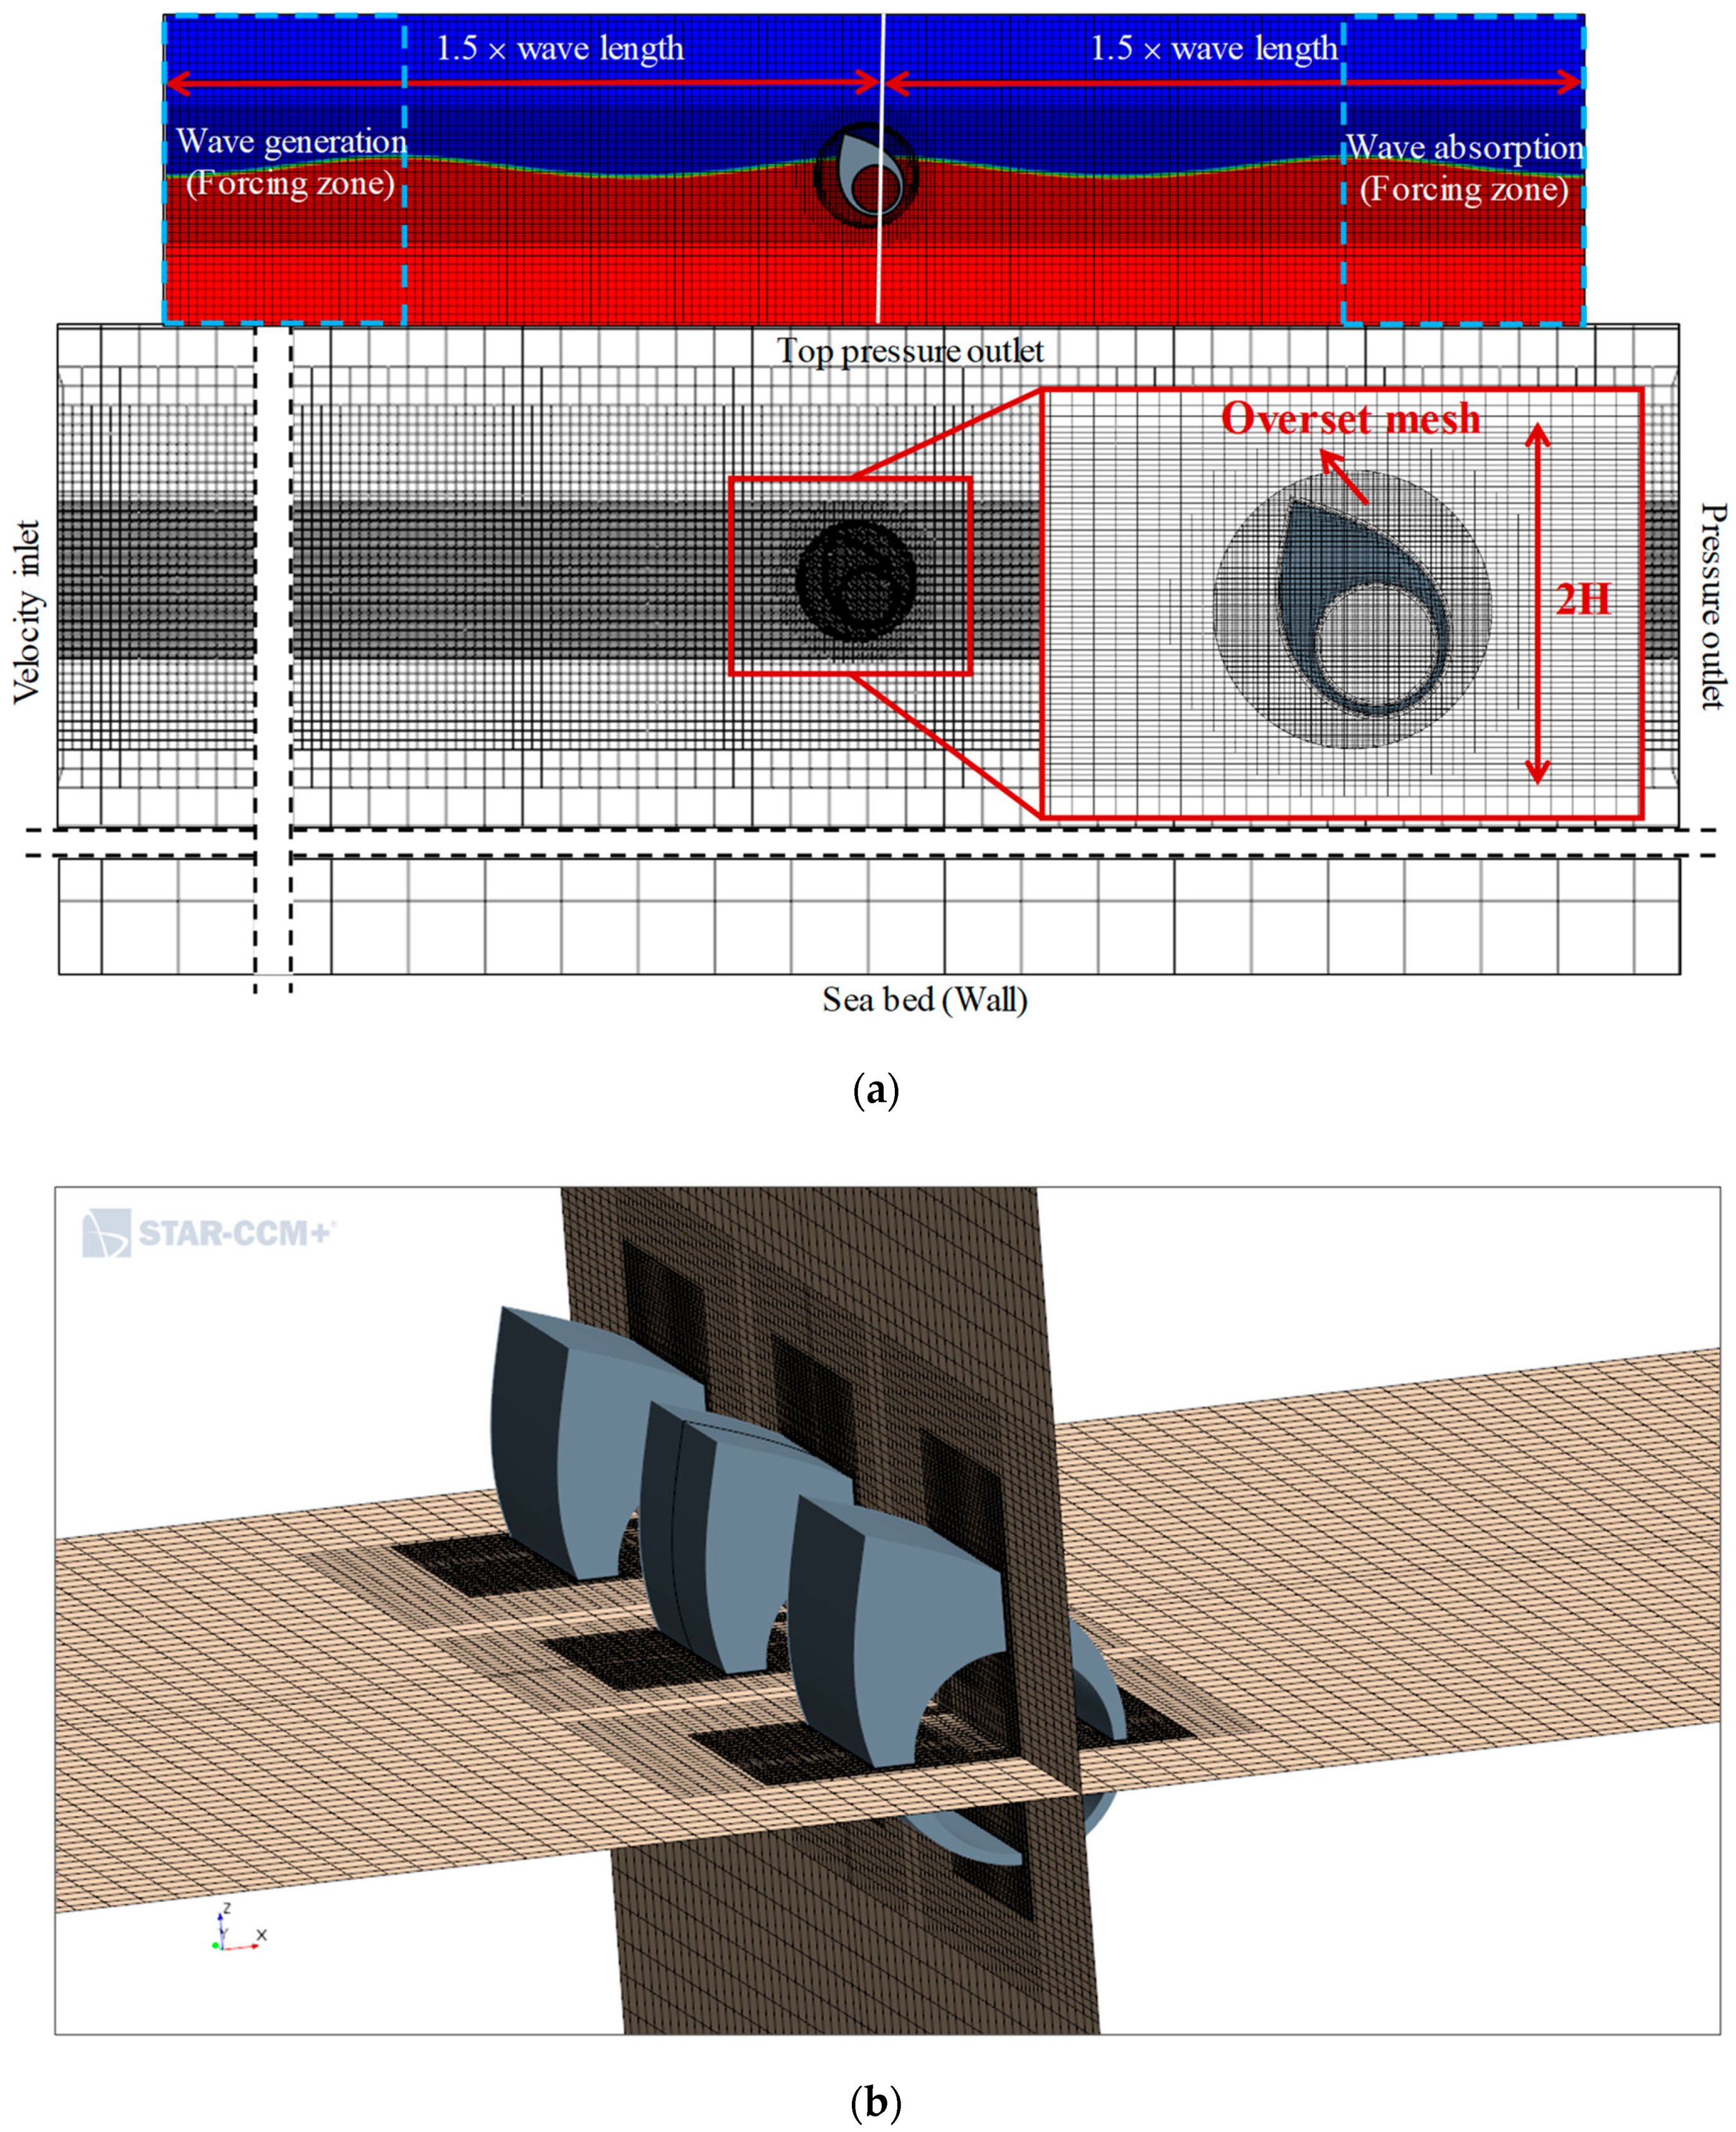
The computational domain is set in the Cartesian coordinate system Oxyz with the origin located at the COR of the center WEC rotor 2, where the x-direction is the propagation of the wave from the negative x-axis to the positive x-axis and positive z-axis pointing upwards. For prototype WEC rotor see Table 1, three-dimensional numerical wave tank (NWT) is used to generate desired waves, and the flow is controlled by boundary conditions assigned to different regions in the domain, as shown in Figure 4a. The velocity inlet is located at the upstream side of the model, while the pressure outlet boundary is found in the downstream side; the top is a pressure outlet and all other boundaries are wall boundaries except the y = 0 symmetry. Wave forcing was applied at inlet and outlet boundaries with 0.5 × λ, where λ is the wave length. The forcing is performed using fifth-order Stokes wave theory. The middle portion in the vicinity of the WEC rotor of the computational domain was chosen as 2 × λ. Fifth-order Stokes waves were generated to represent realistic regular waves. Water depth is fixed at 40 m.
A gap equal to the width of the WEC rotor between the WEC rotor 3 and the wall in the y-direction was considered for all test cases. An overset meshing strategy was selected to address the WEC response. An overset mesh typically contains a WEC rotor superimposed on a background mesh containing the surrounding geometry and data are interpolated between the two meshes [32]. Multiple overset regions are created for each WEC rotor in the present study. Only half of the computational domain was chosen due to the symmetrical configuration of the xz-plane, and this cannot be implemented when the wave-heading is different from zero. Component grids are allowed to overlap and flow field information is transmitted from one grid to another through the overlap region. A mesh size that matches the overset boundary must be maintained to use this method effectively because conservation issues will occur when large discrepancies exist in the mesh size the grid technique. The cell size along x-(Δx/Δz) and y-(Δy/Δz) directions was set to 4 to minimize conservation errors (Figure 4a,b). The cell size in overset regions and the background was matched using overlapping reason. Linear interpolation technique is used to transfer the information between the two grids. The cell size around the WEC rotor is reduced to 15% of the basic cell size of the overset region (base size = 1.0 m), and three cells within the prism layer were generated. All − y+ wall along with the two-equation low-Re model was adopted for simulations. Automatic convective Courant–Friedrichs–Levy (CFL) was utilized to stabilize the numerical solution and choose a suitable time step. The time integration is based on a second-order implicit scheme with 10 inner iterations per time step is adopted. The volume of fluid (VOF) is used to handle the free surface interface between the two immiscible fluids (water and air) and to improve the interface tracking high-resolution interface capturing, along with interface momentum dissipation, is used.
4. Results and Discussion
4.1. Validation
Adopted numerical models of the linear BEM and nonlinear CFD were validated with the experimental results, and for the investigation a single WEC rotor without PTO damping was used. The advantage of any numerical model can be nullified if unsuitable settings are selected. The first and second authors performed an in-depth sensitivity analysis on the single WEC rotor and compared the linear BEM and nonlinear CFD results with the findings in the literature and experimental results in Poguluri and Bae and Poguluri et al., respectively [27,28]. The details of the NWT used for validation can be found in [28].
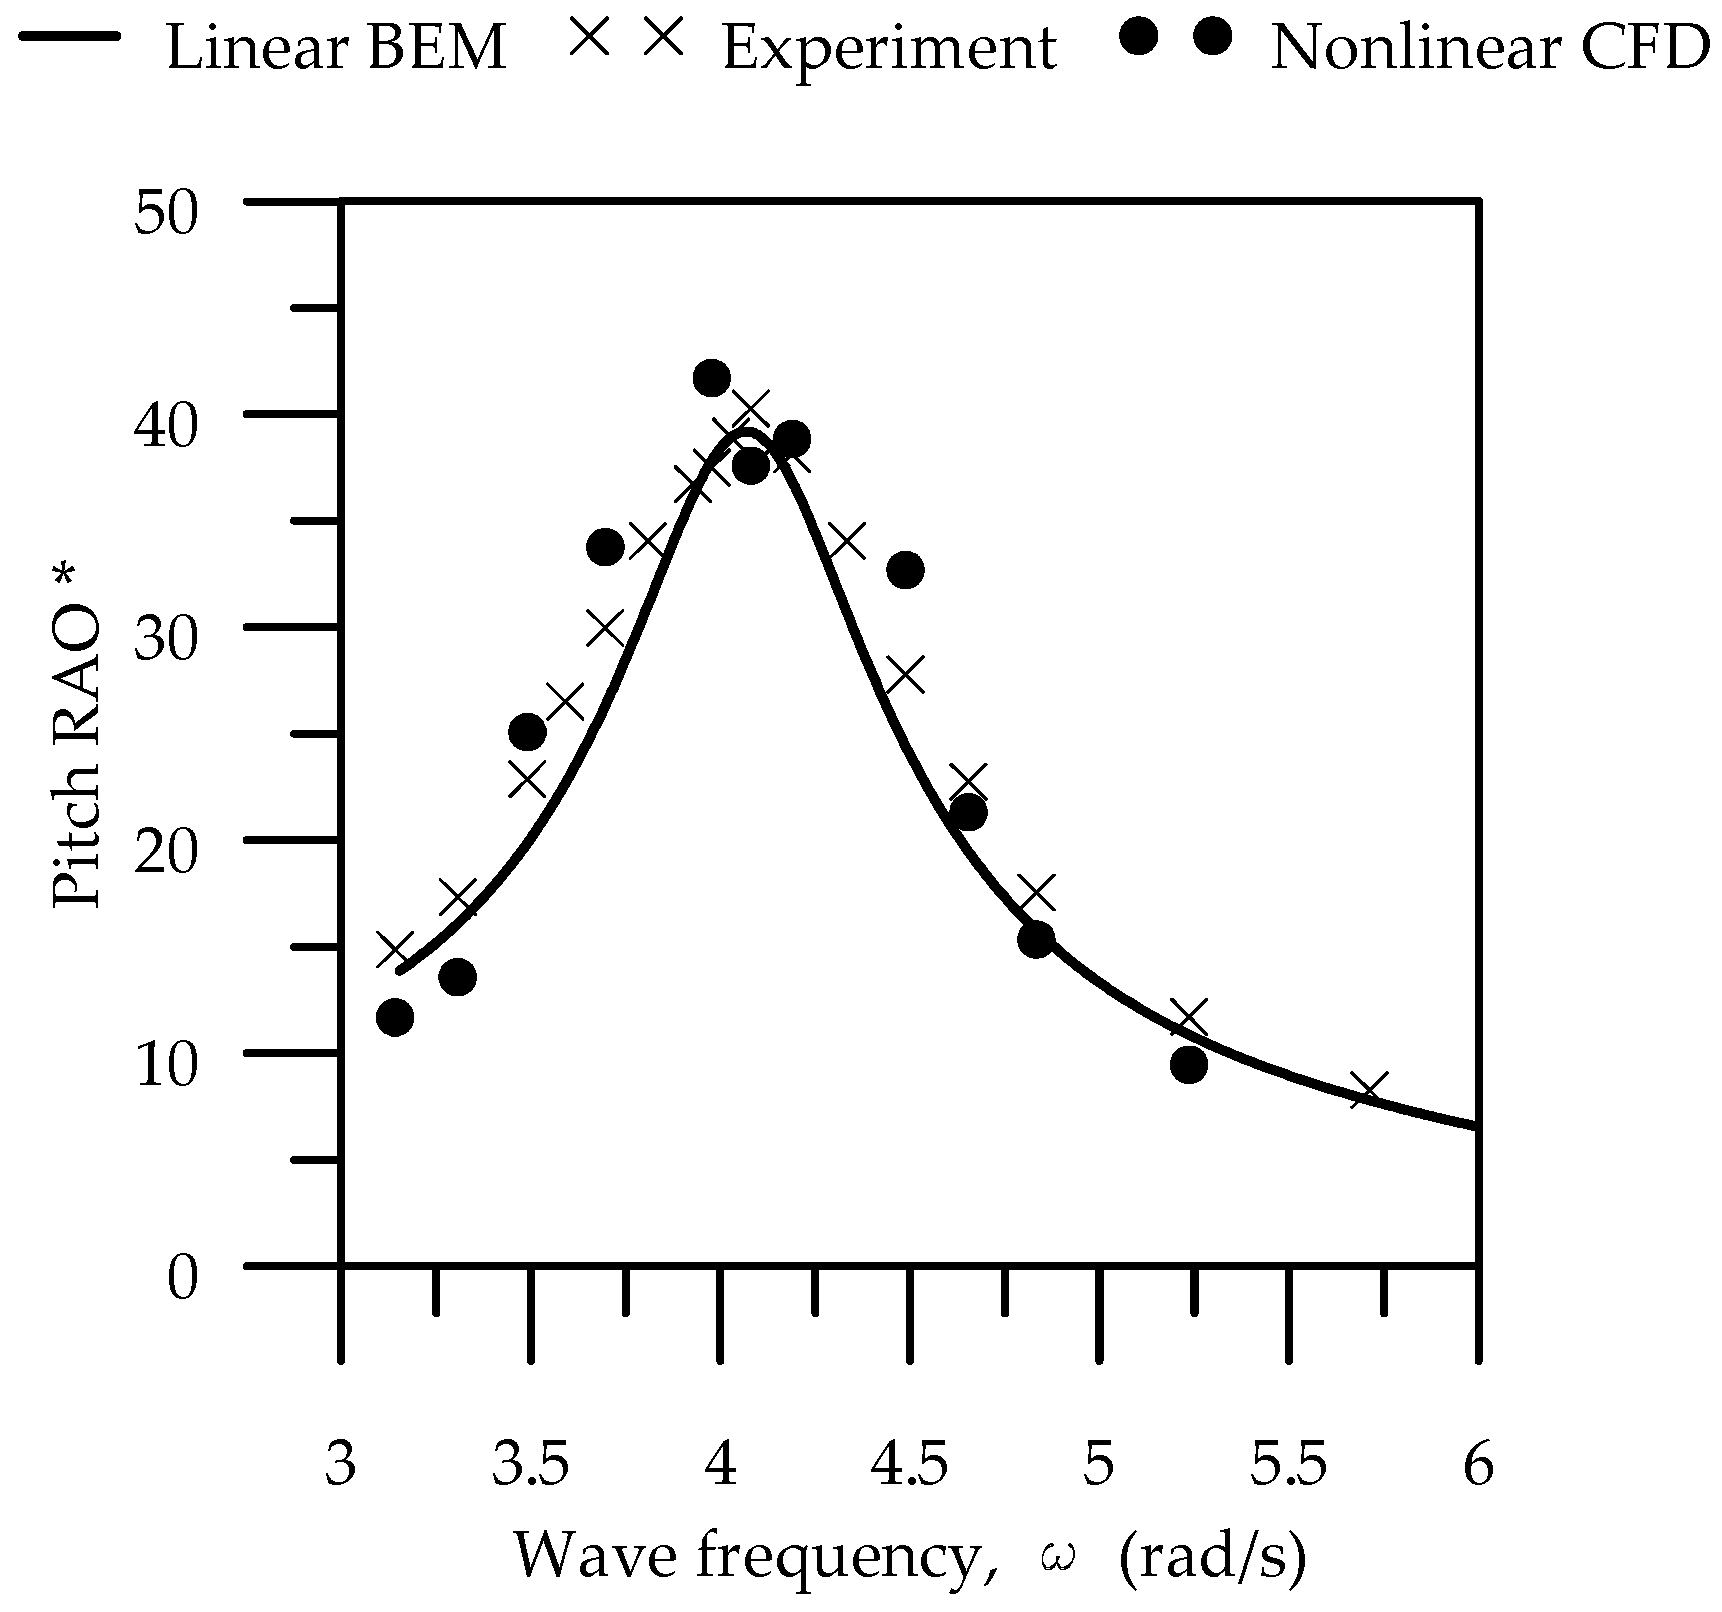
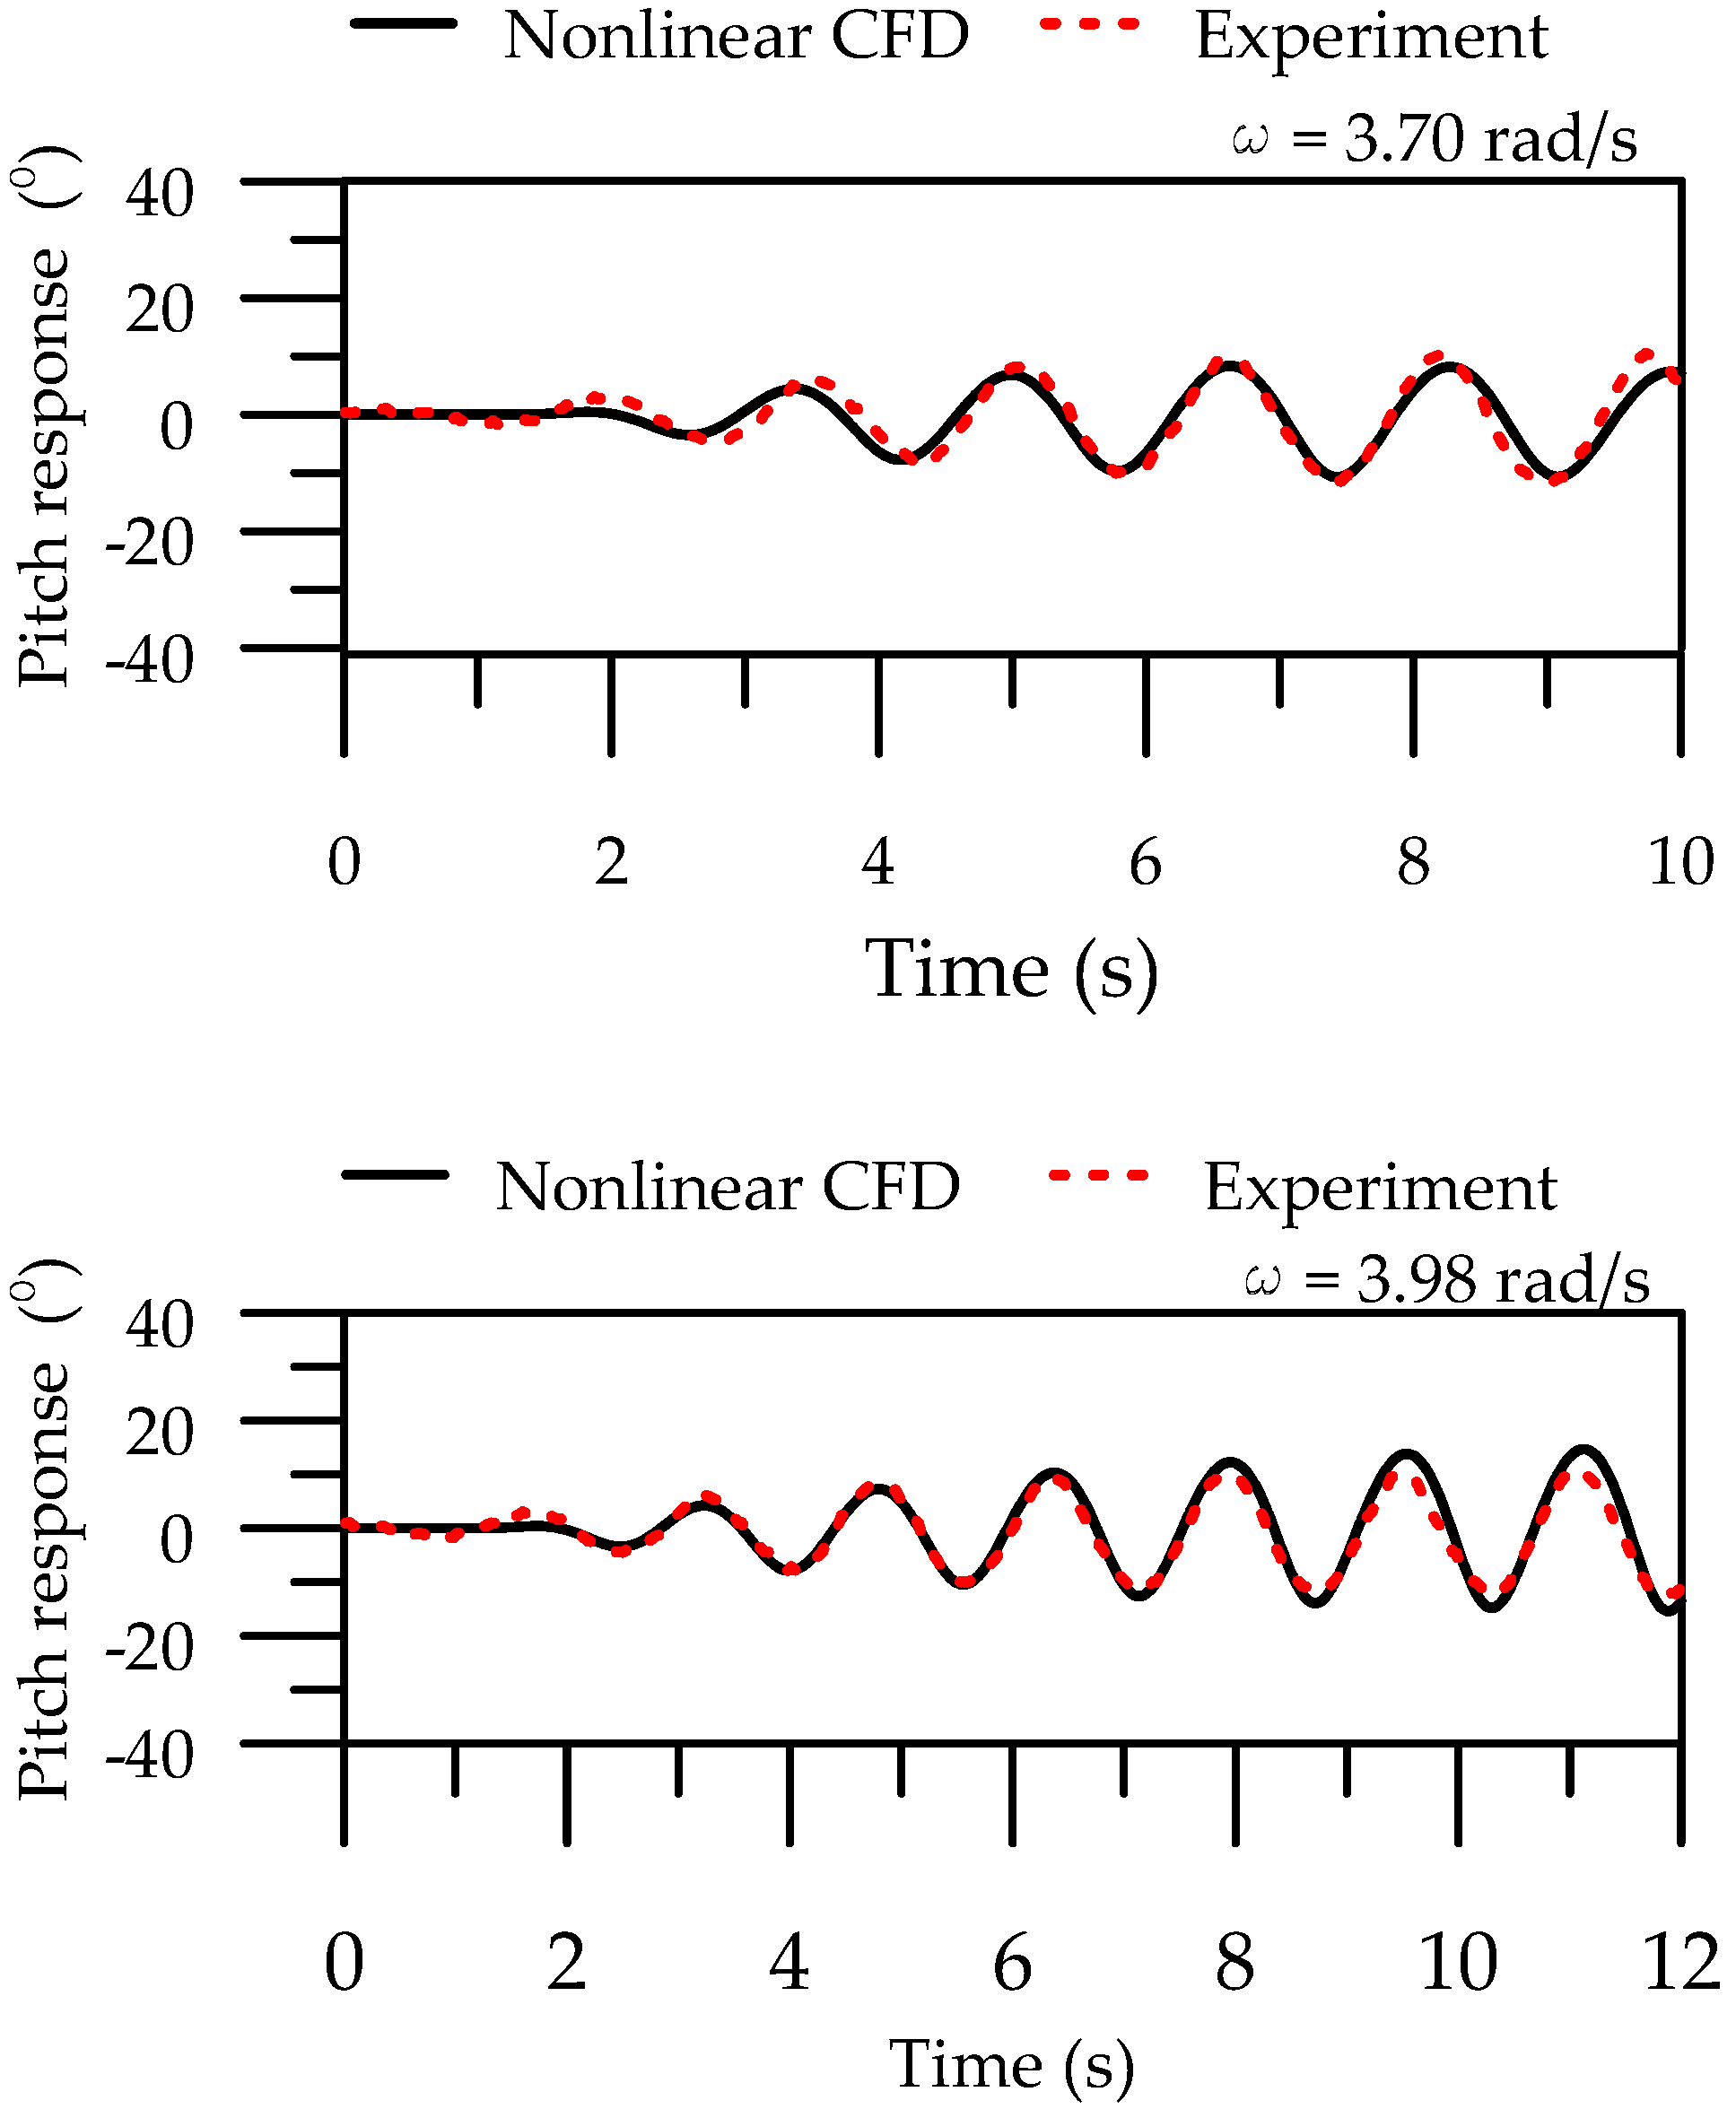
The WEC rotor in the linear BEM is discretized with 1200 panels using Multi-surf, and only half of the model was used for analysis due to the symmetry of the xz-plane. The damping ratio of 0.0849 and the corresponding viscous damping value of 4.113 N⋅m⋅s/rad were obtained from the experimental free decay test conducted by Kim et al. [31]. The influence of domain, mesh size, mesh moving strategy around the WEC rotor, and associated domain boundary conditions in nonlinear CFD simulations were referred to in [28] and omitted in the present paper. Tests are conducted with the following fixed wave parameters: wave frequency range: 3.25–6.0 rad/s, wave amplitude (a): 0.005 m, and water depth (h): 0.6 m. Non-dimensional pitch RAO *, (, where L is the characteristic length of the model equal to 1) in the experiments was plotted along with the linear BEM and nonlinear CFD results for different wave frequencies, as shown in Figure 5. The chosen value of the damping ratio was based on the acceptable match between the maximum pitch motion response of the WEC rotor and the experimental results; see [31]. Consistency between the linear BEM results and the experimental and nonlinear CFD findings is only possible when incident, diffracted, and radiated waves are linear and the same with the present chosen wave frequencies. The means of three to four cycles of the steady solution from the nonlinear CFD and experimental results were used to obtain the single value of the pitch response. The present linear BEM and nonlinear CFD results are consistent with the experimental results except at wave frequencies close to the resonance region. The nonlinear CFD and experimental results slightly overestimate the non-dimensional RAO compared with the linear BEM but the overall consistency was relatively acceptable. Furthermore, the time history of the pitch response of the WEC rotor is compared with the experimental results for two wave frequencies of 3.70 and 3.98 rad/s (see Figure 6). The pitching response of the WEC rotor was acceptable for four cycles compared with the experimental results. The experimental pitch response was then affected by wave reflections from both ends of the wave flume and eventually led to differences in amplitude and phase. In the foregoing sections, additional investigations on the prototype isolated and multiple WEC rotors will be carried out by retaining most of the numerical settings of the model unless otherwise mentioned.
4.2. Multiple WEC Rotors
4.2.1. Linear BEM Results
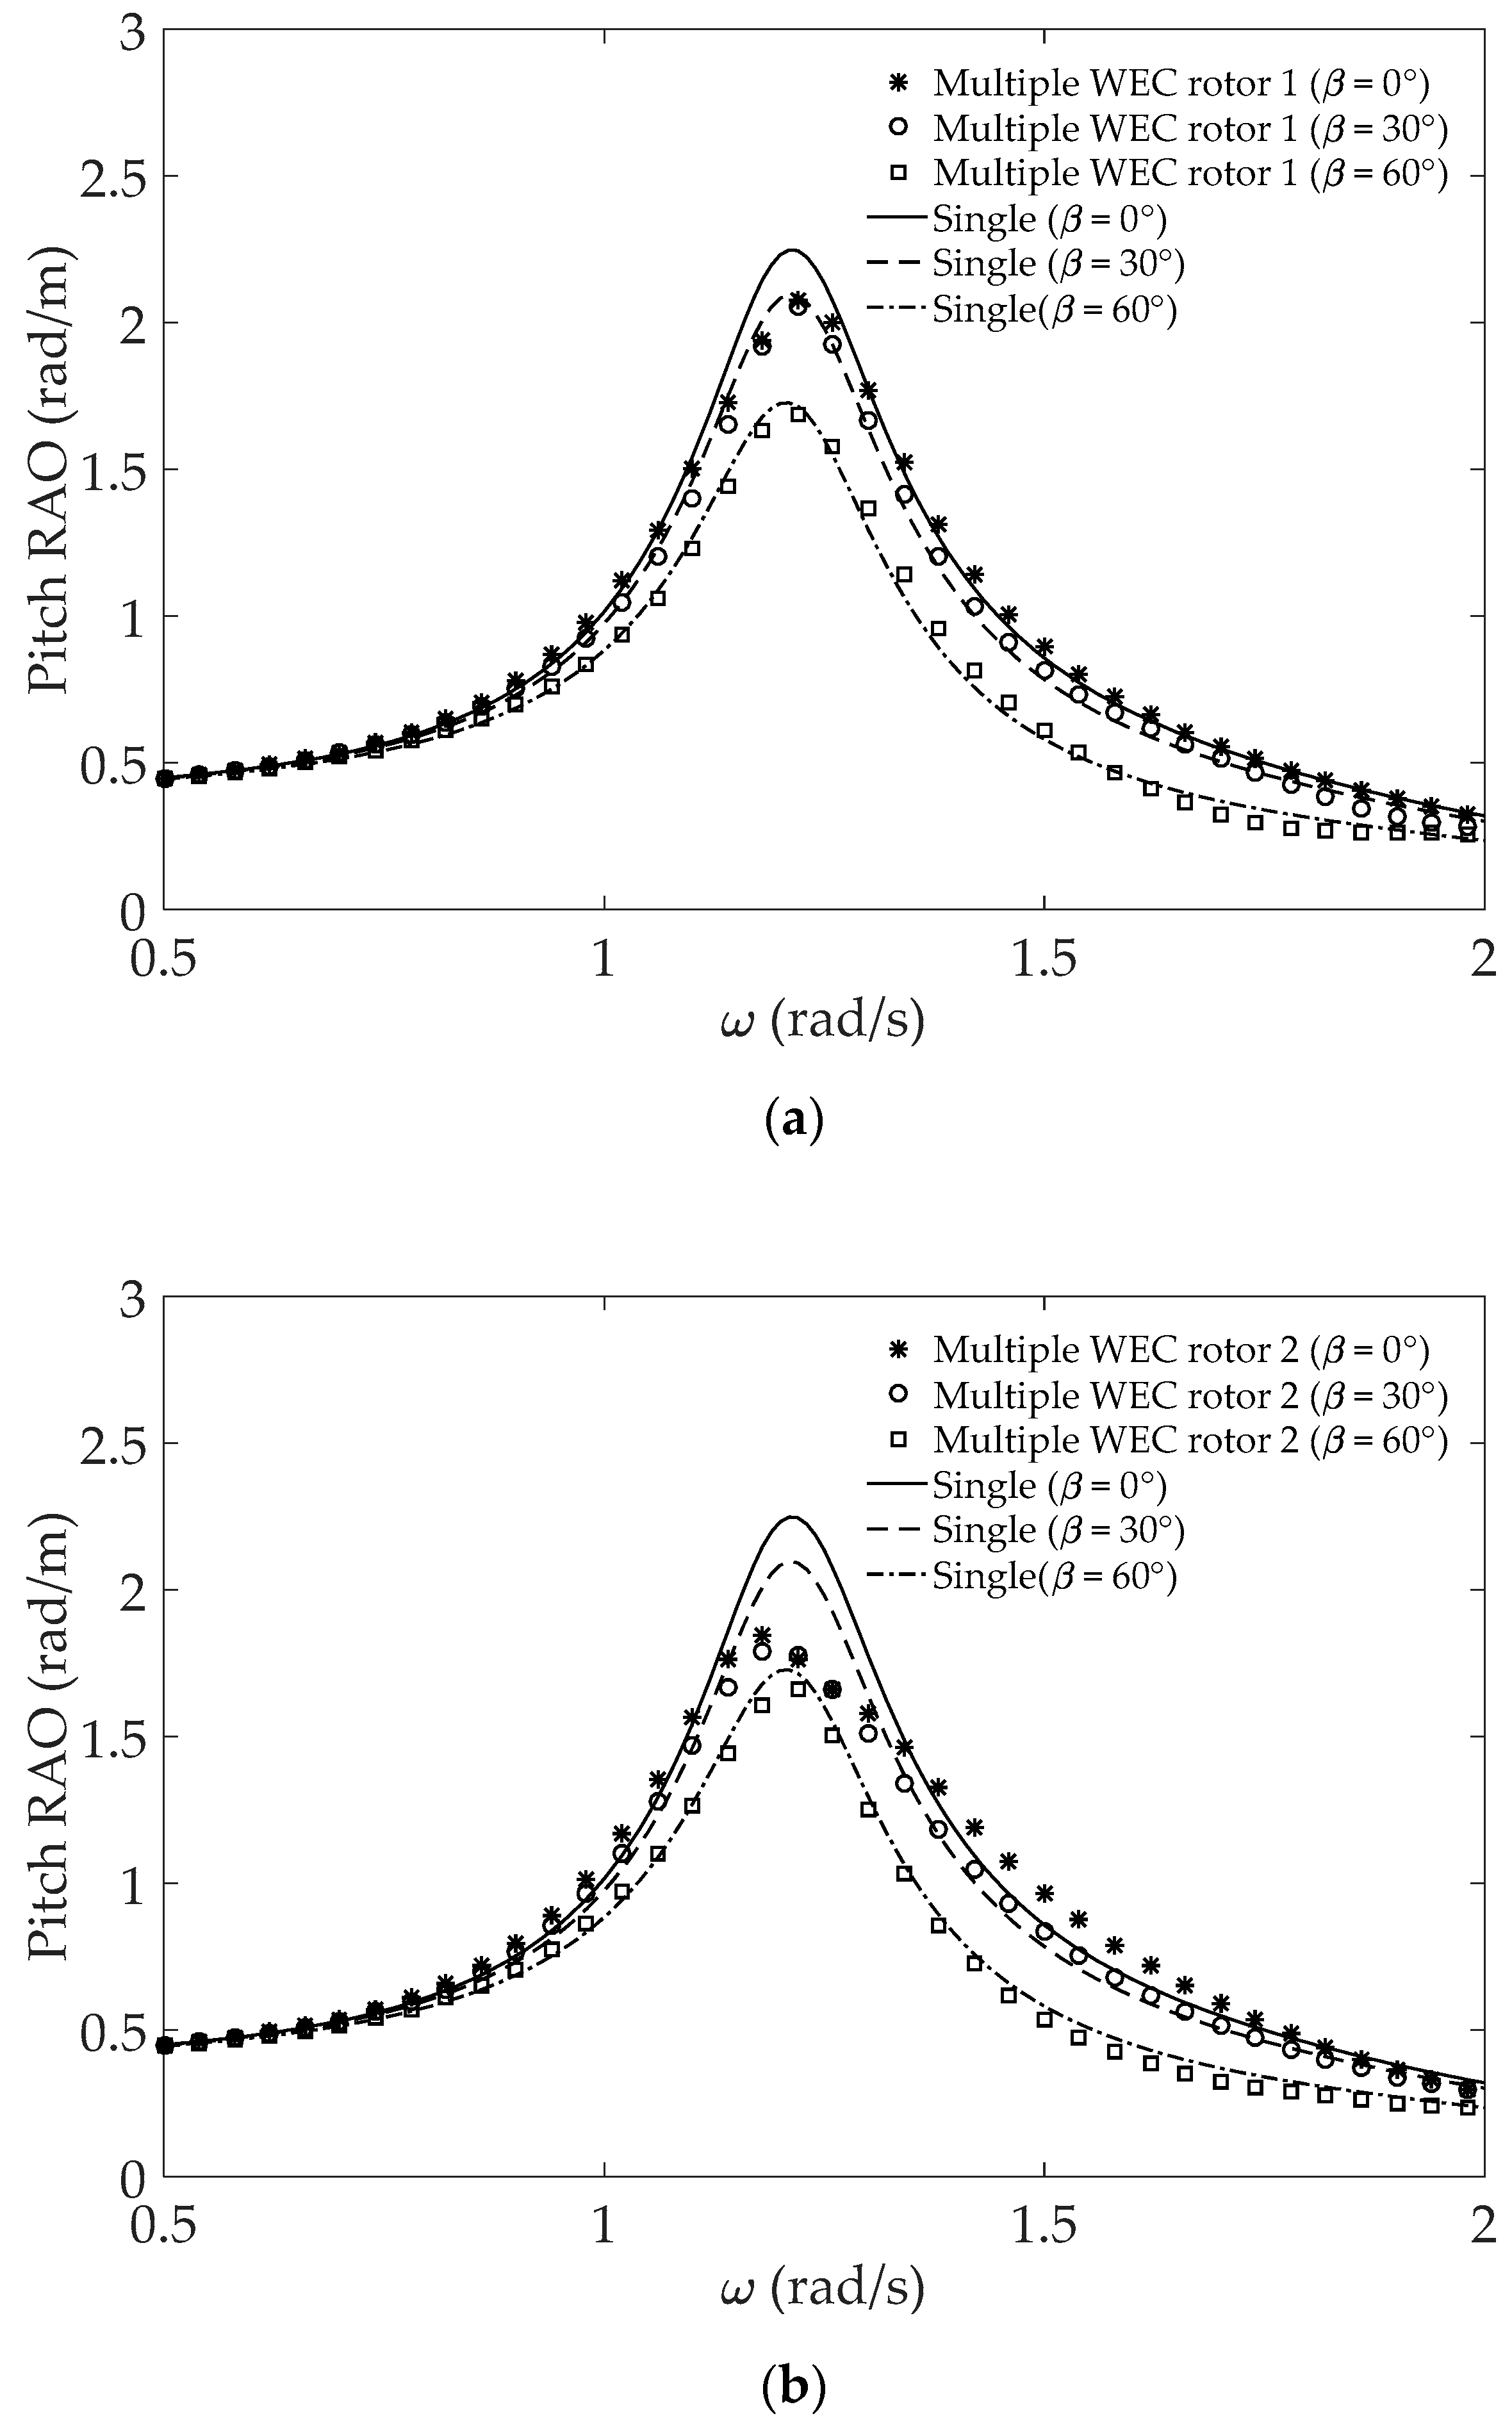
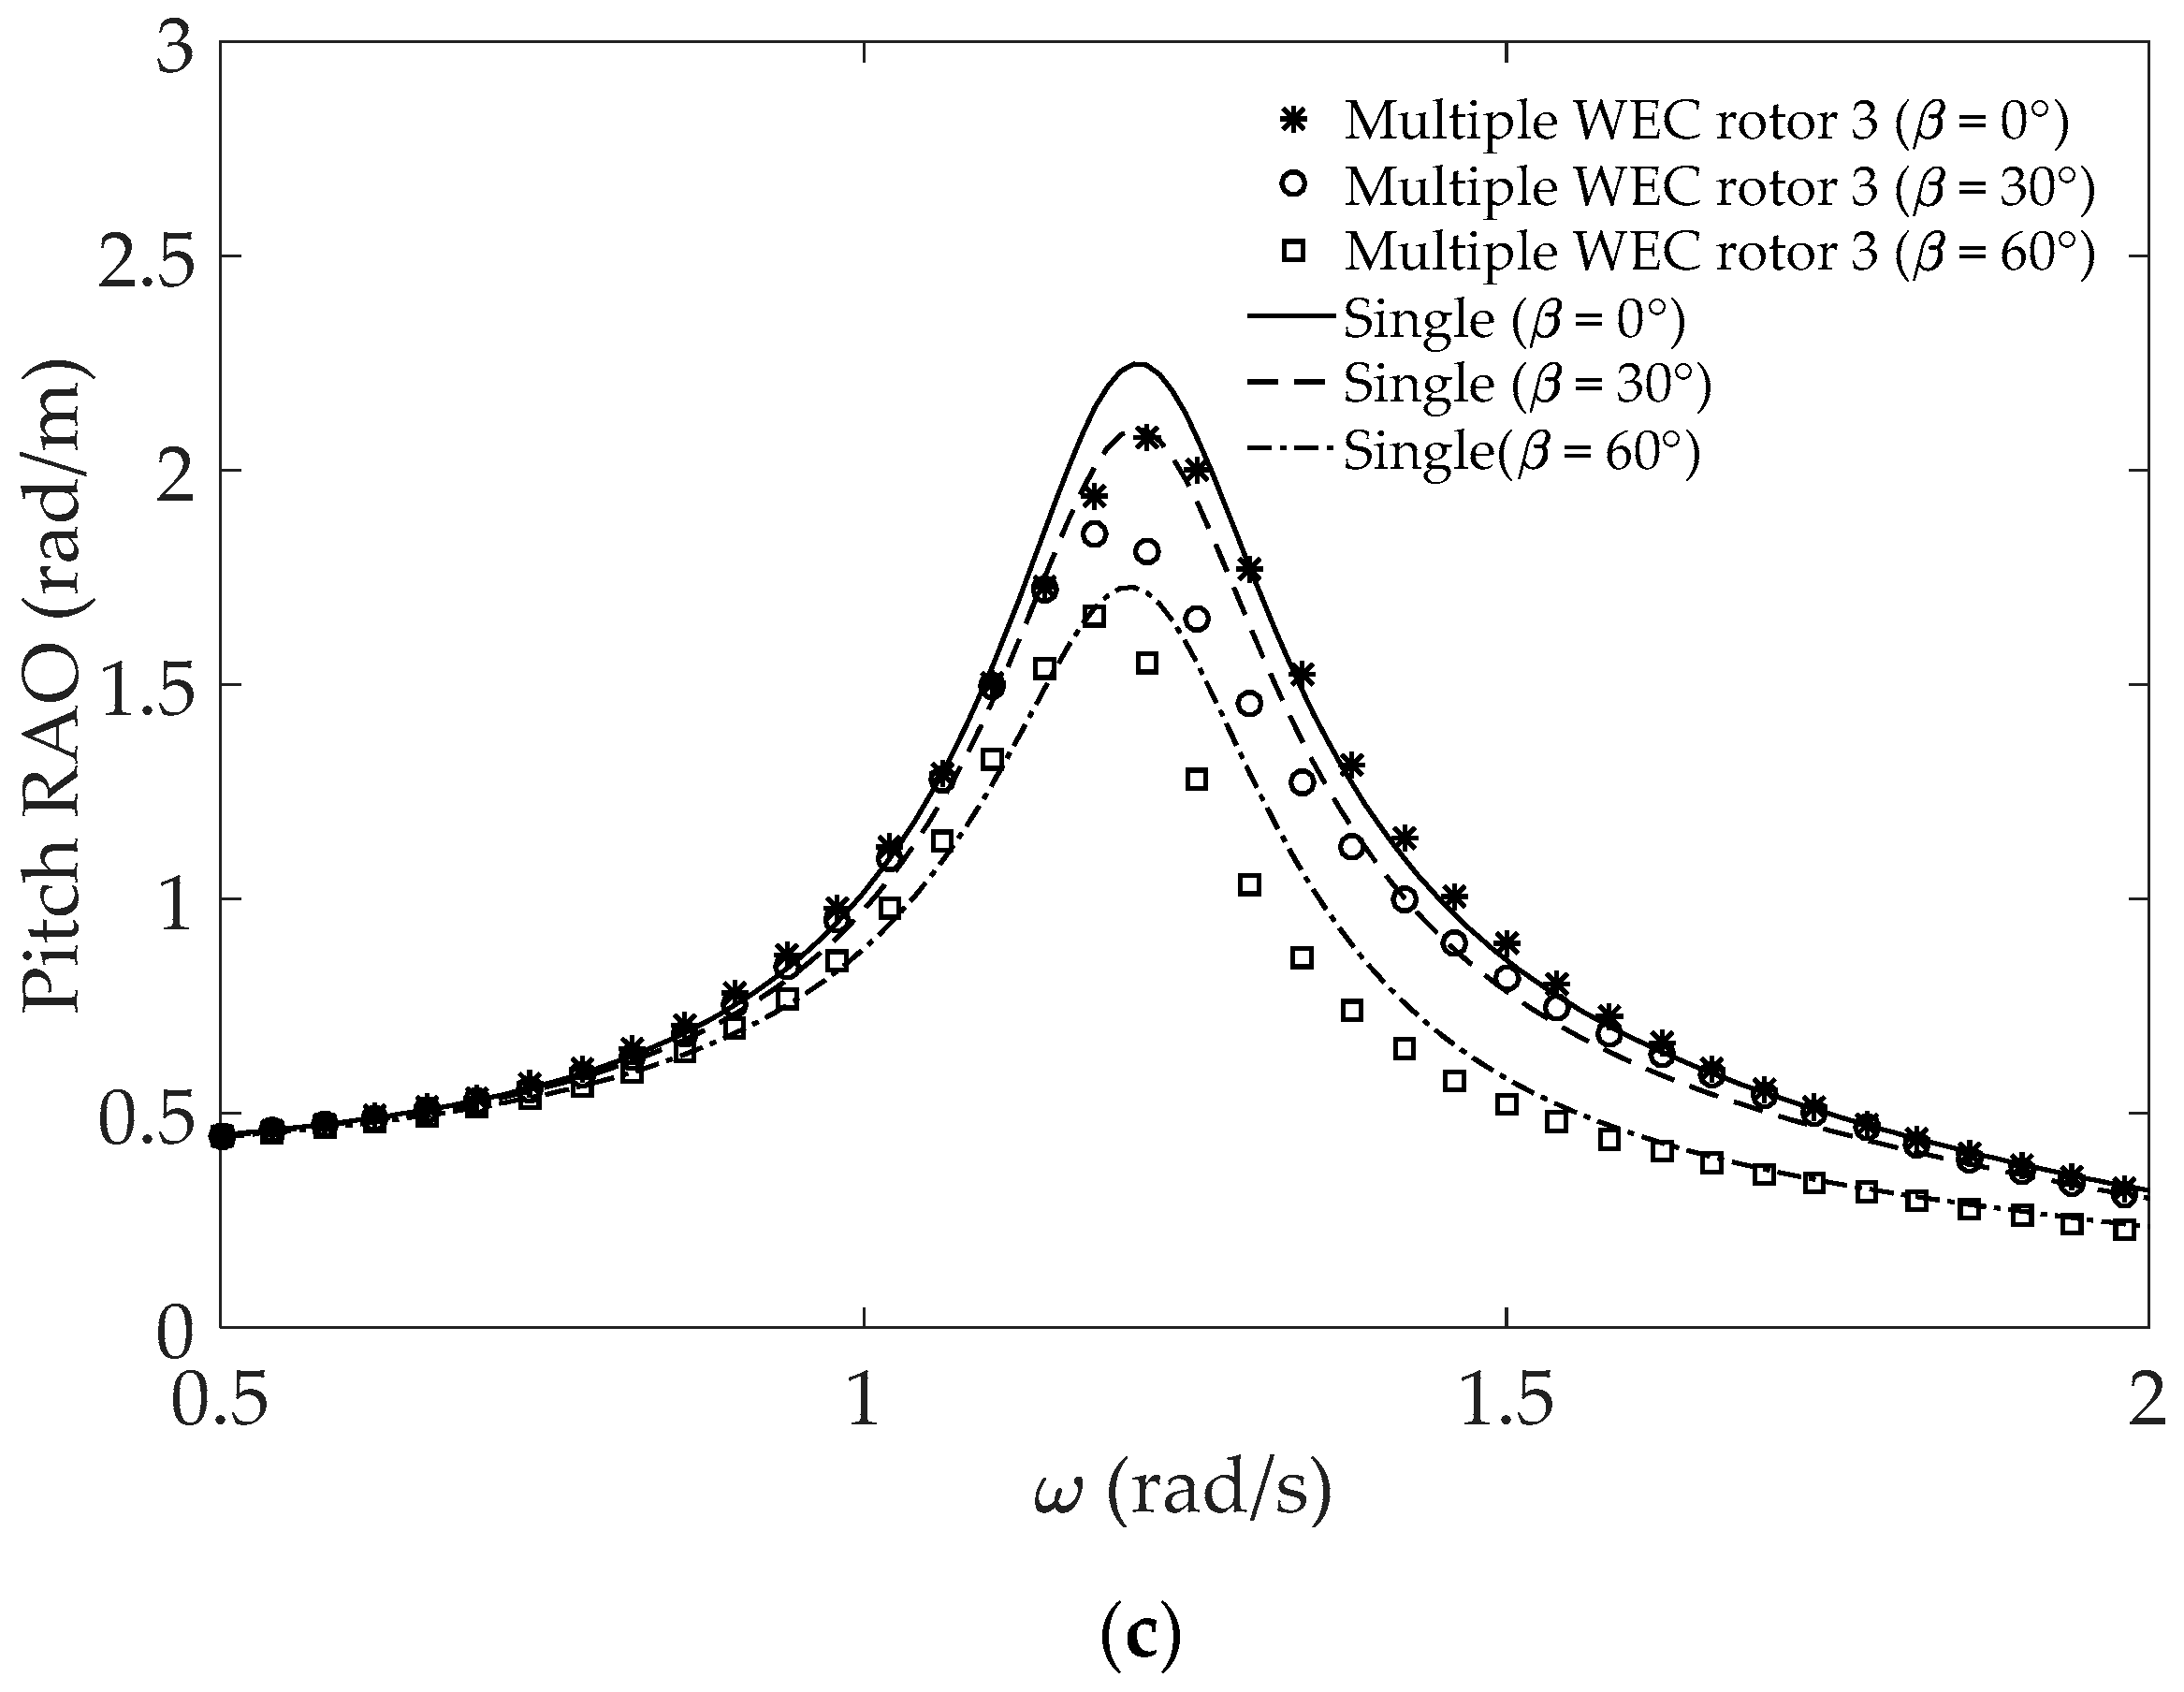
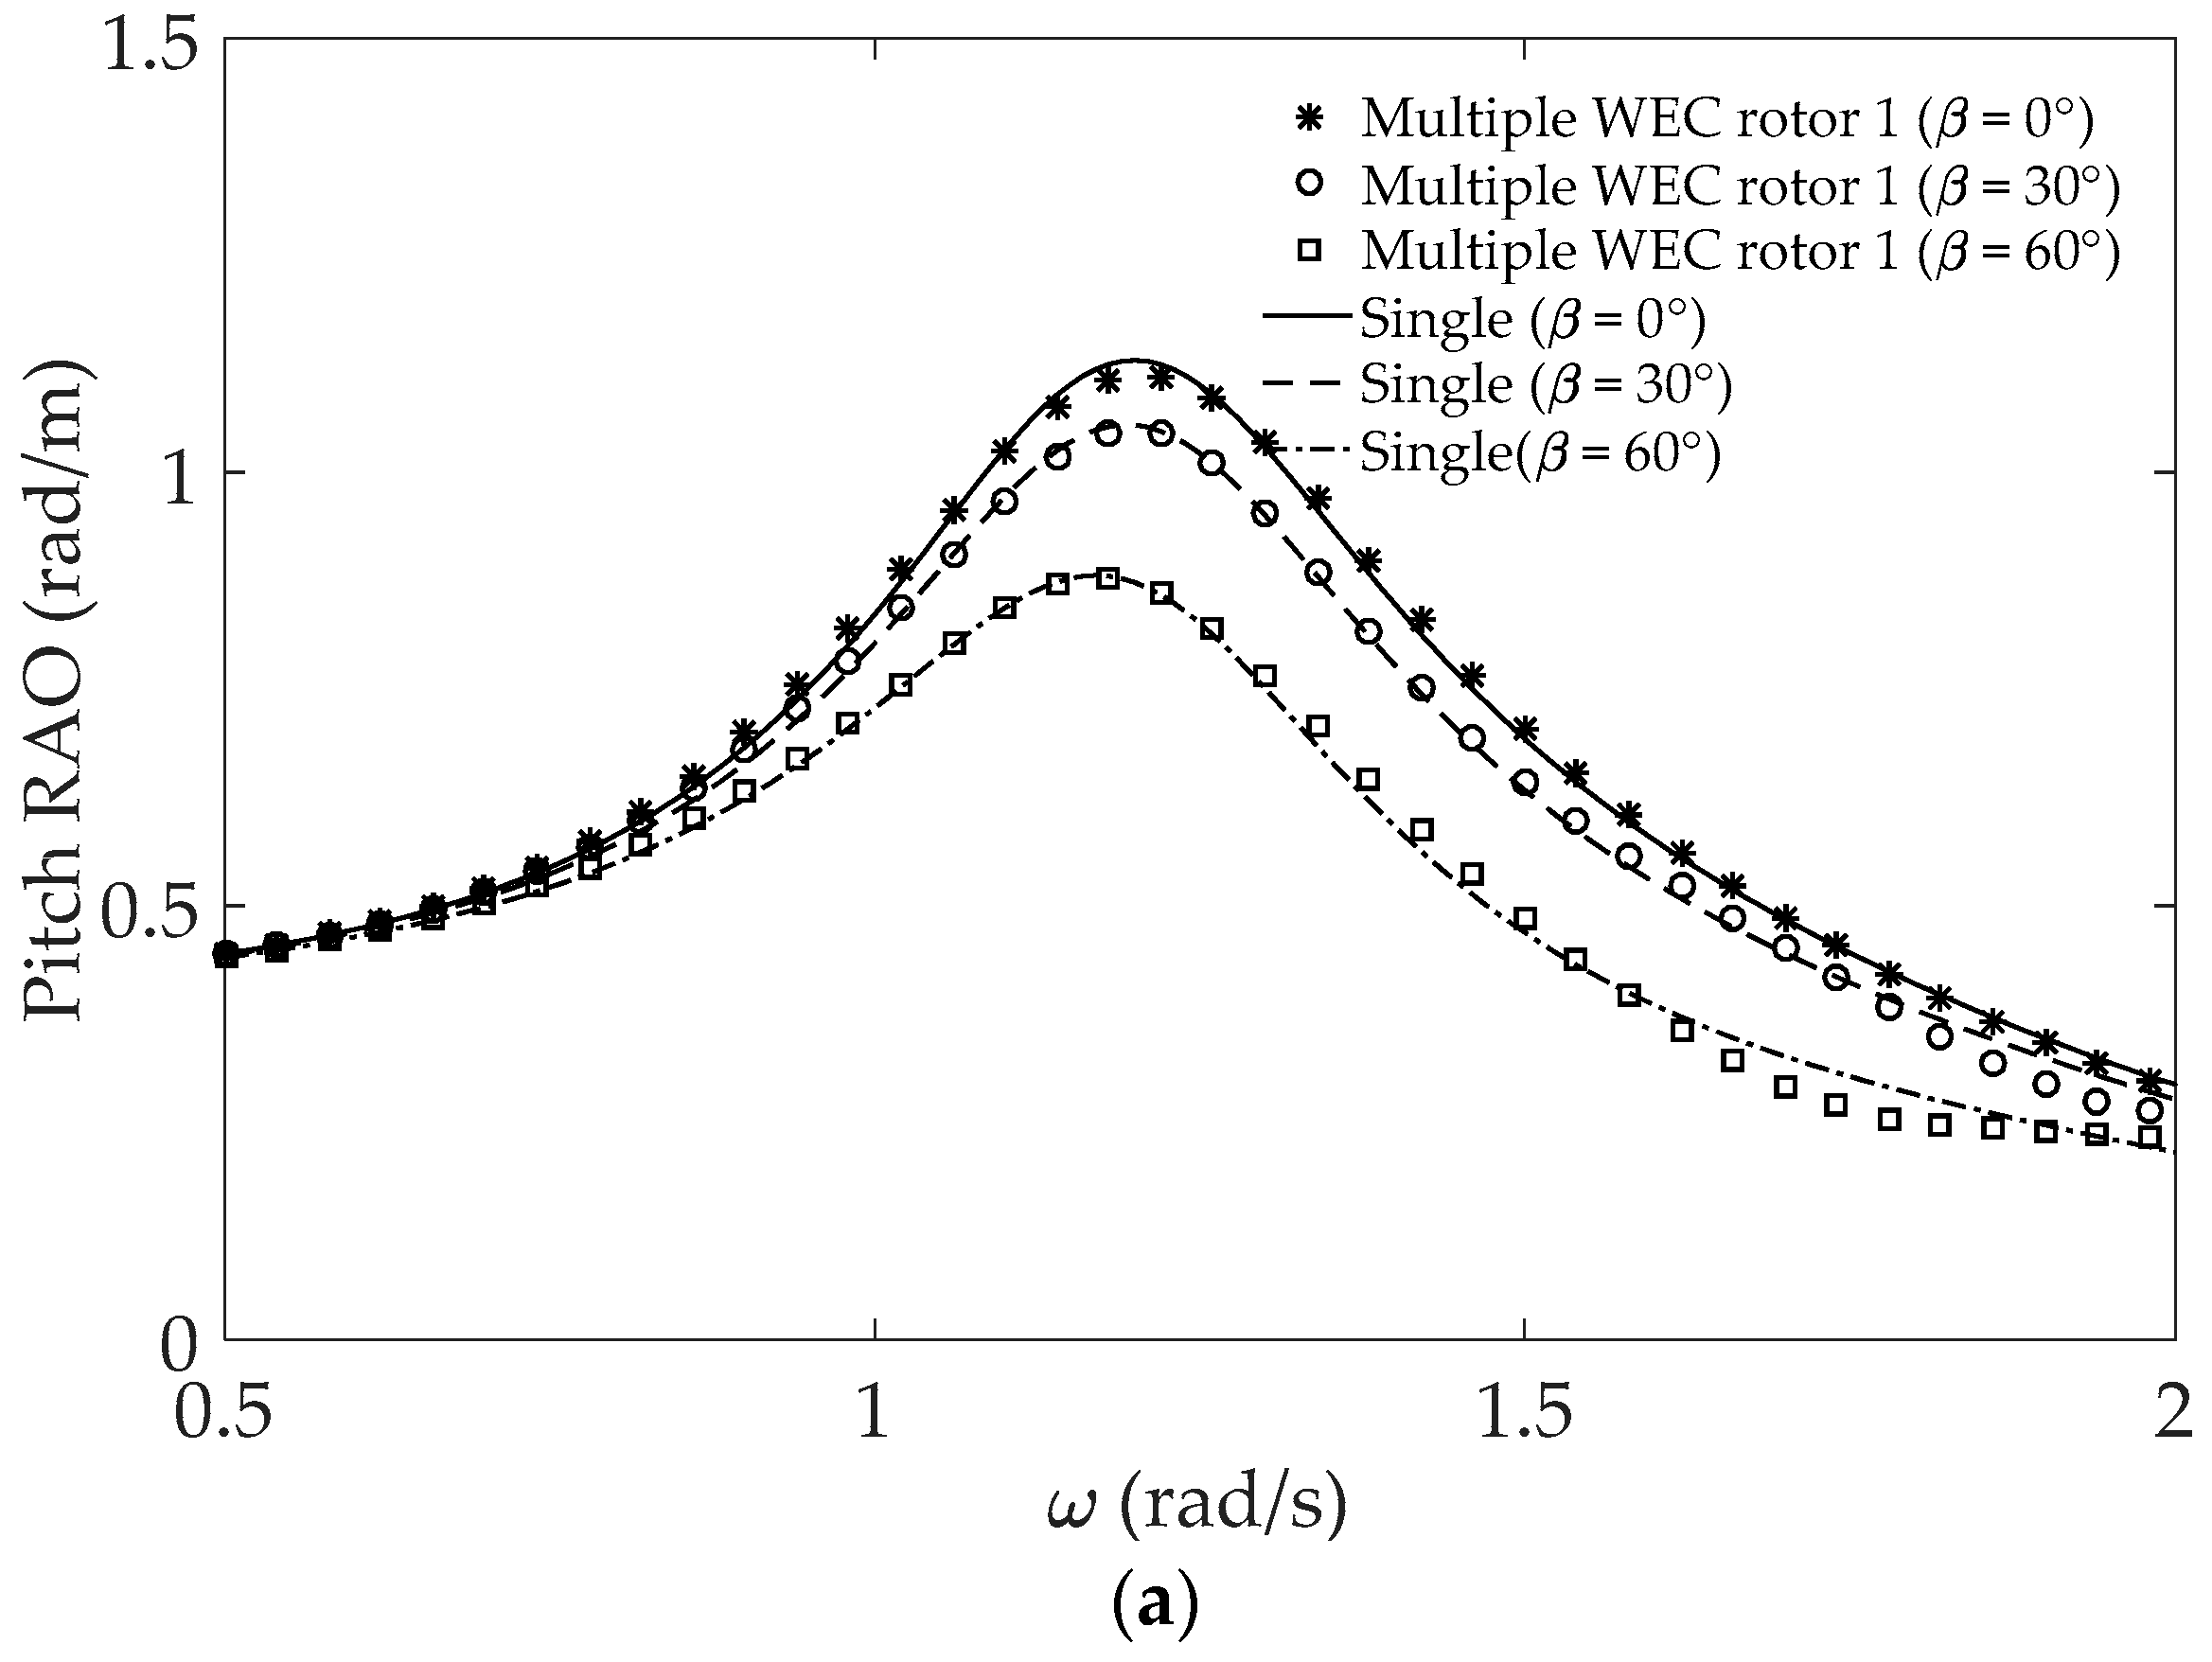
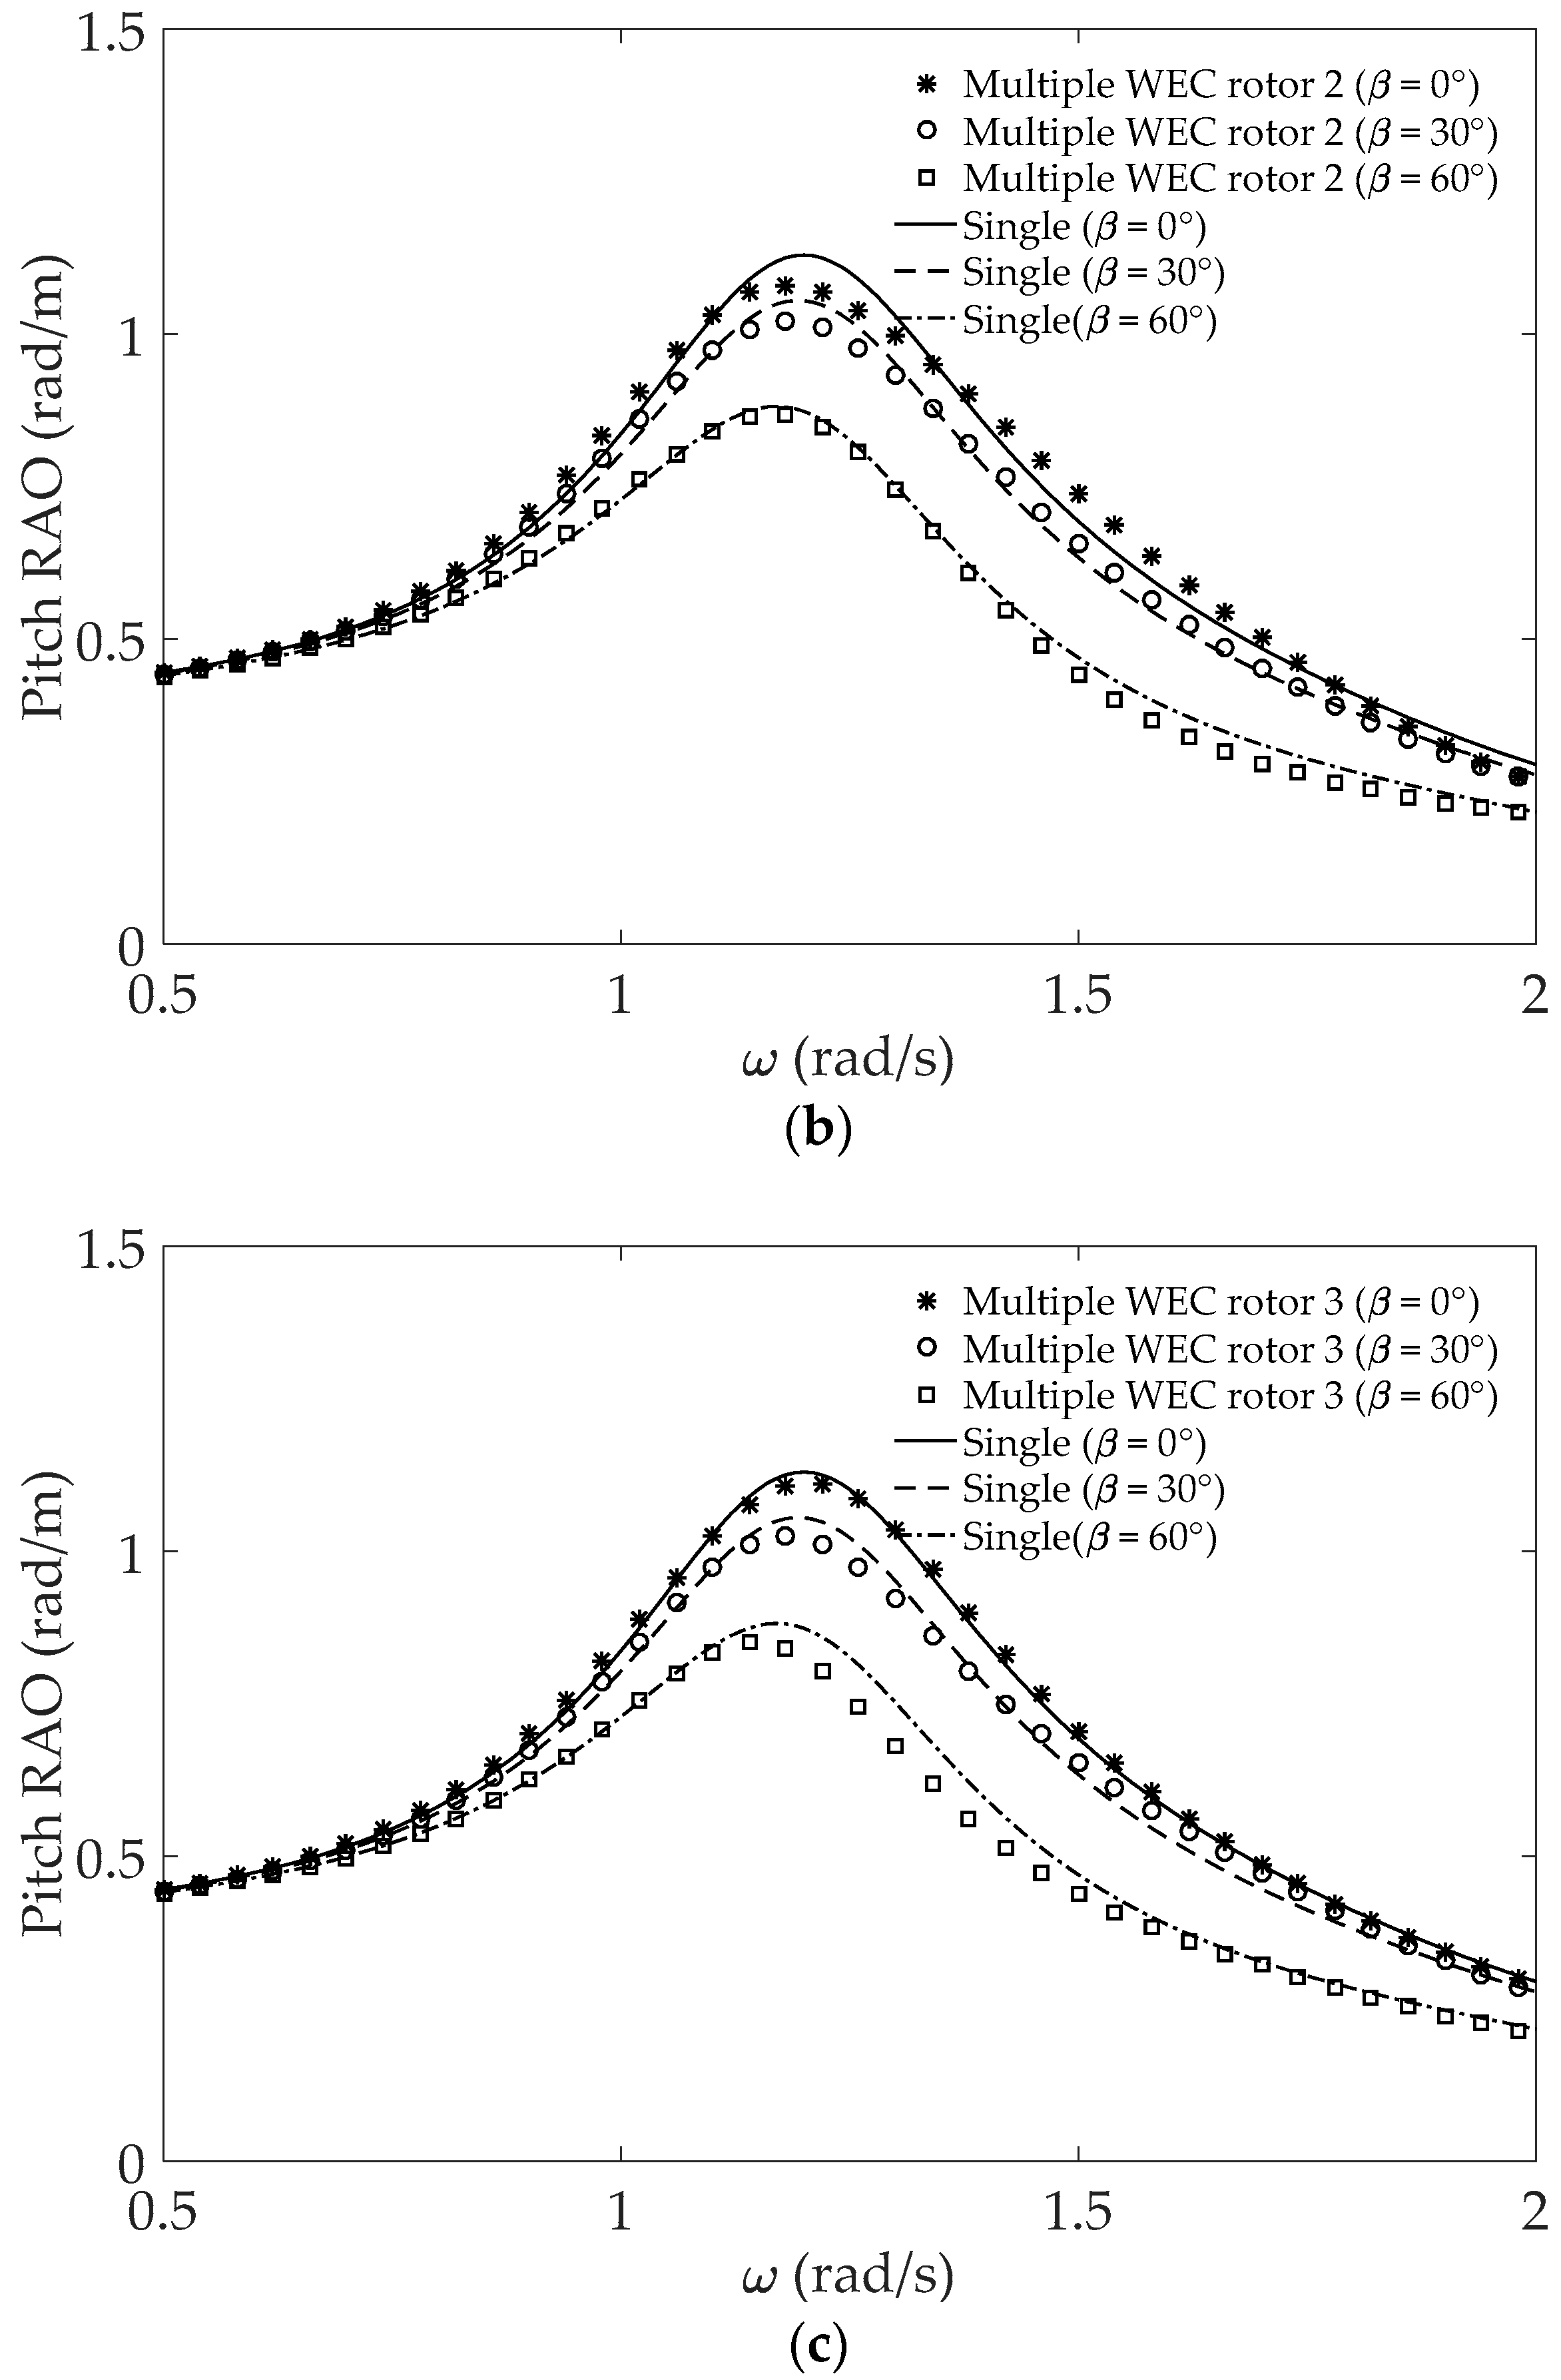
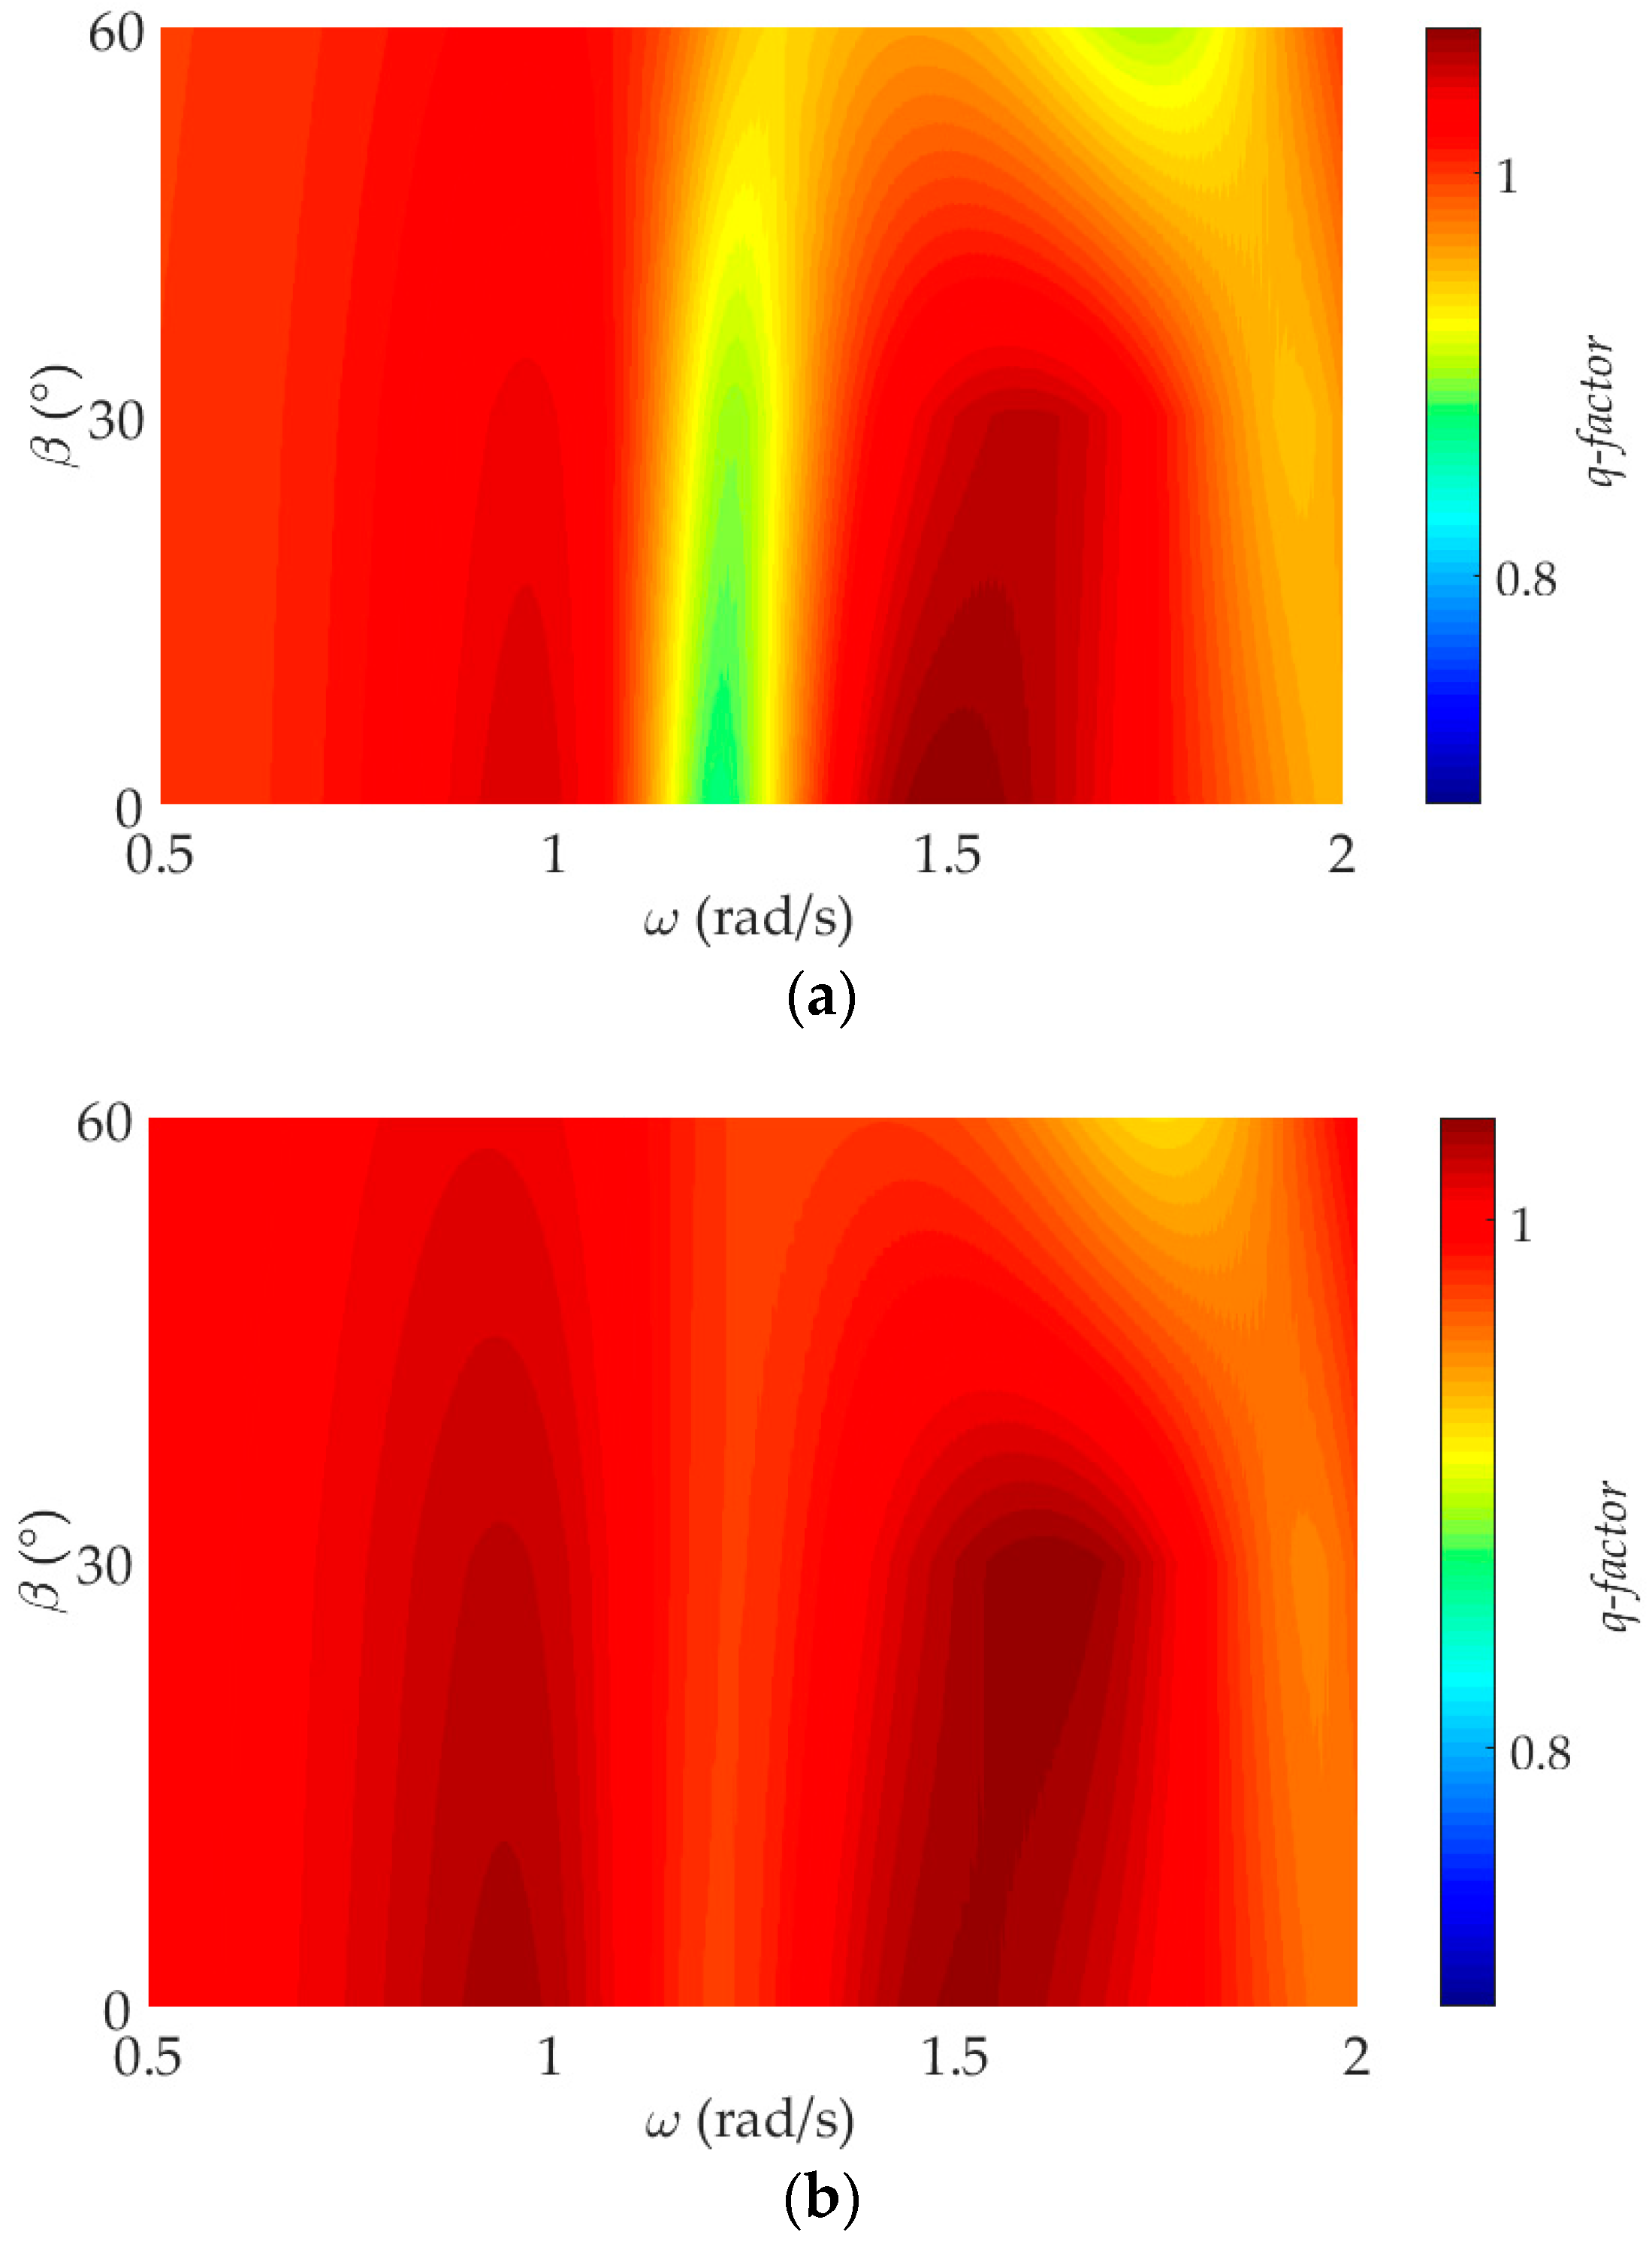
Figure 7 shows the pitch RAO of multiple WEC rotors by changing wave frequencies from 0.5 rad/s to 2.0 rad/s with an increment of 0.02 rad/s for different wave-heading angles β = 0°, 30°, and 60°. Line denotes the isolated WEC rotor and symbols represent multiple WEC rotors. The viscous damping is 25.0 kN⋅m⋅s/rad (see [31]). The spacing between rotors was tested for 10 m, which is the center-to-center distance. Notably, the pitch RAO of isolated and multiple WEC rotors predicts a similar hydrodynamic behavior with a range of wave frequencies. The isolated WEC rotor at a small wave-heading angle predicts increased RAO within the range of frequencies considered, while peak amplitudes are slightly affected in the case of multiple WEC rotors. Peak pitch RAO variations according to the wave frequency and wave-heading angle were observed, and the main resonance frequency was within the range of 1.2–1.23 rad/s (see Table 2). The influence of PTO damping on the WEC RAO is illustrated in Figure 8. Equation (3) shows that the estimated minimum PTO damping of the WEC rotor is 34.6 kN⋅m⋅s/rad. Figure 8 clearly shows the maximum reduction focused around the peak frequency although the influence is in-significance as moving away from the peak. The PTO damping has a strong influence on peak frequencies at all wave-heading angles (see Table 2). Figure 9 shows the variation of the q-factor (given by Equation (6)) as a function of the wave-heading angle and frequency for with and without PTO damping. Interaction effects are constructive (see the dark red contour in Figure 9) within the range of (0.5 < ω < 1.08 and β ≤ 60°) and (1.34 < ω < 1.82 and β < 30°) for without PTO and (0.52 < ω < 1.1 and β ≤ 60°) and (1.33 < ω < 1.77 and β < 30°) for with PTO but destructive otherwise.
Note:
- Each cell represents (peak frequency (rad/s), peak pitch RAO(rad/m)).
- First row: β = 0°, Second row: β = 30°, and Third row: β = 60°.
4.2.2. Nonlinear CFD Results
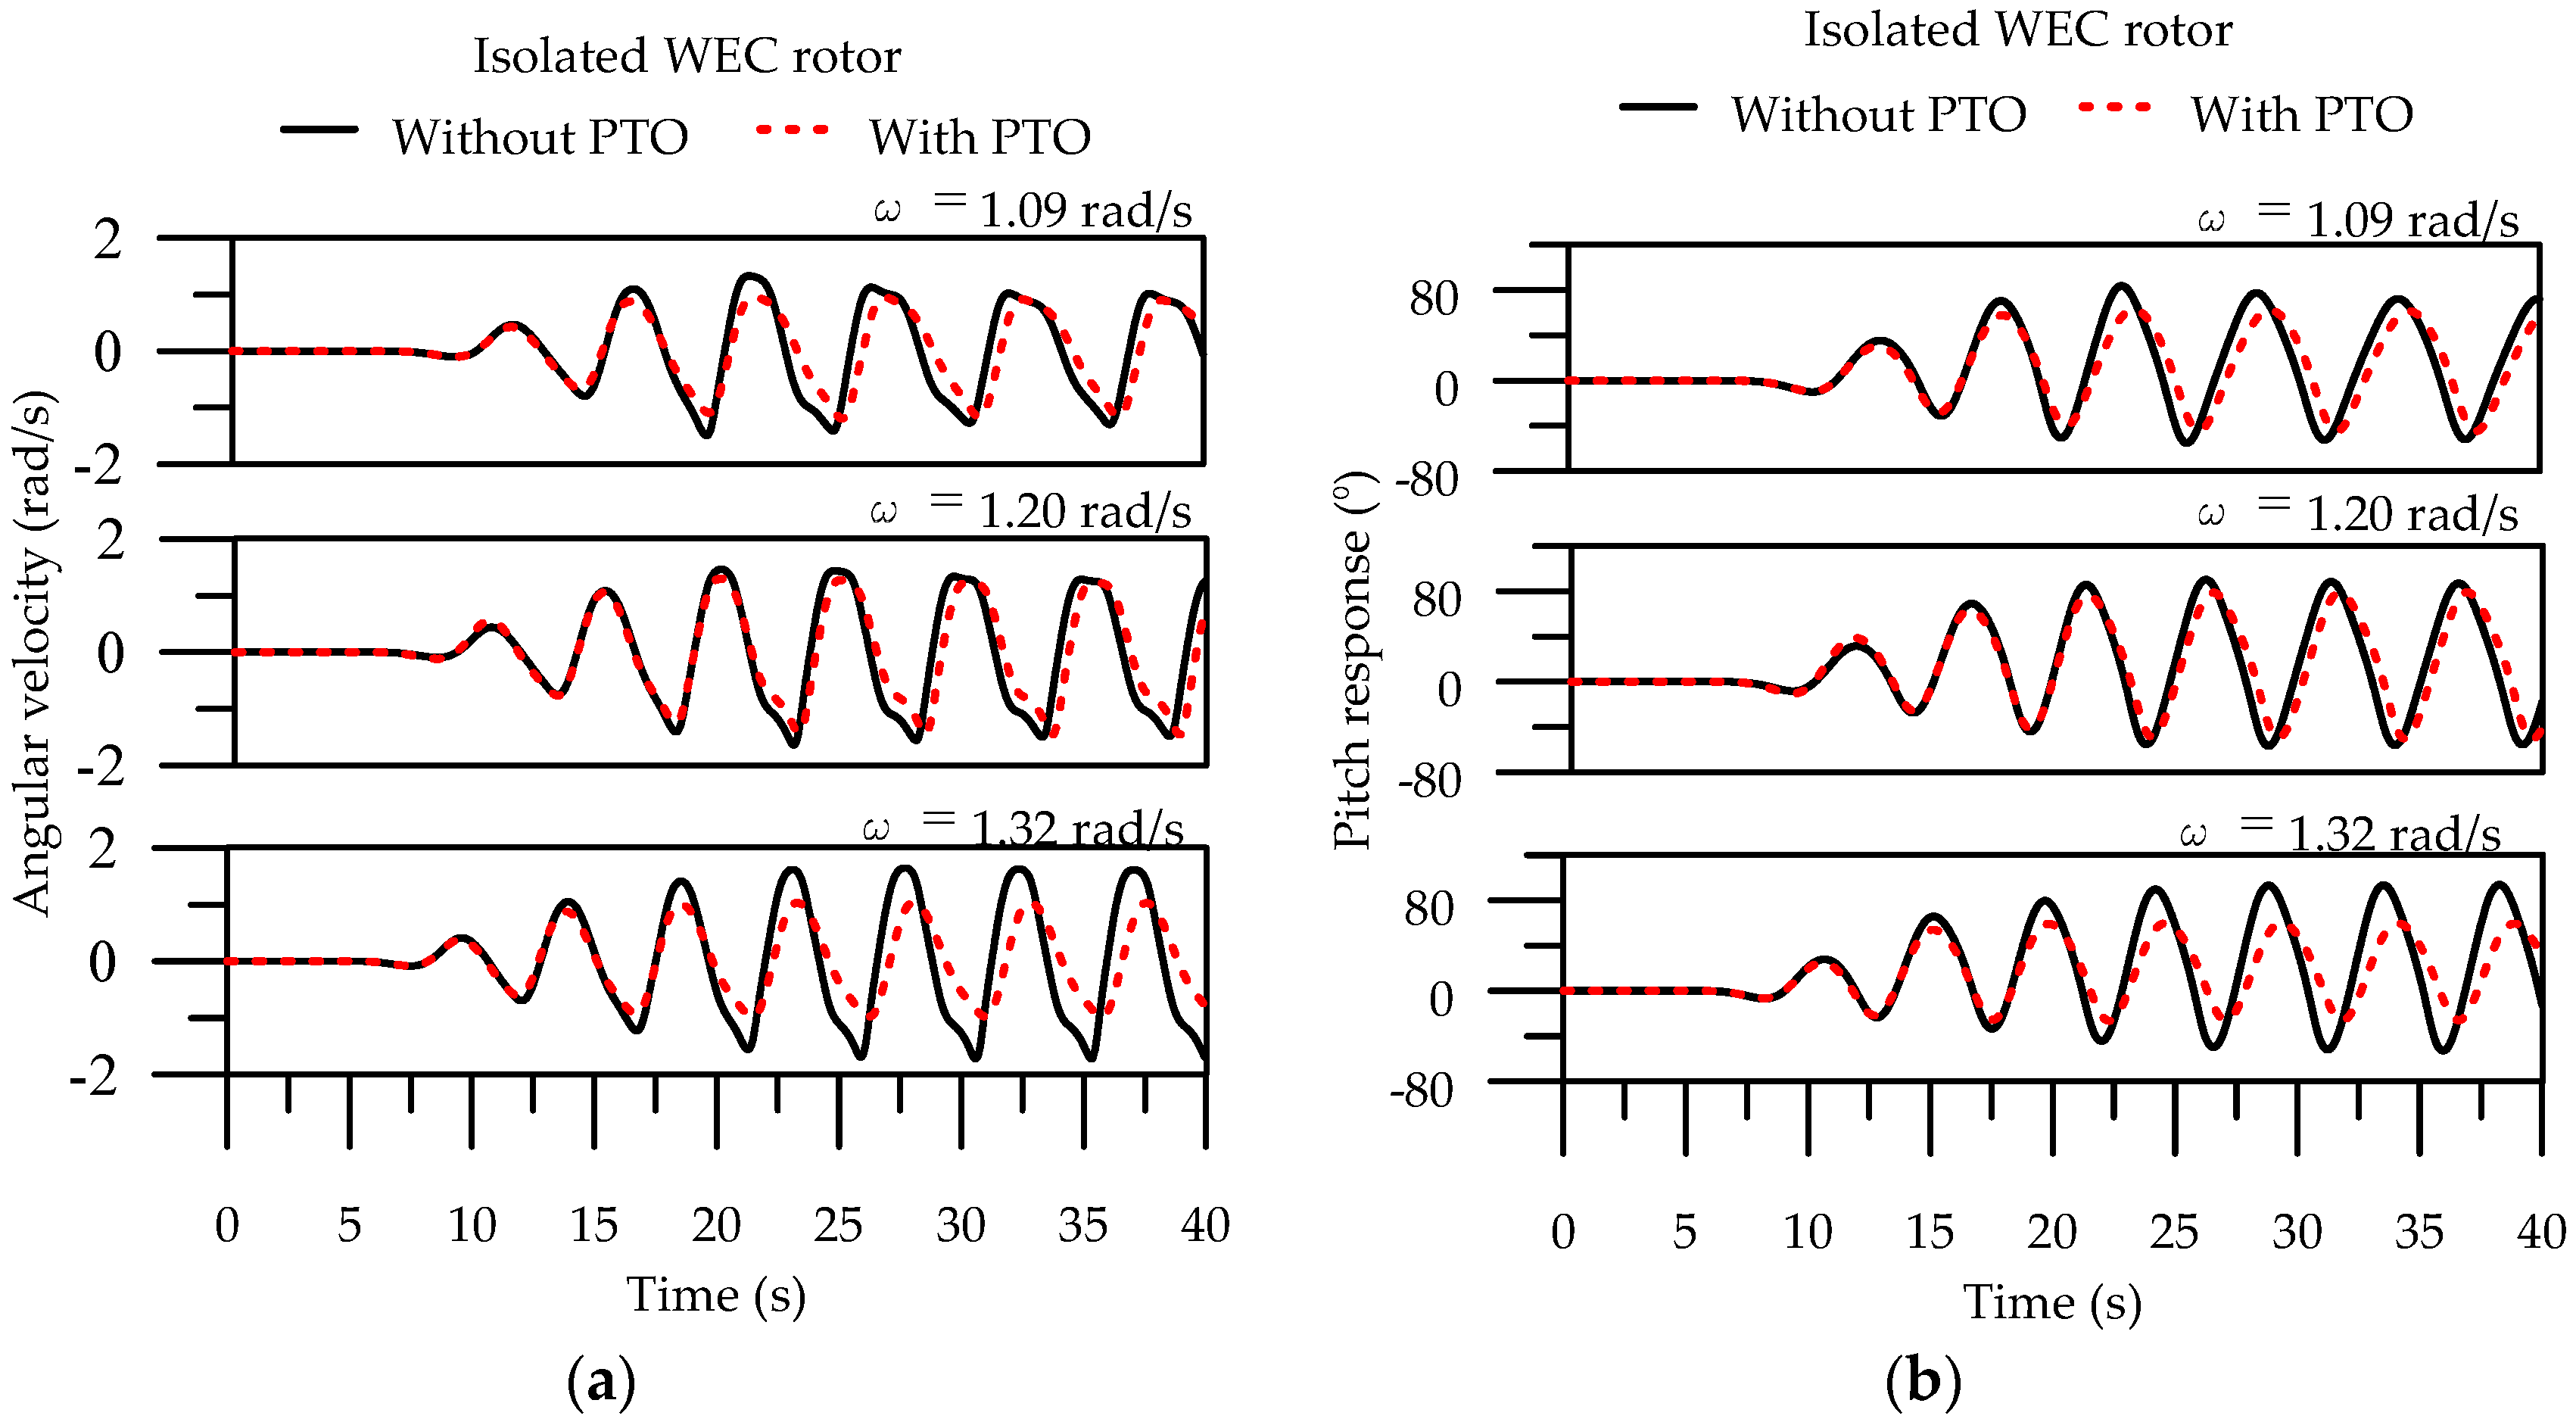
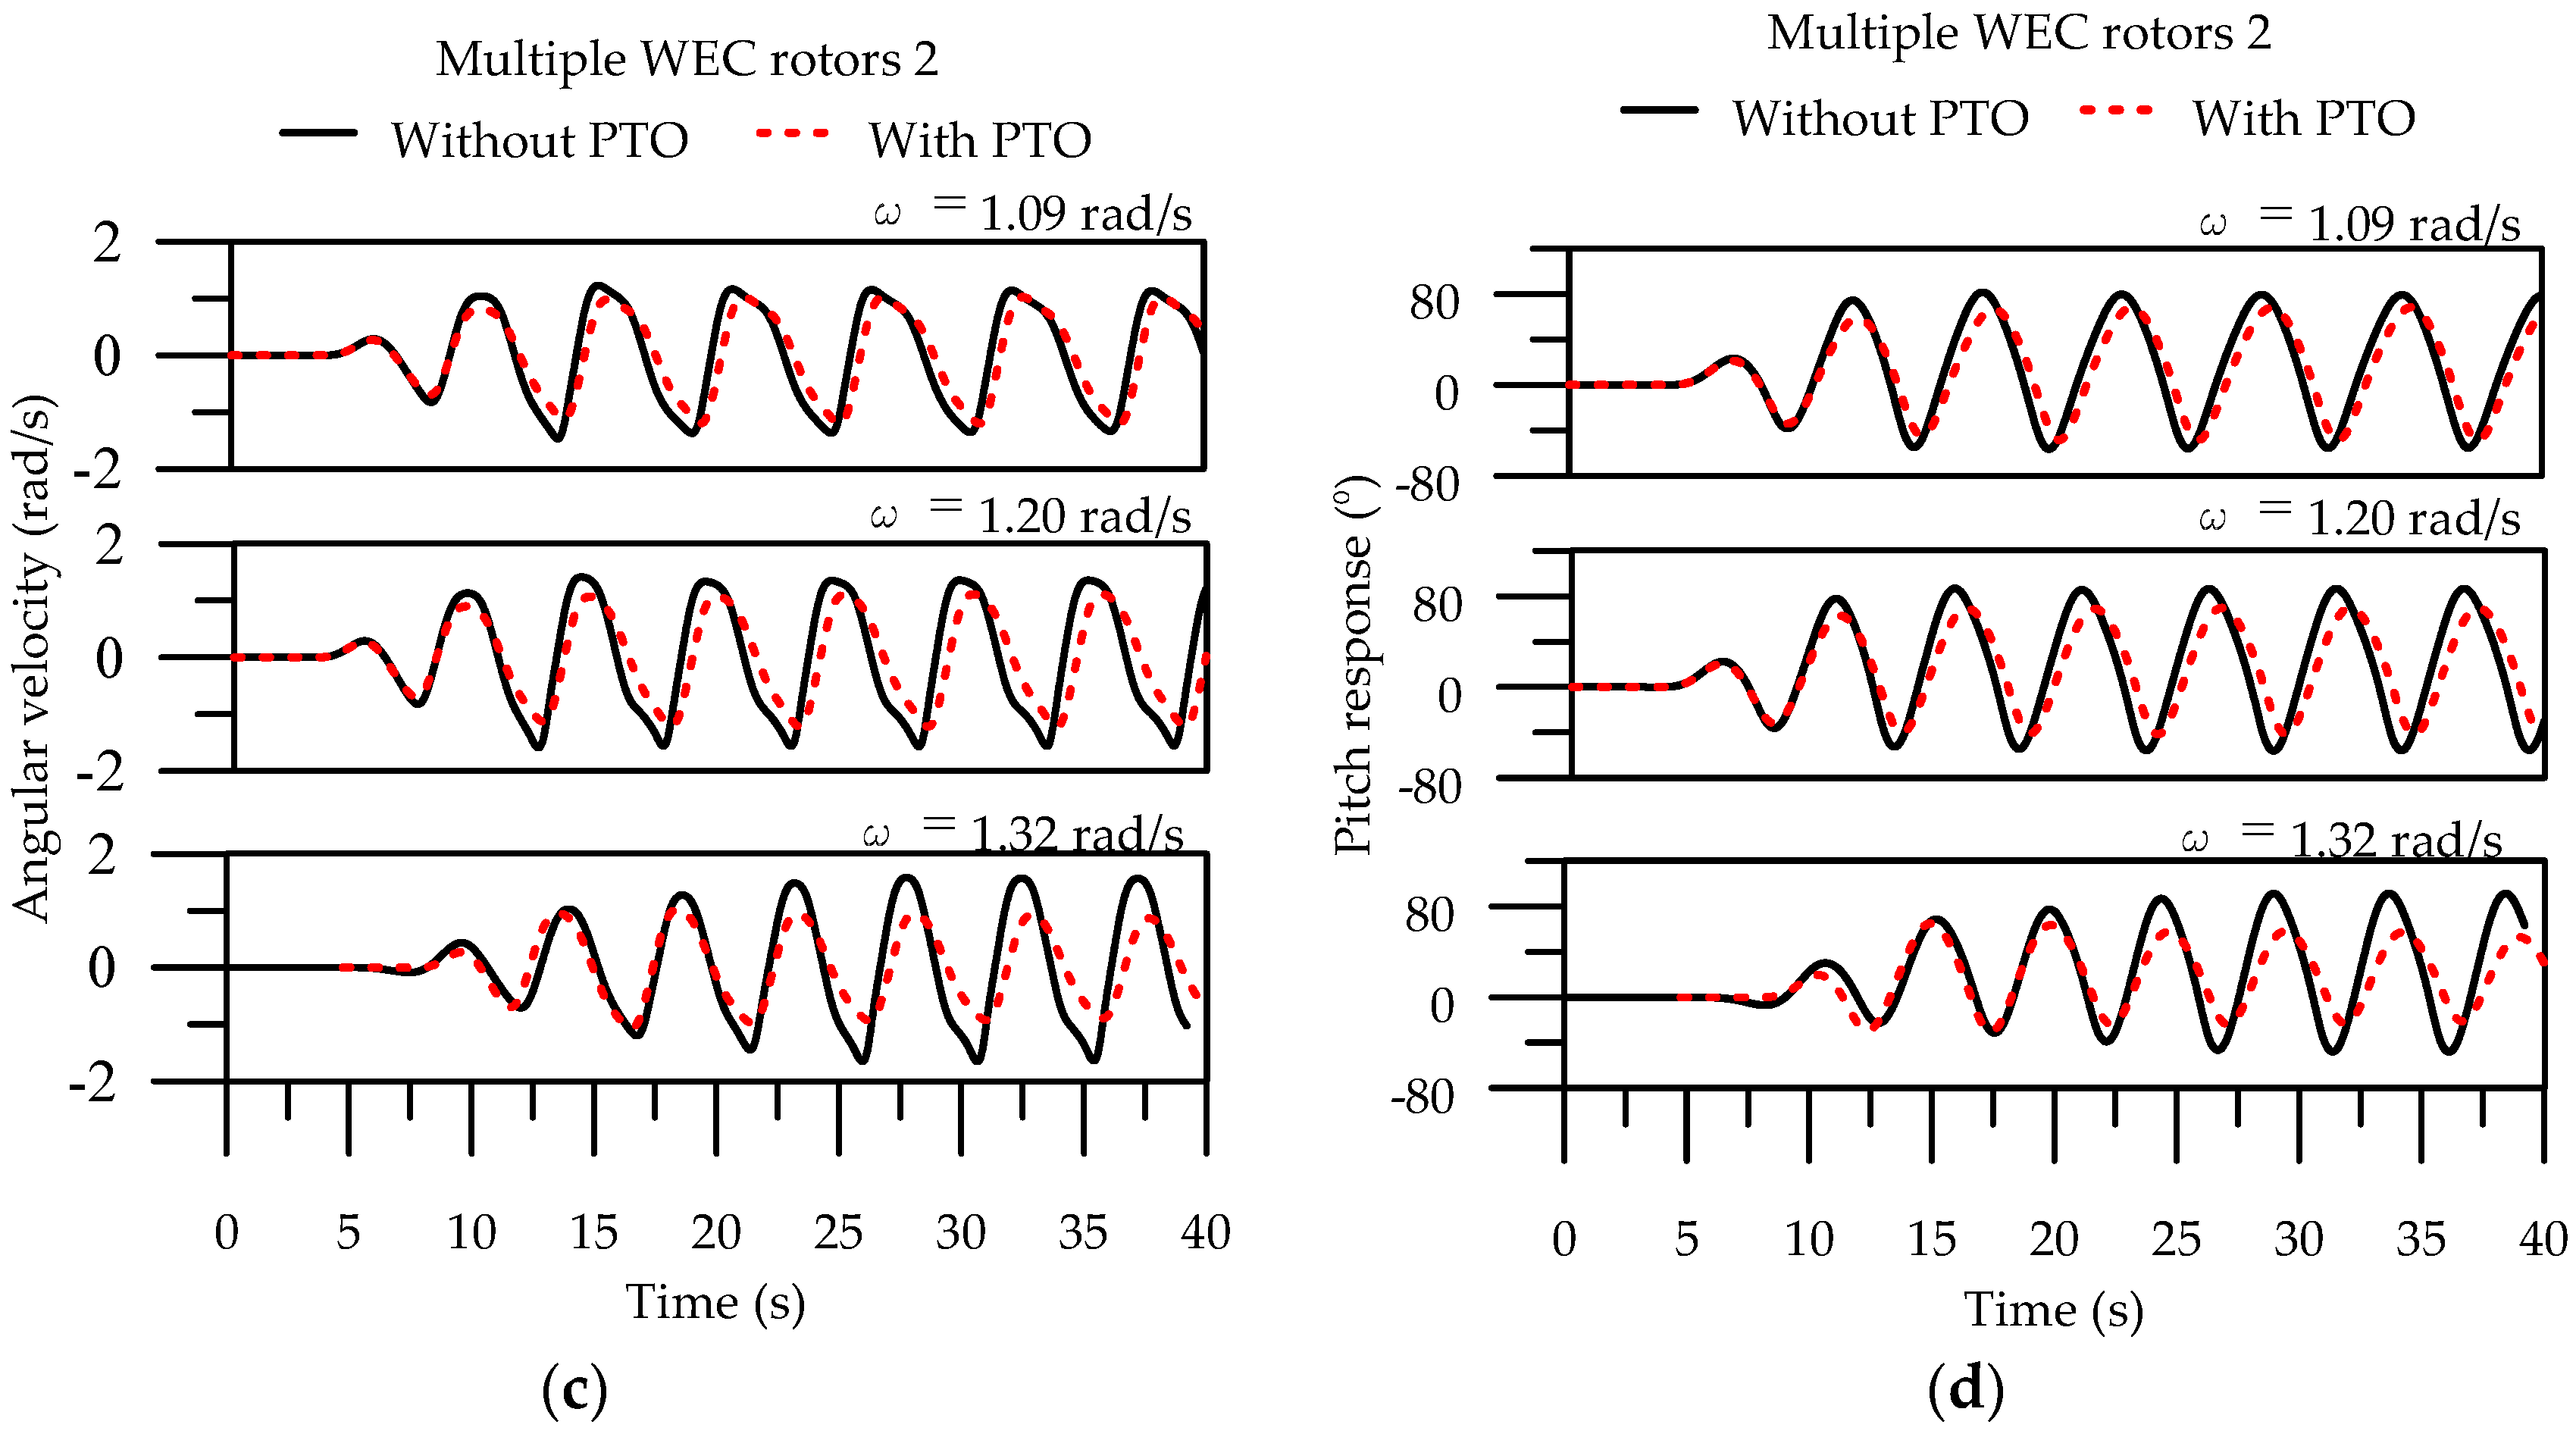
NWT simulations were performed for a fixed spacing (center-to-center spacing = 10 m), zero wave-heading angle, wave height = 1.5 m (target wave height), and three wave frequencies of 1.09, 1.20, and 1.32 rad/s. The time history of angular velocity and pitch response of isolated and multiple WEC rotors with and without PTO are presented in Figure 10 and Figure 11 and Table 3. The time history shows that the WEC responds nonlinearly to incoming waves. The angular velocity and pitch response signal demonstrated that crests and troughs are affected by the applied PTO while the phase slightly increases over time. These changes were significant in the case of ω = 1.32 rad/s and a similar trend was observed with multiple WEC rotors but with reduced magnitudes.
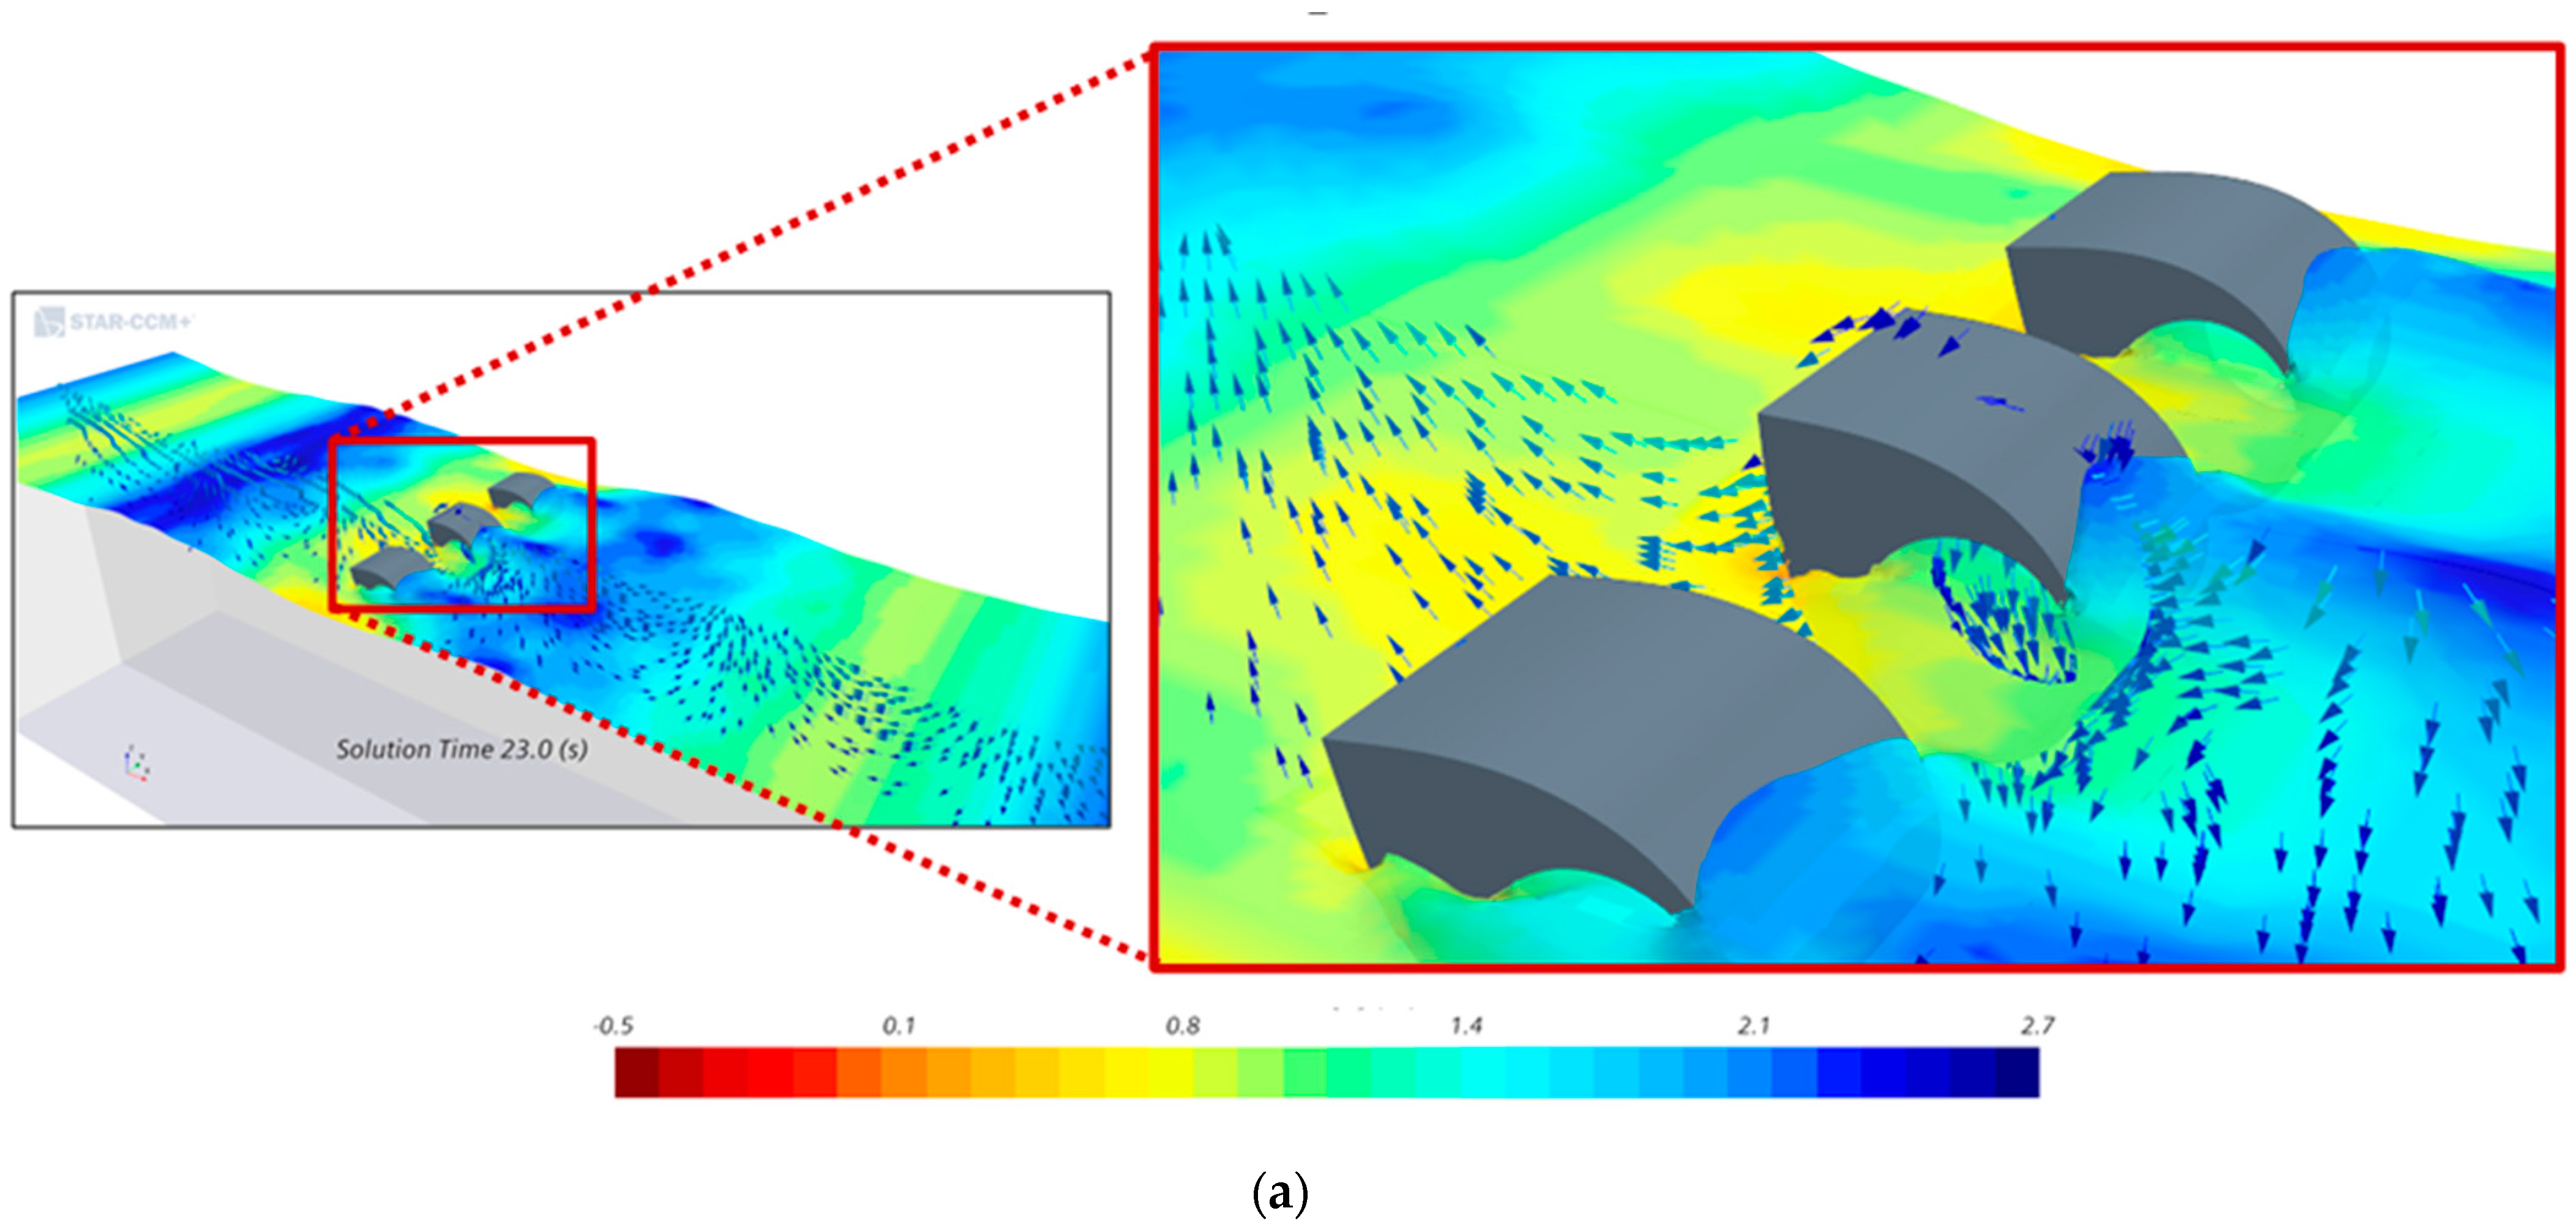
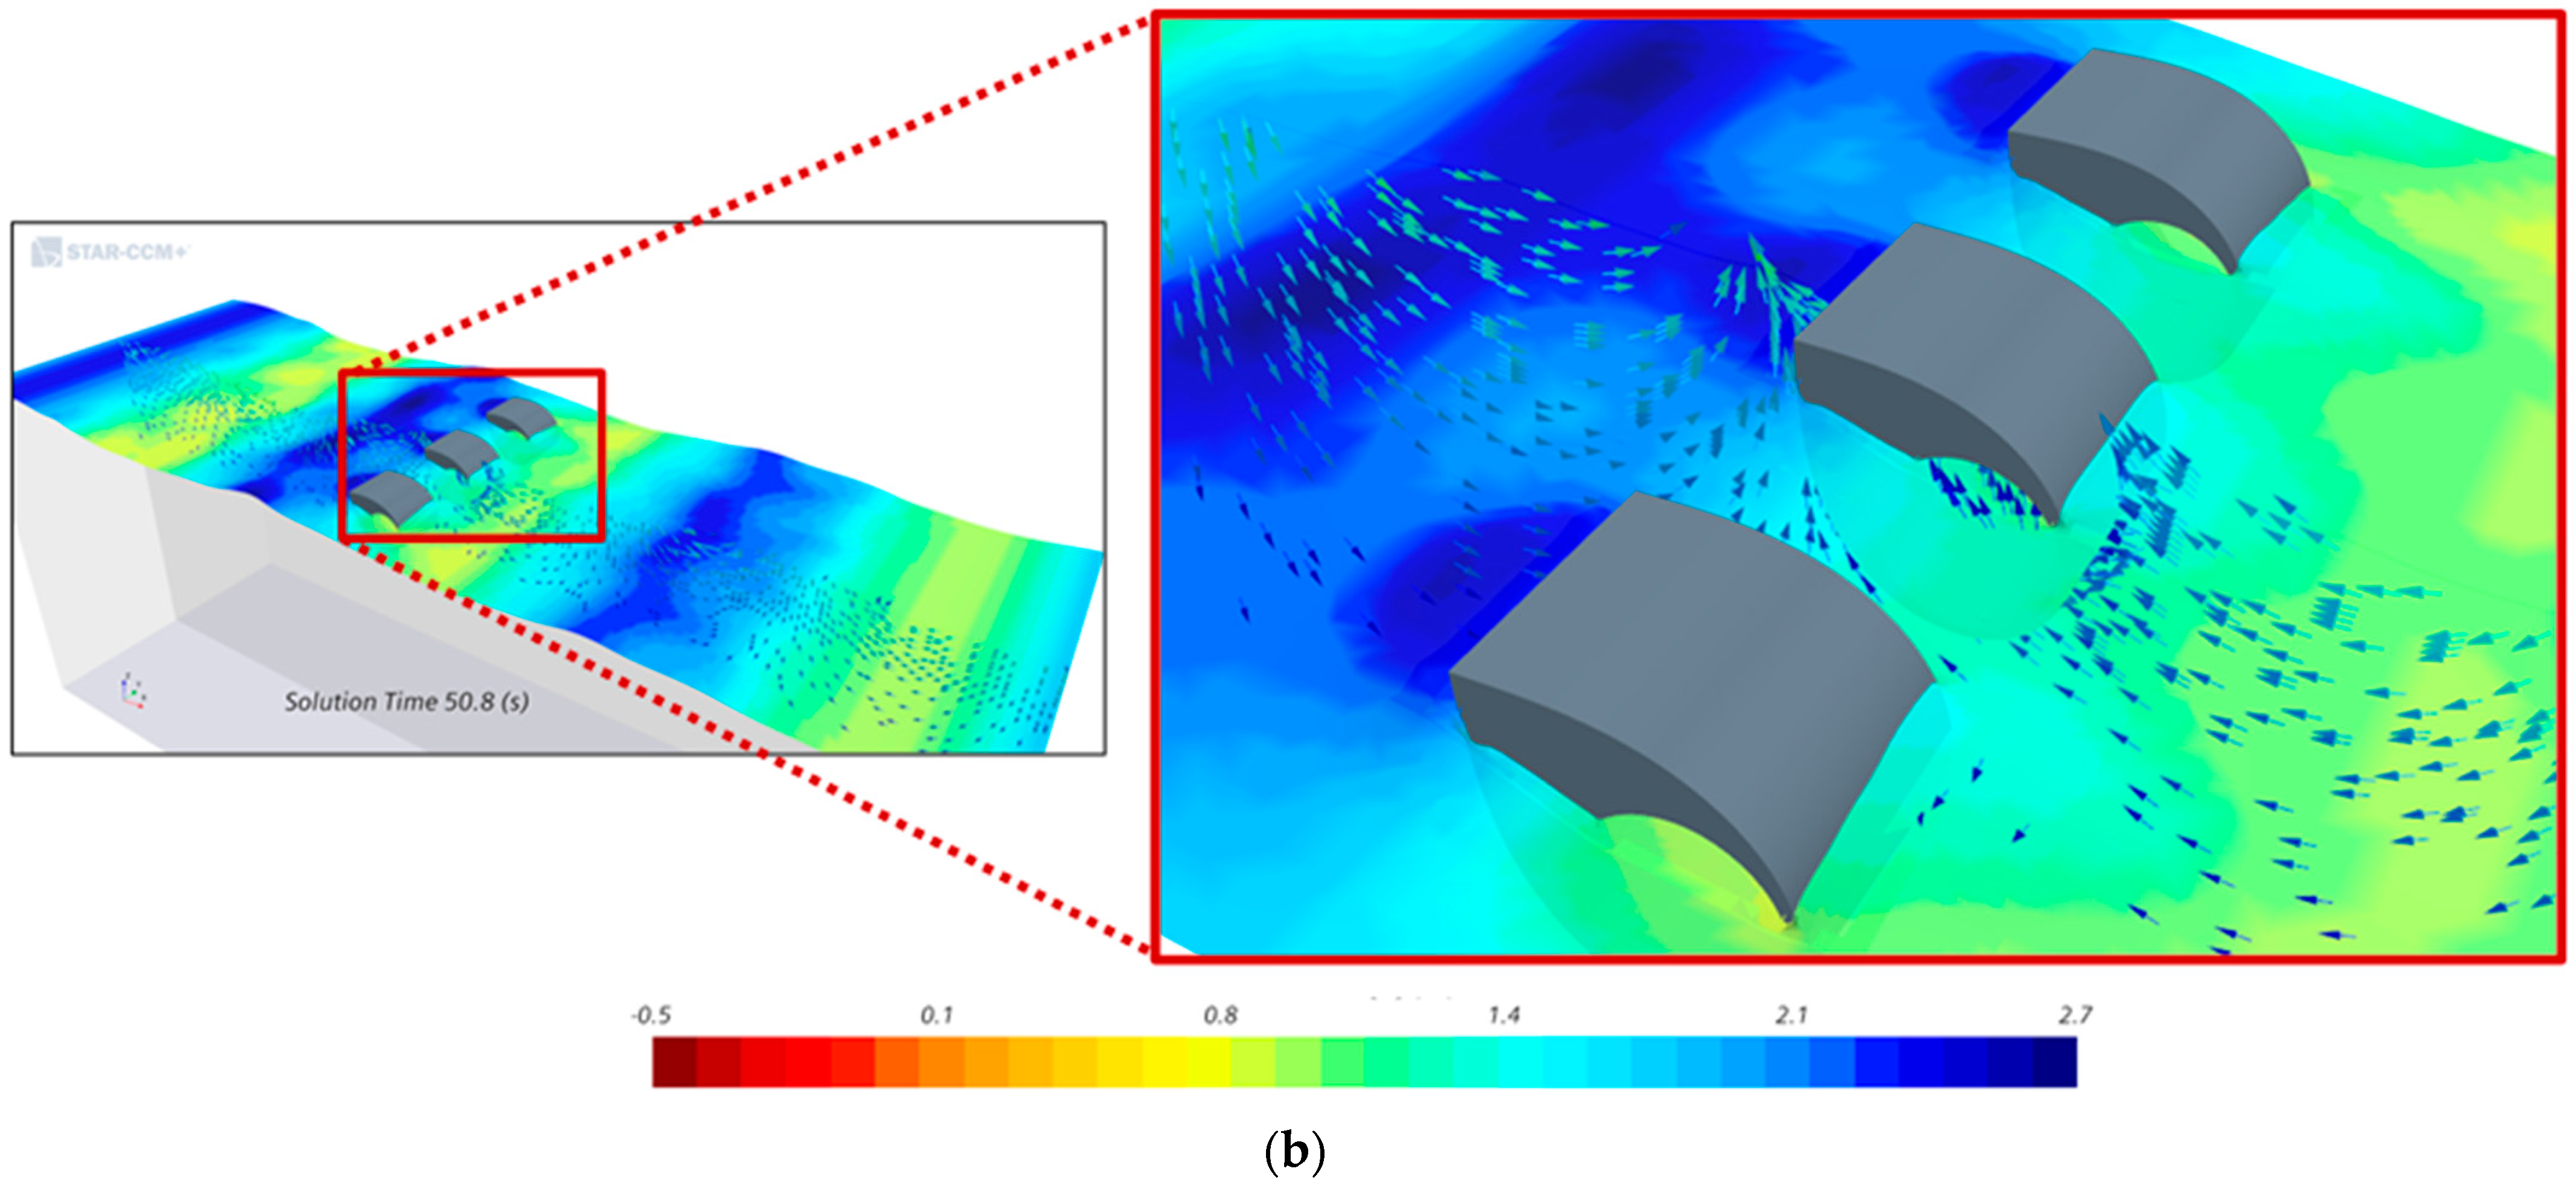
Table 3 presents the pitch RAO and q-factor comparison between the linear BEM and nonlinear CFD results. The pitch RAO of wave frequencies (1.02, 1.20, and 1.32 rad/s) without PTO shows the satisfactory overall consistency between the linear BEM and nonlinear CFD solutions, except for the significant variation in the case of 1.20 rad/s. The linear BEM results demonstrate higher destruction in the q-factor compared with the nonlinear CFD findings. The overall consistency of the pitch RAO with PTO was reasonable, whereas variations were higher than 42% when the linear BEM and nonlinear CFD results were compared at 1.32 rad/s. The variation of the q-factor was high at the wave frequency of 1.20 rad/s. The free surface wave profile colored by the vertical water particle displacement in the NWT is shown in Figure 12. Large differences in the free surface wave elevation at the rear and front sides of rotors, phase lag among rotors, and the interaction of radiated waves allow for a rigorous mixing of the flow at the center of rotation (see Figure 12). The WEC rotor 2 demonstrated stronger and more distinct mixing than WEC rotors 1 and 3. The violent liquid motion resulted in large slamming forces and significant changes without PTO at ω = 1.20 rad/s and with PTO at 1.32 rad/s compared with other cases. However, compared with the nonlinear CFD, the linear BEM results typically led to the overestimation of findings in most of the tested cases because the violent interaction is neglected.
Note:
- First row: ω = 1.09 rad/s, Second row: ω = 1.2 rad/s, and Third row: 1.32 rad/s.
4.3. Optimal Time-Averaged Extracted Power
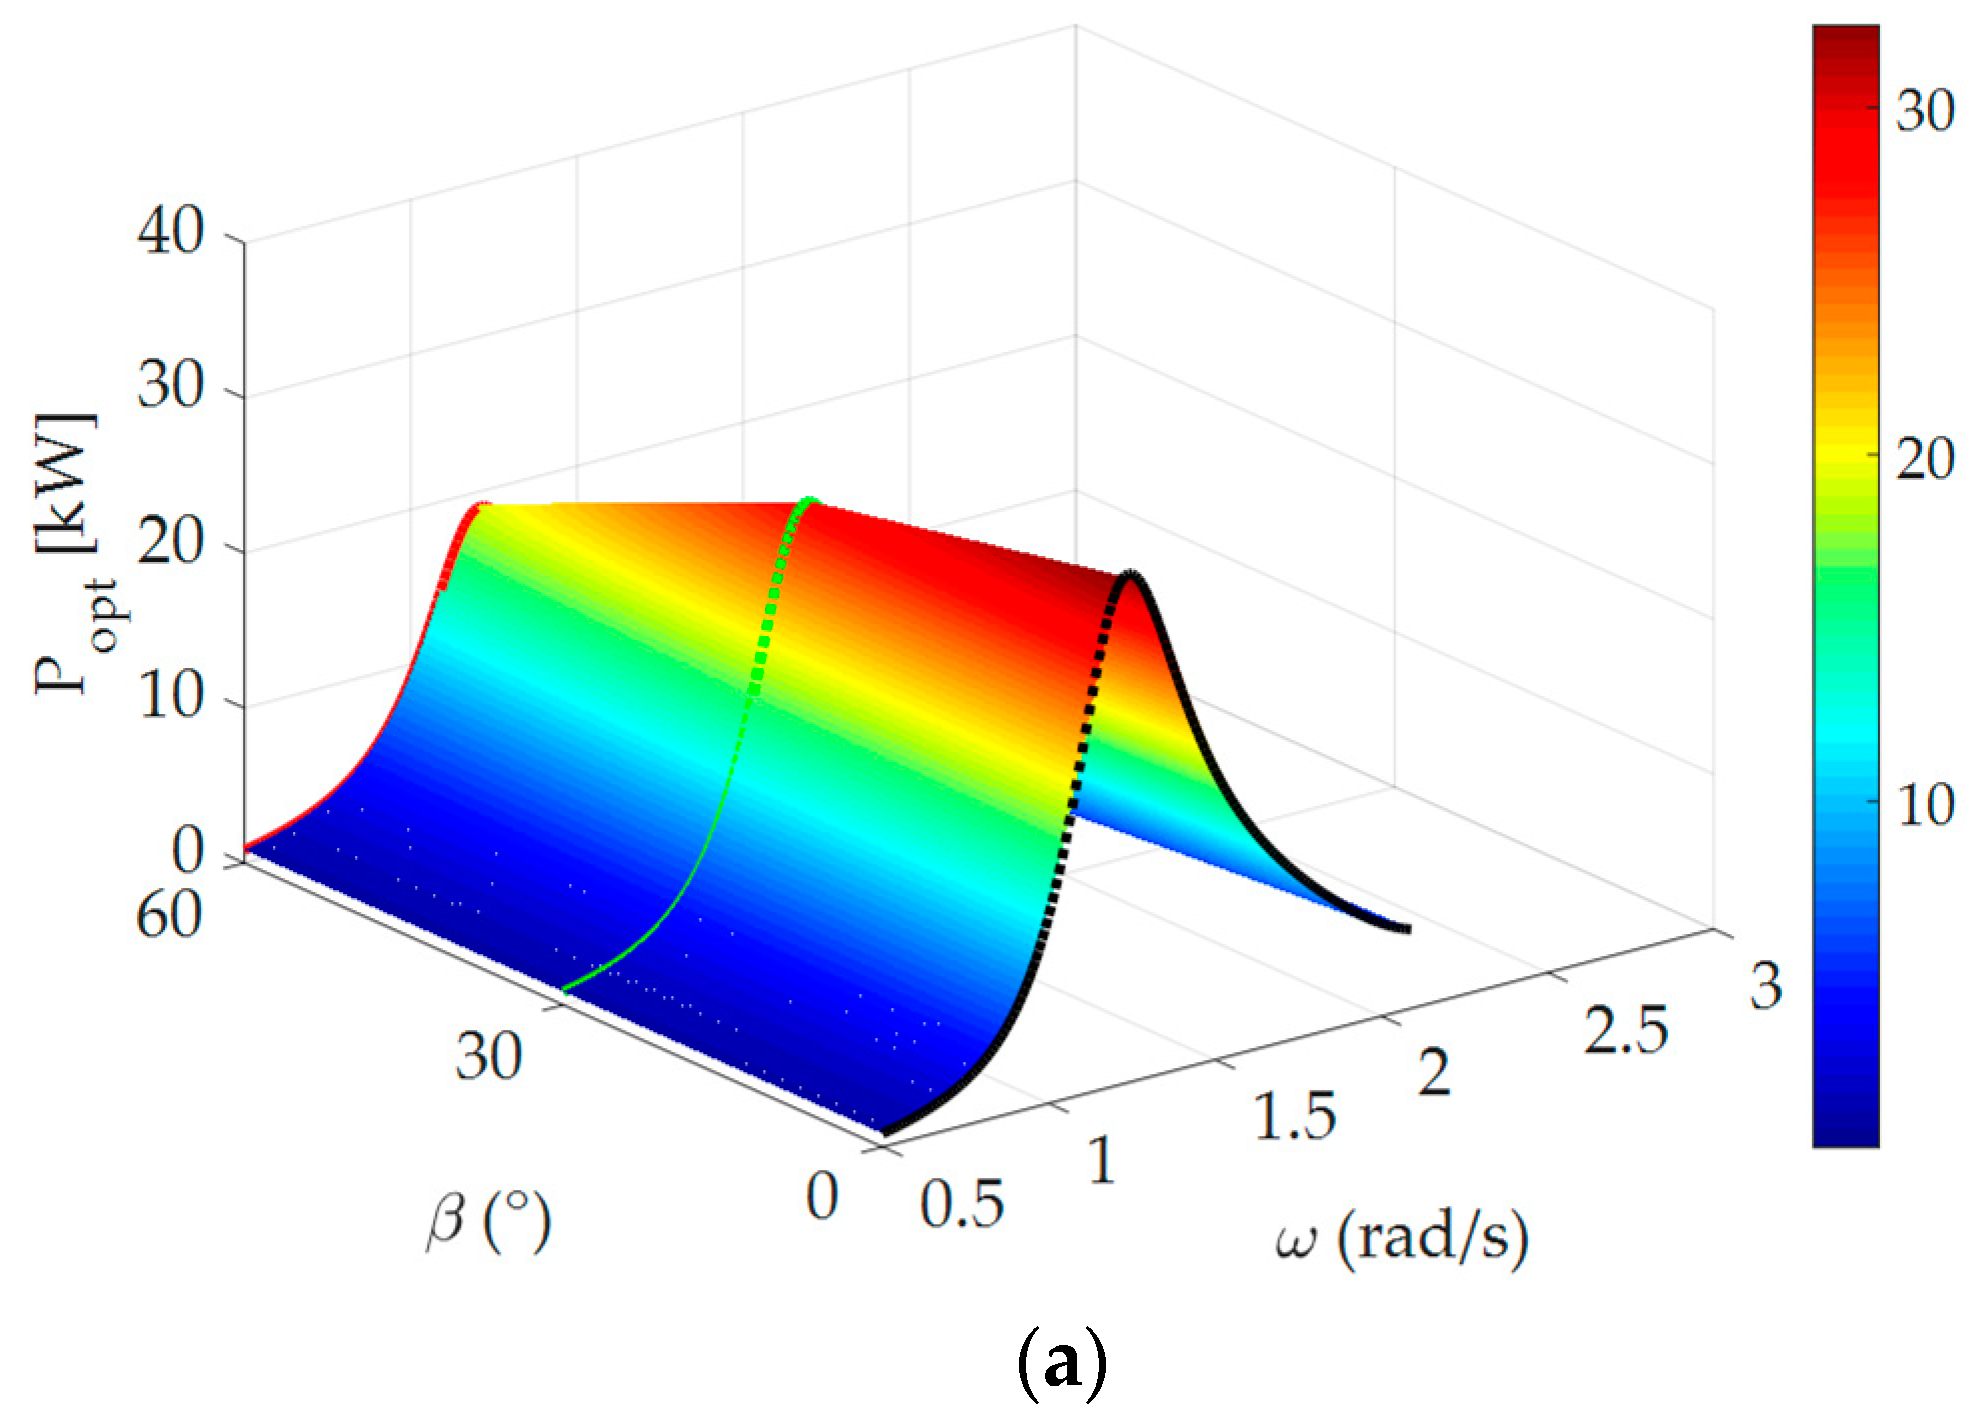
Figure 13 illustrates the extracted power characteristics of isolated and multiple WEC rotors as a function of the wave frequency and wave-heading angle. The dotted line denotes the isolated WEC rotor and the contour represents multiple WEC rotors using linear BEM. The absorbed power presented in kW and based on Equation (3) corresponds to the optimal time-averaged extracted power of each wave frequency. Peak values are summarized in Table 4. The evident influence of the natural period on the extracted power in both isolated and multiple WEC rotors is illustrated in Figure 13. The maximum time-averaged optimum extracted power is distributed around the zero-heading angle close to the resonance frequency and continuously decreases as the wave-heading angle increases. Table 5 lists the extracted power at specific frequencies where the nonlinear CFD simulation results are compared with the linear BEM results. According to the linear BEM results, the maximum extracted power in both isolated and multiple WEC rotors were obtained at ω = 1.20 rad/s, followed by ω = 1.32 rad/s and ω = 1.09 rad/s. Nonlinear CFD simulations showed that the maximum extracted power was observed at a similar wave frequency of linear BEM results, followed by ω = 1.09 rad/s and ω = 1.32 rad/s.
Note:
- First row: β = 0°, Second row: β = 30°, and Third row: β = 60°.
Note:
- First row: ω = 1.09 rad/s, Second row: ω = 1.2 rad/s, and Third row: 1.32 rad/s.
5. Conclusions
A preliminary assessment of multiple WEC rotors was conducted, and the effects of the wave-heading angle and wave frequency with and without PTO damping were quantified using linear BEM along with the isolated WEC rotor. Laboratory experiments were carried out to validate the adopted numerical models on a scale-down isolated WEC rotor. Nonlinear CFD simulations were carried out on prototype WEC for three different wave frequencies at a fixed wave-heading angle to verify and compare the results obtained from the linear BEM solution. The following conclusions can be drawn from the present study:
- The range of tested wave frequencies showed that the small wave-heading angle of the isolated WEC rotor increases the RAO while peak amplitudes are slightly affected in multiple WEC rotors with the linear BEM.
- The maximum reduction of the pitch RAO is focused around the peak frequency but insignificant elsewhere with the application of the PTO damping system.
- The q-factor demonstrated a constructive interaction in the range of (0.5 < ω < 1.08 and β ≤ 60°) and (1.34 < ω < 1.82 and β < 30°) for without PTO and (0.52 < ω < 1.1 and β ≤ 60°) and (1.33 < ω < 1.77 and β < 30°) for with PTO but destructive otherwise with the linear BEM.
- Investigation based on the prototype isolated and multiple WEC rotors, the pitch RAO, and the q-factor with without PTO at chosen wave frequencies demonstrated satisfactory overall consistency between the linear BEM and nonlinear CFD results, except for significant differences at 1.20 rad/s without PTO and 1.32 rad/s with PTO. These differences were qualified by nonlinear CFD simulations because the violent liquid motion at the center of the rotation leaves large slamming forces on the WEC rotor and leads to reduced and distinct responses from other wave frequencies.
- The estimated maximum time-averaged optimal power is distributed close to zero-heading angles around the resonance frequency and continuously decreases as the wave-heading angle increases.
- The linear BEM results showed overestimated extracted power compared with the nonlinear CFD due to the absence of nonlinear effects.
Author Contributions
Conceptualization, S.K.P. and Y.H.B.; methodology, S.K.P.; validation, S.K.P. and D.K.; formal analysis, S.K.P. and D.K.; investigation, S.K.P. and D.K.; writing—original draft preparation, S.K.P.; writing—review and editing, S.K.P. and Y.H.B.; supervision, Y.H.B.; funding acquisition, Y.H.B. All authors have read and agreed to the published version of the manuscript.
Funding
This work was supported by the Korea Institute of Energy Technology Evaluation and Planning (KETEP) and the Ministry of Trade, Industry & Energy (MOTIE) of the Republic of Korea (No. 20163010071690). This work was also supported by the National Research Foundation of Korea (NRF) grant funded by the Korea government (MSIT). (No. 2021R1A2C1014600).
Institutional Review Board Statement
Not applicable.
Informed Consent Statement
Not applicable.
Data Availability Statement
Data available in a publicly accessible repository.
Acknowledgments
We would like to thank the Faculty of Wind Energy Engineering, Jeju National University for allowing us to use their STAR-CCM+ software.
Conflicts of Interest
The authors declare no conflict of interest.
References
- Mclver, P. Wave Forces on Arrays of Floating Bodies. J. Eng. Math. 1984, 18, 273–285. [Google Scholar] [CrossRef]
- Kagemoto, H.; Yue, D.K. Interactions among multiple three-dimensional bodies in water waves: An exact algebraic method. J. Fluid Mech. 1986, 166, 189–209. [Google Scholar] [CrossRef]
- Mavrakos, S.A. Hydrodynamic coefficients for groups of interacting vertical axisymmetric bodies. Ocean Eng. 1991, 18, 485–515. [Google Scholar] [CrossRef]
- Pecher, A.; Kofoed, J.P.; Larsen, T.; Marchalot, T. Experimental study of the Weptos wave energy converter. In Proceedings of the ASME 2012 31st International Conference on Ocean, Offshore and Arctic Engineering (ASME 2012), Rio de Janeiro, Brazil, 1–6 July 2012; pp. 525–534. [Google Scholar]
- Pecher, A.; Kofoed, J.P.; Larsen, T. The extensive R&D behind the Weptos WEC. Renew. Energ. Offshore 2015, 351–358. [Google Scholar]
- Windt, C.; Davidson, J.; Ringwood, J.V. High-fidelity numerical modelling of ocean wave energy systems: A review of computational fluid dynamics-based numerical wave tanks. Renew. Sustain. Energy Rev. 2018, 93, 610–630. [Google Scholar] [CrossRef] [Green Version]
- Newman, J.N. Wave effects on multiple bodies. Hydrodyn. Ship Ocean Eng. 2001, 3, 3–26. [Google Scholar]
- Folley, M.; Babarit, A.; Child, B.; Forehand, D.; O’Boyle, L.; Silverthorne, K.; Spinneken, J.; Stratigaki, V.; Troch, P. A review of numerical modelling of wave energy converter arrays. In Proceedings of the ASME 2012 31st International Conference on Ocean, Offshore and Arctic Engineering 2012, American Society of Mechanical Engineers Digital Collection, Rio de Janeiro, Brazil, 1–6 July 2012; pp. 535–545. [Google Scholar]
- Folley, M. Numerical Modelling of Wave Energy Converters: State-of-the-Art Techniques for Single Devices and Arrays; Academic Press: Cambridge, MA, USA, 2016. [Google Scholar]
- Ogden, D. Numerical Modelling Tool for Multibody Wave Energy Converters; University of Edinburgh: Edinburgh, Scotland, 2019. [Google Scholar]
- Taghipour, R.; Moan, T. Efficient frequency-domain analysis of dynamic response for the multi-buoy wave energy converter in multi-directional waves. In Proceedings of the 18th International Offshore and Polar Engineering Conference, Vancouver, WA, Canada, 6–11 July 2008. [Google Scholar]
- Thomas, S.; Weller, S.; Stallard, T.J. Float response within an array: Numerical and experimental comparison. In Proceedings of the 2nd International Conference on Ocean Energy (ICOE), Brest, France, 15–17 October 2008; Volume 1517. [Google Scholar]
- Folley, M.; Whittaker, T.J.T. The effect of sub-optimal control and the spectral wave climate on the performance of wave energy converter arrays. Appl. Ocean Res. 2009, 31, 260–266. [Google Scholar] [CrossRef]
- Bellew, S.; Stallard, T.; Stansby, P. Optimisation of a heterogeneous array of heaving bodies. In Proceedings of the 8th European Wave and Tidal Energy Conference 2009, Uppsala, Sweden, 7–11 September 2009; pp. 519–527. [Google Scholar]
- Cruz, J.; Sykes, R.; Siddorn, P.; Taylor, R.E. Estimating the loads and energy yield of arrays of wave energy converters under realistic seas. IET Renew. Power Gener. 2010, 4, 488–497. [Google Scholar] [CrossRef]
- Borgarino, B.; Babarit, A.; Ferrant, P. Impact of wave interactions effects on energy absorption in large arrays of wave energy converters. Ocean Eng. 2012, 41, 79–88. [Google Scholar] [CrossRef] [Green Version]
- Flavia, F.F. A Numerical Tool for the Frequency Domain Simulation of Large Clusters of Wave Energy Converters. Ph.D. Thesis, Ecole Centrale de Nantes, Nantes, France, 2017. [Google Scholar]
- Babarit, A.; Borgarino, B.; Ferrant, P.; Clément, A. Assessment of the influence of the distance between two wave energy converters on energy production. IET Renew. Power Gener. 2010, 4, 592–601. [Google Scholar] [CrossRef] [Green Version]
- Hansen, R.H.; Kramer, M.M. Modelling and control of the wavestar prototype. In Proceedings of the 9th European Wave and Tidal Energy Conference (EWTEC 2011), Southampton, UK, 5–9 September 2021. [Google Scholar]
- Nambiar, A.J.; Forehand, D.I.; Kramer, M.M.; Hansen, R.H.; Ingram, D.M. Effects of hydrodynamic interactions and control within a point absorber array on electrical output. Int. J. Mar. Energy 2015, 9, 20–40. [Google Scholar] [CrossRef]
- Forehand, D.I.; Kiprakis, A.E.; Nambiar, A.J.; Wallace, A.R. A fully coupled wave-to-wire model of an array of wave energy converters. IEEE Trans. Sustain. Energy 2015, 7, 118–128. [Google Scholar] [CrossRef] [Green Version]
- Chen, W.; Gao, F.; Meng, X.; Fu, J. Design of the wave energy converter array to achieve constructive effects. Ocean Eng. 2016, 124, 13–20. [Google Scholar] [CrossRef]
- Agamloh, E.B.; Wallace, A.K.; Von Jouanne, A. Application of fluid–structure interaction simulation of an ocean wave energy extraction device. Renew. Energy 2008, 33, 748–757. [Google Scholar] [CrossRef]
- Westphalen, J.; Greaves, D.; Williams, C.; Taylor, P.; Causon, D.; Mingham, C.; Hu, Z.; Stansby, P.B.R.; Omidvar, P. Extreme Wave Loading on Offshore Wave Energy Devices Using CFD: A Hierarchical Team Approach. In Proceedings of the 8th European Wave and Tidal Energy Conference Uppsala, Uppsala, Sweden, 7–10 September 2009. [Google Scholar]
- Windt, C.; Davidson, J.; Ransley, E.J.; Greaves, D.; Jakobsen, M.; Kramer, M.; Ringwood, J.V. Validation of a CFD-based numerical wave tank model for the power production assessment of the wavestar ocean wave energy converter. Renew. Energy 2020, 146, 2499–2516. [Google Scholar] [CrossRef]
- Salter, S.H. Wave power. Nature 1974, 249, 720–724. [Google Scholar] [CrossRef]
- Poguluri, S.K.; Bae, Y.H. A study on performance assessment of WEC rotor in the Jeju western waters. Ocean. Syst. Eng. 2018, 8, 361–380. [Google Scholar]
- Poguluri, S.K.; Ko, H.S.; Bae, Y.H. CFD Investigation of Pitch-Type Wave Energy Converter-Rotor Based on RANS Simulations; Ships and Offshore Structures: Cambridge, UK, 2019; pp. 1–13. [Google Scholar]
- Kim, D.; Sik, K.H.; Bae, Y.H. Performance Analysis of Multiple Wave Energy Converters due to Rotor Spacing. J. Ocean. Eng. Technol. 2021, 35, 229–237. [Google Scholar]
- Poguluri, S.K.; Cho, I.H.; Bae, Y.H. A Study of the Hydrodynamic Performance of a Pitch-type Wave Energy Converter–Rotor. Energies 2019, 12, 842. [Google Scholar] [CrossRef] [Green Version]
- Kim, D.; Poguluri, S.K.; Ko, H.S.; Lee, H.; Bae, Y.H. Numerical and Experimental Study on Linear Behavior of Salter’s Duck Wave Energy Converter. J. Ocean. Eng. Technol. 2019, 33, 116–122. [Google Scholar] [CrossRef] [Green Version]
- Hadzic, H. Development and Application of Finite Volume Method for the Computation of Flows Around Moving Bodies on Unstructured, Overlapping Grids; Technische Universität Hamburg: Hamburg, Germany, 2006. [Google Scholar]
Figure 1.
Schematic model of the isolated WEC rotor.

Figure 2.
Schematic of multiple WEC rotors considered for analysis.

Figure 3.
(a). Scale-down WEC rotor model and (b) schematic view of the experimental setup equipped with the WEC rotor in the wave flume.
Figure 3.
(a). Scale-down WEC rotor model and (b) schematic view of the experimental setup equipped with the WEC rotor in the wave flume.

Figure 4.
(a) Overview of computational mesh and associated boundary conditions (b) A close-up isometric view of the multiple WEC rotors.
Figure 4.
(a) Overview of computational mesh and associated boundary conditions (b) A close-up isometric view of the multiple WEC rotors.

Figure 5.
Variation of the non-dimensional pitch RAO * obtained from the linear BEM, nonlinear CFD, and experimental results with the wave frequency (rad/s) for the isolated WEC rotor.
Figure 5.
Variation of the non-dimensional pitch RAO * obtained from the linear BEM, nonlinear CFD, and experimental results with the wave frequency (rad/s) for the isolated WEC rotor.

Figure 6.
Comparison of nonlinear CFD and experimental results of pitch response for the isolated WEC rotor.
Figure 6.
Comparison of nonlinear CFD and experimental results of pitch response for the isolated WEC rotor.

Figure 7.
Pitch RAO (rad/m) of isolated and multiple WEC rotors without PTO as a function of the wave frequency (rad/s). Comparison of isolated WEC rotor and multiple WEC rotors (a) 1, (b) 2, and (c) 3.
Figure 7.
Pitch RAO (rad/m) of isolated and multiple WEC rotors without PTO as a function of the wave frequency (rad/s). Comparison of isolated WEC rotor and multiple WEC rotors (a) 1, (b) 2, and (c) 3.


Figure 8.
Pitch RAO (rad/m) of isolated and multiple WEC rotors with PTO as a function of the wave frequency (rad/s). Comparison of the isolated WEC rotor and multiple WEC rotors (a) 1, (b) 2, and (c) 3.
Figure 8.
Pitch RAO (rad/m) of isolated and multiple WEC rotors with PTO as a function of the wave frequency (rad/s). Comparison of the isolated WEC rotor and multiple WEC rotors (a) 1, (b) 2, and (c) 3.


Figure 9.
q-factor as a function of the wave frequency (rad/s) for different wave-heading angles (°): (a) Without PTO, and (b) With PTO.
Figure 9.
q-factor as a function of the wave frequency (rad/s) for different wave-heading angles (°): (a) Without PTO, and (b) With PTO.

Figure 10.
Numerical comparison of isolated WEC rotor with and without PTO for different wave frequencies: (a) angular velocity and (b) pitch response.
Figure 10.
Numerical comparison of isolated WEC rotor with and without PTO for different wave frequencies: (a) angular velocity and (b) pitch response.

Figure 11.
Numerical comparison of multiple WEC rotors with and without PTO for different wave frequencies: (a) angular velocity of multiple WEC rotors 1 and 3, (b) pitch response of multiple WEC rotors 1 and 3, (c) angular velocity of multiple WEC rotor 2, and (d) pitch response of multiple WEC rotor 2.


Figure 12.
Comparison of the free surface wave elevation along the NWT for multiple WEC rotors: (a) ω = 1.20 rad/s and (b) ω = 1.32 rad/s.
Figure 12.
Comparison of the free surface wave elevation along the NWT for multiple WEC rotors: (a) ω = 1.20 rad/s and (b) ω = 1.32 rad/s.


Figure 13.
Time averaged optimum extracted power Popt in (kW) from isolated and multiple WEC rotors as a function of the wave-heading angle (°) and wave frequency (rad/s). Comparison of isolated WEC rotor with multiple WEC rotors (a) 1, (b) 2, and (c) 3.
Figure 13.
Time averaged optimum extracted power Popt in (kW) from isolated and multiple WEC rotors as a function of the wave-heading angle (°) and wave frequency (rad/s). Comparison of isolated WEC rotor with multiple WEC rotors (a) 1, (b) 2, and (c) 3.


Table 1.
Principal particulars of prototype and model-scale isolated WEC rotors.
| Description | Prototype | Model (1:11) |
|---|---|---|
| Stern diameter, 2r (m) | 4 | 0.364 |
| Depth of submergence, d (m) | 3.6 | 0.3275 |
| Beak angle, α (°) | 60 | 60 |
| Width, W (m) | 5 | 0.455 |
| Total mass (kg) | 21,327.686 | 13.65 |
| Pitch moment of inertia around the center of rotation, COR (kg⋅m2) | 117,132.05 | 0.7479 |
| Hydrostatic coefficient, K55/ρg | 22.52 | 0.16398 × 10⁻² |
| Horizontal center of gravity w.r.t. COR (m) | −0.8934 | −0.0931 |
| Vertical center of gravity w.r.t. COR (m) | 1.0189 | 0.0998 |
| Pitch natural frequency, ω (rad/s) | 1.22 | 4.08 |
Table 2.
Peak pitch RAO (rad/m) of isolated and multiple WEC rotors with and without the PTO damping for different wave-heading angles (°).
Table 2.
Peak pitch RAO (rad/m) of isolated and multiple WEC rotors with and without the PTO damping for different wave-heading angles (°).
| Isolated | Multiple | |||
|---|---|---|---|---|
| Rotor 1 | Rotor 2 | Rotor 3 | ||
| Without PTO | 1.21, 2.248 | 1.23, 2.078 | 1.18, 1.844 | 1.23, 2.078 |
| 1.21, 2.096 | 1.22, 2.053 | 1.20, 1.803 | 1.19, 1.859 | |
| 1.21, 1.727 | 1.21, 1.690 | 1.21, 1.664 | 1.18, 1.659 | |
| With PTO | 1.20, 1.130 | 1.20, 1.113 | 1.18, 1.081 | 1.20, 1.113 |
| 1.19, 1.055 | 1.20, 1.050 | 1.18, 1.021 | 1.18, 1.025 | |
| 1.17, 0.881 | 1.17, 0.880 | 1.17, 0.870 | 1.15, 0.852 | |
Table 3.
Comparison of pitch RAO with and without PTO for linear BEM and nonlinear CFD results.
| Solution | PTO Damping | Isolated WEC Rotor | Multiple | q-factor | ||
|---|---|---|---|---|---|---|
| WEC Rotor 1 | WEC Rotor 2 | WEC Rotor 3 | ||||
| Linear BEM | Without | 1.473 | 1.446 | 1.513 | 1.446 | 0.997 |
| 2.231 | 2.027 | 1.816 | 2.027 | 0.877 | ||
| 1.627 | 1.645 | 1.526 | 1.645 | 0.987 | ||
| With | 1.344 | 1.343 | 1.359 | 1.343 | 1.003 | |
| 1.506 | 1.484 | 1.435 | 1.484 | 0.975 | ||
| 1.326 | 1.337 | 1.300 | 1.337 | 0.999 | ||
| Nonlinear CFD | Without | 1.525 | 1.509 | 1.575 | 1.509 | 1.004 |
| 1.674 | 1.645 | 1.656 | 1.645 | 0.985 | ||
| 1.651 | 1.601 | 1.574 | 1.601 | 0.964 | ||
| With | 1.242 | 1.299 | 1.361 | 1.299 | 1.063 | |
| 1.501 | 1.289 | 1.285 | 1.289 | 0.858 | ||
| 1.000 | 0.997 | 0.916 | 0.997 | 0.970 | ||
Table 4.
Peak time-averaged optimum extracted power Popt in kW of isolated and multiple WEC rotors for different wave-heading angles (°).
Table 4.
Peak time-averaged optimum extracted power Popt in kW of isolated and multiple WEC rotors for different wave-heading angles (°).
| Solution | Isolated WEC Rotor | Multiple | ||
|---|---|---|---|---|
| WEC Rotor 1 | WEC Rotor 2 | WEC Rotor 3 | ||
| Linear | 32.834 | 32.375 | 29.577 | 32.375 |
| 28.364 | 28.303 | 26.370 | 26.350 | |
| 19.043 | 19.094 | 18.563 | 17.082 | |
Table 5.
Comparison of time-averaged optimum extracted power Popt in kW of isolated and multiple WEC rotors for different wave frequencies (rad/s).
Table 5.
Comparison of time-averaged optimum extracted power Popt in kW of isolated and multiple WEC rotors for different wave frequencies (rad/s).
| Solution | Isolated | Multiple | ||
|---|---|---|---|---|
| WEC Rotor 1 | WEC Rotor 2 | WEC Rotor 3 | ||
| Linear | 20.908 | 20.879 | 21.360 | 20.879 |
| 31.791 | 30.874 | 28.885 | 30.874 | |
| 29.800 | 30.347 | 28.658 | 30.348 | |
| Nonlinear | 17.836 | 19.521 | 21.440 | 19.521 |
| 26.054 | 19.209 | 19.109 | 19.209 | |
| 11.570 | 11.494 | 9.716 | 11.494 | |
Publisher’s Note: MDPI stays neutral with regard to jurisdictional claims in published maps and institutional affiliations. |
© 2021 by the authors. Licensee MDPI, Basel, Switzerland. This article is an open access article distributed under the terms and conditions of the Creative Commons Attribution (CC BY) license (https://creativecommons.org/licenses/by/4.0/).
Share and Cite
MDPI and ACS Style
Poguluri, S.K.; Kim, D.; Bae, Y.H. Hydrodynamic Analysis of a Multibody Wave Energy Converter in Regular Waves. Processes 2021, 9, 1233. https://0-doi-org.brum.beds.ac.uk/10.3390/pr9071233
AMA Style
Poguluri SK, Kim D, Bae YH. Hydrodynamic Analysis of a Multibody Wave Energy Converter in Regular Waves. Processes. 2021; 9(7):1233. https://0-doi-org.brum.beds.ac.uk/10.3390/pr9071233
Chicago/Turabian StylePoguluri, Sunny Kumar, Dongeun Kim, and Yoon Hyeok Bae. 2021. "Hydrodynamic Analysis of a Multibody Wave Energy Converter in Regular Waves" Processes 9, no. 7: 1233. https://0-doi-org.brum.beds.ac.uk/10.3390/pr9071233
Note that from the first issue of 2016, this journal uses article numbers instead of page numbers. See further details here.