
Ultra-Fast Electrochemical Sensor for Point-of-Care COVID-19 Diagnosis Using Non-Invasive Saliva Sampling


1
Chemical and Electrochemical Technology and Innovation (CETI) Laboratory, Department of Chemical Engineering, Texas Tech University, Lubbock, TX 79409, USA
2
Department of Immunology and Molecular Microbiology, Texas Tech University Health Sciences Center, Lubbock, TX 79430, USA
*
Author to whom correspondence should be addressed.
Processes 2021, 9(7), 1236; https://0-doi-org.brum.beds.ac.uk/10.3390/pr9071236
Submission received: 1 July 2021
/
Revised: 13 July 2021
/
Accepted: 15 July 2021
/
Published: 17 July 2021
(This article belongs to the Special Issue Advanced Applications, Processes, and Materials in Microbial Electrochemical Technologies)
Abstract
:Point-of-care diagnostic devices that are rapid and reliable remain as an unmet need highlighted by the coronavirus disease (COVID-19) pandemic crisis. The second/third wave of virus spread in various parts of the world combined with new evidence of re-infections and inadequate healthcare facilities demand increased testing rate to diagnose COVID-19 at its core. Although traditional molecular diagnostic tests have served this purpose, there have been shortage of reagents and other supplies at pandemic frontlines. This calls for novel alternate diagnostic processes with potential for obtaining emergency use authorization and that can be deployed in the field at the earliest opportunity. Here, we show an ultra-fast SARS-CoV-2 detection sensor for detecting coronavirus proteins in saliva within 100 milliseconds. Electrochemical oxidation of nickel hydroxide has been controlled using cyclic voltammetry and chronoamperometry techniques for successful detection of SARS-CoV-2. Test results have proven the capability of sensors to quantitatively detect the concentration of virus in blinded analyses. The detection occurs by a process similar to that of SARS-CoV-2 binding onto host cells. The sensor also shows prospects in distinguishing SARS-CoV-2 from other viruses such as HIV. More importantly, the sensor matches the detection limit of the gold standard test for diagnosing early infection. The use of saliva as a non-invasive sampling technique combined with the portability of the instrument has broadened the potential of this sensor.
1. Introduction
Rapid and reliable diagnostic techniques for viral detection are of utmost importance for early the diagnosis and healthcare of affected individuals, especially during a pandemic crisis. The number of people infected by severe acute respiratory syndrome coronavirus 2 (SARS-CoV-2) has been escalating since late 2019. Although the spread of virus seems to be contained in some countries, lately several other countries have just started showing exponential increases in the number of positive cases. Unfortunately, a second/third wave of the virus transmission [1,2,3,4] reflects the challenge of containing a virus with such high transmission rates, reproduction number [5,6] and infectious period [7]. In addition, re-occurrence of COVID-19 [8] has accentuated the need for continued testing. On the other end of the spectrum is the challenge of diagnosing the affected individuals early enough to prevent further viral transmission, particularly when social distancing and face covering restrictions have been significantly relaxed after the advent of the vaccine. Moreover, the shortage of hospital beds and ventilators emphasize the need for early diagnosis to treat patients at the earliest possible moment and not having to admit them in hospitals with severe infection [2,9].
Reverse transcriptase polymerase chain reaction (RT-PCR) is the primary diagnostic tool used in clinical laboratories for SARS-CoV-2 detection [10,11,12]. Nevertheless, RT-PCR requires specialized equipment and trained staff and facilities for turnaround time, result interpretation and decision-making from the obtained data at the point-of-care [13,14], which strains large scale testing. Efforts to employ rapid screening methods such as antibody testing have helped to prioritize the molecular diagnoses of SARS-CoV-2 infected subjects by RT-PCR. However, antibody-based testing techniques may not detect these infections at early phases [15]. Hence, there is an enormous demand for alternate, portable and user-friendly point-of-care techniques with potential for scaling up to rapidly and reliably diagnose samples for meeting the testing requirement [11,13,16].
In terms of sample collection, nasal samples, sputum, blood, urine and feces have all been used as clinical specimens for detection using RT-PCR [17]. Of these samples, typically nasopharyngeal and oropharyngeal swabs are widely used in the diagnosis of early infection [18,19]. However, these sample collection techniques suffer from certain limitations including unpleasant sample collection procedure, especially for children [20,21], shortage of reagents including the viral transport media [12], increased false negative rates [22] due to insufficient sampling of nasal cells and an increased risk of occupational exposure among the clinical staff who collect the samples at the frontlines. The oral throat wash may provide deeper access to the oropharyngeal area. Nevertheless, the collection of this type of specimen requires solutions for gargling, which may bring false negatives at the very beginning of the infection and a result of extra dilution of viral particles. Therefore, the use of neat saliva as an alternate non-invasively collected sample for COVID-19 diagnosis is being investigated [23,24]. The basis for using saliva as a potential alternate comes from previous evidence with another pandemic virus, H1N1 Influenza [21]. Several articles have shown that 85–92% of individuals infected with SARS-CoV-2 carry detectable virus in saliva [23,25,26,27]. These studies favor the use of saliva as the preferred non-invasive tool in COVID-19 diagnosis, which could be easily utilized in alternate COVID-19 screening approaches that, ideally, are highly sensitive, specific and portable.
Herein, we present an ultra-rapid and reliable point-of-care electrochemical alternative called Ultra-fast COVID-19 detection sensor (UFC-19) [28] for screening the exponentially increasing number of samples for identification of SARS-CoV-2 infection, especially during early infection. This nickel-based sensor directly analyzes electrochemical interactions between the sensor probe (electrode/electrolyte interface) and viral proteins contained in saliva within 100 milliseconds (ms). UFC-19 also has the ability to distinguish SARS-CoV-2 from HIV which could provide insights into COVID-19 diagnosis in the presence of co-infecting pathogens, which is a facet of COVID-19 that remains mostly unexplored.
2. Materials and Methods
2.1. Reagents
All the solutions used in our experiments are commercially available, including 1N KOH solution in water (ACROS OrganicsTM, Fair Lawn, NJ, USA, Lot# A0411825), phosphate buffered saline (PBS) solution (Corning, Manassas, VA, USA), medical-grade artificial saliva (Pickering Laboratories, Inc, Mountain View, CA, USA), and pooled normal human saliva (Innovative Research, Novi, MI, USA, Catalog# IRHUSL5ML). We used recombinant HIV-1 HXB2 NEF protein (ARP-13342, NIH HIV Reagent Program, Division of AIDS, contributed by NIAID,DAIDS) and recombinant SARS-CoV-2 spike protein (RayBiotech Life, Inc., Peachtree Corners, GA, USA or Sino Biological Inc., Beijing, China). For experiments involving HIV-infected cells, we transfected HEK-293 cells with pNL43 plasmids encoding for full length HIV tagged to Ds-Red fluorescent tag. HEK-293 cells were obtained from the NIH HIV Reagent Program (ARP-103, Division of AIDS, contributed by Dr. Andrew Rice) and plasmids. The HIV expression was confirmed by either flow cytometry or live cell fluorescent imaging. The HIV-infected cells were pelleted and resuspended in PBS for testing using the UFC-19 prototype.
2.2. Electrode Probe Configuration
2.2.1. Rotating Disk Electrode (RDE) Setup
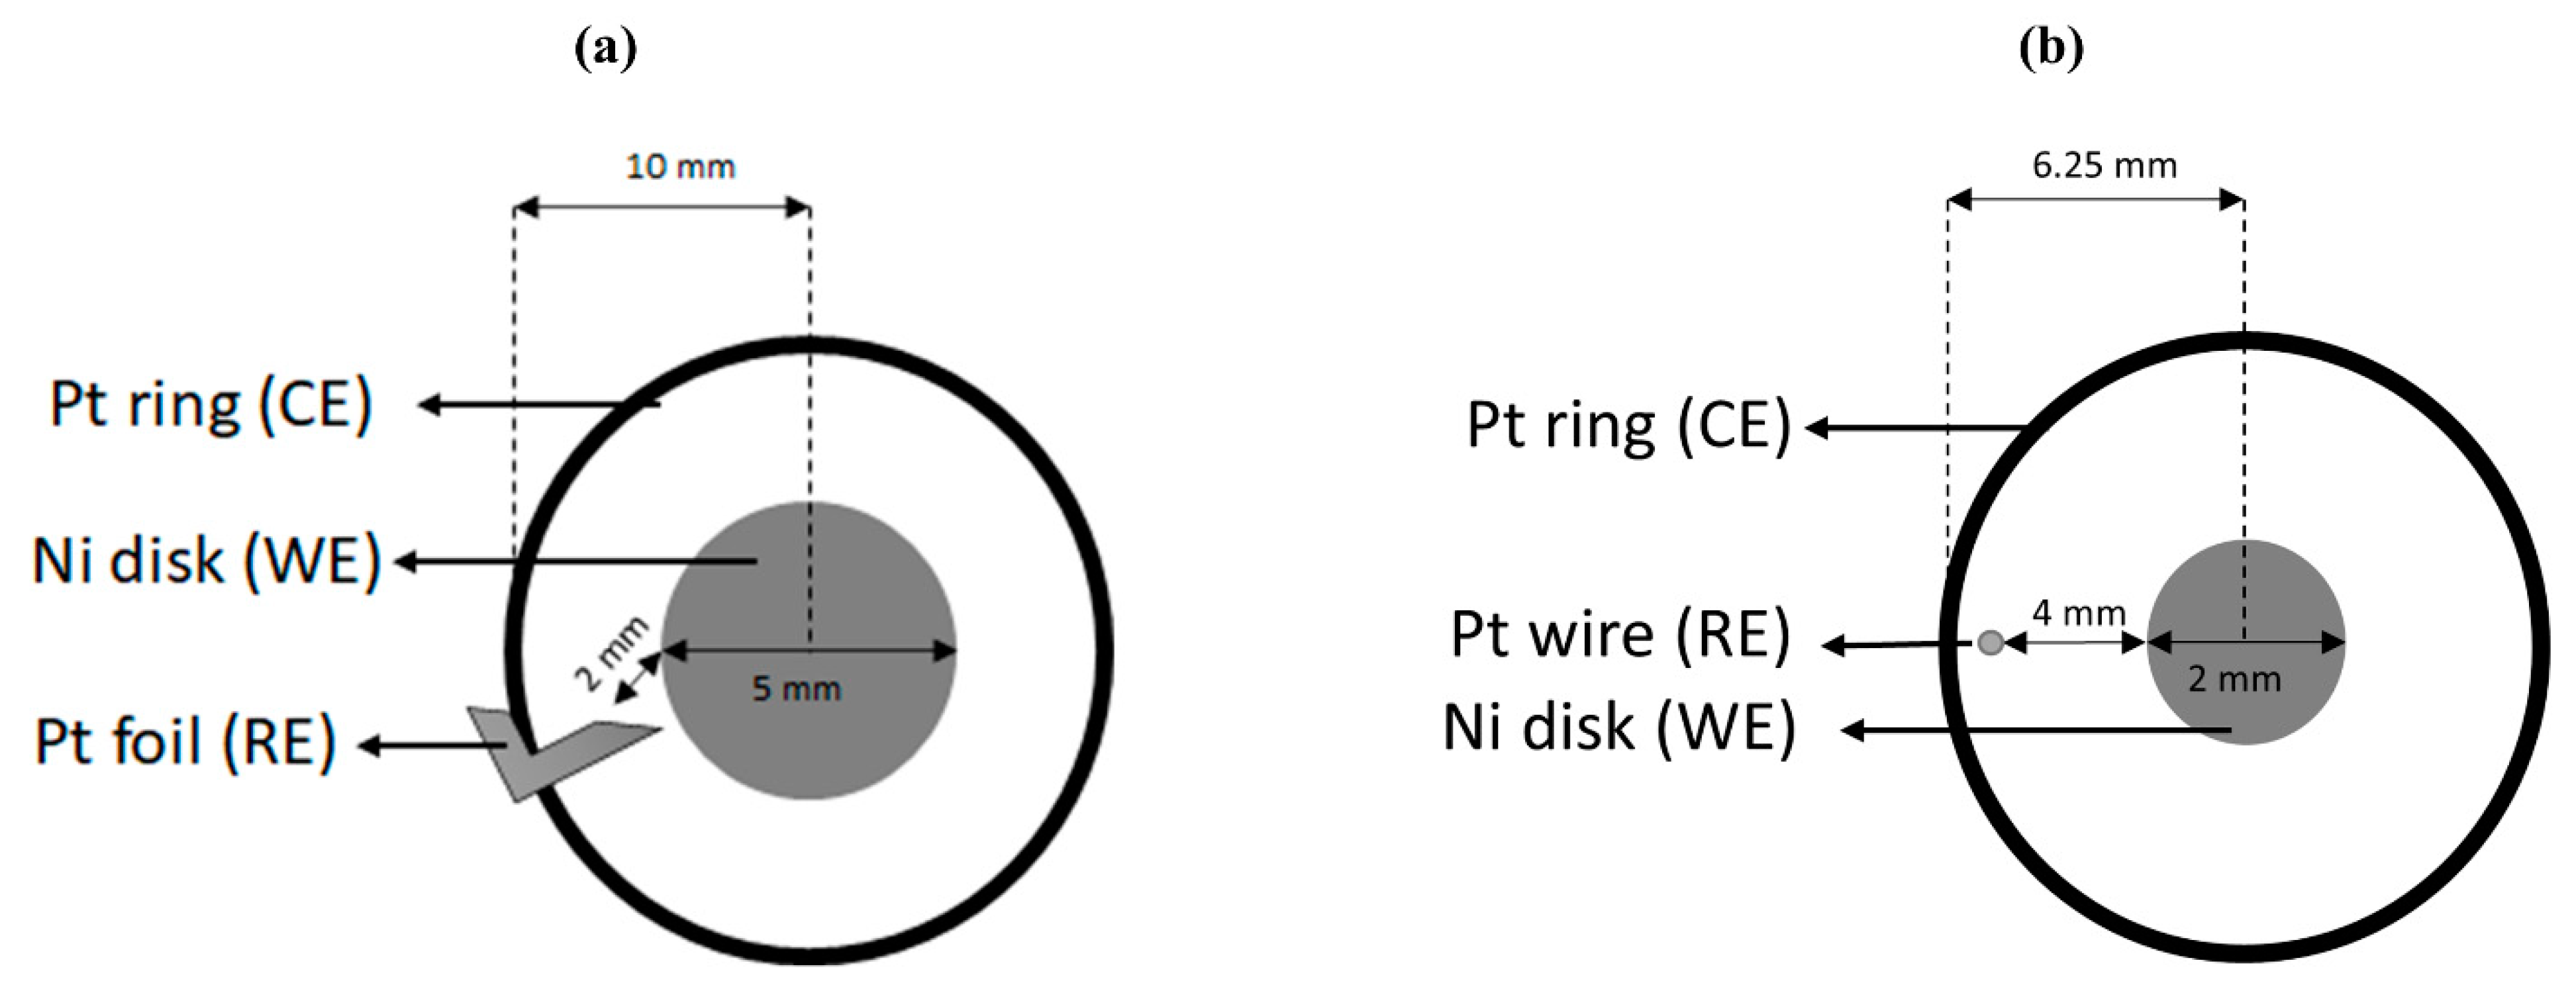
The 3-electrode electrochemical system (Figure 1a) comprised of a nickel (Pine Research Instrumentation Inc., Durham, NC, USA, AFED050P040NI) working electrode (WE) of 5 mm diameter at the center inserted in a rotating disk electrode setup (Pine Instrument Company MSRX Speed Control Analytical Rotator, Grove City, PA, USA) surrounded by a concentric platinum ring (ESPI metals, Ashland, OR, USA 0.75 in * 0.2 in * 0.005 in, 3N5 purity) as the counter electrode (CE). The distance of separation between the working and counter electrodes was 10 mm. A platinum foil (ESPI metals, 0.3 in * 0.1 in * 0.005 in, 3N5 purity) was used as the pseudo reference electrode (RE) for these experiments. The reference electrode was placed 2 mm below the working electrode. Nickel wires (Alfa Aesar, Haverhill, MA, USA, 99.5%, 1 mm diameter) were spot welded (Miller® resistance spot welder SSW-2020ATT, Miller Electric Mfg. Co., Appleton, WI, USA, 9 A/s) to the reference and counter electrodes and used for current collection. A gold contact attached to the shaft of the rotating disk electrode on the flip side of nickel disk was used as current collector for working electrode. The sample volume tested using this setup was 20 mL.
2.2.2. Miniature RDE Setup
A miniature version of the RDE setup was used for experiments related to the determination of detection limit. Although the core configuration of this miniature RDE was similar to the RDE setup, minor modifications were made. The sample volume tested using the miniature RDE was 2 mL. Figure 1b shows that the nickel working electrode was reduced to 2 mm diameter with counter and reference electrodes made from a platinum wire (Alfa Aesar, Haverhill, MA, USA, Lot# Q08F020). The platinum counter electrode was shaped into a ring (12.5 mm diameter) and placed concentric to the working electrode. The platinum reference electrode was a piece of wire (3 mm) placed between the working and counter electrodes. The current collectors for the counter and reference electrodes were nickel wires (Alfa Aesar, Lot# X28F026) spot welded onto these electrodes using a SUNKKO® 737G+ Battery Spot Welder (Sunkko, Las Vegas, NV, USA, Pulse: 1, Current: 18).
2.3. Testing Procedure
The standard operating procedure for each sample consisted of three steps, namely cyclic voltammetry (activation), chronoamperometry (testing) and the rinsing step. A similar approach was previously used to detect the bacterium E. coli in water and wastewater [29]. The electrochemical measurements were performed using a Gamry FrameworkTM data acquisition software version 7.8.2 associated with Gamry Reference 600+ Potentiostat (Gamry Instruments, Warminster, PA, USA).
2.3.1. Activation
The cyclic voltammetry (CV) experiments were performed using the three-electrode system. The electrolyte was a commercially purchased 1N KOH solution. The CVs were performed in a potential window of 0.20 to 0.60 V and scan rate of 15 mV/s for 5 cycles, with the fifth cycle being the sustained periodic cycle. The CV experiments were performed under static conditions.
2.3.2. Sample Test
Once the CV curve was obtained, the sample for testing was prepared by adding the desired amount of protein or saliva and diluted using PBS solution. A solution of 1N KOH was used for adjusting the pH of this solution to 12. The final volumes of the samples were 20 mL or 2 mL for RDE experiments or miniature RDE experiments, respectively. All chronoamperometry experiments were performed at 1600 rpm. Chronoamperometry was performed by recording the open circuit potential followed by a fixed oxidation potential of 0.58 V vs. Pt for 5 s and a fixed reduction potential of 0.10 V vs. Pt for 15 s.
2.3.3. Rinse
The test solution was drained and fresh 1N KOH solution was added and held idle for 30 s to disinfect the chamber. This process was repeated twice before moving to the activation for subsequent test.
3. Results and Discussion
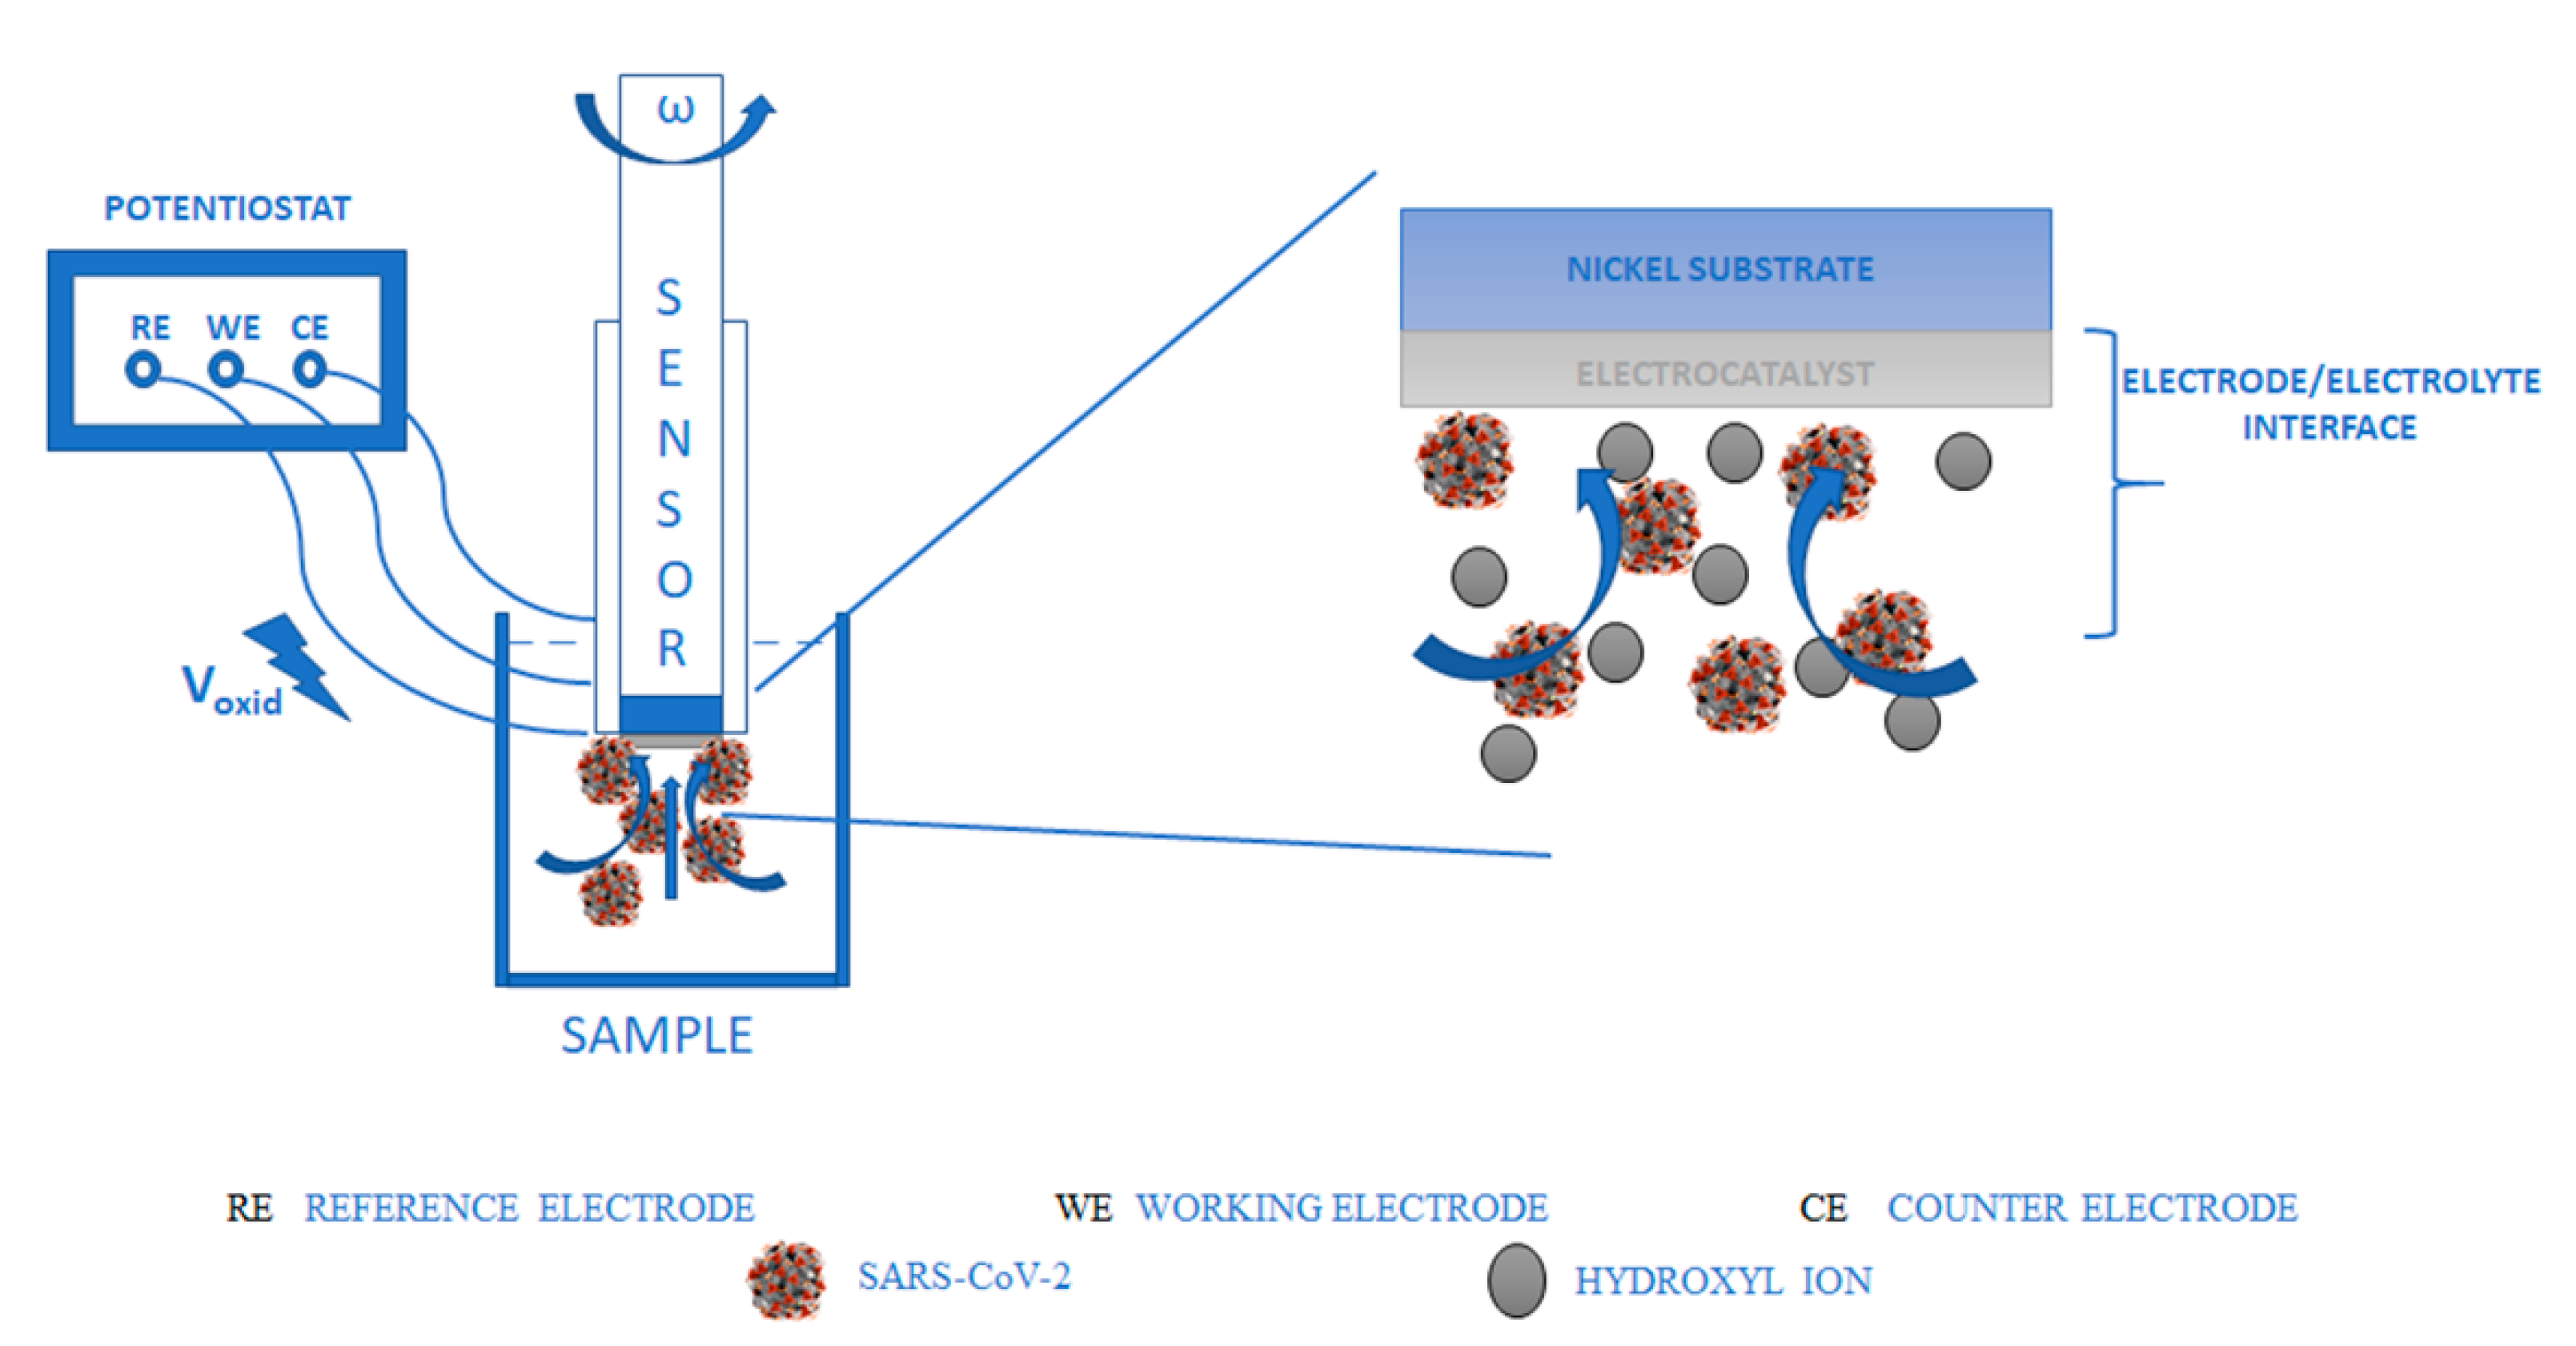
UFC-19 is an electrochemical sensor with a nickel working (sensing) electrode. A schematic of the experimental setup and a visualization of the electrode/electrolyte interface are shown in Figure 2. When nickel is placed in an alkaline medium, it is chemically oxidized to nickel hydroxide. This nickel hydroxide upon electrochemical oxidation forms nickel oxyhydroxide (NiOOH), as shown in Equation (1) [30].
3.1. Calibration Generation
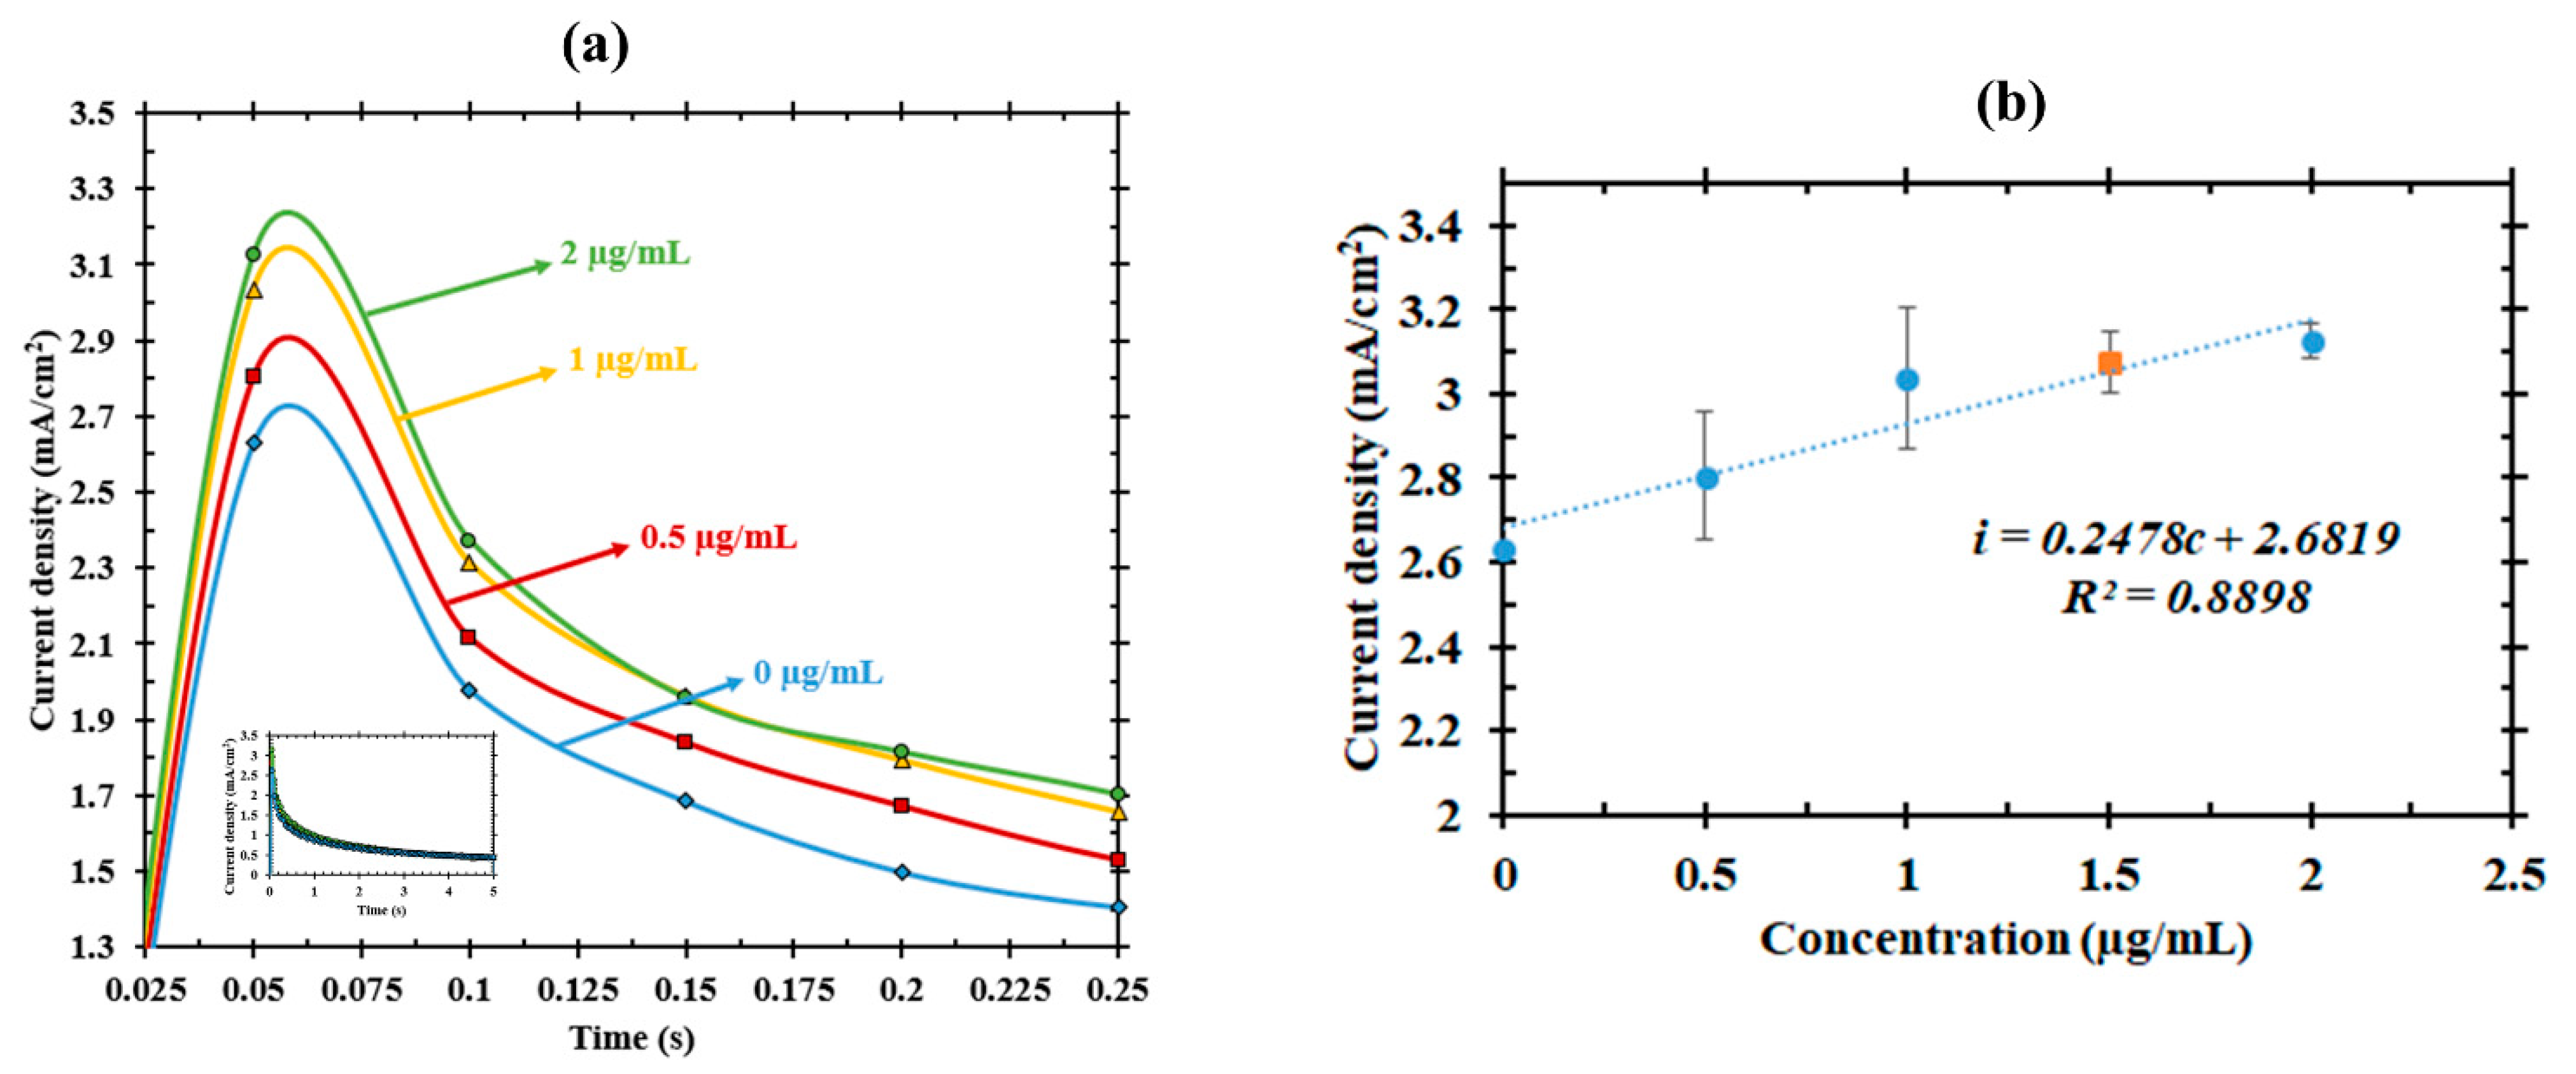
We detected and quantified the viral spike protein S1 in concentrations ranging from 10–40 µg (0.5 to 2 µg/mL). In the RDE setup, the S1 protein was diluted to 20 mL using phosphate buffer saline (PBS) and potassium hydroxide solution (KOH) and tested using our UFC-19 prototype in triplicates. The average electric current responses of the triplicates were recorded and shown in Figure 3a. The current responses increased with an increase in protein concentration. This increasing current with increasing spike protein concentration has also been observed in a field-effect transistor-based diagnostic technique [31] and a rolling circle amplification based electrochemical sensor [32]. Using the current density values at 50 ms time point, a calibration curve (Figure 3b) was plotted equating the electric current response as a function of concentration of SARS-CoV-2 spike protein. Least-squares linear regression was used to fit the data points (R2 = 0.89).
3.2. Calibration Validation
Our approach used the calibration curve obtained using known concentrations of the viral protein to predict the viral protein concentrations that were unknown to the researcher who analyzed the data in a blind fashion. The current density value recorded for the unknown sample at 50 ms was substituted in the calibration equation shown in Figure 3b to calculate the concentration of the sample. The actual concentration of the blind sample was 1.5 µg/mL (30 µg) and the concentration predicted by UFC-19 prototype was 1.59 µg/mL (31.8 µg) with only 6% error compared to the actual concentration. Based on the determination of analytical sensitivity of electrochemical biosensors using slope of the calibration curve [33], the sensitivity of UFC-19 is 0.25 (mA/cm2)/(µg/mL).
3.3. Specificity
It is conceivable that the sensor may encounter other viruses in co-infected individuals. In order to investigate the specificity of UFC-19 in capturing signals from SARS-CoV-2, a mixed solution containing equal quantities (10 µg each) of SARS-CoV-2 protein and Human Immunodeficiency Virus (HIV) NEF protein was prepared and tested. Although HIV is not a respiratory virus, both HIV and SARS-CoV are viruses with similar underlying disease-causing mechanisms, including severe immune cytopathic effects [34].
Moreover, the ability to distinguish HIV (or other viruses/bacteria) and SARS-CoV-2 is essential when co-infections are a concern due to the immunosuppressing capacities of viruses resulting in other infections. For instance, co-infection of SARS-CoV-2 and Influenza have been studied recently [35,36,37], as well as co-infections of HIV and SARS-CoV-2 [38,39,40]. Distinguishing these disease-causing viruses could be a critical parameter in prioritizing the treatment for individuals based on severity of the disease, especially during community transmission phases when available resources are limited [40]. We chose HIV as a testing co-pathogen to investigate the specificity of UFC-19 in the detection of SARS-CoV-2. While HIV is a retrovirus and SARS-CoV-2 is a coronavirus, the surface proteins in both are still foraneous to human saliva and will alter its electrochemical properties.
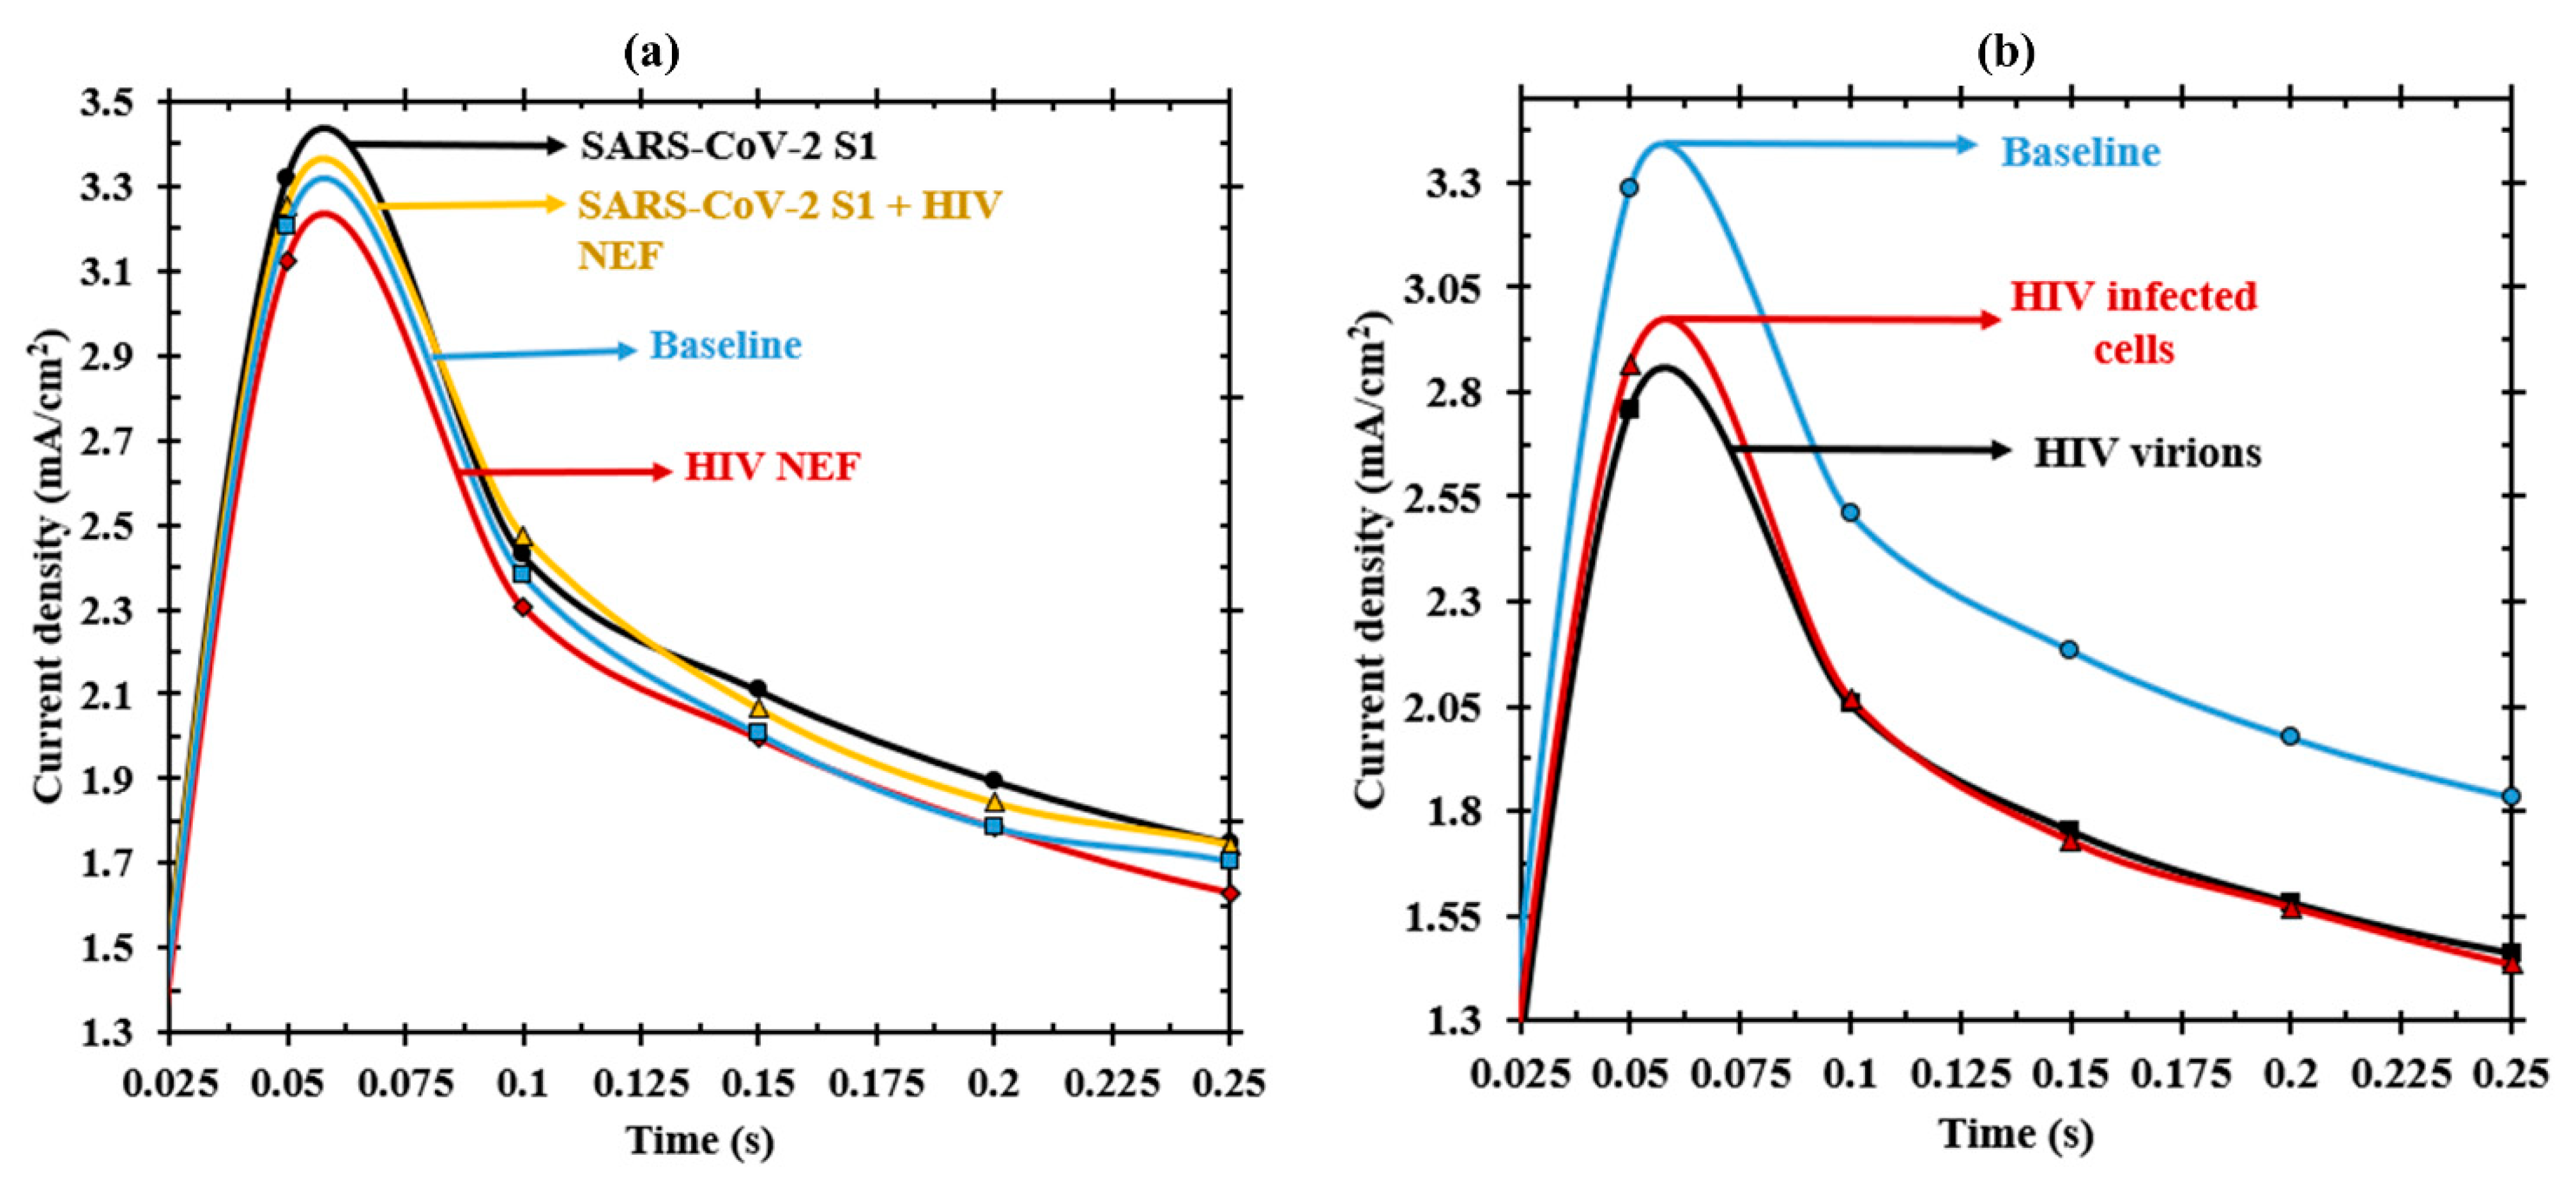
To this end, we challenged the device with saline solutions containing SARS-CoV-2 spike protein mixed with recombinant HIV protein or HIV-infected cells. The results suggest that the electrochemical response from the HIV NEF protein (red) can be clearly distinguished from that of the SARS-CoV-2 S1 protein (black). Figure 4a shows that S1 provides a positive current response compared to the baseline (blue) while NEF provides a negative current response as compared to baseline (there is a drop in current instead of increase). This trend was observed consistently even while testing cell-free HIV virions and cell-associated HIV cells in separate experiments (Figure 4b). This ability to distinguish between another pandemic virus suggests that UFC-19 has a high specificity towards SARS-CoV-2. Moreover, the electric current response of the mixed solution was compared to the current responses from same concentration (20 µg) of these individual proteins. It is evident from Figure 4a that the solution containing a mix of NEF and S1 (yellow) proteins responded in a similar manner with respect to the SARS-CoV-2 S1 protein alone (black). These responses even overlap around 75 ms, showing that the current from S1 protein dominates the current from NEF protein, thereby rendering a specific detection of S1 protein over NEF protein. A possible reason for this overlap is believed to be due to the SARS-CoV-2 showing stronger electrical signals compared to HIV. This hypothesis as well as the responses in the context of other viral diseases warrants further studies.
3.4. SARS-CoV-2 Detection in Saliva
Guided by our initial calibration and specificity results in a laboratory setup, we sought to leap a step further and test the samples in close-to-reality scenario. We sought a technique where sample collection was non-invasive (extends the applicability of the sensor as sample collection is easier). There are reports in the literature that 84.6% to 91.7% patients carry detectable virus in saliva [23,26,27]. Moreover, the salivary glands have been a target of previously known SARS-CoV [41,42]. These factors have shown that saliva is a carrier of symptomatic/asymptomatic COVID-19 infections [25,43,44]. Hence, we mixed the protein concentration of interest to medical-grade artificial saliva and mixed it with PBS and 1N potassium hydroxide solution (KOH) (commercial standardized solution) in a final volume of 20 mL to achieve a pH of 12. At such high pH, the cells and viruses will not be viable [45] and are expected to lyse and release proteins in the solution. Therefore, our experiments benefited from the use of recombinant viral proteins instead of the actual virus.
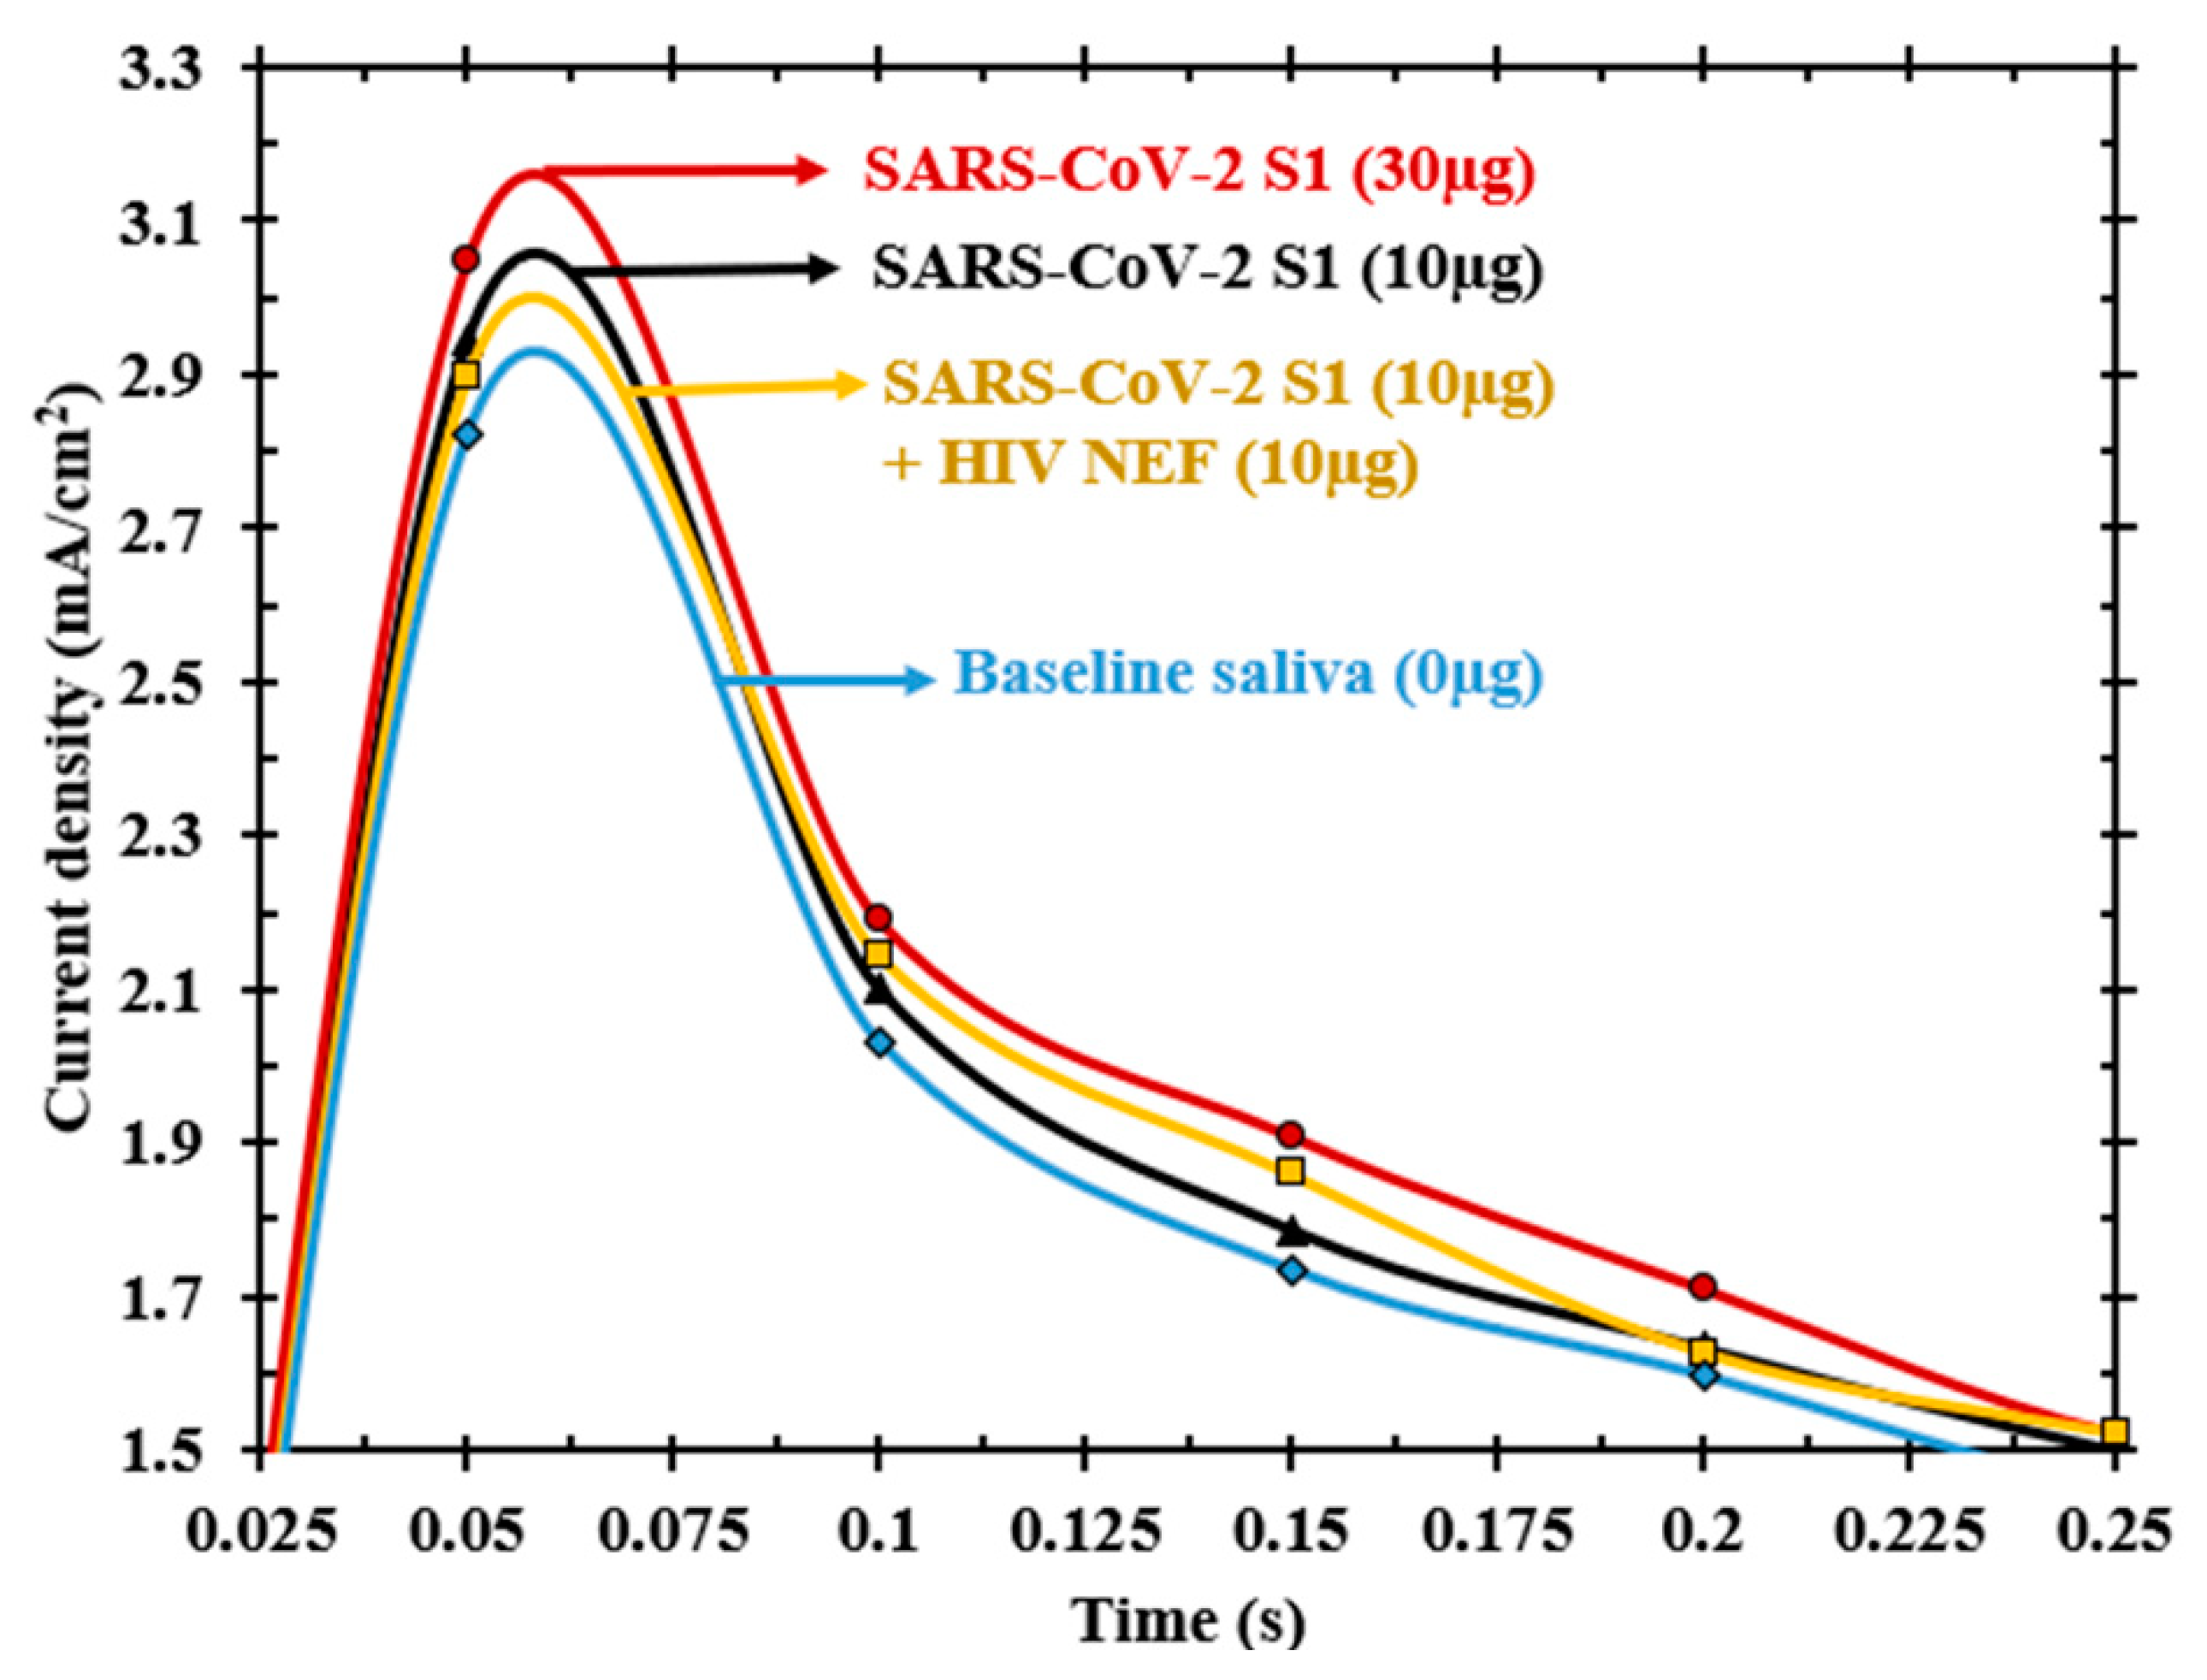
A new baseline/blank with saliva being included (no protein) was tested. We found that this baseline exactly overlapped with the baseline without saliva, proving that the use of saliva did not cause any hindrance to the testing procedure. Once the baseline with medical-grade saliva was established, two different concentrations of the S1 protein (10 and 30 µg) were mixed with the saliva to prepare the samples. The results of this experiment are illustrated in Figure 5. Similar to our observation in titrations (absence of saliva), there was an increasing current response with an increase in the concentration of viral protein, indicating that there was no interference from the components of saliva.
The specificity test was also repeated in saliva and the electric current response from a solution mixed (yellow) with 10 µg of S1 protein and 10 µg of HIV NEF protein can be observed in Figure 5. The response is still positive and comparable to 10 µg S1 protein rather than falling below the baseline and showing a false negative test result. These results indicate that UFC-19 only detected and recorded signals from the SARS-CoV-2 S1 protein.
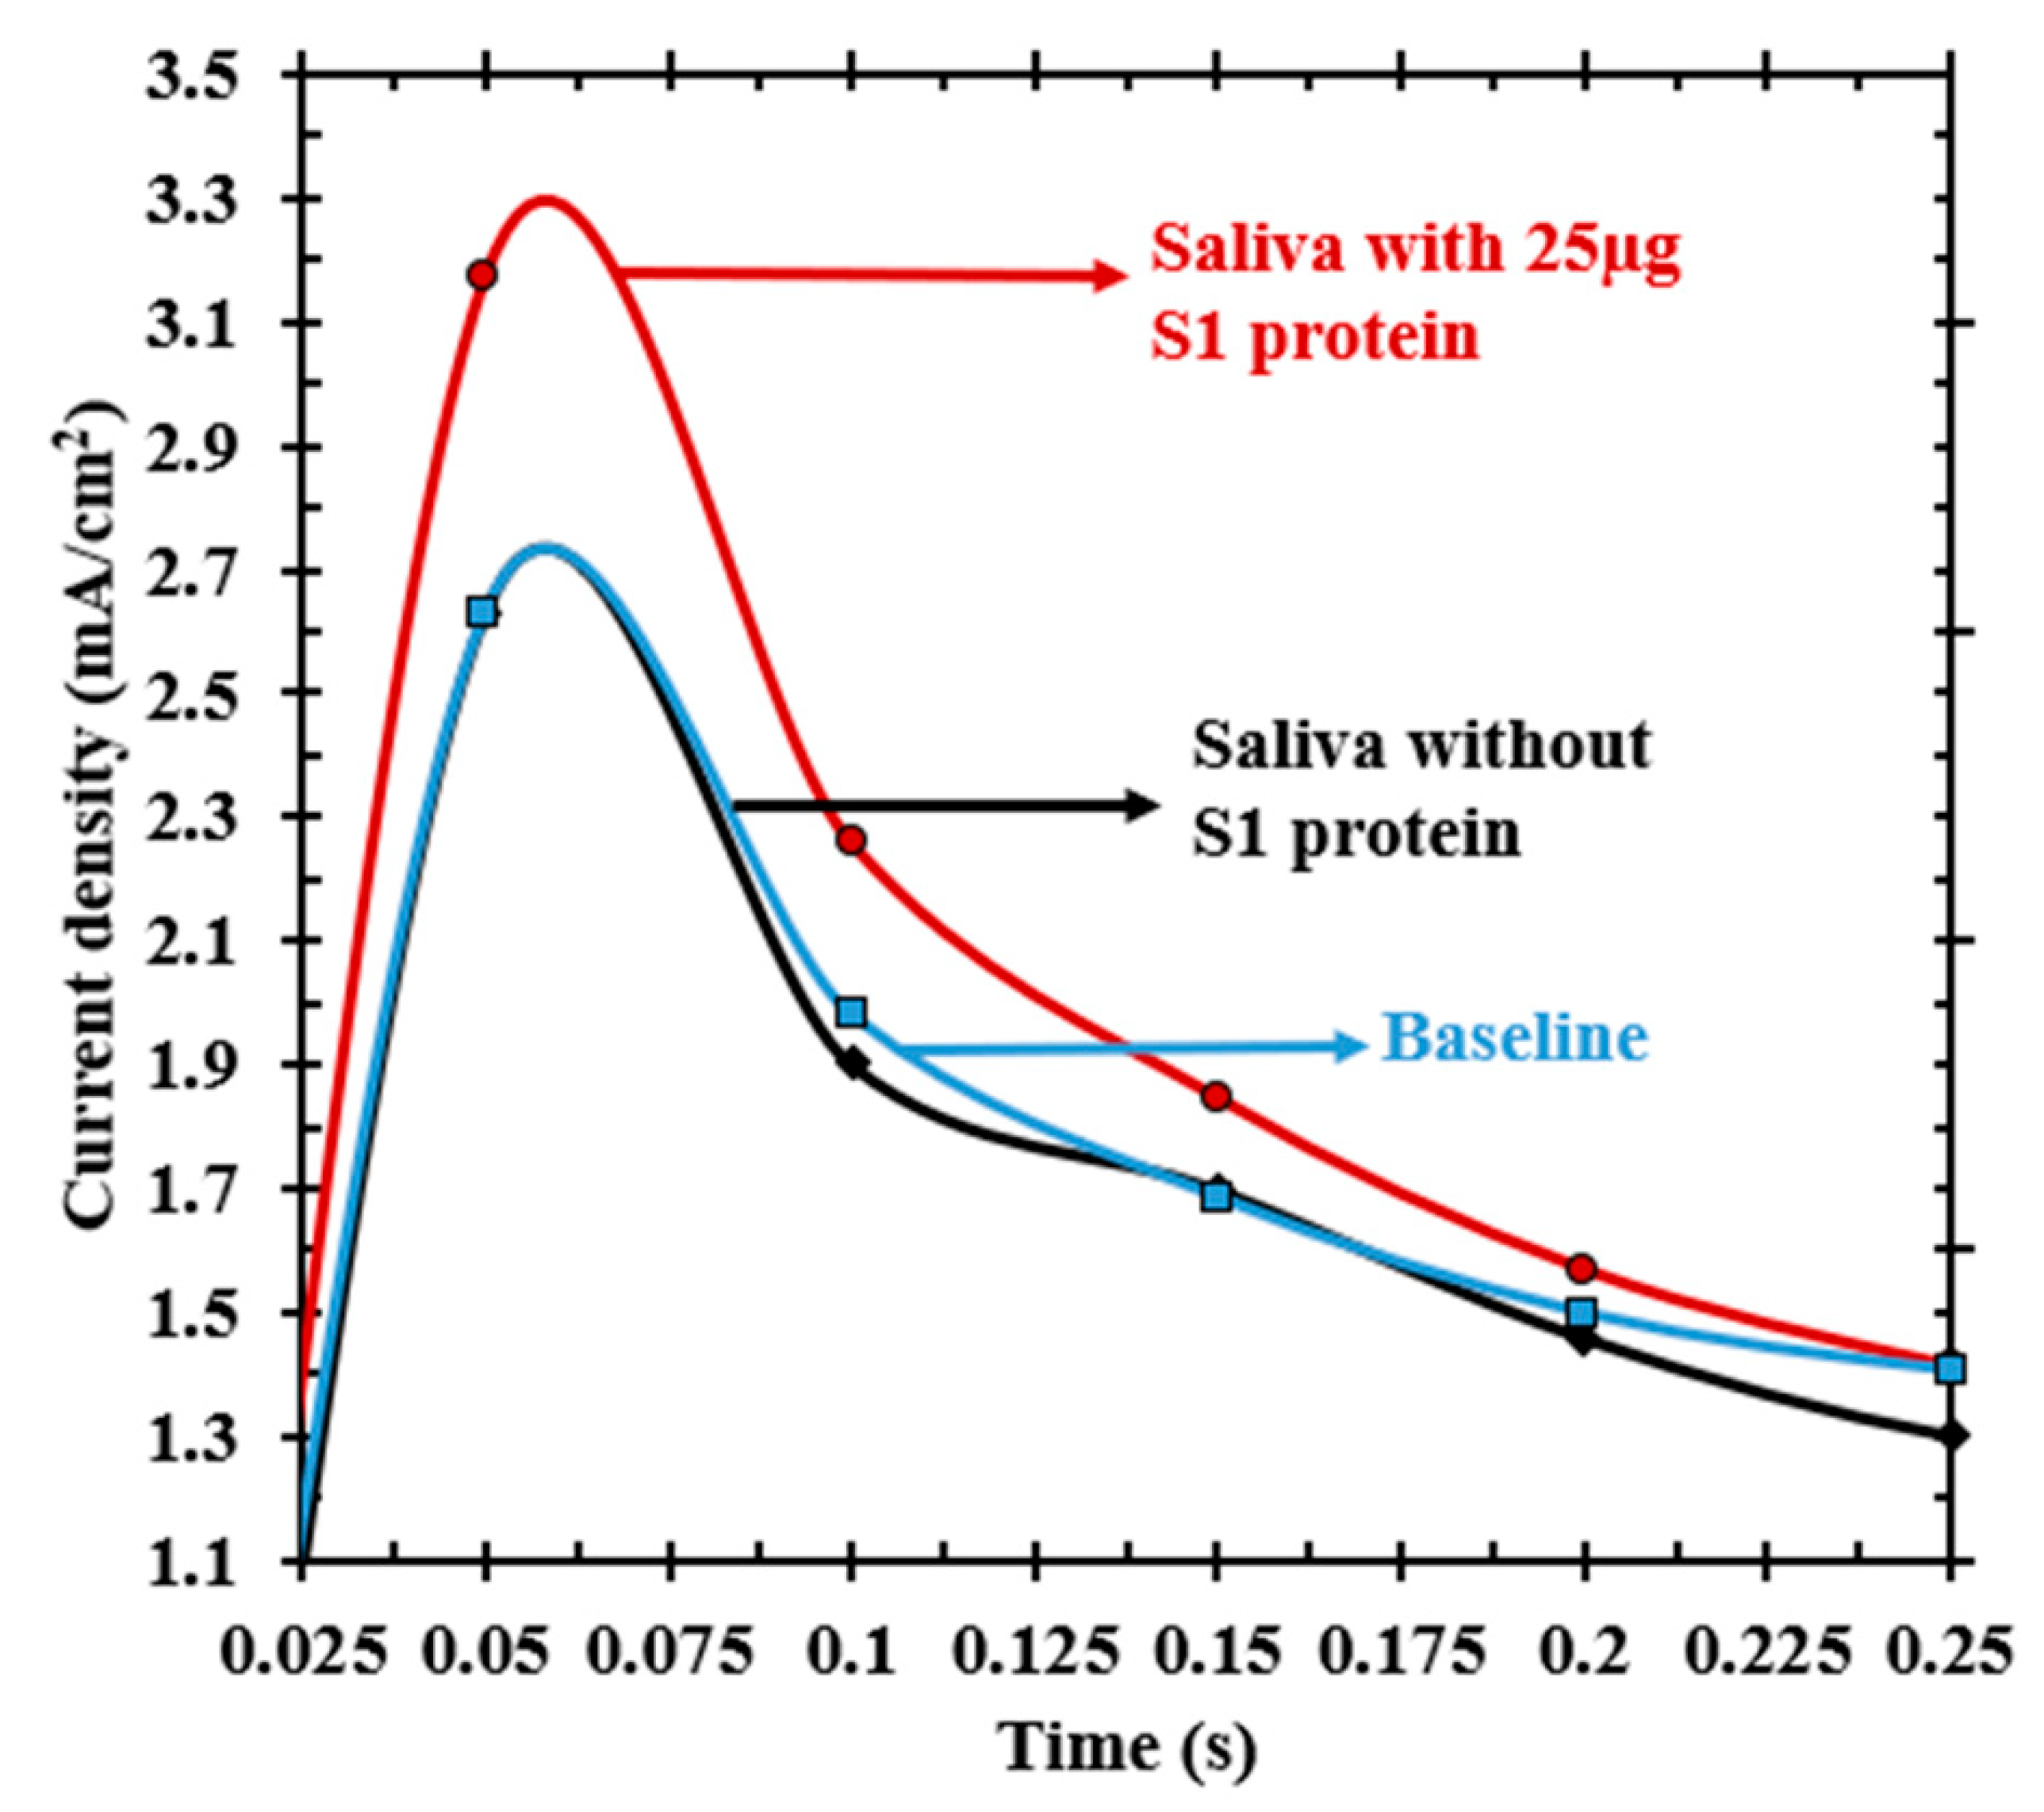
Since human saliva contains a variety of components including electrolytes and proteins such as enzymes and mucins [46], in addition to any potential contaminants present after food ingestion, we further investigated the electric current response profiles in commercially available human saliva as opposed to medical grade saliva. The results shown in Figure 6 indicate that the current response of saliva was not compromised due to any of the components or contaminants mentioned above. It is apparent that the currents of baseline KOH solution and human saliva solution without SARS-CoV-2 S1 protein overlapped with one another meaning that there was no interference from the constituents present in human saliva. It is significant that the proteins in human saliva did not interfere in the measurement indicating the specificity of UFC-19 to SARS-CoV-2 protein. The reason for saliva constituents not interfering with the measurement is presumed to be due to the addition of hydroxyl ions, which nullifies the effect of constituents present in saliva at pH 12. Our experiments with human saliva also passed the specificity/sensitivity tests after spiking the solutions with SARS CoV-2 protein (red). The solution with 25 µg of SARS-CoV-2 protein showed a clear separation in current from either the baseline or saliva solution without S1 protein (Figure 6). This increase in current for the saliva sample containing the SARS-CoV-2 S1 protein reassures UFC-19’s ability to detect the presence of viral protein in human saliva samples. These results show promise for using UFC-19 as a diagnostic tool for clinical trials.
3.5. Detection Limit for Practical Use
Despite establishing detection of SARS-CoV-2 viral proteins in medical grade and human saliva, we realized that the concentrations being tested were higher than the concentrations typically observed in COVID-19 positive patients. Current molecular diagnostic tests possess a detection limit of approximately 50 to 100 copies/mL [47,48]. Seo and co-workers developed a field-effect transistor (FET) based biosensor with detection limit 1 fg/mL in PBS and 242 copies/mL in clinical samples [31]. A recent study indicates that a detection limit of 1000 copies/mL was sufficient for diagnosing clinical samples during early infection [32]. Comparing these systems, a detection limit in the order of 1 fg/mL is required for detecting early infection in COVID-19 affected individuals.
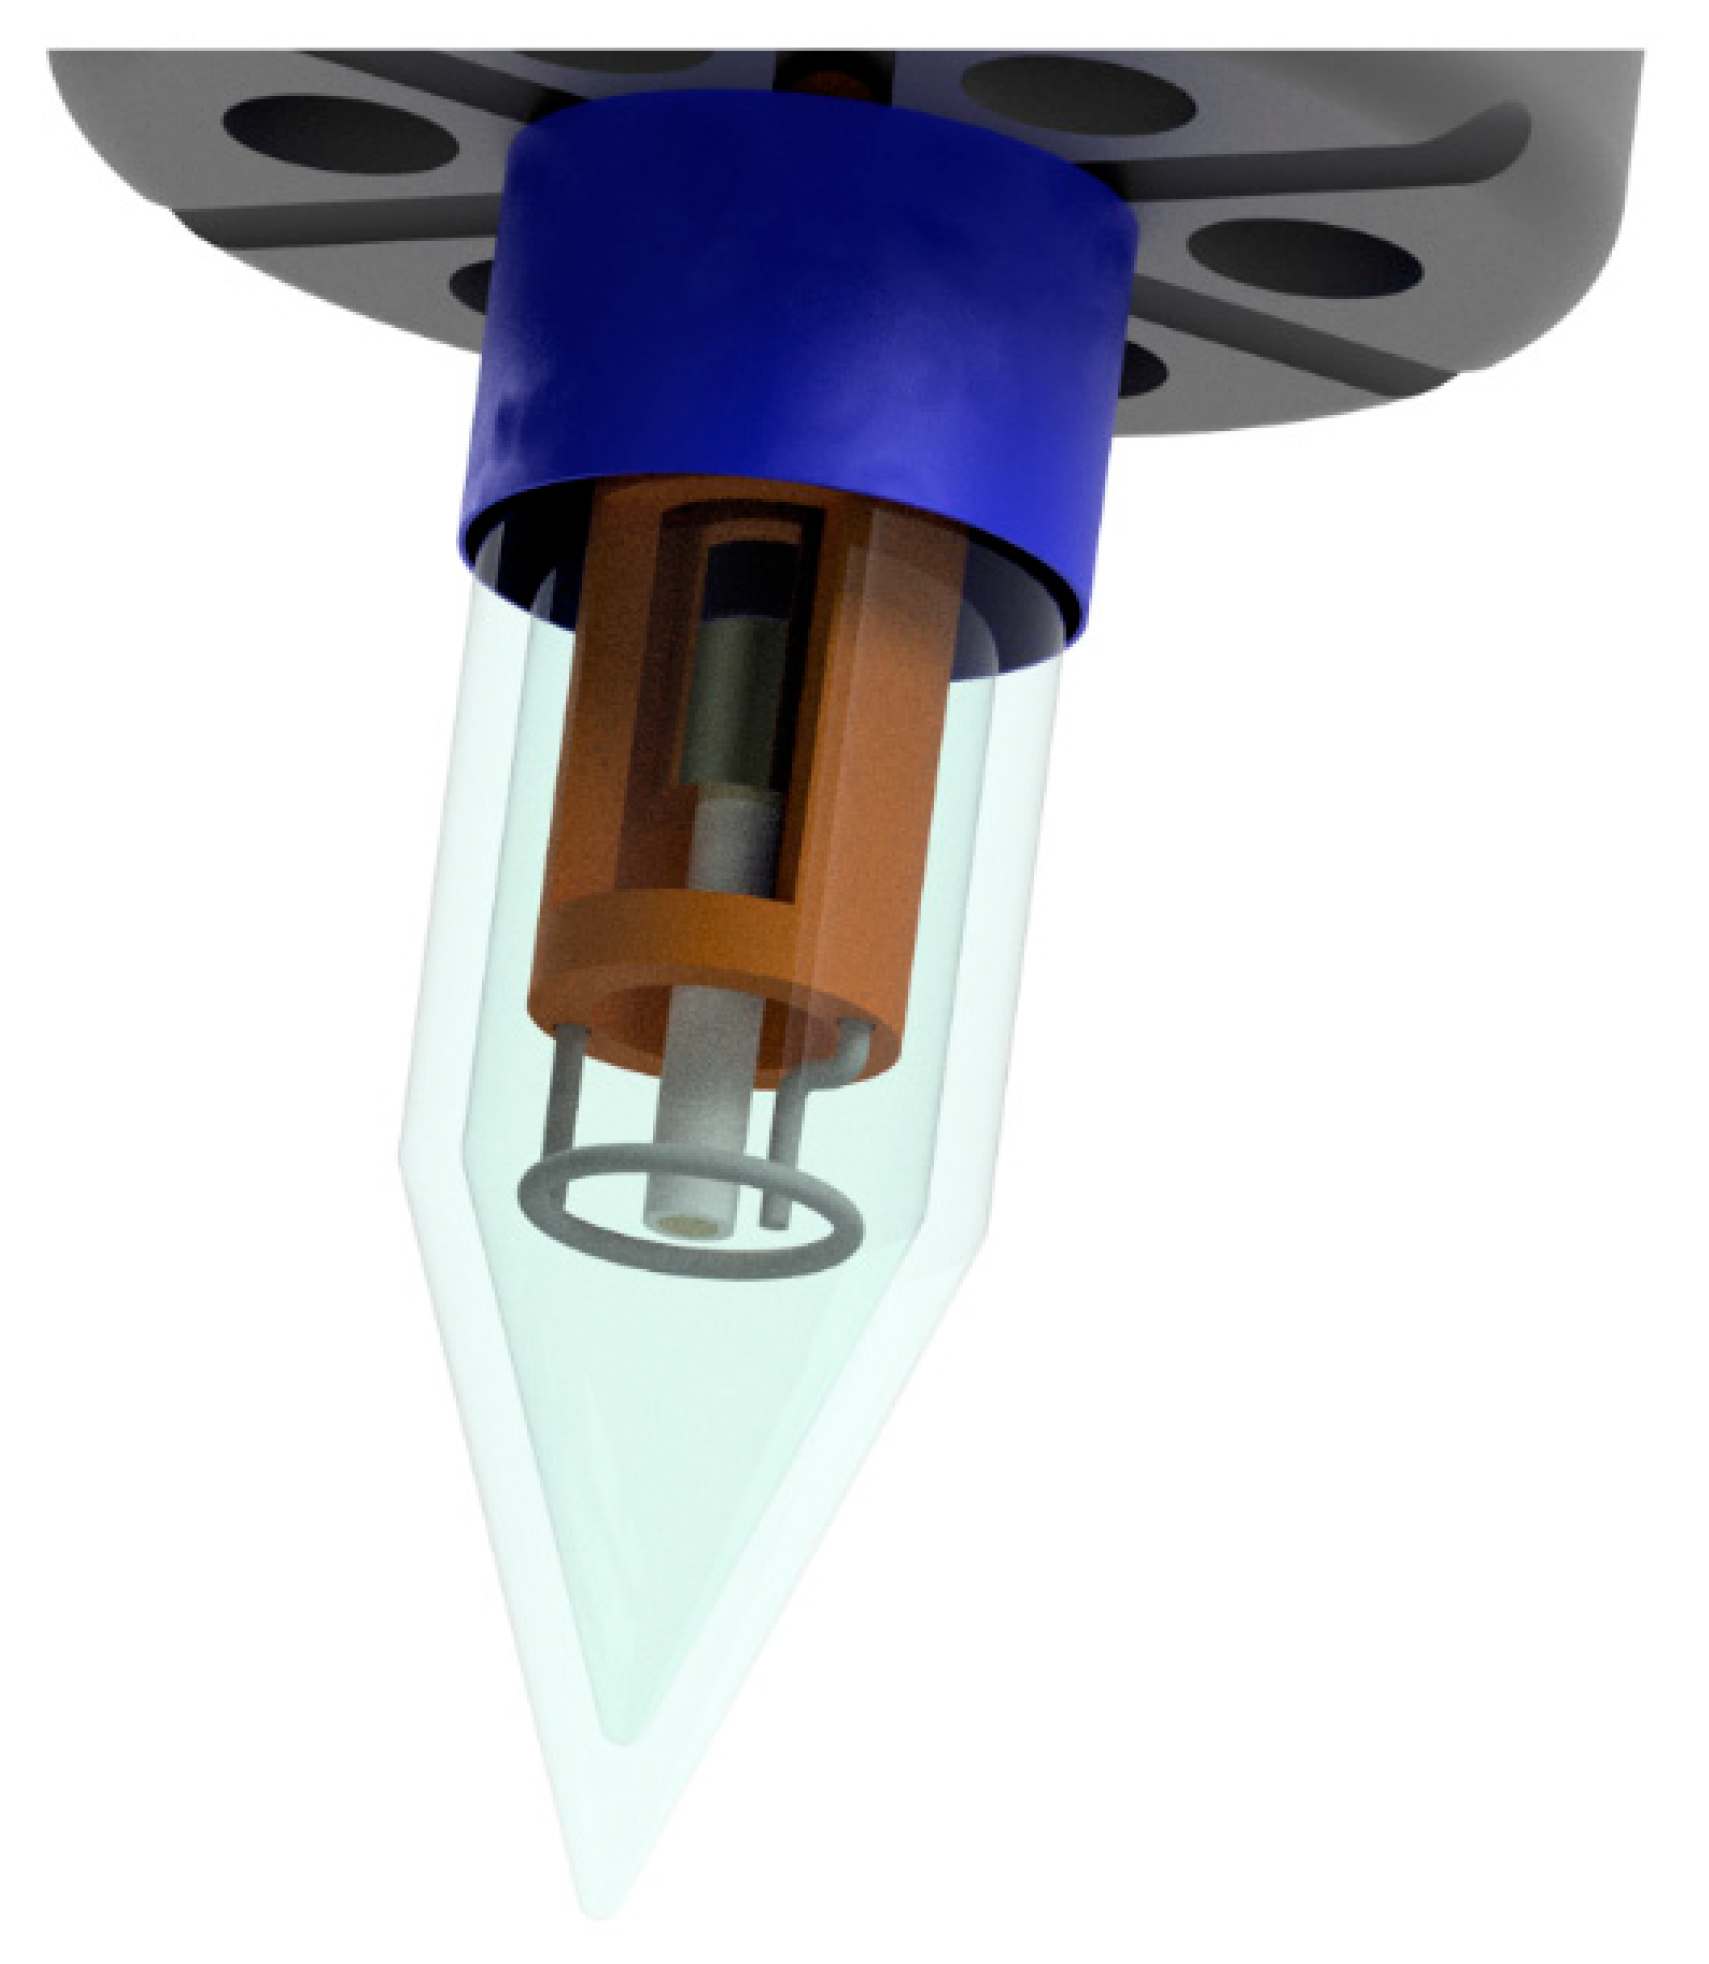
In order to achieve this detection limit, we made improvements to the RDE setup. First, the initial sample volume of 20 mL (including saliva, PBS solution and KOH solution to fit the sensing electrode) was reduced 10-fold down to 2 mL of pure (medical grade) saliva mixed with a minimal volume of KOH to adjust the pH to 12. This approach will compensate for the fact that the electrochemical detector does not involve any viral amplification steps such as those involved in RT-PCR. Moreover, the newly adjusted volume allows for miniaturization of the RDE setup, which increases portability at point-of-care. The miniaturized hand-held sensor probe can be observed in Figure 7 and a closer look at its tip can be observed in Figure 1b.
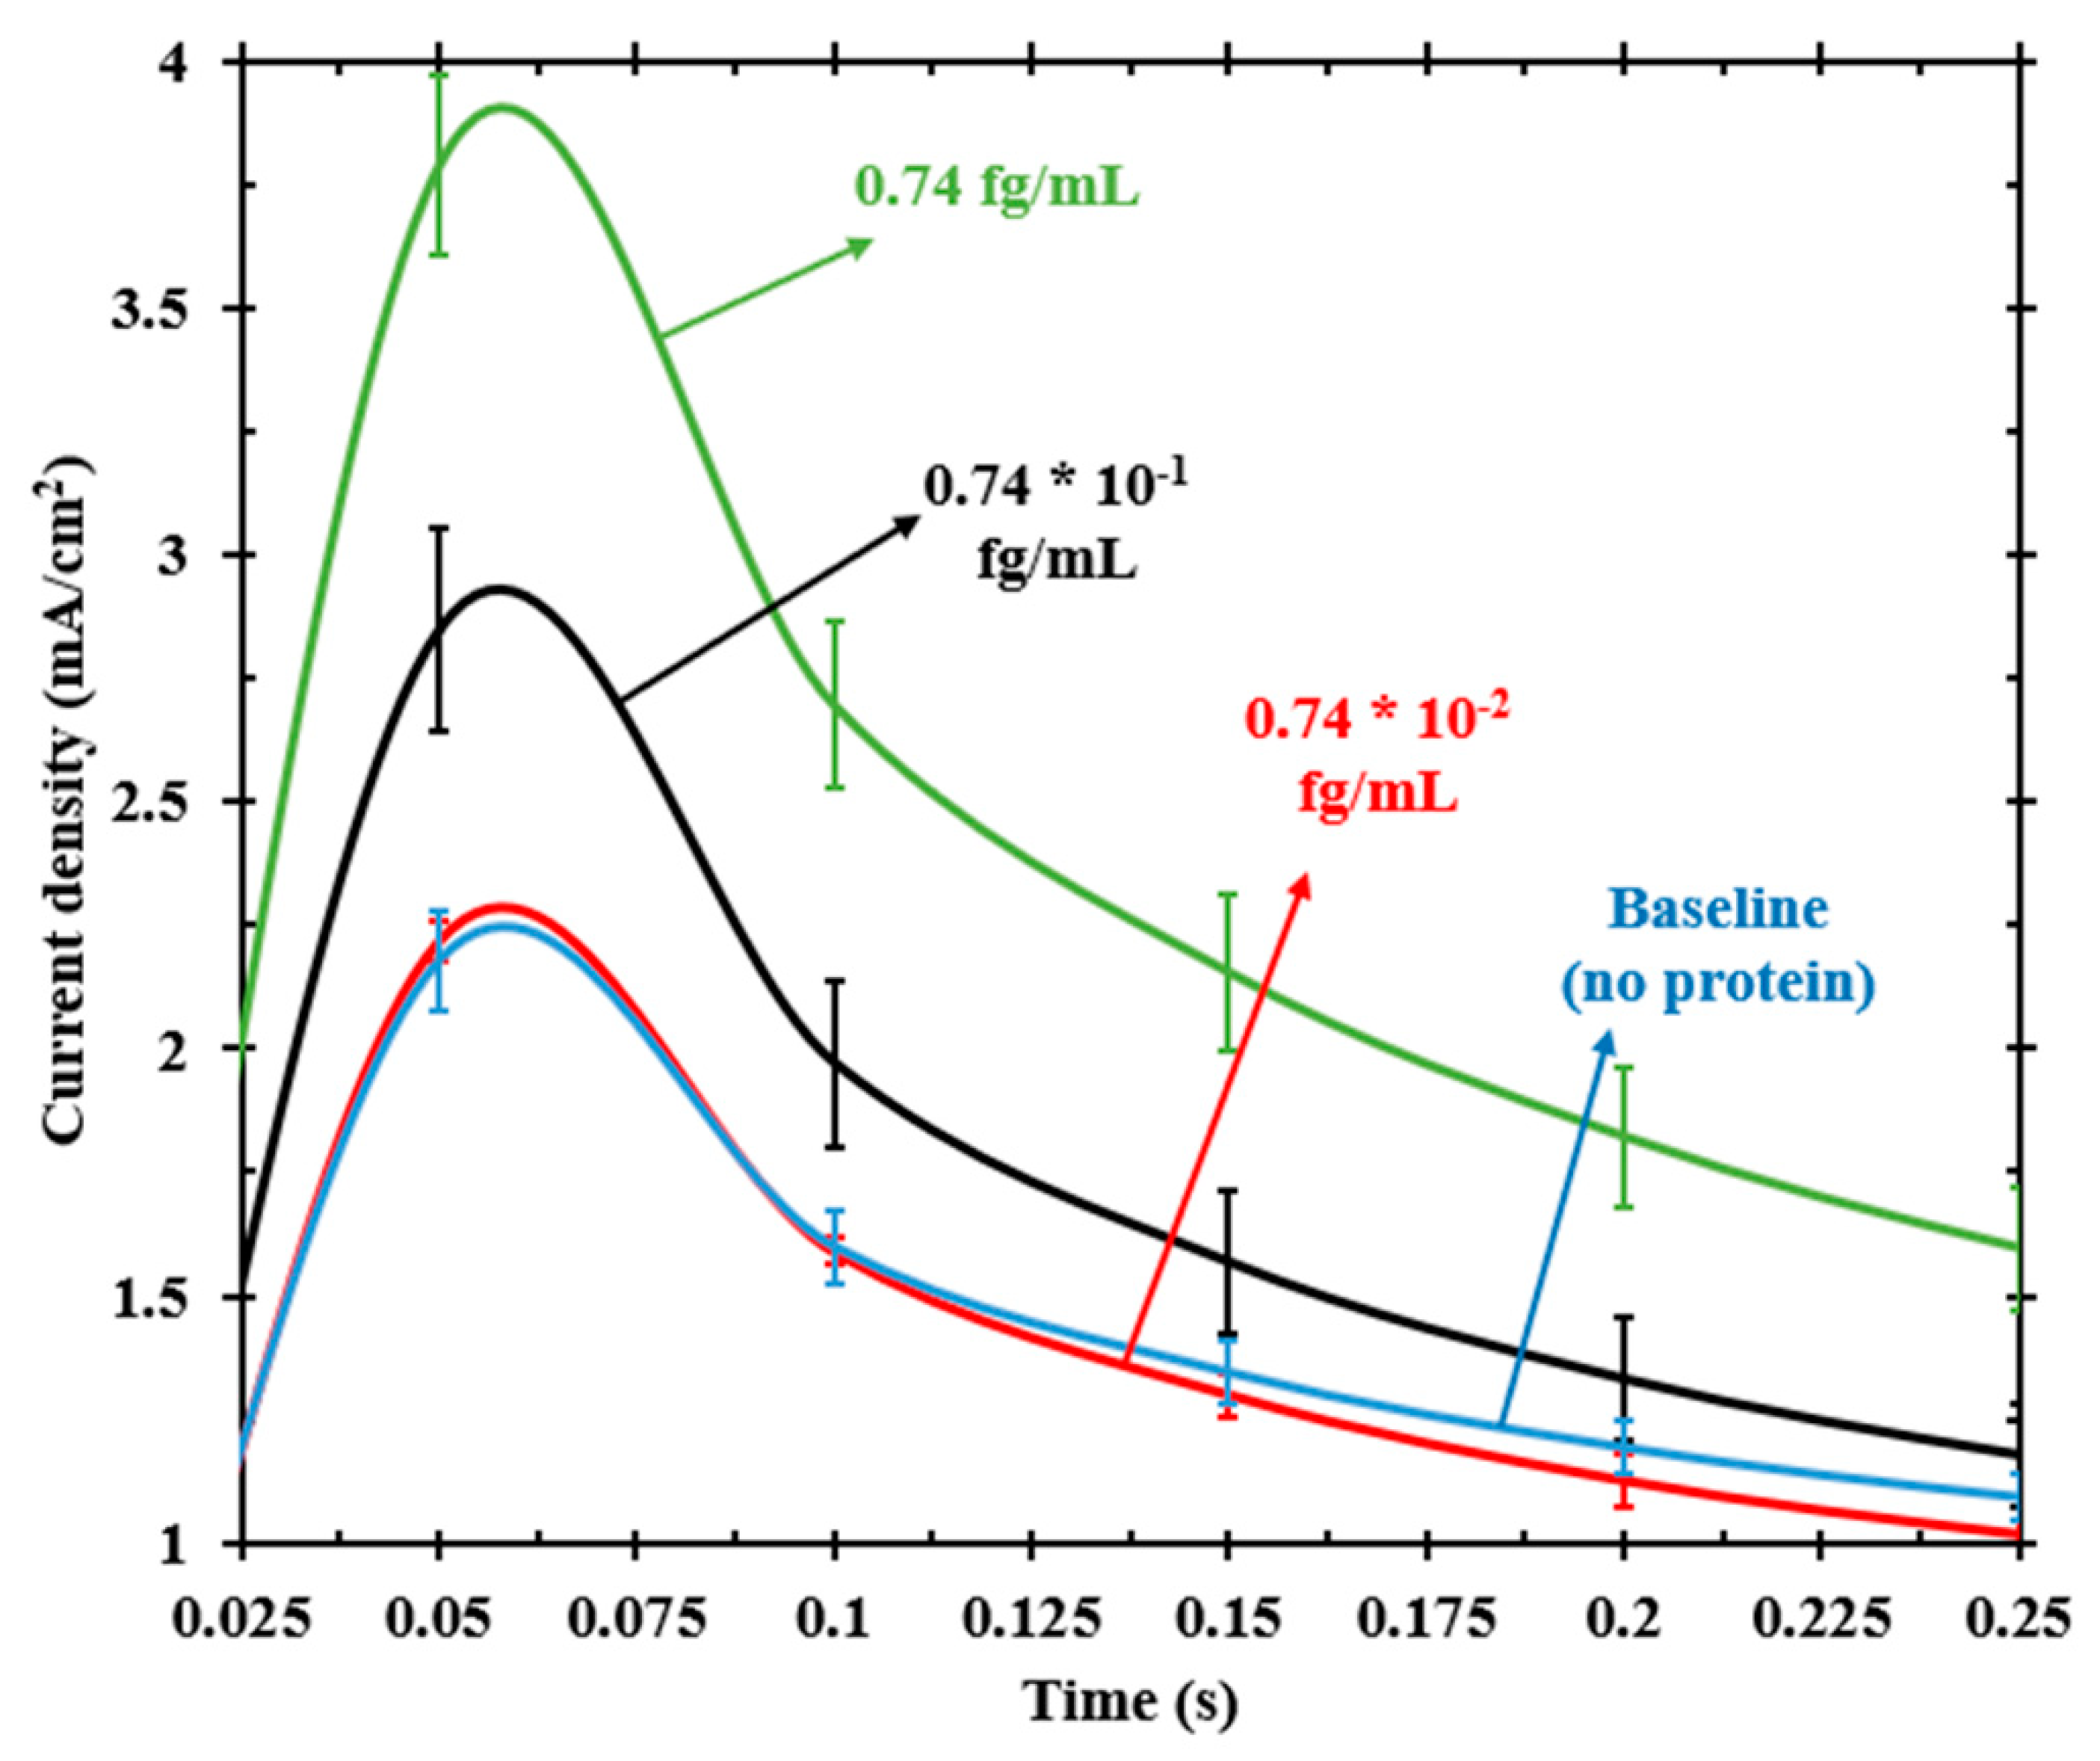
Chronoamperometry experiments performed with miniaturized RDE (Figure 8) in medical-grade saliva under similar experimental conditions as the RDE setup showed that we were not only able to detect a concentration of 0.74 fg/mL but also a sample with a concentration that was one order lower, 0.074 fg/mL. However, a sample diluted one more order lower, 0.0074 fg/mL, showed currents overlapping with the baseline solution, indicating that there was no detection. This finding allowed us to infer that the detection limit of UFC-19 is 0.074 fg/mL, which is at least an order lower than previously reported data and comparable to the detection limit of current gold standard diagnostic tests.
3.6. Mechanism Hypothesis
We hypothesize that the current response is a result of the electrostatic charge at the NiOOH/spike protein interface. NiOOH is deprotonated during the applied oxidation potential, causing a highly negative charge structure [49]. On the other hand, the spike proteins act as the receptor binding domain (RBD) with a high content of protons that is attracted to the negatively charged electrode surface. This interaction is taking place at the electrical double layer (in Å. thickness) and its effect is caught at short response times. This is analogous to the binding mechanism of SARS-CoV-2 S RBD to the angiotensin-converting enzyme 2 (ACE2) found in host cells, where hydrogen bonds have been reported between the S proteins and the ACE2 proteins [50]. These hydrogen bonds between the spike protein and the NiOOH surface are responsible for the initial spike in the current at short times, which is an indication of the changes that take place at the electrical double layer. In other words, this results in an electric current response that is distinct from the electric current response obtained in the absence of the viral protein. This increase in electric current as compared to the blank solution (without any protein) indicates the presence or absence of viral protein in a sample. This detection mechanism hypothesis is being explored in detail using spectro-electrochemical techniques.
4. Conclusions
The need for alternate point-of-care diagnostic devices that are rapid and reliable for SARS-CoV-2 has motivated us to respond with UFC-19. This device has shown potential for ultra-fast and quantitative screening of saliva samples in pandemic frontlines and community-based environments. Early diagnosis of COVID-19 in asymptomatic and symptomatic patients could be the path to curtail the further transmission of this pandemic virus. UFC-19’s knack to distinguish between SARS-CoV-2 and other viruses might be the game-changer in accurately diagnosing patients with co-infection and the recurrence of SARS-CoV-2 infections. Considering this sensor’s good responses in human saliva samples, clinical trials should provide a clearer picture on its deployment in pandemic frontlines and for healthcare in general. Further studies regarding the co-infection of other SARS-CoV-2 proteins could shed light on the potential interference of spike protein in vaccinated population as compared to the infected.
With the advent of electrochemical biosensors for their benefits in being used as point-of-care devices, one can imagine diagnostic devices such as UFC-19 could meet the exponentially increasing testing requirements. Electrochemical biosensors such as UFC-19 are effective as they can adapt to diagnose other pandemic viruses and bacteria by adapting the experimental conditions specific to those organisms. The hydrodynamics of the rotating disk electrode are well established [51]. Models of this system can thus be developed and extended to other pathogens by integrating transport, material balance, charge transfer and other electrokinetic equations and parameters. This ultra-fast platform technology could be expanded for the continuous monitoring of SARS-CoV-2 in air, water, wastewater, etc. In the past, a similar sensor has been used for detecting the bacterium E. coli in water and wastewater [29].
By integrating the electronics to mimic a potentiostat and graphical user interface [52], UFC-19 can easily be controlled remotely. This could presumably be transformational in terms of home-based test kits for COVID-19 diagnosis since there are no ostentatious elements required for using this device. In fact, all the experiments presented in this study were performed remotely by an engineer who controlled the potentiostat software of a researcher conducting experiment in the laboratory. Furthermore, the use of saliva as a sample fosters self-collection and self-use of this device and minimizes the risk of exposure and transmission.
Author Contributions
Conceptualization, A.R. and G.G.B.; methodology, A.R. and S.A.; analysis, A.R., S.A. and G.G.B.; writing—original draft preparation, A.R.; writing—review and editing, S.A and G.G.B. All authors have read and agreed to the published version of the manuscript.
Funding
This research received no external funding.
Institutional Review Board Statement
Not applicable. This study did not involve human subjects because we used commercially-available human saliva.
Informed Consent Statement
Not applicable.
Data Availability Statement
The data presented in this study are contained within the article. Raw data can be made available upon request.
Acknowledgments
The authors would like to acknowledge the Department of Chemical Engineering and Department of Immunology and Molecular Microbiology of the Texas Tech University Health Sciences Center for access their facilities under the emergency basis for accomplishing this work during the lockdown phase. The authors also thank Ozhan Gecgel for his help with the construction of miniaturized RDE setup.
Conflicts of Interest
Authors A.R. and G.G.B. are the inventors of U.S. Patent No. 11,060,995 (2021) arising from this work.
References
- Xu, S.; Li, Y. Beware of the Second Wave of COVID-19. Lancet 2020, 395, 1321–1322. [Google Scholar] [CrossRef]
- Kuehn, B.M. Africa Succeeded Against COVID-19’s First Wave, but the Second Wave Brings New Challenges. JAMA 2021, 325, 327. [Google Scholar] [CrossRef] [PubMed]
- Soriano, V.; de Mendoza, C.; Gómez-Gallego, F.; Corral, O.; Barreiro, P. Third Wave of COVID-19 in Madrid, Spain. Int. J. Infect. Dis. 2021, 107, 212–214. [Google Scholar] [CrossRef]
- Taboada, M.; González, M.; Alvarez, A.; Eiras, M.; Costa, J.; Álvarez, J.; Seoane-Pillado, T. First, Second and Third Wave of COVID-19. What Have We Changed in the ICU Management of These Patients? J. Infect. 2021, 82, e14–e15. [Google Scholar] [CrossRef] [PubMed]
- D’Arienzo, M.; Coniglio, A. Assessment of the SARS-CoV-2 Basic Reproduction Number, R0, Based on the Early Phase of COVID-19 Outbreak in Italy. Biosaf. Health 2020. [Google Scholar] [CrossRef] [PubMed]
- Li, Q.; Guan, X.; Wu, P.; Wang, X.; Zhou, L.; Tong, Y.; Ren, R.; Leung, K.S.M.; Lau, E.H.Y.; Wong, J.Y.; et al. Early Transmission Dynamics in Wuhan, China, of Novel Coronavirus–Infected Pneumonia. N. Engl. J. Med. 2020, 382, 1199–1207. [Google Scholar] [CrossRef]
- Li, R.; Pei, S.; Chen, B.; Song, Y.; Zhang, T.; Yang, W.; Shaman, J. Substantial Undocumented Infection Facilitates the Rapid Dissemination of Novel Coronavirus (SARS-CoV-2). Science 2020, 368, 489–493. [Google Scholar] [CrossRef] [Green Version]
- Cohen, J.I.; Burbelo, P.D. Reinfection with SARS-CoV-2: Implications for Vaccines. Clin. Infect. Dis. 2020. [Google Scholar] [CrossRef] [PubMed]
- Bauza, V.; Sclar, G.D.; Bisoyi, A.; Owens, A.; Ghugey, A.; Clasen, T. Experience of the COVID-19 Pandemic in Rural Odisha, India: Knowledge, Preventative Actions, and Impacts on Daily Life. Int. J. Environ. Res. Public Health 2021, 18, 2863. [Google Scholar] [CrossRef] [PubMed]
- Wang, D.; Hu, B.; Hu, C.; Zhu, F.; Liu, X.; Zhang, J.; Wang, B.; Xiang, H.; Cheng, Z.; Xiong, Y.; et al. Clinical Characteristics of 138 Hospitalized Patients With 2019 Novel Coronavirus–Infected Pneumonia in Wuhan, China. JAMA 2020, 323, 1061. [Google Scholar] [CrossRef]
- Tang, Y.-W.; Schmitz, J.E.; Persing, D.H.; Stratton, C.W. Laboratory Diagnosis of COVID-19: Current Issues and Challenges. J. Clin. Microbiol. 2020, 58, e00512-20. [Google Scholar] [CrossRef] [Green Version]
- Dheda, K.; Davids, M.; Chang, J.-W.; Gina, P.; Pooran, A.; Makambwa, E.; Esmail, A.; Vardas, E.; Preiser, W. London School of Hygiene and Tropical Medicine Diagnosis of COVID-19: Considerations, Controversies and Challenges in South Africa. Wits J. Clin. Med. 2020, 2, 3–10. [Google Scholar] [CrossRef] [Green Version]
- Yang, S.; Rothman, R.E. PCR-Based Diagnostics for Infectious Diseases: Uses, Limitations, and Future Applications in Acute-Care Settings. Lancet Infect. Dis. 2004, 4, 337–348. [Google Scholar] [CrossRef]
- Gutierres, S.L.; Welty, T.E. Point-of-Care Testing: An Introduction. Ann. Pharmacother. 2004, 38, 119–125. [Google Scholar] [CrossRef] [PubMed]
- Xie, X.; Zhong, Z.; Zhao, W.; Zheng, C.; Wang, F.; Liu, J. Chest CT for Typical Coronavirus Disease 2019 (COVID-19) Pneumonia: Relationship to Negative RT-PCR Testing. Radiology 2020, 296, E41–E45. [Google Scholar] [CrossRef] [Green Version]
- Shabani, E.; Dowlatshahi, S.; Abdekhodaie, M.J. Laboratory Detection Methods for the Human Coronaviruses. Eur. J. Clin. Microbiol. Infect. Dis. 2021, 40, 225–246. [Google Scholar] [CrossRef]
- Wang, W.; Xu, Y.; Gao, R.; Lu, R.; Han, K.; Wu, G.; Tan, W. Detection of SARS-CoV-2 in Different Types of Clinical Specimens. JAMA 2020. [Google Scholar] [CrossRef] [PubMed] [Green Version]
- Zou, L.; Ruan, F.; Huang, M.; Liang, L.; Huang, H.; Hong, Z.; Yu, J.; Kang, M.; Song, Y.; Xia, J.; et al. SARS-CoV-2 Viral Load in Upper Respiratory Specimens of Infected Patients. N. Engl. J. Med. 2020, 382, 1177–1179. [Google Scholar] [CrossRef] [PubMed]
- Kim, C.; Ahmed, J.A.; Eidex, R.B.; Nyoka, R.; Waiboci, L.W.; Erdman, D.; Tepo, A.; Mahamud, A.S.; Kabura, W.; Nguhi, M.; et al. Comparison of Nasopharyngeal and Oropharyngeal Swabs for the Diagnosis of Eight Respiratory Viruses by Real-Time Reverse Transcription-PCR Assays. PLoS ONE 2011, 6, e21610. [Google Scholar] [CrossRef] [Green Version]
- Blaschke, A.J.; Allison, M.A.; Meyers, L.; Rogatcheva, M.; Heyrend, C.; Mallin, B.; Carter, M.; LaFleur, B.; Barney, T.; Poritz, M.A.; et al. Non-Invasive Sample Collection for Respiratory Virus Testing by Multiplex PCR. J. Clin. Virol. 2011, 52, 210–214. [Google Scholar] [CrossRef] [PubMed] [Green Version]
- Bilder, L.; Machtei, E.E.; Shenhar, Y.; Kra-Oz, Z.; Basis, F. Salivary Detection of H1N1 Virus: A Clinical Feasibility Investigation. J. Dent. Res. 2011, 90, 1136–1139. [Google Scholar] [CrossRef] [PubMed]
- Keaney, D.; Whelan, S.; Finn, K.; Lucey, B. Misdiagnosis of SARS-CoV-2: A Critical Review of the Influence of Sampling and Clinical Detection Methods. Med. Sci. 2021, 9, 36. [Google Scholar] [CrossRef]
- Pasomsub, E.; Watcharananan, S.P.; Boonyawat, K.; Janchompoo, P.; Wongtabtim, G.; Suksuwan, W.; Sungkanuparph, S.; Phuphuakrat, A. Saliva Sample as a Non-Invasive Specimen for the Diagnosis of Coronavirus Disease 2019: A Cross-Sectional Study. Clin. Microbiol. Infect. 2020. [Google Scholar] [CrossRef] [PubMed]
- Sindhu, S.; Jagannathan, N. Saliva: A Cutting Edge in Diagnostic Procedures. J. Oral Dis. 2014, 2014, 168584. [Google Scholar] [CrossRef] [Green Version]
- Azzi, L.; Carcano, G.; Gianfagna, F.; Grossi, P.; Gasperina, D.D.; Genoni, A.; Fasano, M.; Sessa, F.; Tettamanti, L.; Carinci, F.; et al. Saliva Is a Reliable Tool to Detect SARS-CoV-2. J. Infect. 2020, 81, e45–e50. [Google Scholar] [CrossRef] [PubMed]
- To, K.K.-W.; Tsang, O.T.-Y.; Yip, C.C.-Y.; Chan, K.-H.; Wu, T.-C.; Chan, J.M.-C.; Leung, W.-S.; Chik, T.S.-H.; Choi, C.Y.-C.; Kandamby, D.H.; et al. Consistent Detection of 2019 Novel Coronavirus in Saliva. Clin. Infect. Dis. 2020. [Google Scholar] [CrossRef] [Green Version]
- Williams, E.; Bond, K.; Zhang, B.; Putland, M.; Williamson, D.A. Saliva as a Non-Invasive Specimen for Detection of SARS-CoV-2. J. Clin. Microbiol. 2020. [Google Scholar] [CrossRef] [Green Version]
- Botte, G.G.; Ramanujam, A. Rapid Viral Diagnostic Sensor. U.S. Patent No. 11,060,995, 13 July 2021. [Google Scholar]
- Ramanujam, A.; Neyhouse, B.; Keogh, R.A.; Muthuvel, M.; Carroll, R.K.; Botte, G.G. Rapid Electrochemical Detection of Escherichia Coli Using Nickel Oxidation Reaction on a Rotating Disk Electrode. Chem. Eng. J. 2021, 411, 128453. [Google Scholar] [CrossRef]
- Vedharathinam, V.; Botte, G.G. Understanding the Electro-Catalytic Oxidation Mechanism of Urea on Nickel Electrodes in Alkaline Medium. Electrochim. Acta 2012, 81, 292–300. [Google Scholar] [CrossRef]
- Seo, G.; Lee, G.; Kim, M.J.; Baek, S.-H.; Choi, M.; Ku, K.B.; Lee, C.-S.; Jun, S.; Park, D.; Kim, H.G.; et al. Rapid Detection of COVID-19 Causative Virus (SARS-CoV-2) in Human Nasopharyngeal Swab Specimens Using Field-Effect Transistor-Based Biosensor. ACS Nano 2020, 14, 5135–5142. [Google Scholar] [CrossRef] [Green Version]
- Chaibun, T.; Puenpa, J.; Ngamdee, T.; Boonapatcharoen, N.; Athamanolap, P.; O’Mullane, A.P.; Vongpunsawad, S.; Poovorawan, Y.; Lee, S.Y.; Lertanantawong, B. Rapid Electrochemical Detection of Coronavirus SARS-CoV-2. Nat. Commun. 2021, 12, 802. [Google Scholar] [CrossRef]
- Thévenot, D.R.; Toth, K.; Durst, R.A.; Wilson, G.S. Electrochemical Biosensors: Recommended Definitions and Classification *. Anal. Lett. 2001, 34, 635–659. [Google Scholar] [CrossRef] [Green Version]
- Kliger, Y.; Levanon, E.Y. Cloaked Similarity between HIV-1 and SARS-CoV Suggests an Anti-SARS Strategy. BMC Microbiol. 2003, 3, 20. [Google Scholar] [CrossRef] [Green Version]
- Khodamoradi, Z.; Moghadami, M.; Lotfi, M. Co-Infection of Coronavirus Disease 2019 and Influenza A: A Report from Iran. Arch. Iran Med. 2020, 23, 239–243. [Google Scholar] [CrossRef] [PubMed] [Green Version]
- Kim, D.; Quinn, J.; Pinsky, B.; Shah, N.H.; Brown, I. Rates of Co-Infection Between SARS-CoV-2 and Other Respiratory Pathogens. JAMA 2020, 323, 2085. [Google Scholar] [CrossRef] [PubMed] [Green Version]
- Konala, V.M.; Adapa, S.; Gayam, V.; Naramala, S.; Daggubati, S.R.; Kammari, C.B.; Chenna, A. Co-Infection with Influenza A and COVID-19. Eur. J. Case Rep. Intern. Med. 2020, 7, 1. [Google Scholar] [CrossRef]
- Altuntas Aydin, O.; Kumbasar Karaosmanoglu, H.; Kart Yasar, K. HIV/SARS-CoV-2 Coinfected Patients in Istanbul, Turkey. J. Med. Virol. 2020. [Google Scholar] [CrossRef] [PubMed]
- Zhu, F.; Cao, Y.; Xu, S.; Zhou, M. Co-infection of SARS-CoV-2 and HIV in a Patient in Wuhan City, China. J. Med. Virol. 2020, 92, 529–530. [Google Scholar] [CrossRef] [PubMed] [Green Version]
- Parker, A.; Shaw, J.; Karamchand, S.; Lahri, S.; Schrueder, N.; Chothia, M.-Y.; Mowlana, A.; Lalla, U.; Allwood, B.W.; Koegelenberg, C.F.N.; et al. HIV and SARS-CoV-2 Co-Infection: The Diagnostic Challenges of Dual Pandemics. S. Afr. Med. J. 2020, 110, 473–475. [Google Scholar] [CrossRef]
- Wang, W.-K.; Chen, S.-Y.; Liu, I.-J.; Chen, Y.-C.; Chen, H.-L.; Yang, C.-F.; Chen, P.-J.; Yeh, S.-H.; Kao, C.-L.; Huang, L.-M.; et al. Detection of SARS-Associated Coronavirus in Throat Wash and Saliva in Early Diagnosis. Emerg. Infect. Dis. 2004, 10, 1213–1219. [Google Scholar] [CrossRef]
- Liu, L.; Wei, Q.; Alvarez, X.; Wang, H.; Du, Y.; Zhu, H.; Jiang, H.; Zhou, J.; Lam, P.; Zhang, L.; et al. Epithelial Cells Lining Salivary Gland Ducts Are Early Target Cells of Severe Acute Respiratory Syndrome Coronavirus Infection in the Upper Respiratory Tracts of Rhesus Macaques. J. Virol. 2011, 85, 4025–4030. [Google Scholar] [CrossRef] [Green Version]
- Xu, J.; Li, Y.; Gan, F.; Du, Y.; Yao, Y. Salivary Glands: Potential Reservoirs for COVID-19 Asymptomatic Infection. J. Dent. Res. 2020, 99, 989. [Google Scholar] [CrossRef] [Green Version]
- Sabino-Silva, R.; Jardim, A.C.G.; Siqueira, W.L. Coronavirus COVID-19 Impacts to Dentistry and Potential Salivary Diagnosis. Clin. Oral Investig. 2020, 24, 1619–1621. [Google Scholar] [CrossRef] [PubMed] [Green Version]
- Bui, V.N.; Nguyen, K.V.; Pham, N.T.; Bui, A.N.; Dao, T.D.; Nguyen, T.T.; Nguyen, H.T.; Trinh, D.Q.; Inui, K.; Uchiumi, H.; et al. Potential of Electrolyzed Water for Disinfection of Foot-and-Mouth Disease Virus. J. Vet. Med. Sci. 2017, 79, 726–729. [Google Scholar] [CrossRef] [Green Version]
- Humphrey, S.P.; Williamson, R.T. A Review of Saliva: Normal Composition, Flow, and Function. J. Prosthet. Dent. 2001, 85, 162–169. [Google Scholar] [CrossRef] [PubMed]
- Jung, Y.; Park, G.-S.; Moon, J.H.; Ku, K.; Beak, S.-H.; Lee, C.-S.; Kim, S.; Park, E.C.; Park, D.; Lee, J.-H.; et al. Comparative Analysis of Primer–Probe Sets for RT-QPCR of COVID-19 Causative Virus (SARS-CoV-2). ACS Infect. Dis. 2020, 6, 2513–2523. [Google Scholar] [CrossRef]
- Arnaout, R.; Lee, R.A.; Lee, G.R.; Callahan, C.; Yen, C.F.; Smith, K.P.; Arora, R.; Kirby, J.E. SARS-CoV2 Testing: The Limit of Detection Matters. Microbiology 2020. [Google Scholar] [CrossRef]
- Diaz-Morales, O.; Ferrus-Suspedra, D.; Koper, M.T.M. The Importance of Nickel Oxyhydroxide Deprotonation on Its Activity towards Electrochemical Water Oxidation. Chem. Sci. 2016, 7, 2639–2645. [Google Scholar] [CrossRef] [PubMed] [Green Version]
- Xie, Y.; Karki, C.B.; Du, D.; Li, H.; Wang, J.; Sobitan, A.; Teng, S.; Tang, Q.; Li, L. Spike Proteins of SARS-CoV and SARS-CoV-2 Utilize Different Mechanisms to Bind With Human ACE2. Front. Mol. Biosci. 2020, 7, 591873. [Google Scholar] [CrossRef] [PubMed]
- Diaz, L.A.; Botte, G.G. Mathematical Modeling of Ammonia Electrooxidation Kinetics in a Polycrystalline Pt Rotating Disk Electrode. Electrochim. Acta 2015, 179, 519–528. [Google Scholar] [CrossRef] [Green Version]
- Lopin, P.; Lopin, K.V. PSoC-Stat: A Single Chip Open Source Potentiostat Based on a Programmable System on a Chip. PLoS ONE 2018, 13, e0201353. [Google Scholar] [CrossRef] [PubMed] [Green Version]
Figure 1.
Schematic showing the bottom view of the electrode configuration used as the sensor probe in (a) RDE setup and (b) miniature RDE setup. The materials and distance of separation between the electrodes are shown for a better understanding of the position of electrodes.
Figure 1.
Schematic showing the bottom view of the electrode configuration used as the sensor probe in (a) RDE setup and (b) miniature RDE setup. The materials and distance of separation between the electrodes are shown for a better understanding of the position of electrodes.

Figure 2.
Schematic of the experimental setup containing 3 electrodes that are connected to a potentiostat and immersed in a solution containing SARS-CoV-2. A zoomed in visualization of the electrode/electrolyte interface where the SARS-CoV-2 interacts with electrocatalyst to produce an electric current response is shown on the right.

Figure 3.
(a) Chronoamperometry plot showing the electric current response of different concentrations of SARS-CoV-2 protein as a function of time. The current densities were obtained by applying a fixed potential of 580 mV for 5 s (Inset) of which the first 250 ms are highlighted. (b) The calibration plot obtained by plotting the current density value at 50 ms for different protein concentrations tested (blue points). The orange square corresponds to the concentration of sample solution predicted using the calibration equation .

Figure 4.
(a) Plot showing the electric current responses obtained from HIV NEF protein (red) only, SARS-CoV-2 or COVID-19 S1 protein only (black) and a solution mixed with both these proteins (yellow) as compared to the baseline (no protein). Note that the current obtained from mixed solution had a positive response, meaning the detected current was specific to the SARS-CoV-2 regime. (b) Plot showing the electric currents from HIV virions and HIV infected cells being lower than the baseline. This is significant for distinguishing between HIV and SARS-CoV-2 (current responses are higher than baseline) when there is co-infection.

Figure 5.
Electric current responses recorded as a function of time from artificial saliva without any proteins (blue), with 10 µg S1 protein (black), with 10 µg S1 protein (red) and solution mixed with 10 µg S1 protein and 10 µg NEF protein (yellow). The plot emphasizes that the use of artificial saliva has not affected the measurement of SARS-CoV-2 protein and that there are no interferences in the measurement due to presence of proteins from another virus.

Figure 6.
Plot of current density as a function of time showing that the human saliva sample without SARS-CoV-2 S1 protein overlapped with the baseline KOH solution indicating that there was no interference from a SARS-CoV-2 negative sample. The SARS-CoV-2 negative sample spiked with SARS-CoV-2 S1 protein showed an electric current higher than the baseline or negative sample, proving the detection of the S1 protein in human saliva sample.

Figure 7.
A 3-D illustration of the miniaturized sensor probe containing the three electrodes placed inside a 5 mL sample chamber.
Figure 7.
A 3-D illustration of the miniaturized sensor probe containing the three electrodes placed inside a 5 mL sample chamber.

Figure 8.
Chronoamperometry plot showing the successful detection of a samples containing 0.74 fg/mL and 0.074 fg/mL (detection limit) SARS-CoV-2 spike protein, while the currents from a 0.0074 fg/mL sample overlap with the baseline and indicates no detection.
Figure 8.
Chronoamperometry plot showing the successful detection of a samples containing 0.74 fg/mL and 0.074 fg/mL (detection limit) SARS-CoV-2 spike protein, while the currents from a 0.0074 fg/mL sample overlap with the baseline and indicates no detection.

Publisher’s Note: MDPI stays neutral with regard to jurisdictional claims in published maps and institutional affiliations. |
© 2021 by the authors. Licensee MDPI, Basel, Switzerland. This article is an open access article distributed under the terms and conditions of the Creative Commons Attribution (CC BY) license (https://creativecommons.org/licenses/by/4.0/).
Share and Cite
MDPI and ACS Style
Ramanujam, A.; Almodovar, S.; Botte, G.G. Ultra-Fast Electrochemical Sensor for Point-of-Care COVID-19 Diagnosis Using Non-Invasive Saliva Sampling. Processes 2021, 9, 1236. https://0-doi-org.brum.beds.ac.uk/10.3390/pr9071236
AMA Style
Ramanujam A, Almodovar S, Botte GG. Ultra-Fast Electrochemical Sensor for Point-of-Care COVID-19 Diagnosis Using Non-Invasive Saliva Sampling. Processes. 2021; 9(7):1236. https://0-doi-org.brum.beds.ac.uk/10.3390/pr9071236
Chicago/Turabian StyleRamanujam, Ashwin, Sharilyn Almodovar, and Gerardine G. Botte. 2021. "Ultra-Fast Electrochemical Sensor for Point-of-Care COVID-19 Diagnosis Using Non-Invasive Saliva Sampling" Processes 9, no. 7: 1236. https://0-doi-org.brum.beds.ac.uk/10.3390/pr9071236
Note that from the first issue of 2016, this journal uses article numbers instead of page numbers. See further details here.