
Hydrochloric Acid Modification and Lead Removal Studies on Naturally Occurring Zeolites from Nevada, New Mexico, and Arizona


Abstract
:
1. Introduction
- APD—AlPO4-D, a tetrahedrally coordinated aluminophosphate zeolite framework
- ATR—FTIR-Attenuated Total Reflectance-Fourier Transformed Infrared spectroscopy
- BET—Brunauer Emmett Teller
- CHA—chabazite
- CLI—clinoptilolite
- EDS/XRF—energy dispersive X-ray spectroscopy/X-ray fluorescence
- ERI—erionite
- HCl—hydrochloric acid
- MAS—magic angle spinning
- NMR—nuclear magnetic resonance
- SEM—scanning electron microscope
2. Materials and Methods
2.1. Materials
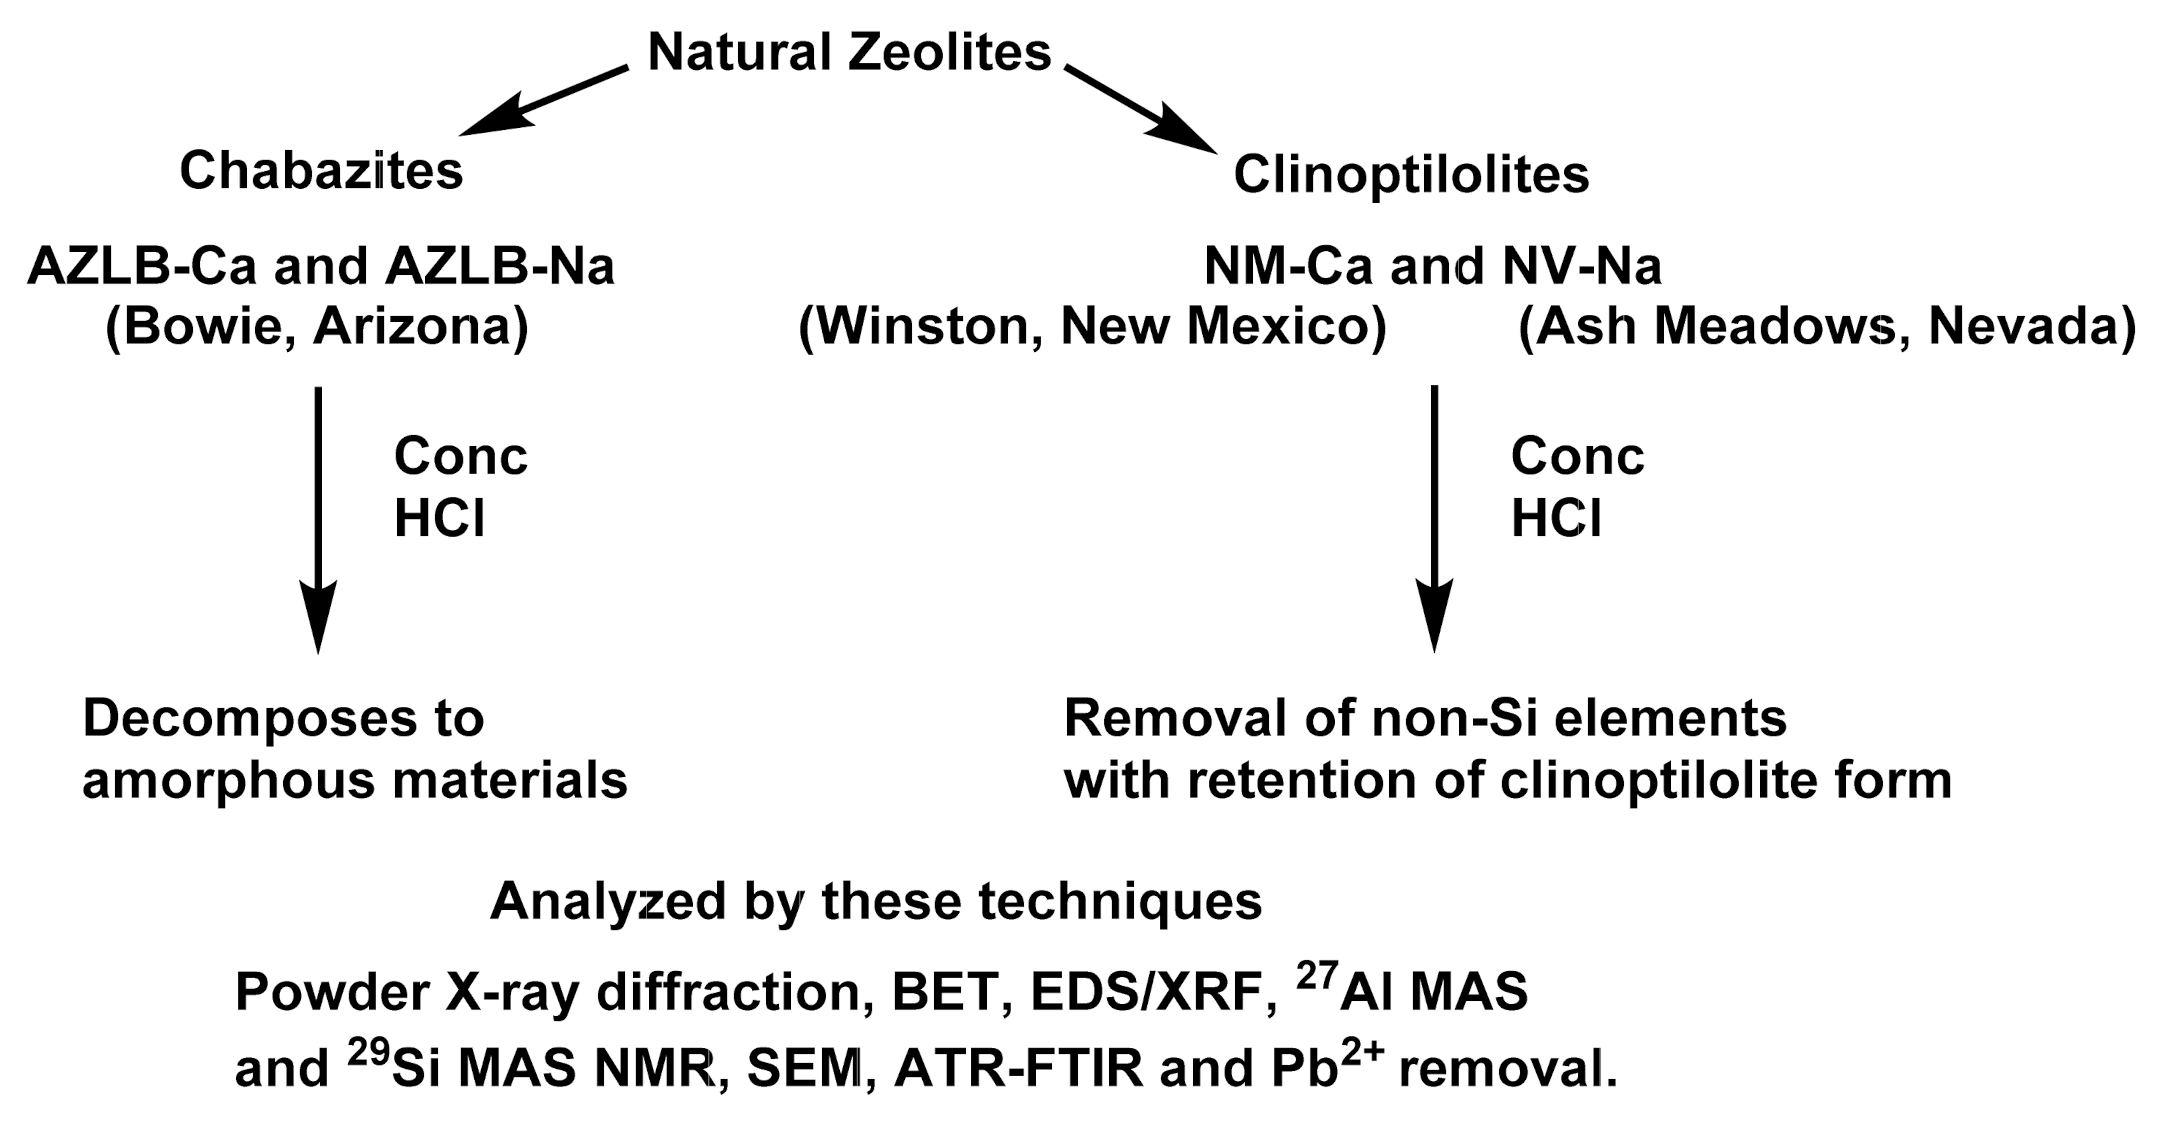
2.1.1. Zeolite Modifications
Calcined Zeolites
Hydrochloric Acid Treated Zeolites
2.2. Methods
2.2.1. X-ray Diffraction
2.2.2. Surface Area Analysis
2.2.3. Energy Dispersive Spectroscopy
2.2.4. NMR Study of Zeolite
2.2.5. Scanning Electron Microscopy
2.2.6. ATR-FTIR
2.2.7. Lead Removal Studies
2.2.8. Flow Chart of Techniques
3. Results and Discussion
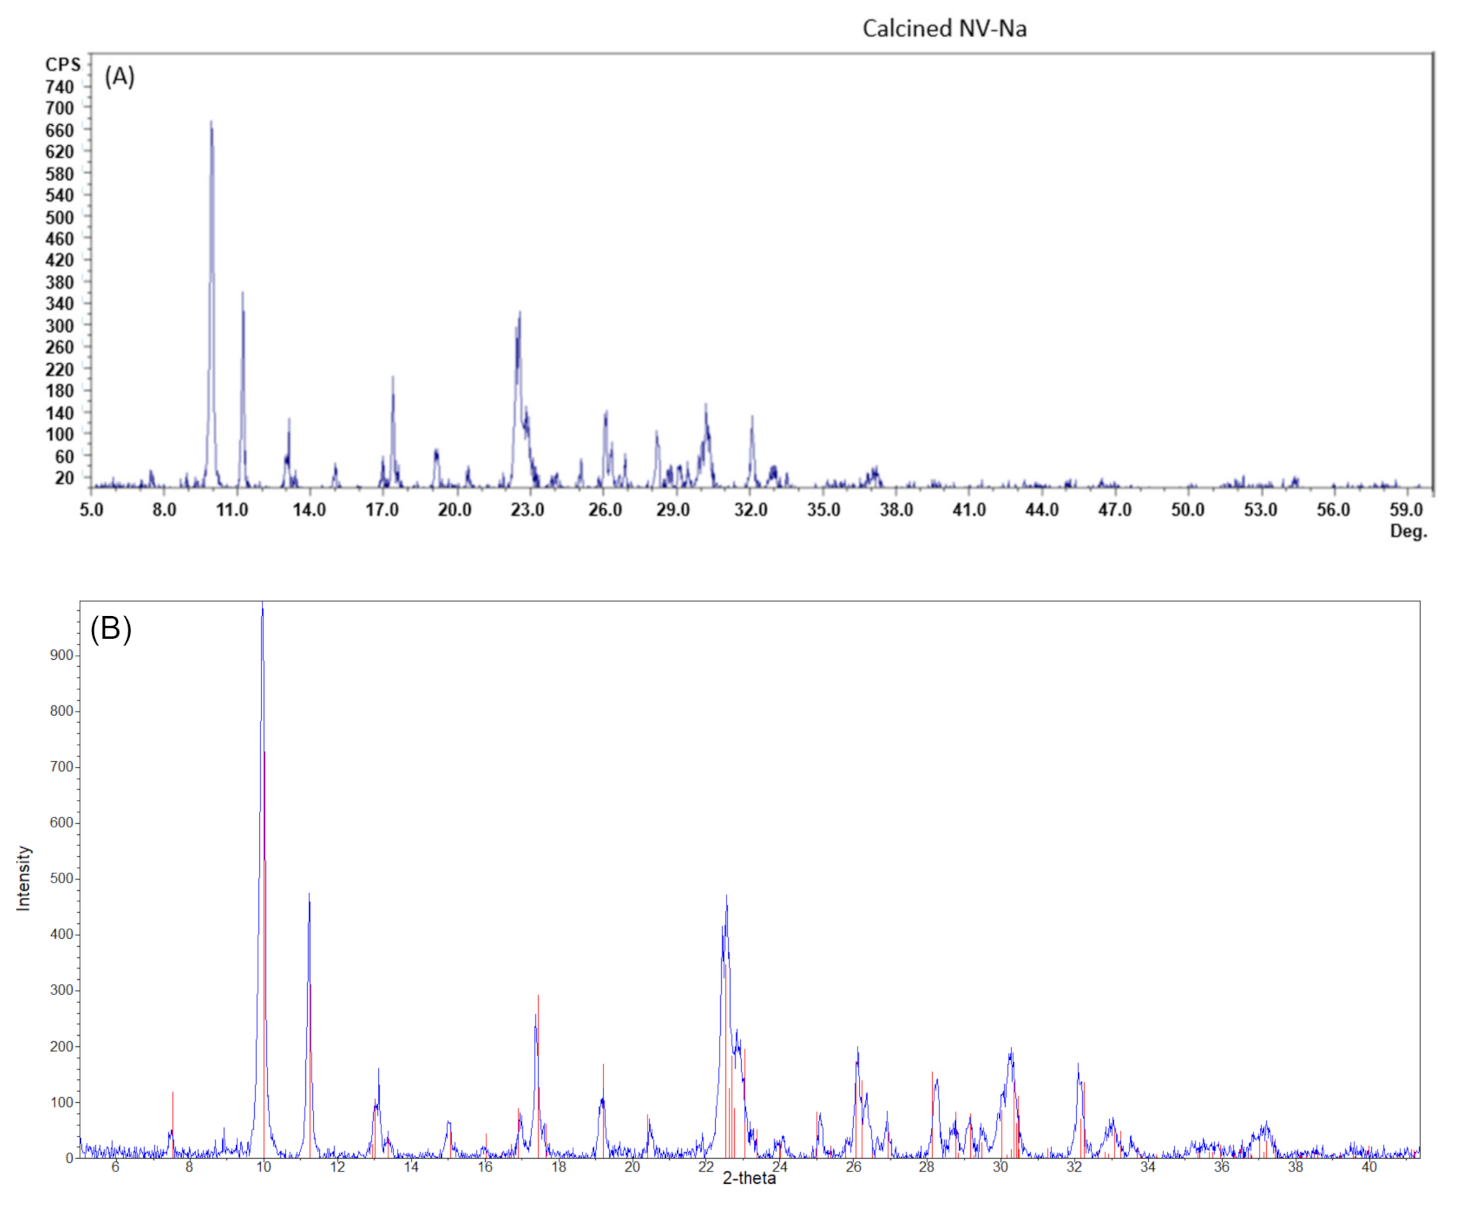
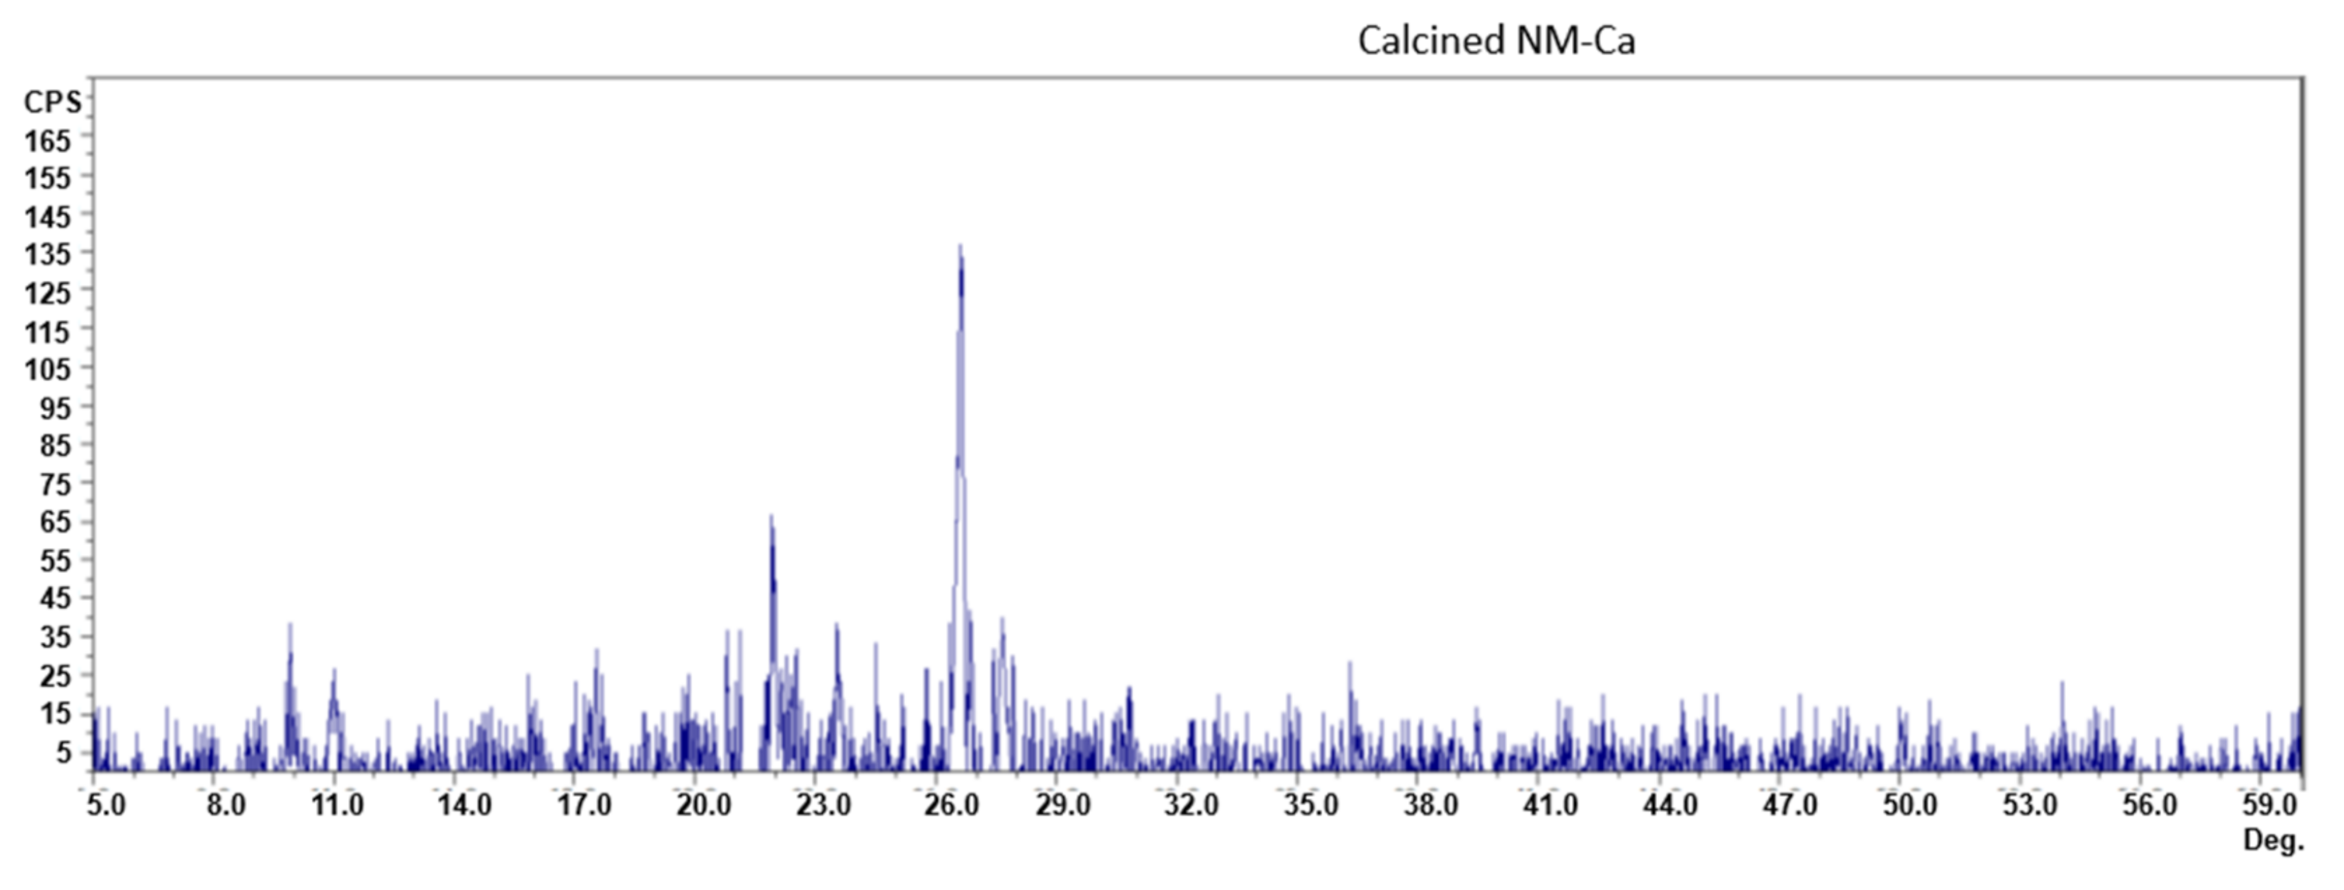
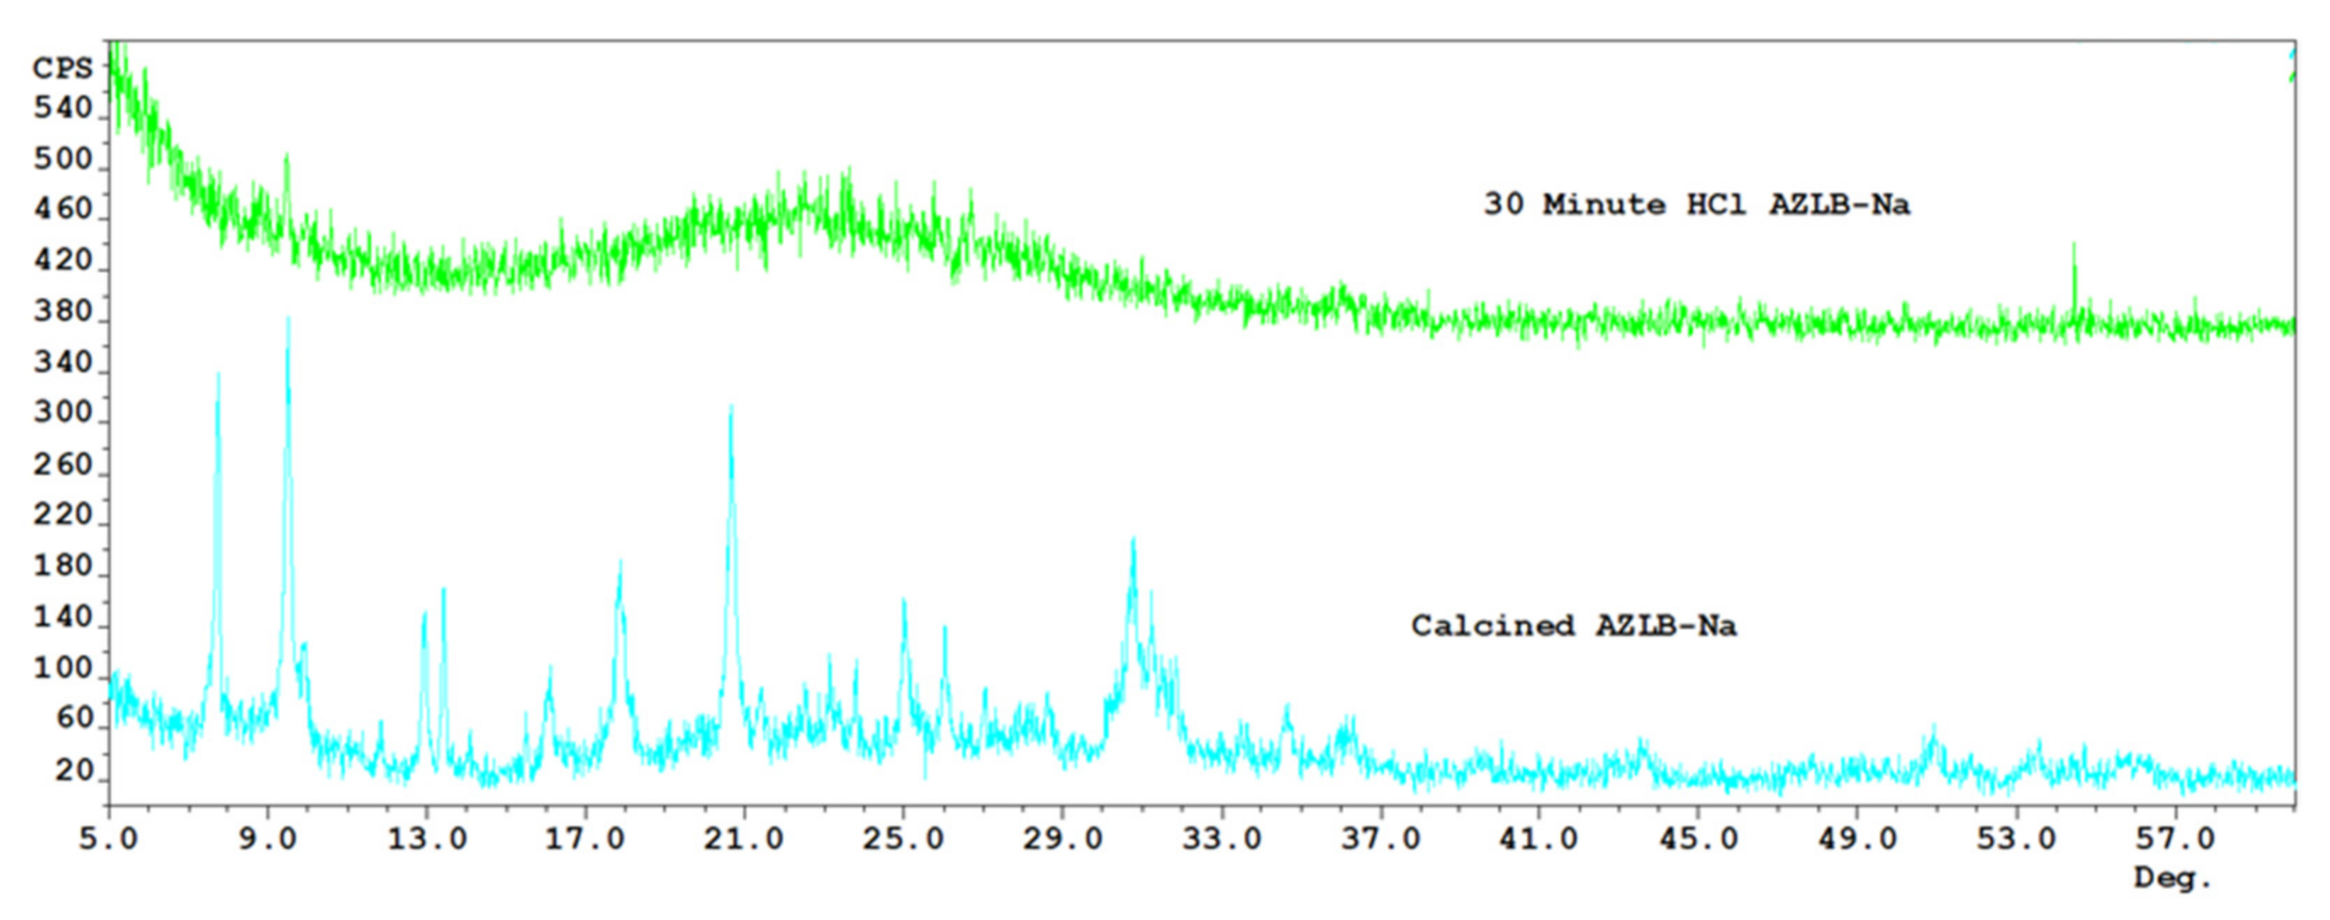
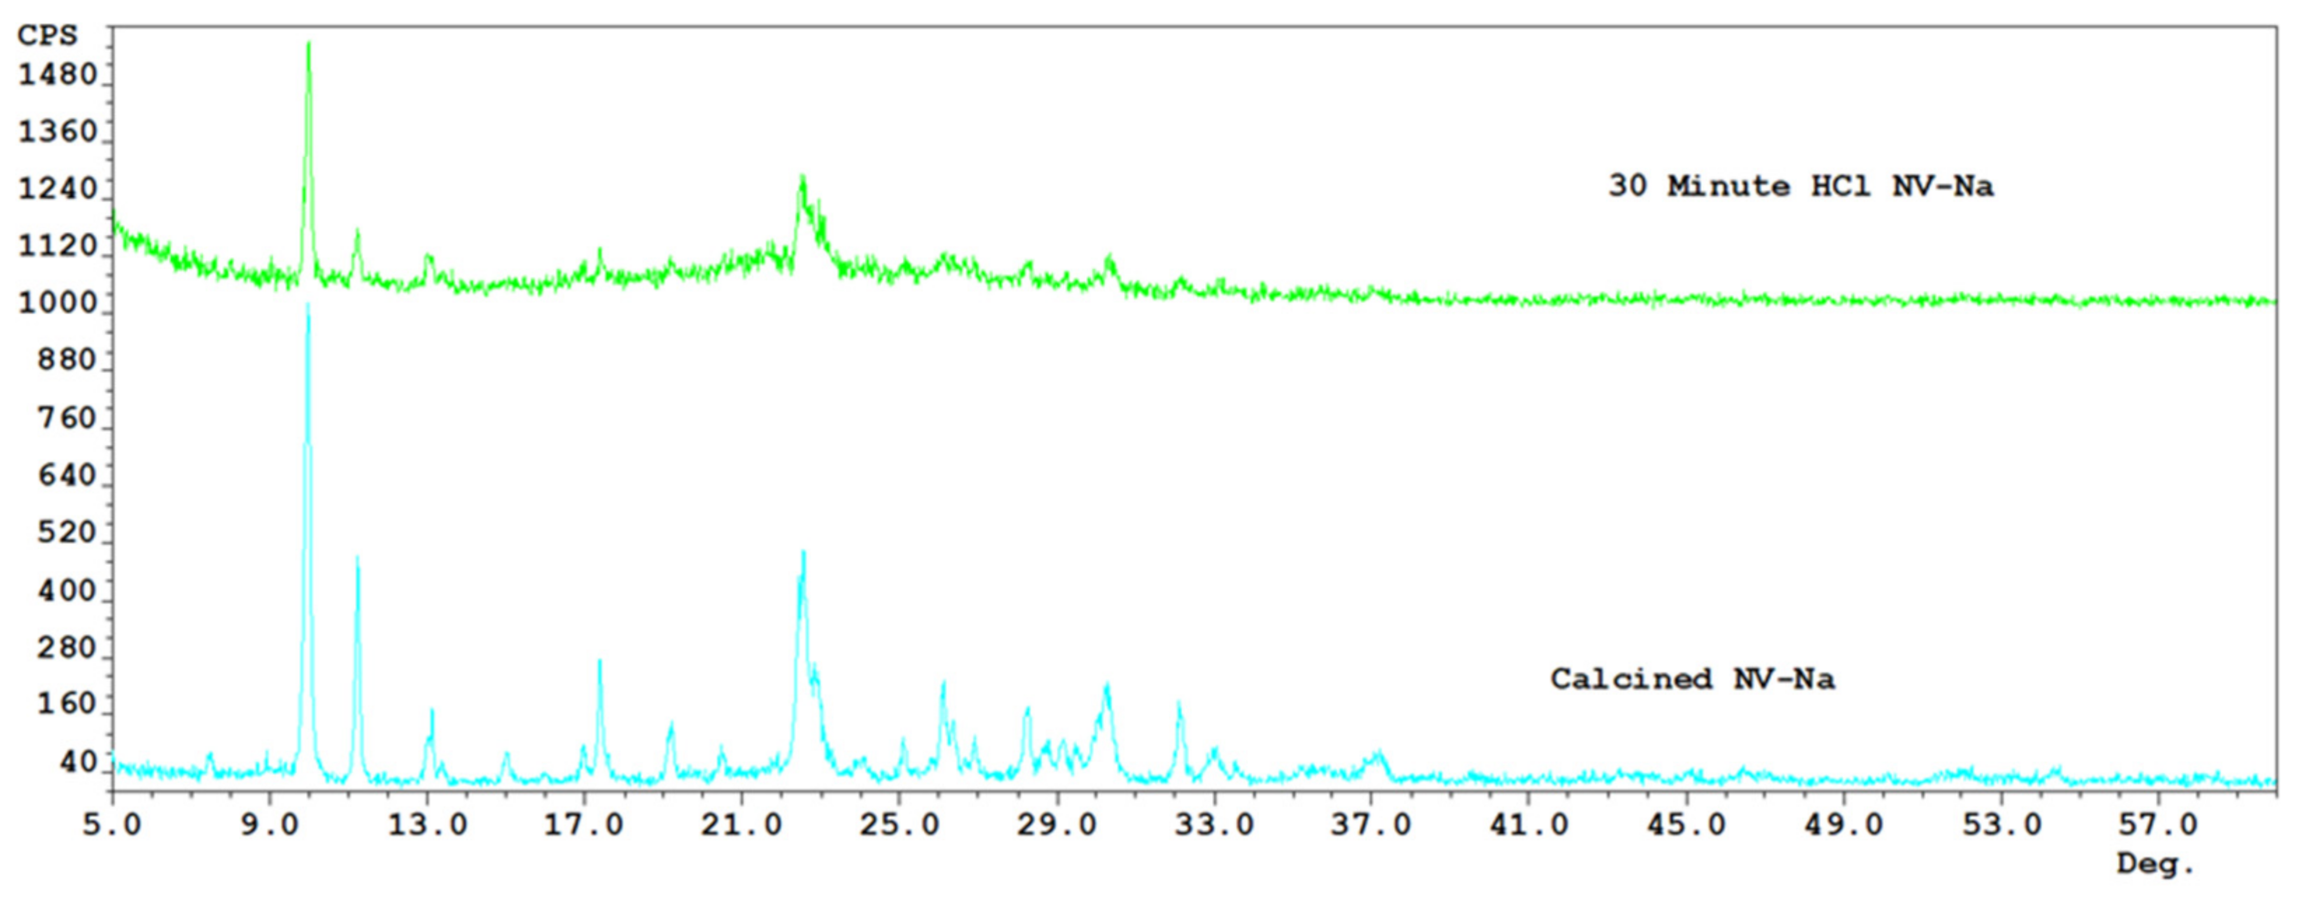
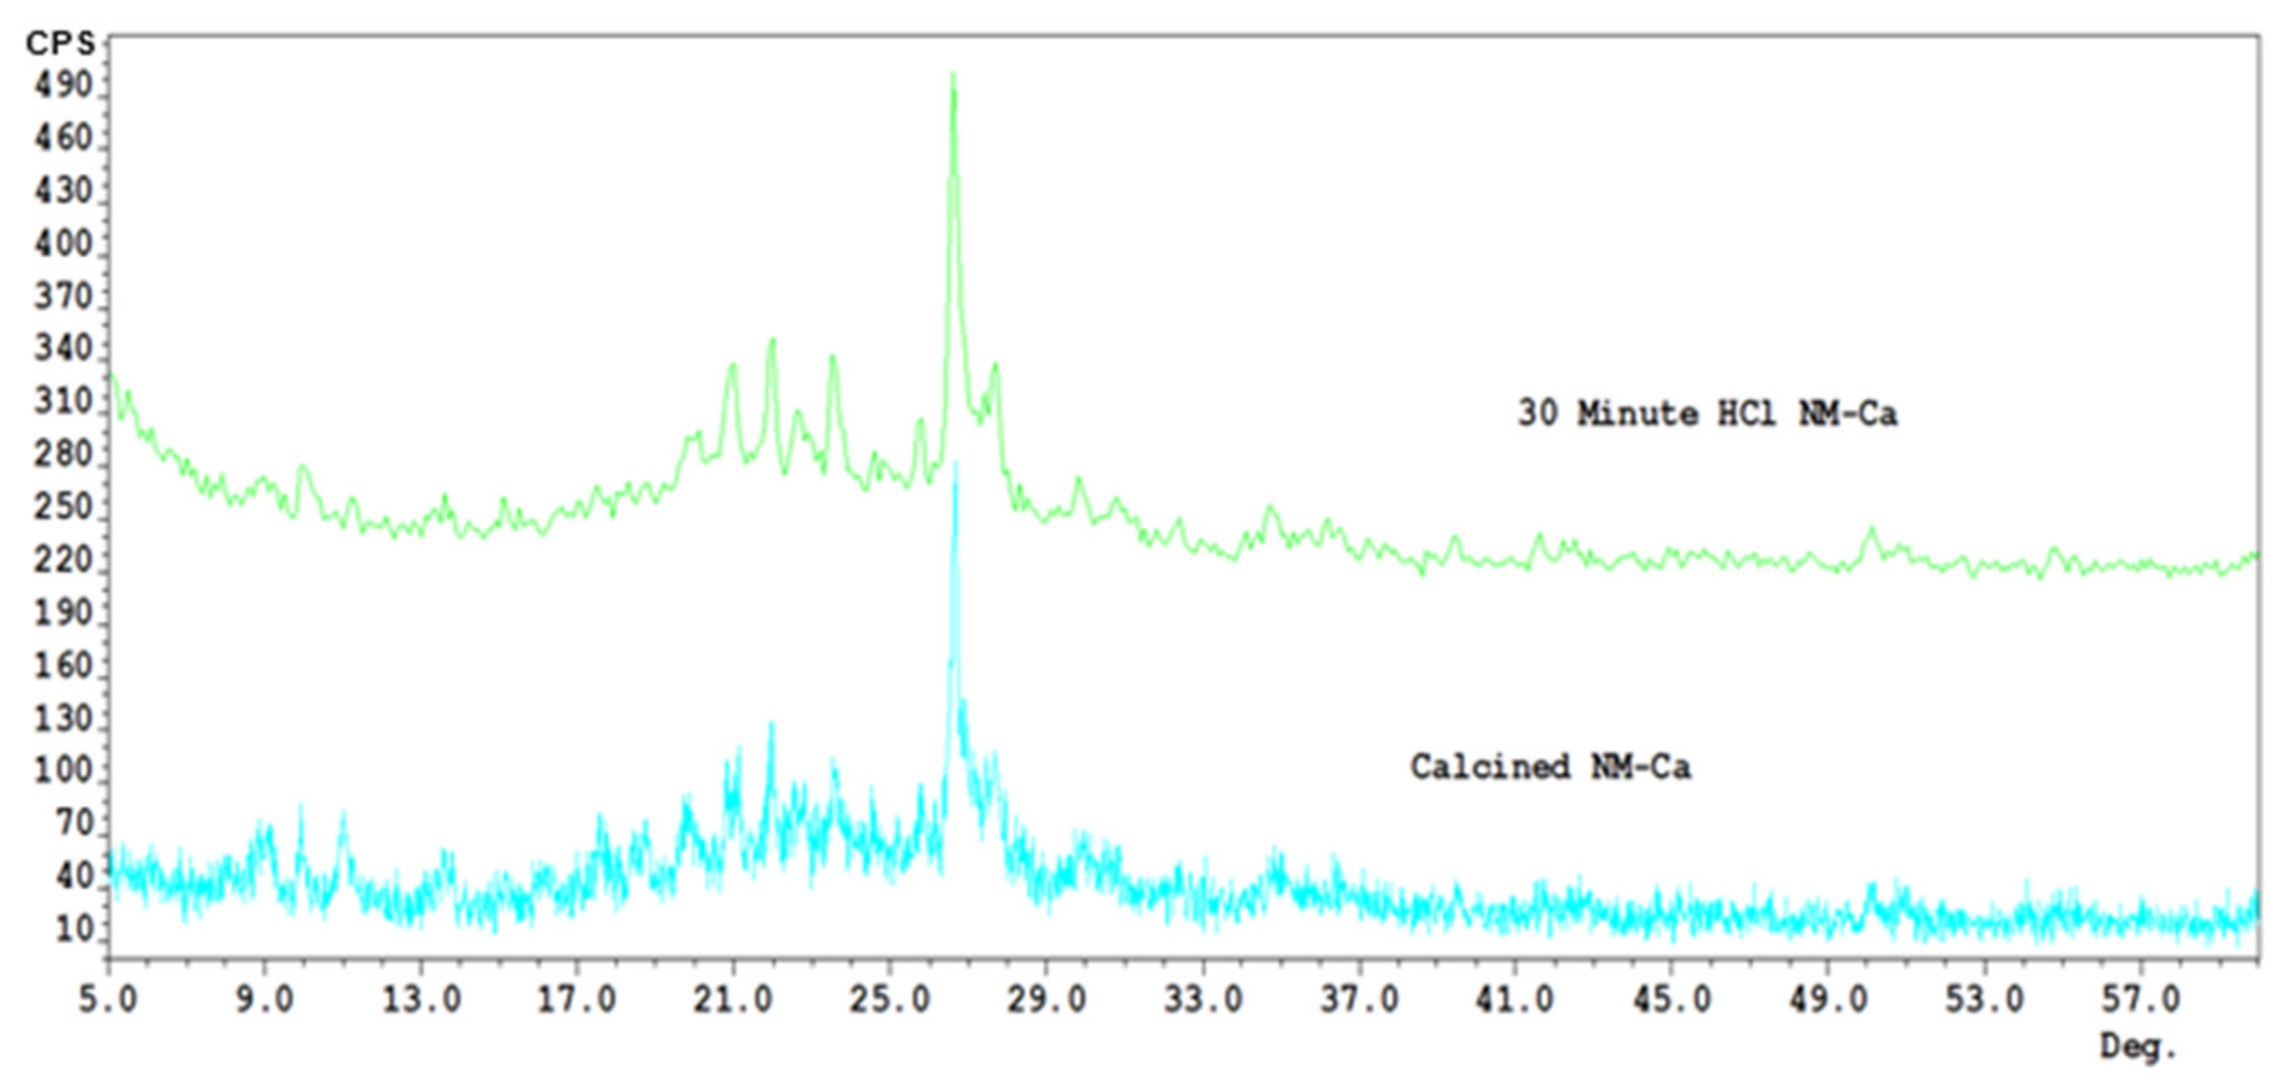
3.1. X-ray Diffraction
Initial Phase Assignment
3.2. Surface Area Analysis
3.3. X-ray Fluorescence/EDS
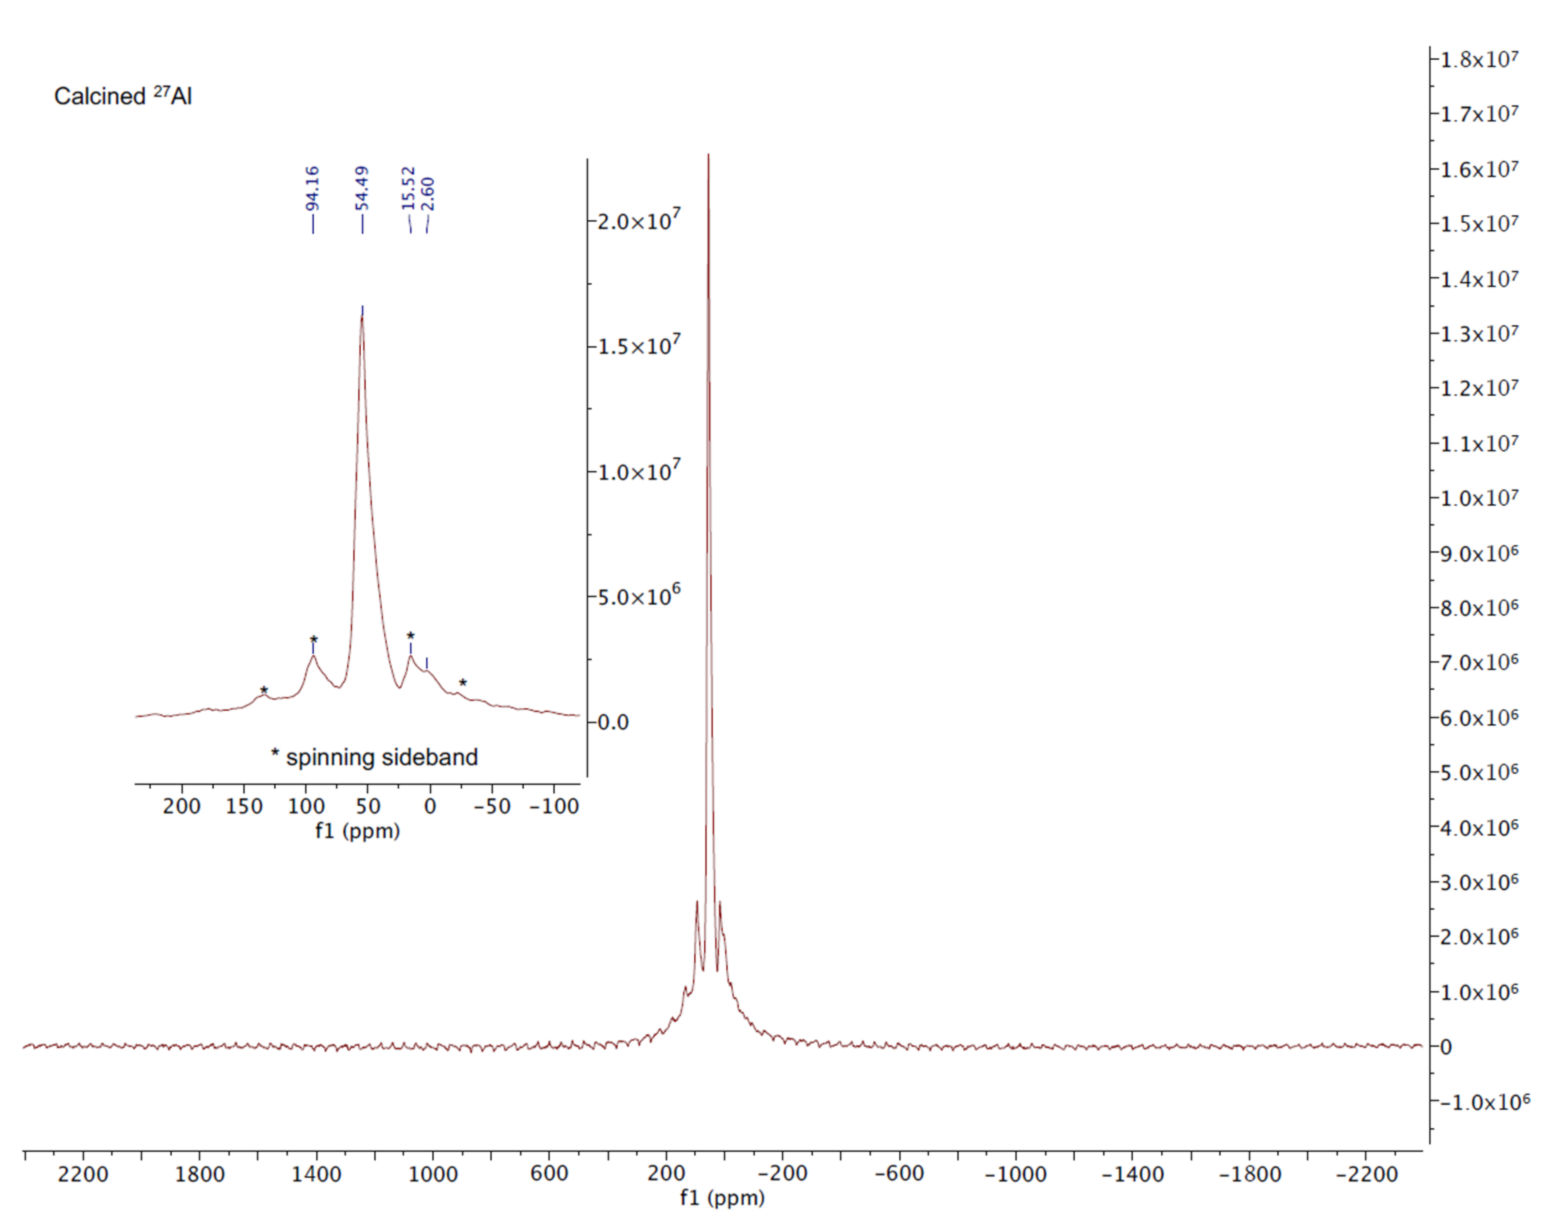
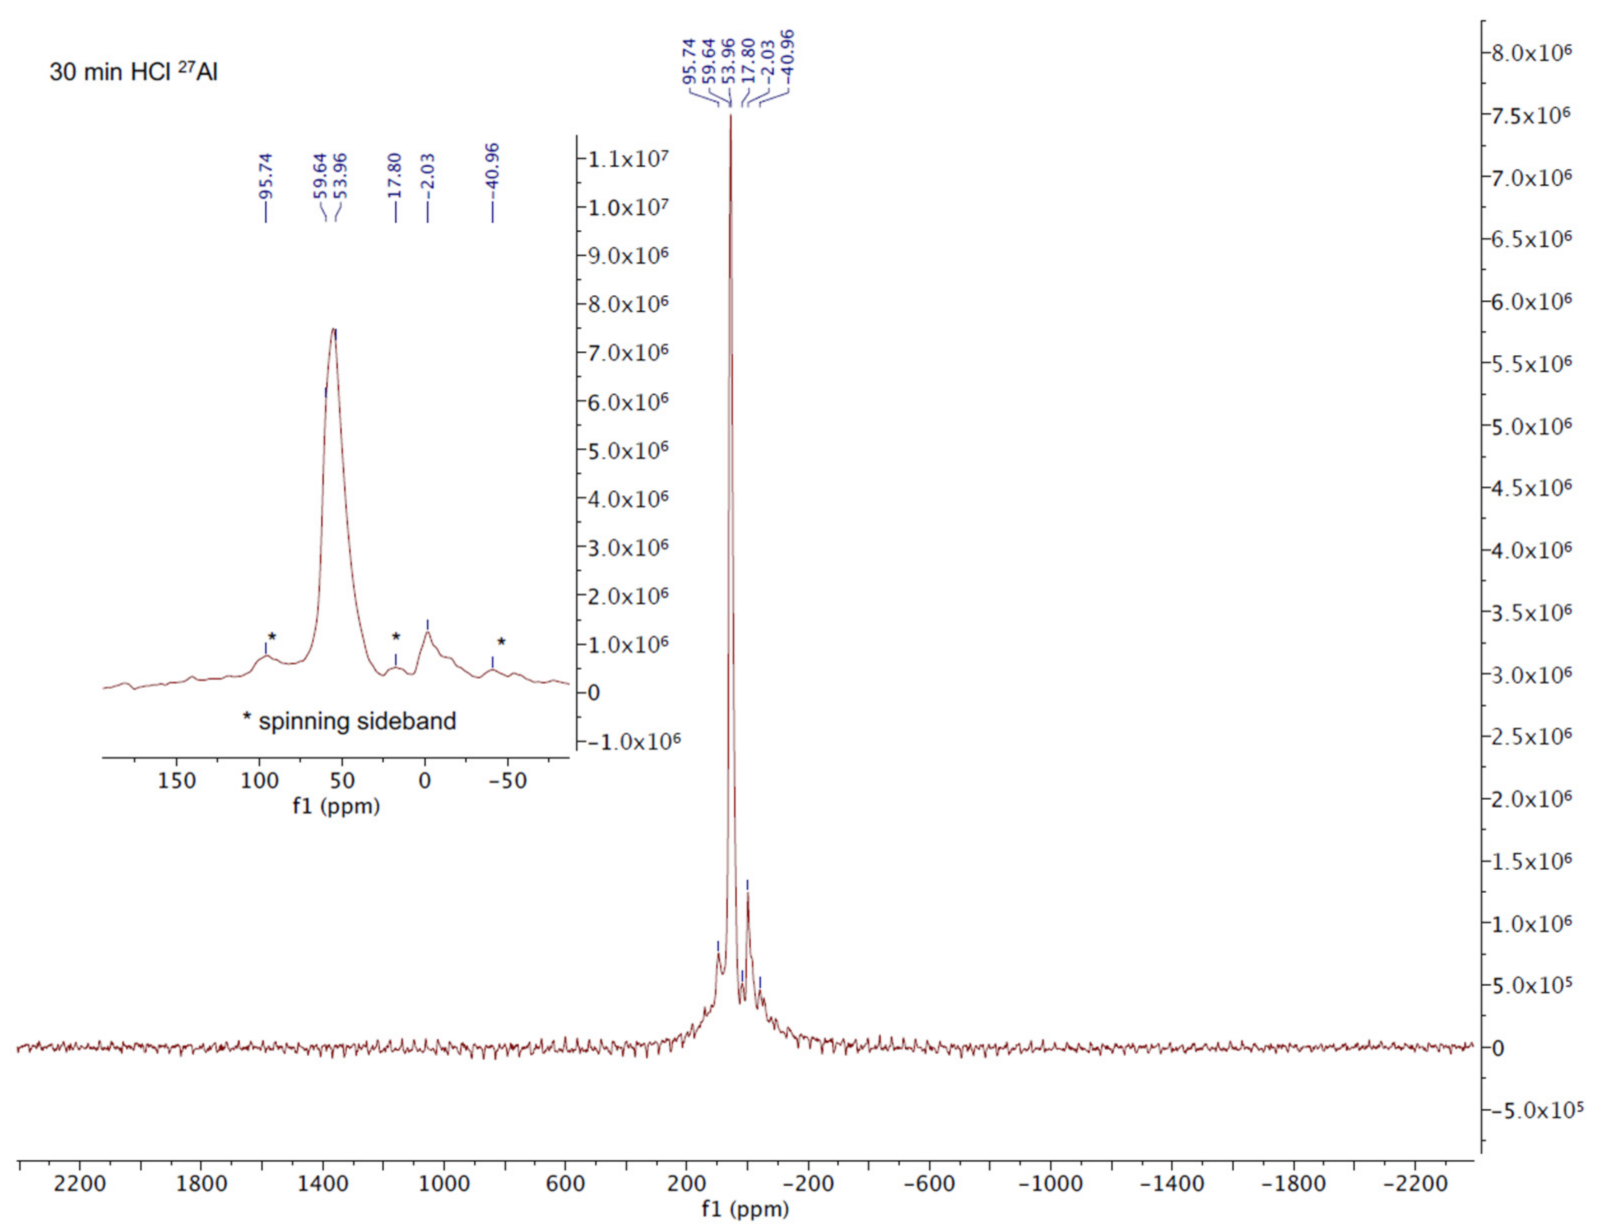
3.4. 27Al NMR
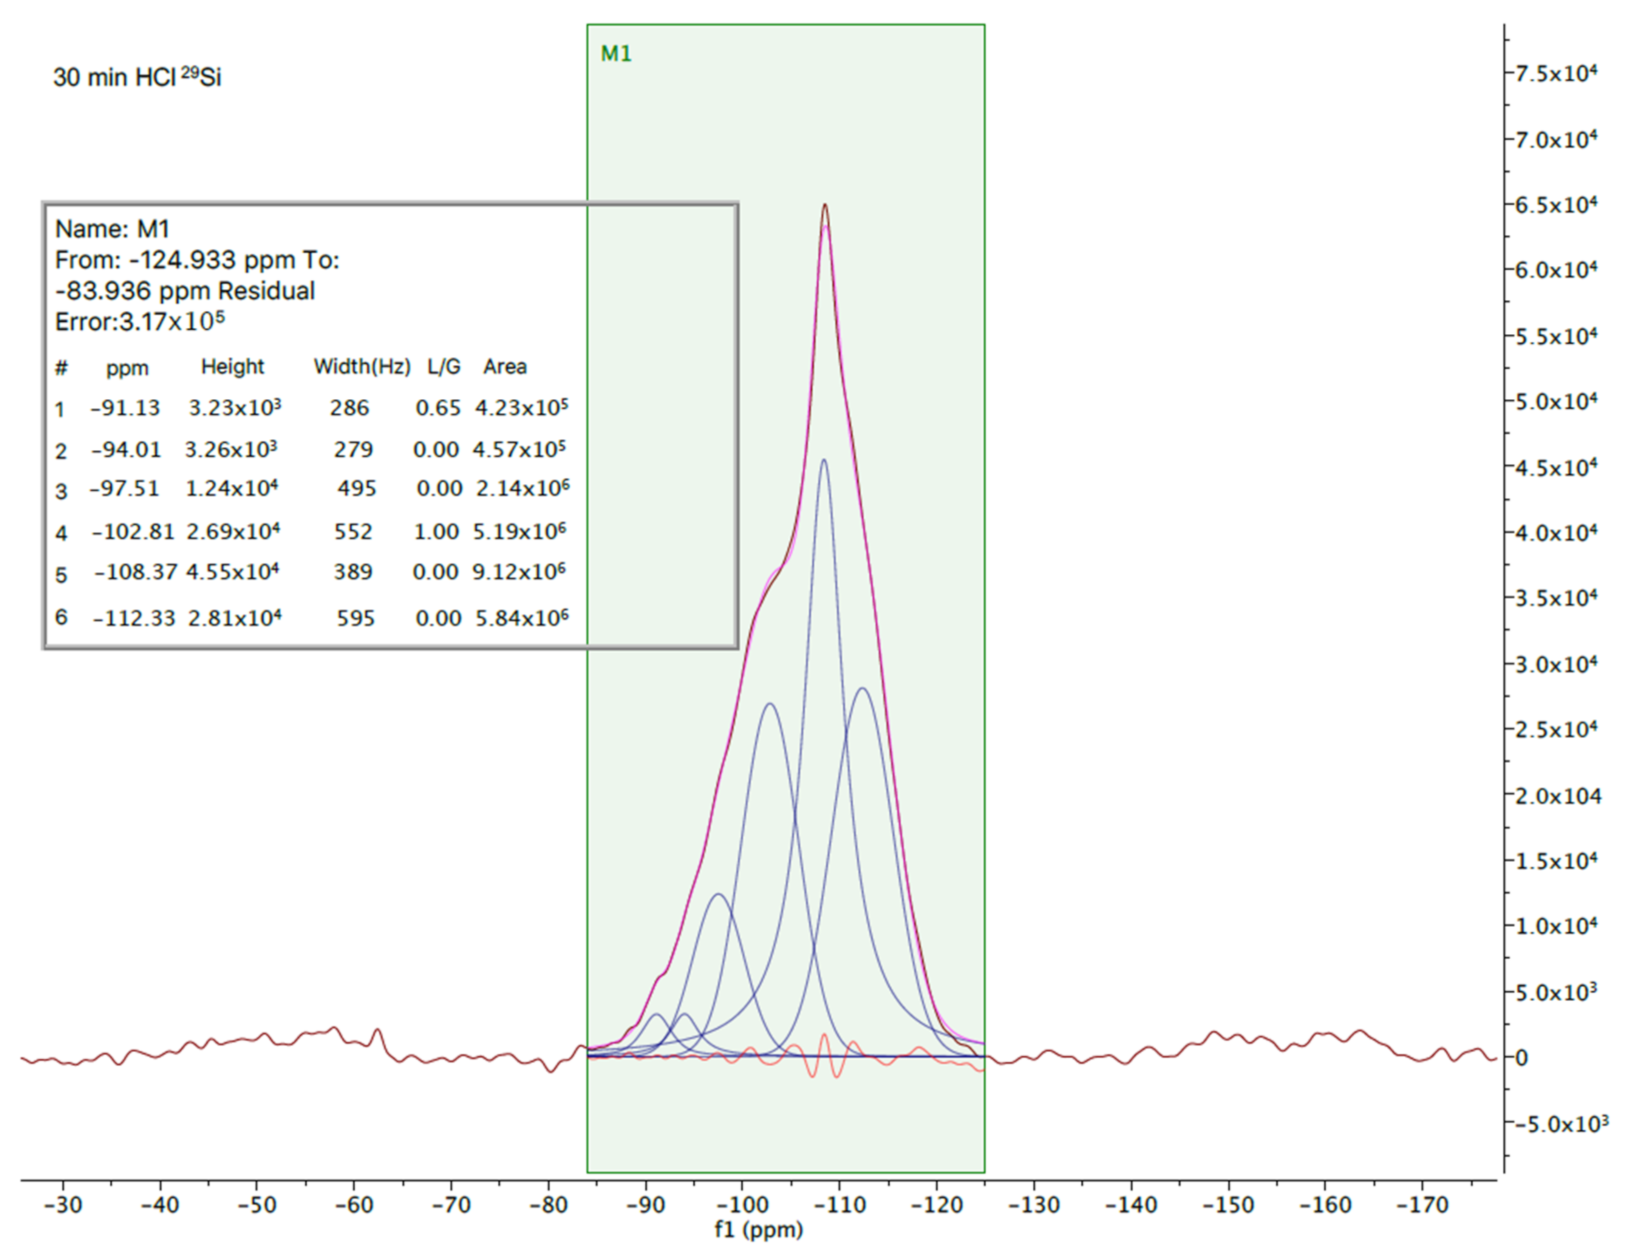
3.5. 29Si MAS NMR
3.5.1. Calcined NV-Na
3.5.2. 30 min HCl NV-Na
3.6. SEM
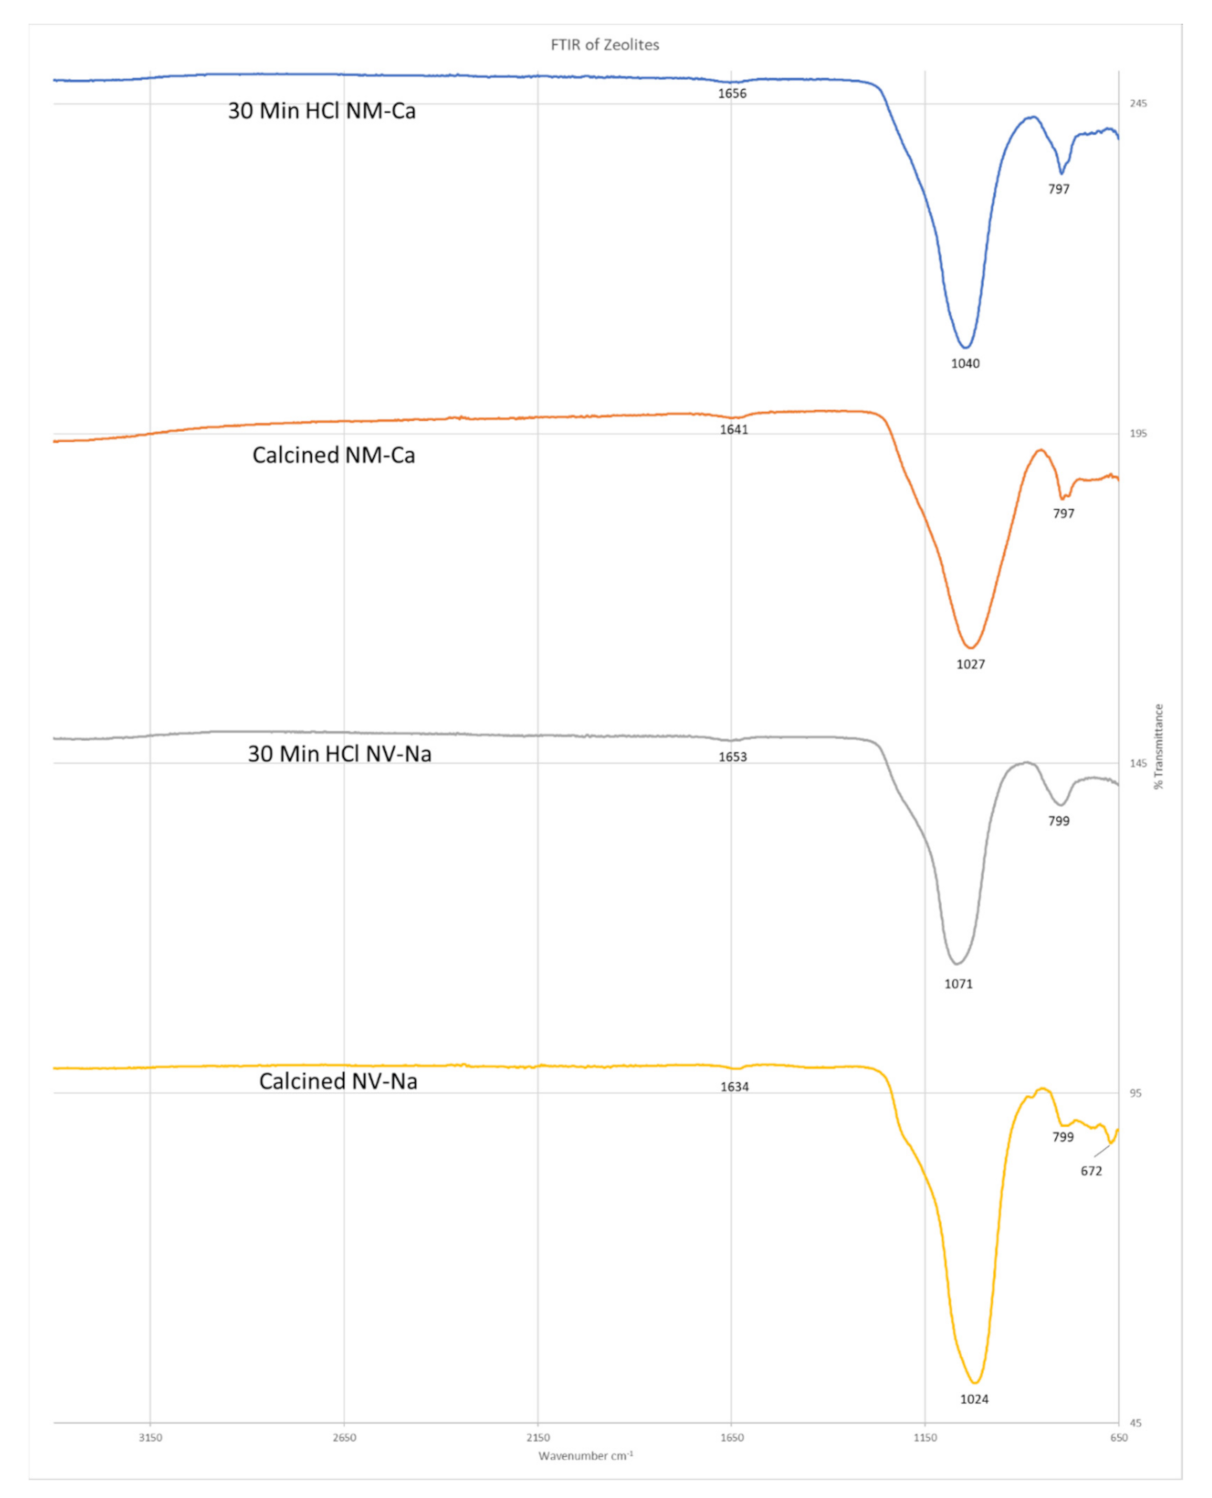
3.7. ATR-FTIR
3.8. Lead Removal Study
4. Conclusions
Author Contributions
Funding
Institutional Review Board Statement
Informed Consent Statement
Acknowledgments
Conflicts of Interest
References
- Virta, R.L. Zeolites. In U.S. Geological Survey Minerals Yearbook; United States Government, Department of the Interior: Washington, DC, USA, 2001; pp. 1–5. [Google Scholar]
- Smith, J.V. Origin and structure of zeolites. ACS Monogr. 1976, 171, 3–79. [Google Scholar]
- Funada, S.; Omi, T.; Nakamura, K.; Sasagawa, S.; Tanaka, M.; Igarashi, K.; Abe, T.; Obata, K.; Sasaki, S. Fired Zeolites Useful for Construction Materials, Direct-Heat Cooking Utensils, and Warm Rock Bathtubs. Japanese Patent JP2007320807; Fukuda Corp., 13 December 2007. [Google Scholar]
- Yorukogullari, E. A Novel Ecological and Biological Organomineral Fertilizer. Turkish Patent WO2019212440, 21 November 2019. [Google Scholar]
- Song, H.; Guo, W.; Liu, J. Compound Fertilizer and Its Preparation Method. Chinese Patent CN108083950, 29 May 2018. [Google Scholar]
- Zhu, J.; Zhang, X. Functional Soil Conditioning Agent and Preparation Method Thereof. Chinese Patent CN107056557, 18 August 2017. [Google Scholar]
- Meng, F.; Yang, L. Fertilizer Containing Seaweed Extract and Preparation Method Thereof. Chinese Patent CN106854107, 16 June 2017. [Google Scholar]
- Jin, Z.; Zhang, Y.; Xu, W.; Lai, N. Special Slow Release Water-Soluble Fertilizer Used for Grape. Chinese Patent CN106396868, 15 February 2017. [Google Scholar]
- Chen, Q.; Zeng, J. Controlled-Release Phosphorus Fertilizer Using ph Sensitive Material and Preparation Method Thereof. Chinese Patent CN104387161, 4 March 2015. [Google Scholar]
- Jin, W.; Meng, X. Zeolite Sustained-Release Fertilizer and Its Manufacturing Method. Chinese Patent CN103304311, 18 September 2013. [Google Scholar]
- Merchant, R.J.; Chan, P.L.S.; Ashenden, P.J. Improvements in or Relating to Cleaning or Cosmetic Compositions Comprising Natural Zeolites. World Intellectual Property Organization WO2010082847, 22 July 2010. [Google Scholar]
- Herzog, C.; Hraschan, J.; Lelas, A. Use of Zeolites for Reducing the Proportion of Lactates and Ammonium in Human and Animal Organisms. World Intellectual Property Organization WO2003072116, 4 September 2003. [Google Scholar]
- Barlokova, D.; Ilavsky, J. Natural zeolites with a surface mno2 layer for water treatment. Chem. Listy 2014, 108, 1153–1157. [Google Scholar]
- Mumpton, F.A. La roca magica: Uses of natural zeolites in agriculture and industry. Proc. Natl. Acad. Sci. USA 1999, 96, 3463. [Google Scholar] [CrossRef] [PubMed] [Green Version]
- Szerement, J.; Szatanik-Kloc, A.; Jarosz, R.; Bajda, T.; Mierzwa-Hersztek, M. Contemporary applications of natural and synthetic zeolites from fly ash in agriculture and environmental protection. J. Clean. Prod. 2021, 311, 127461. [Google Scholar] [CrossRef]
- Wen, J.; Dong, H.; Zeng, G. Application of zeolite in removing salinity/sodicity from wastewater: A review of mechanisms, challenges and opportunities. J. Clean. Prod. 2018, 197, 1435–1446. [Google Scholar] [CrossRef]
- Krstic, V.; Urosevic, T.; Pesovski, B. A review on adsorbents for treatment of water and wastewaters containing copper ions. Chem. Eng. Sci. 2018, 192, 273–287. [Google Scholar] [CrossRef]
- Chojnacka, M.; Sobolewska, P.; Petrus, R.; Warchol, J. Cr(vi) sorption on surface-modified natural zeolites. Przem. Chem. 2017, 96, 332–337. [Google Scholar]
- Ates, A.; Akgül, G. Modification of natural zeolite with naoh for removal of manganese in drinking water. Powder Technol. 2016, 287, 285–291. [Google Scholar] [CrossRef]
- Zhao, Y. Review of the natural, modified, and synthetic zeolites for heavy metals removal from wastewater. Environ. Eng. Sci. 2016, 33, 443–454. [Google Scholar]
- Wang, K. Method and regeneration of sodium modified zeolites for treatment of ammonia-nitrogen wastewater. Shuichuli Jishu 2016, 42, 118–120. [Google Scholar]
- Shi, H.; Wei, L.; Yan, C.; Li, X. Research progress of phosphorus removal by zeolite in wastewater. Guangdong Huagong 2014, 41, 165–169. [Google Scholar]
- Regmi, U.; Boyer, T.H. Ammonium and potassium removal from undiluted and diluted hydrolyzed urine using natural zeolites. Chemosphere 2021, 268, 128849. [Google Scholar] [CrossRef]
- Zwain, H.M.; Vakili, M.; Dahlan, I. Waste material adsorbents for zinc removal from wastewater: A comprehensive review. Int. J. Chem. Eng. 2014, 2014, 347912. [Google Scholar] [CrossRef]
- Sukmasari, E.; Azmiyawati, C. Modification of natural zeolite with Fe(iii) and its application as adsorbent chloride and carbonate ions. IOP Conf. Ser. Mater. Sci. Eng. 2018, 349, 012075. [Google Scholar]
- Armbruster, T.; Gunter, M.E. Crystal structures of natural zeolites. Rev. Mineral. Geochem. 2001, 45, 1–67. [Google Scholar] [CrossRef]
- Ambrozova, P.; Kynicky, J.; Urubek, T.; Nguyen, V.D. Synthesis and modification of clinoptilolite. Molecules 2017, 22, 1107. [Google Scholar] [CrossRef] [Green Version]
- Ruíz-Baltazar, A.; Esparza, R.; Gonzalez, M.; Rosas, G.; Pérez, R. Preparation and characterization of natural zeolite modified with iron nanoparticles. J. Nanomater. 2015, 2015, 364763. [Google Scholar] [CrossRef] [Green Version]
- Wani, A.L.; Ara, A.; Usmani, J.A. Lead toxicity: A review. Interdiscip. Toxicol. 2015, 8, 55–64. [Google Scholar] [CrossRef] [Green Version]
- Coombs, D.S.; Alberti, A.; Armbruster, T.; Artioli, G.; Colella, C.; Galli, E.; Grice, J.D.; Liebau, F.; Mandarino, J.A.; Minato, H.; et al. Recommended nomenclature for zeolite minerals: Report of the subcommittee on zeolites of the international mineralogical association, commission on new minerals and mineral names. Can. Miner. 1997, 35, 1571–1606. [Google Scholar]
- St. Cloud Mining Company. Available online: https://www.stcloudmining.com/sales/data-sheets-applications/ (accessed on 4 June 2021).
- Thrush, K.A.; Kuznicki, S.M. Characterization of chabazite and chabazite like zeolites of unusual composition. J. Chem. Soc. Faraday Trans. 1991, 87, 1031–1035. [Google Scholar] [CrossRef]
- Kuznicki, S.M.; Lin, C.C.H.; Bian, J.; Anson, A. Chemical upgrading of sedimentary na-chabazite from bowie, arizona. Clays Clay Miner. 2007, 55, 235–238. [Google Scholar] [CrossRef]
- Yazdanbakhsh, F.; Alizadehgiashi, M.; Sawada, J.A.; Kuznicki, S.M. A clinoptilolite-pdms mixed-matrix membrane for high temperature water softening. Water Sci. Technol. 2016, 73, 1409–1417. [Google Scholar] [CrossRef] [PubMed]
- An, W.; Zhou, X.; Liu, X.; Chai, P.W.; Kuznicki, T.; Kuznicki, S.M. Natural zeolite clinoptilolite-phosphate composite membranes for water desalination by pervaporation. J. Membr. Sci. 2014, 470, 431–438. [Google Scholar] [CrossRef]
- Adamaref, S.; An, W.; Jarligo, M.O.; Kuznicki, T.; Kuznicki, S.M. Natural clinoptilolite composite membranes on tubular stainless steel supports for water softening. Water Sci. Technol. 2014, 70, 1412–1418. [Google Scholar] [CrossRef] [PubMed]
- Kesraoui-Ouki, S.; Cheeseman, C.; Perry, R. Effects of conditioning and treatment of chabazite and clinoptilolite prior to lead and cadmium removal. Environ. Sci. Technol. 1993, 27, 1108–1116. [Google Scholar] [CrossRef]
- Jang, H.K.; Chung, Y.-D.; Whangbo, S.W.; Lyo, I.W.; Whang, C.N.; Lee, S.J.; Lee, S. Effects of chemical etching with hydrochloric acid on a glass surface. J. Vacuum Sci. Technol. A Vacuum Surf. Films 2000, 18, 2563–2567. [Google Scholar] [CrossRef]
- Garcia-Basabe, Y.; Rodriguez-Iznaga, I.; de Menorval, L.-C.; Llewellyn, P.; Maurin, G.; Lewis, D.W.; Binions, R.; Autie, M.; Ruiz-Salvador, A.R. Step-wise dealumination of natural clinoptilolite: Structural and physicochemical characterization. Microporous Mesoporous Mater. 2010, 135, 187–196. [Google Scholar] [CrossRef]
- Tišler, Z.; Hrachovcová, K.; Svobodová, E.; Šafář, J.; Pelíšková, L. Acid and thermal treatment of alkali-activated zeolite foams. Minerals 2019, 9, 719. [Google Scholar] [CrossRef] [Green Version]
- Brunauer, S.; Emmett, P.H.; Teller, E. Adsorption of gases in multimolecular layers. J. Am. Chem. Soc. 1938, 60, 309–319. [Google Scholar] [CrossRef]
- Altomare, A.; Corriero, N.; Cuocci, C.; Falcicchio, A.; Moliterni, A.; Rizzi, R. Qualx2.0: A qualitative phase analysis software using the freely available database pow_cod. J. Appl. Cryst. 2015, 48, 598–603. [Google Scholar] [CrossRef]
- O’Neill, L. Icdd annual spring meetings. Powder Diffr. 2013, 28, 137–148. [Google Scholar] [CrossRef]
- Abuyaghi, A.; El-Bishtawi, R. Removal of lead and nickel ions using zeolite tuff. J. Chem. Technol. Biotechnol. 1997, 69, 27–34. [Google Scholar]
- Treacy, M.M.J.; Higgins, J.B. (Eds.) Collection of Simulated Xrd Powder Patterns for Zeolites; Elsevier: Amsterdam, The Netherlands, 2001; p. 586. [Google Scholar]
- Keller, E.B.; Meier, W.M.; Kirchner, R.M. Synthesis, structures of alpo4-c and alpo4-d, and their topotactic transformation. Solid State Ionics 1990, 43, 93–102. [Google Scholar] [CrossRef]
- Galli, E.; Gottardi, G.; Mayer, H.; Preisinger, A.; Passaglia, E. The structure of potassium-exchanged heulandite at 293, 373 and 593 k. Acta Crystallogr. Sect. B Struct. Sci. 1983, 39, 189–197. [Google Scholar] [CrossRef]
- Koyama, K.; Takeuchi, Y. Clinoptilolite: The distribution of potassium atoms and its role in thermal stability. Z. Kristallogr. Cryst. Mater. 1977, 145, 216–239. [Google Scholar] [CrossRef]
- Levien, L.; Prewitt, C.T.; Weidner, D.J. Structure and elastic properties of quartz at pressure. Am. Miner. 1980, 65, 920–930. [Google Scholar]
- Arletti, R.; Quartieri, S.; Vezzalini, G. Elastic behavior of zeolite boggsite in silicon oil and aqueous medium: A case of high-pressure-induced over-hydration. Am. Miner. 2010, 95, 1247–1256. [Google Scholar] [CrossRef]
- Lippmaa, E.; Samoson, A.; Magi, M. High-resolution aluminum-27 nmr of aluminosilicates. J. Am. Chem. Soc. 1986, 108, 1730–1735. [Google Scholar] [CrossRef]
- Holzinger, J.; Nielsen, M.; Beato, P.; Brogaard, R.Y.; Buono, C.; Dyballa, M.; Falsig, H.; Skibsted, J.; Svelle, S. Identification of distinct framework aluminum sites in zeolite zsm-23: A combined computational and experimental 27al nmr study. J. Phys. Chem. C 2019, 123, 7831–7844. [Google Scholar] [CrossRef]
- Lippmaa, E.; Maegi, M.; Samoson, A.; Tarmak, M.; Engelhardt, G. Investigation of the structure of zeolites by solid-state high-resolution silicon-29 nmr spectroscopy. J. Am. Chem. Soc. 1981, 103, 4992–4996. [Google Scholar] [CrossRef]
- Khodabandeh, S.; Davis, M.E. Synthesis of a heulandite-type zeolite by hydrothermal conversion of zeolite p1. Chem. Commun. 1996, 1205–1206. [Google Scholar] [CrossRef] [Green Version]
- Malfait, W.J.; Halter, W.E.; Verel, R. 29si nmr spectroscopy of silica glass: T1 relaxation and constraints on the si–o–si bond angle distribution. Chem. Geol. 2008, 256, 269–277. [Google Scholar] [CrossRef]
- Minceva, M.; Fajgar, R.; Markovska, L.; Meshko, V. Comparative study of Zn2+, Cd2+, and Pb2+ removal from water solution using natural clinoptilolitic zeolite and commercial granulated activated carbon. Equilibrium of adsorption. Sep. Sci. Technol. 2008, 43, 1–27. [Google Scholar] [CrossRef]
- Zendelska, A.; Golomeova, M.; Jakupi, Š.; Lisichkov, K.; Kuvendziev, S.; Marinkovski, M. Characterization and application of clinoptilolite for removal of heavy metal ions from water resources. Geol. Maced. 2018, 32, 21–32. [Google Scholar]
- Shahack-Gross, R.; Bar-Yosef, O.; Weiner, S. Black-coloured bones in hayonim cave, israel: Differentiating between burning and oxide staining. J. Archaeol. Sci. 1997, 24, 439–446. [Google Scholar] [CrossRef]
- Akdeniz, Y.; Ülkü, S. Thermal stability of ag-exchanged clinoptilolite rich mineral. J. Therm. Anal. Calorim. 2008, 94, 703–710. [Google Scholar] [CrossRef] [Green Version]
- Oter, O.; Akcay, H. Use of natural clinoptilolite to improve water quality: Sorption and selectivity studies of lead(ii), copper(ii), zinc(ii), and nickel(ii). Water Environ. Res. 2007, 79, 329–335. [Google Scholar] [CrossRef] [PubMed]
- Inglezakis, V.J.; Loizidou, M.D.; Grigoropoulou, H.P. Equilibrium and kinetic ion exchange studies of Pb2+, Cr3+, Fe3+ and Cu2+ on natural clinoptilolite. Water Res. 2002, 36, 2784–2792. [Google Scholar] [CrossRef]
- Shannon, R. Revised effective ionic radii and systematic studies of interatomic distances in halides and chalcogenides. Acta Crystallogr. Sect. A 1976, 32, 751–767. [Google Scholar] [CrossRef]
- Santiago, O.; Walsh, K.; Kele, B.; Gardner, E.; Chapman, J. Novel pre-treatment of zeolite materials for the removal of sodium ions: Potential materials for coal seam gas co-produced wastewater. SpringerPlus 2016, 5, 571. [Google Scholar] [CrossRef] [Green Version]


| Sample | 5 Point BET Surface | Pore Volume | Micropore Volume | Micropore | External Surface |
|---|---|---|---|---|---|
| Area (m2/g) | (cm3/g) | (cm3/g) | Area (m2/g) | Area (m2/g) | |
| NV-Na calcined | 19.0(4) | 0.04 | 0.002 | 4.8 | 14.23 |
| 10 min HCl NV-Na | 147(6) | 0.11 | 0.049 | 93.28 | 52.05 |
| 20 min HCl NV-Na | 141(6) | 0.11 | 0.043 | 81.43 | 59.87 |
| 30 min HCl NV-Na | 158(7) | 0.12 | 0.051 | 94.99 | 63.15 |
| 40 min HCl NV-Na | 138(6) | 0.11 | 0.041 | 75.06 | 63.49 |
| NM-Ca calcined | 20.0(1) | 0.04 | 0.001 | 2.73 | 17.27 |
| 10 min HCl NM-Ca | 82.0(3) | 0.08 | 0.021 | 38.71 | 43.36 |
| 20 min HCl NM-Ca | 89.0(3) | 0.08 | 0.022 | 41.61 | 47.75 |
| 30 min HCl NM-Ca | 111(4) | 0.1 | 0.029 | 55.15 | 56.22 |
| 40 min HCl NM-Ca | 101(4) | 0.08 | 0.028 | 53.53 | 48.28 |
| Sample | Average Micropore | Average Mesopore |
|---|---|---|
| Diameter (Å) | Diameter (Å) | |
| NV-Na calcined | 4.586 | 91.00 |
| 10 min HCl NV-Na | 4.597 | 31.06 |
| 20 min HCl NV-Na | 4.591 | 32.44 |
| 30 min HCl NV-Na | 4.600 | 31.72 |
| 40 min HCl NV-Na | 4.598 | 32.95 |
| NM-Ca calcined | 4.584 | 93.71 |
| 10 min HCl NM-Ca | 4.388 | 40.31 |
| 20 min HCl NM-Ca | 4.584 | 39.62 |
| 30 min HCl NM-Ca | 4.597 | 36.36 |
| 40 min HCl NM-Ca | 4.588 | 34.63 |
| Experimental Run | Na | Ca | K | Mg | Fe | Al | Si | P | Si:Al2 Ratio |
|---|---|---|---|---|---|---|---|---|---|
| NV-Na | 0.25 ± 0.08 | 1.14 ± 0.04 | 3.34 ± 0.08 | 0.30 ± 0.08 | 0.79 ± 0.01 | 9.27 ± 0.24 | 84.36 ± 0.70 | 0.442 ± 0.08 | 4.55 |
| 30 min NV-Na | 0.02 ± 0.04 | 0.05 ± 0.01 | 0.30 ± 0.02 | 0.16 ± 0.04 | 0.04 ± 0.002 | 4.16 ± 0.11 | 95.04 ± 0.49 | 0.17 ± 0.03 | 11.42 |
| NM-Ca | 0.10 ± 0.04 | 6.31 ± 0.11 | 4.29 ± 0.10 | 0.52 ± 0.05 | 2.67 ± 0.04 | 9.51 ± 0.17 | 76.26 ± 0.46 | 0.27 ± 0.04 | 4.01 |
| 30 min NM-Ca | 0.04 ± 0.04 | 0.42 ± 0.04 | 2.54 ± 0.08 | 0.17 ± 0.05 | 0.07 ± 0.002 | 4.71 ± 0.13 | 91.83 ± 0.56 | 0.17 ± 0.04 | 9.75 |
| NV-Na | NM-Ca | |||||
|---|---|---|---|---|---|---|
| Experimental | Mole % | Formula | Calculated | Manufacturer | Calculated | Manufacturer |
| Run | Wt% | Wt % a | Wt% | Wt% a | ||
| Na | 0.10 | Na2O | 0.13 | 3.5 | 0.05 | 0.3 |
| Ca | 6.31 | CaO | 1.09 | 0.8 | 6.02 | 3.4 |
| K | 4.29 | K2O | 2.68 | 3.8 | 3.44 | 3.2 |
| Mg | 0.52 | MgO | 0.21 | 0.4 | 0.36 | 1.4 |
| Fe | 2.67 | Fe2O3 | 1.07 | 0.7 | 3.63 | 1.6 |
| Al | 9.51 | Al2O3 | 8.04 | 11.9 | 8.25 | 11.9 |
| Si | 76.26 | SiO2 | 86.25 | 69.1 | 77.94 | 64.9 |
| P | 0.27 | P2O5 | 0.53 | 0.33 | >0.05 | |
| MnO | 0.02 | |||||
| TiO2 | 0.1 | |||||
| Total | 100 | 90.32 | 100 | 86.7 | ||
| Sample | Meq/g of Pb2+ (3 Samples) |
|---|---|
| AZLB-Na | 2.05(27) |
| AZLB-Ca | 2.00(11) |
| NV-Na calcined | 1.50(17) |
| NM-Ca calcined | 0.27(14) |
| 30 min HCl NV-Na | 0.41(23) |
| 30 min HCl NM-Ca | 0.06(9) |
| Sample | Meq/g of Pb2+ (3 Samples) |
|---|---|
| K+ charged NV-Na | 0.84(5) |
| K+ charged NM-Ca | 0.34(3) |
| K+ charged 30 min HCl NV-Na | 0.22(5) |
| K+ charged 30 min HCl NM-Ca | 0.07(9) |
Publisher’s Note: MDPI stays neutral with regard to jurisdictional claims in published maps and institutional affiliations. |
© 2021 by the authors. Licensee MDPI, Basel, Switzerland. This article is an open access article distributed under the terms and conditions of the Creative Commons Attribution (CC BY) license (https://creativecommons.org/licenses/by/4.0/).
Share and Cite
Huntley, G.M.; Luck, R.L.; Mullins, M.E.; Newberry, N.K. Hydrochloric Acid Modification and Lead Removal Studies on Naturally Occurring Zeolites from Nevada, New Mexico, and Arizona. Processes 2021, 9, 1238. https://0-doi-org.brum.beds.ac.uk/10.3390/pr9071238
Huntley GM, Luck RL, Mullins ME, Newberry NK. Hydrochloric Acid Modification and Lead Removal Studies on Naturally Occurring Zeolites from Nevada, New Mexico, and Arizona. Processes. 2021; 9(7):1238. https://0-doi-org.brum.beds.ac.uk/10.3390/pr9071238
Chicago/Turabian StyleHuntley, Garven M., Rudy L. Luck, Michael E. Mullins, and Nick K. Newberry. 2021. "Hydrochloric Acid Modification and Lead Removal Studies on Naturally Occurring Zeolites from Nevada, New Mexico, and Arizona" Processes 9, no. 7: 1238. https://0-doi-org.brum.beds.ac.uk/10.3390/pr9071238