
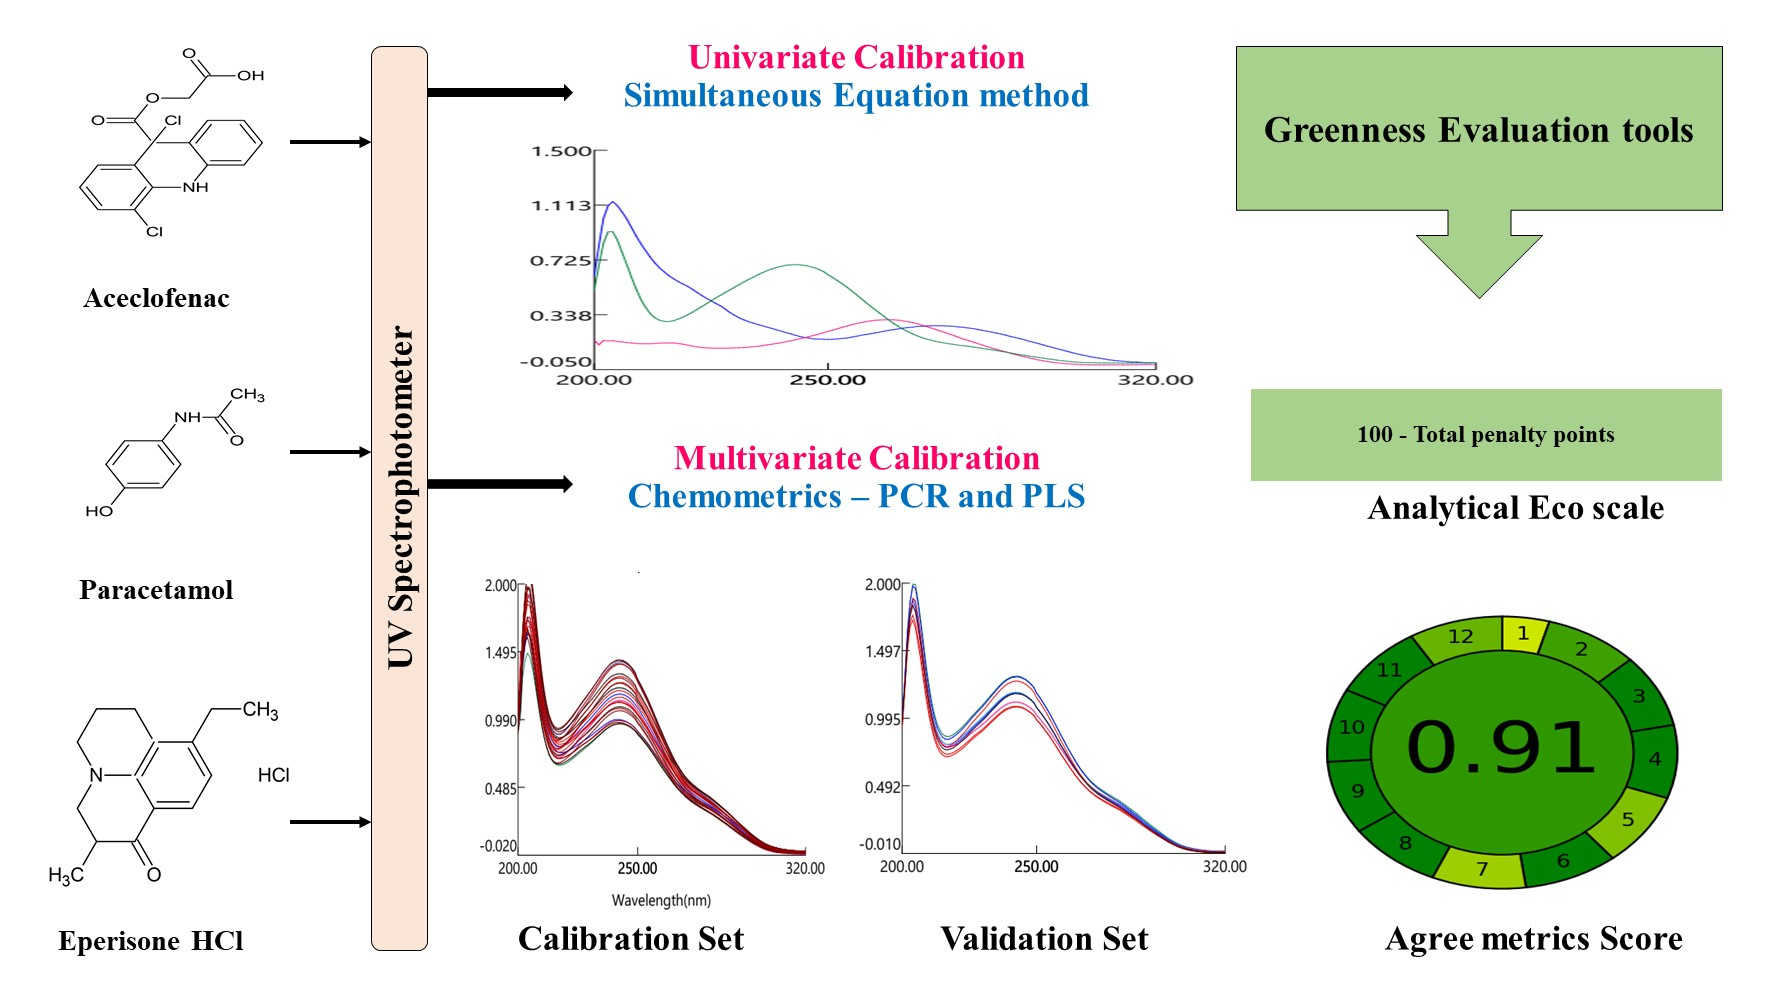
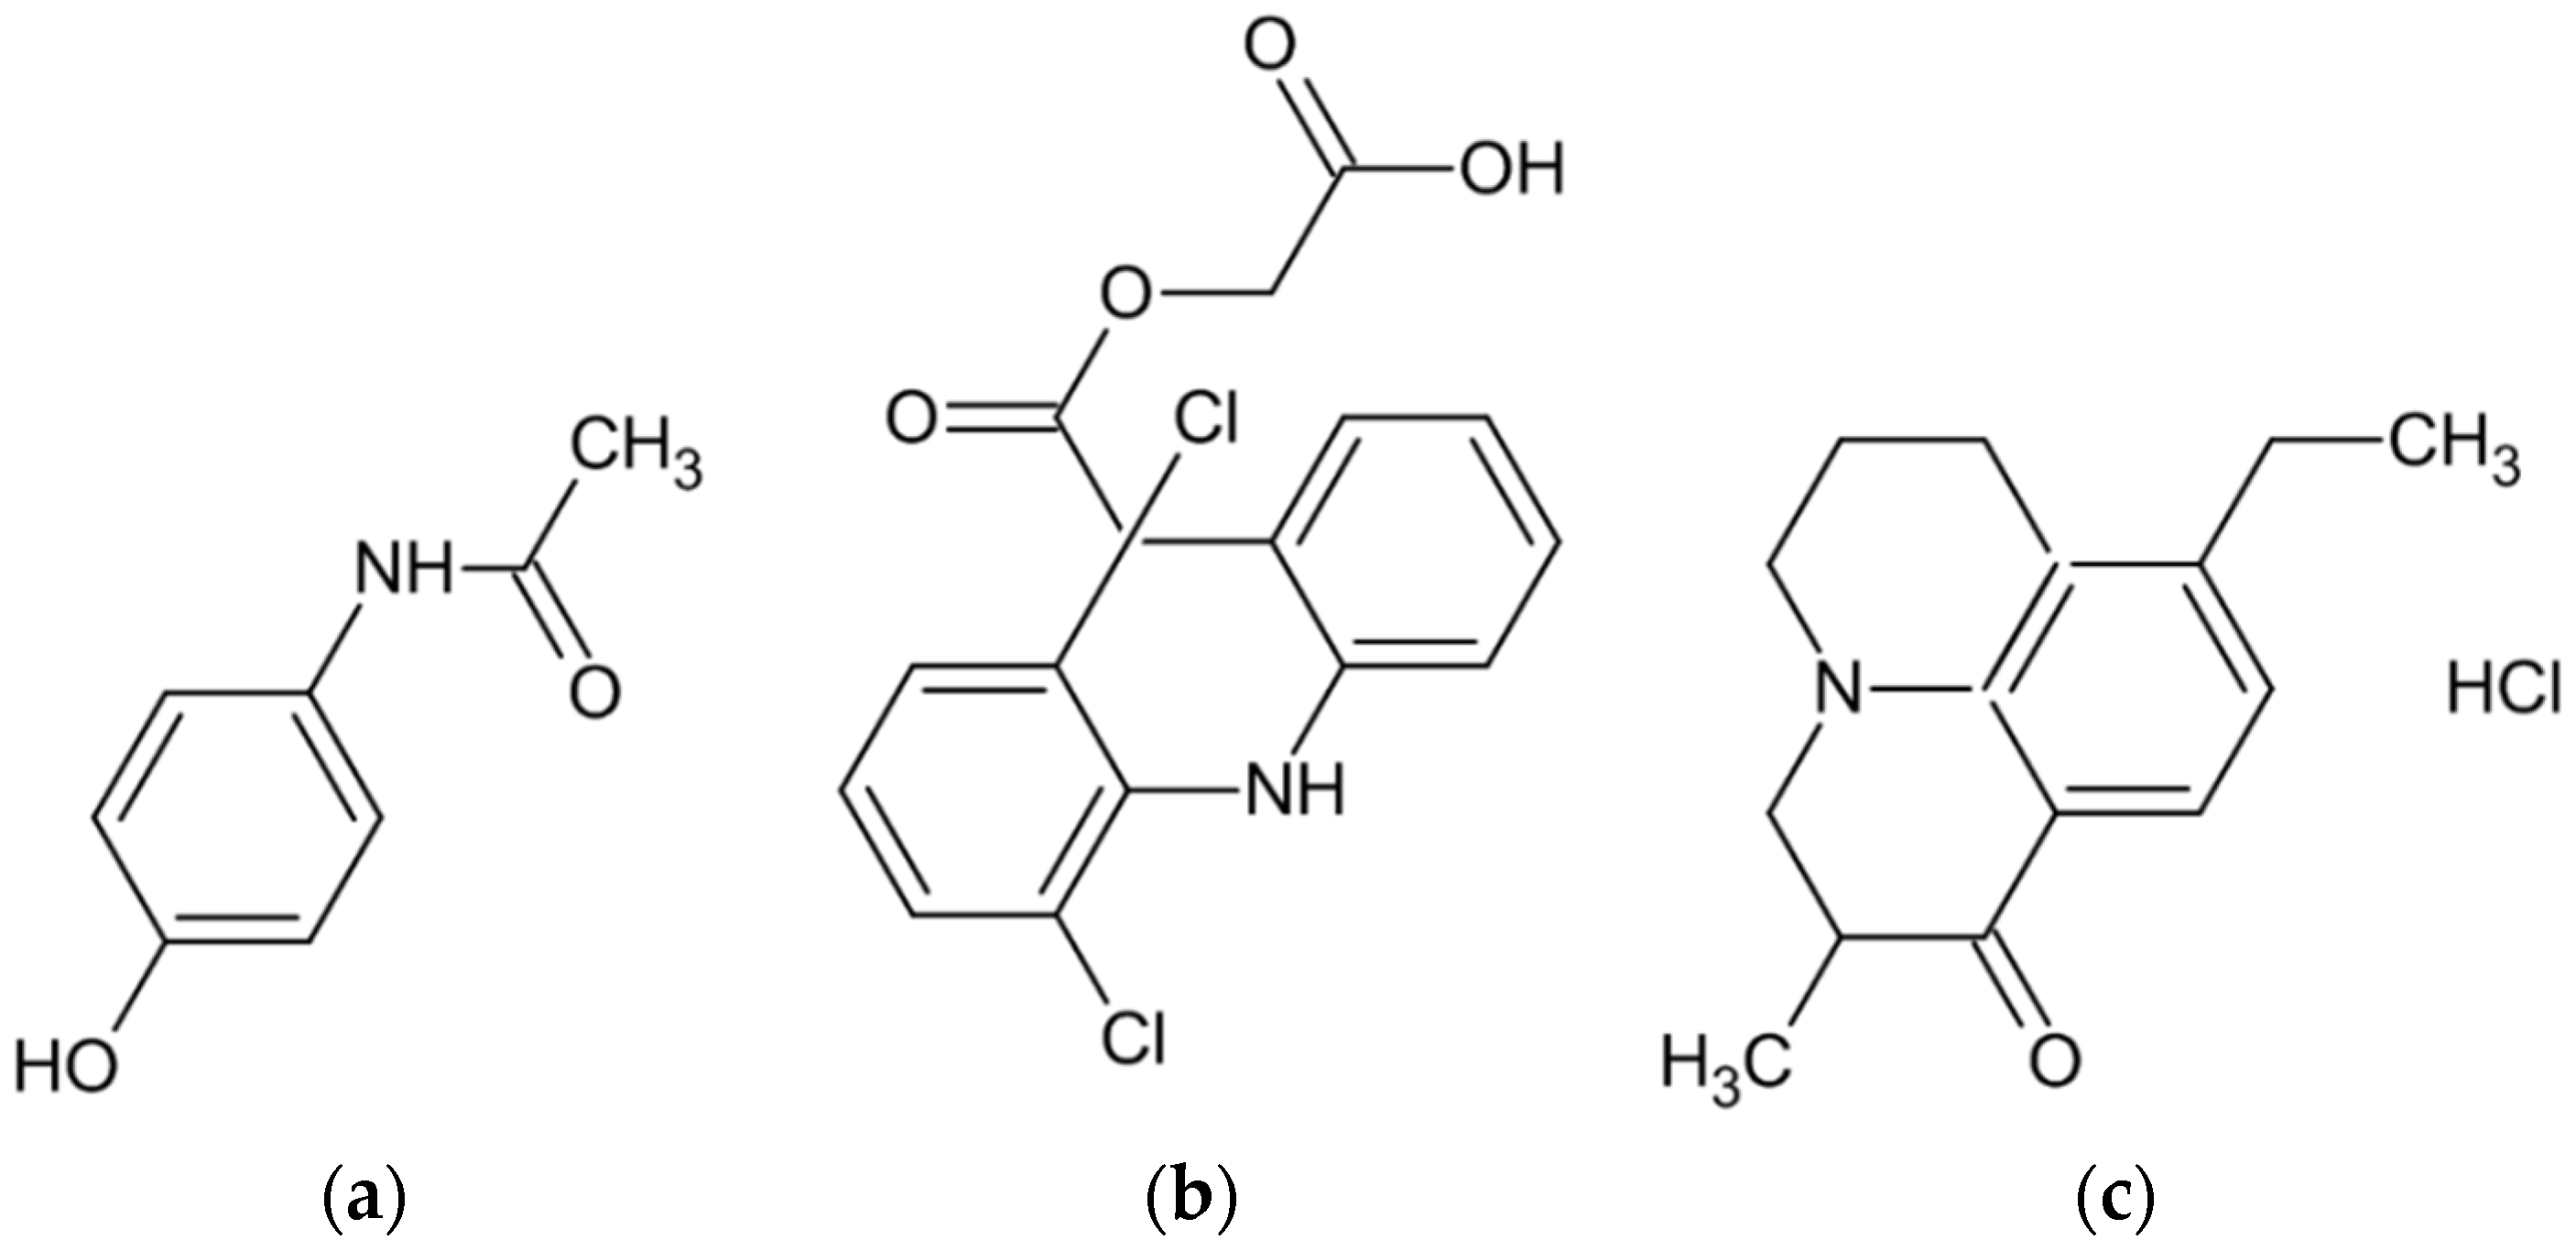
Ecofriendly Simple UV Spectrophotometric and Chemometric Methods for Simultaneous Estimation of Paracetamol Aceclofenac and Eperisone Hydrochloride in Pharmaceutical Formulation: Assessment of Greenness Profile


Abstract
:
1. Introduction
- CX, CY, and CZ are X, Y, and Z concentrations, respectively, in the mixture.
- A1, A2, and A3 are the absorbances of the sample at λ1, λ2, and λ3, respectively.
- ax1, ax2, and ax3 are the absorptivity of X at λ1, λ2, and λ3 nm, respectively.
- ay1, ay2, and ay3 are the absorptivity of Y at λ1, λ2, and λ3 nm, respectively.
- az1, az2, and az3 are the absorptivity of Z at λ1, λ2, and λ3 nm, respectively.
2. Materials and Methods
2.1. Instrumentation
2.2. Reference Samples
2.3. Marketed Formulation
2.4. Software
2.5. Chemicals and Reagents
2.6. Preparation of Diluent
2.7. The Standard Stock Solution of Analytes
2.8. Methodology for Simultaneous Equation Spectrophotometric Method
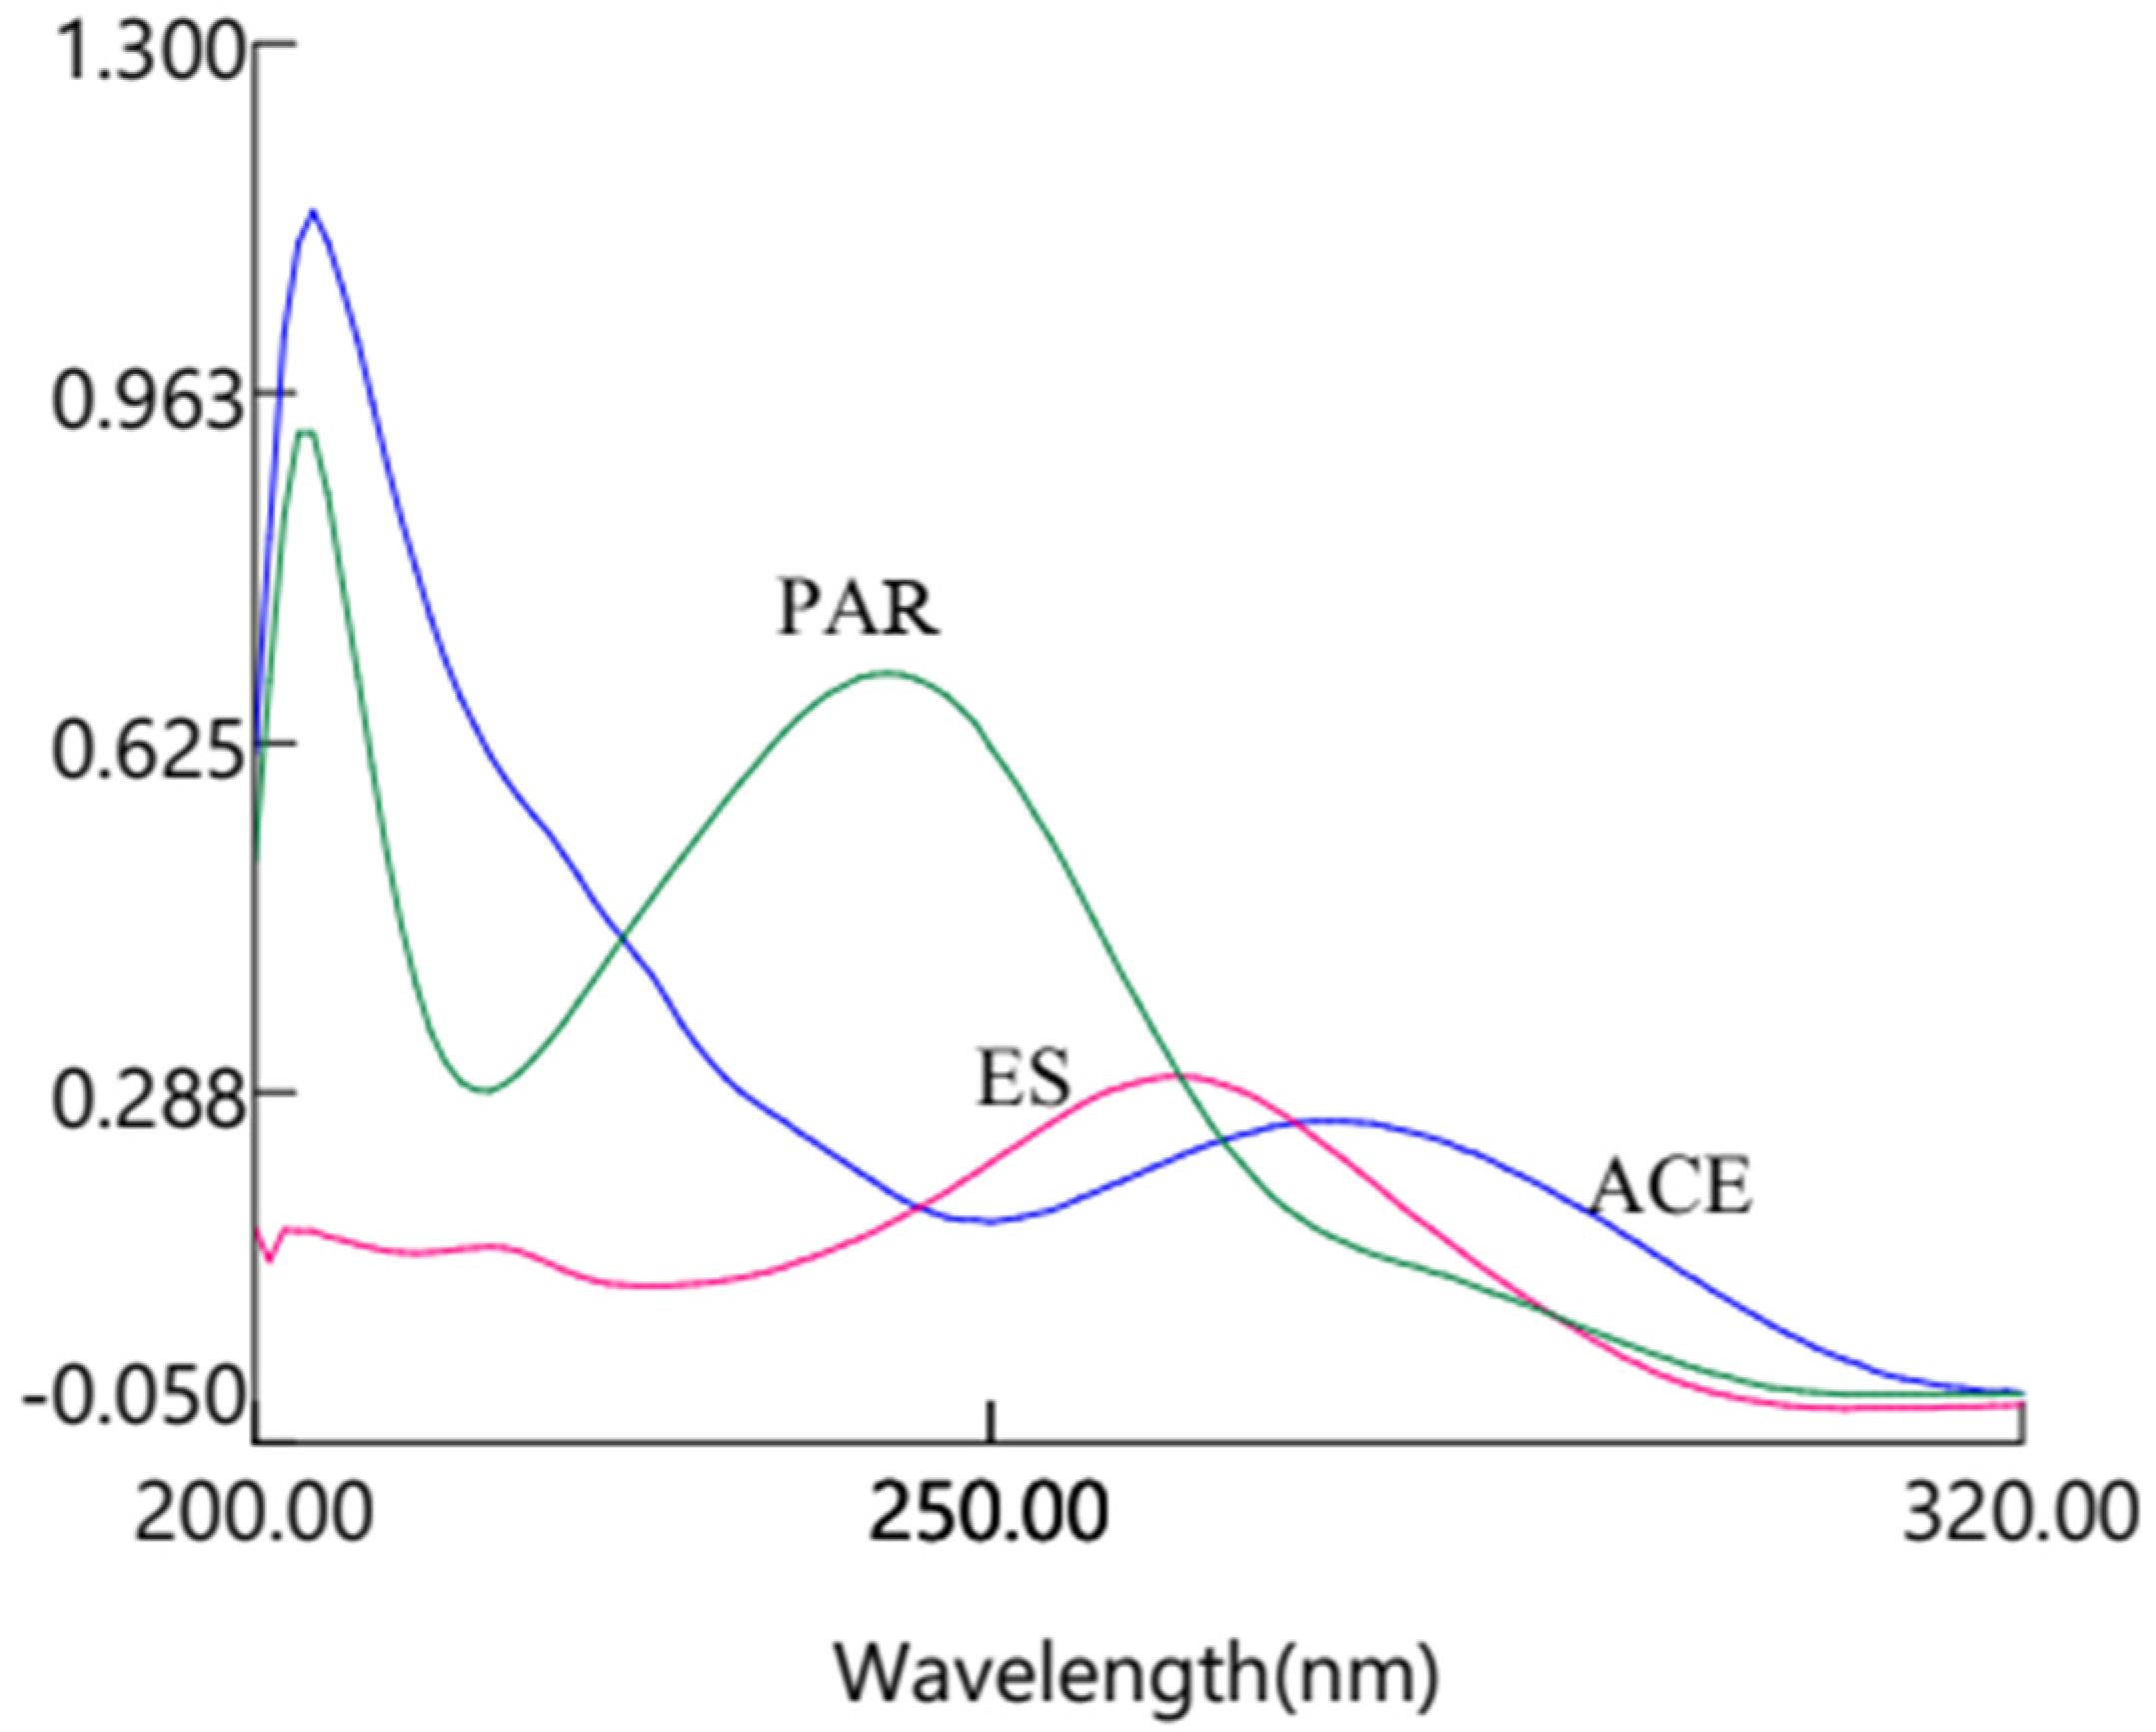
2.8.1. Overlay Spectrum Analysis and Wavelength Selection
2.8.2. Analysis of Pharmaceutical Formulation
2.8.3. Solution Stability
2.8.4. Method Validation
2.9. Chemometrics Methods (PCR and PLS)
2.9.1. Designing of Experiment
2.9.2. Constitution of the Calibration Set
2.9.3. Constitution of Prediction Set
2.9.4. Construction of Models
3. Results and Discussion
3.1. Simultaneous Equation Method
3.2. Chemometric Method
3.2.1. Selection of Wavelength Range for PCR and PLS
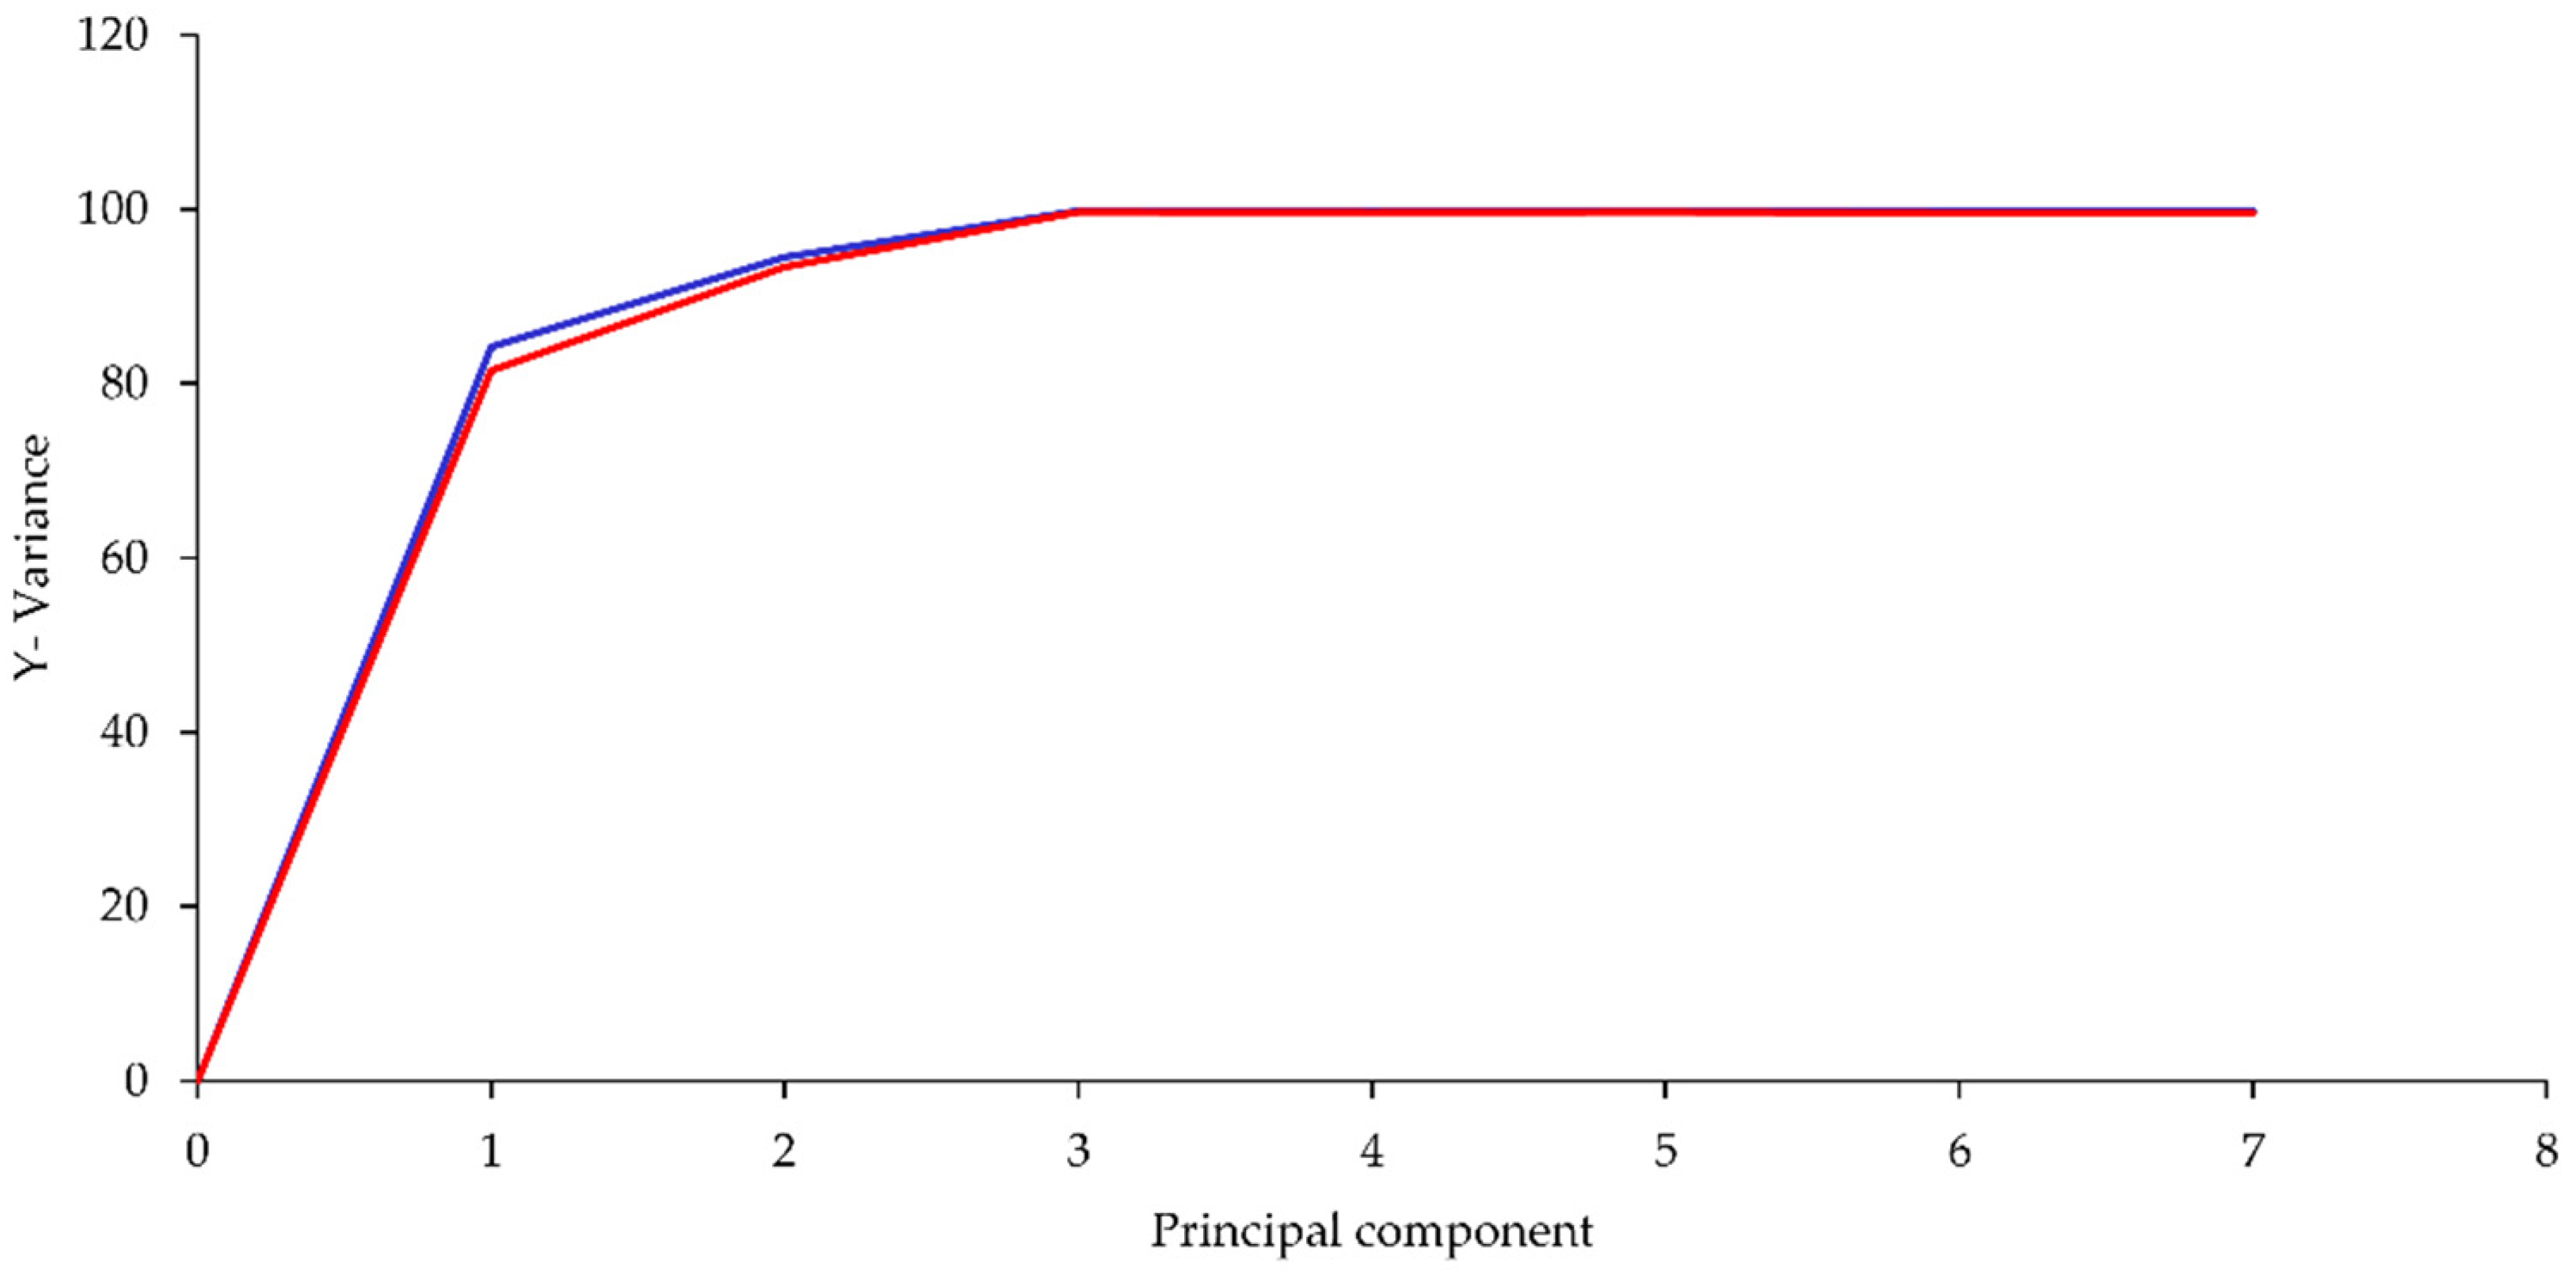
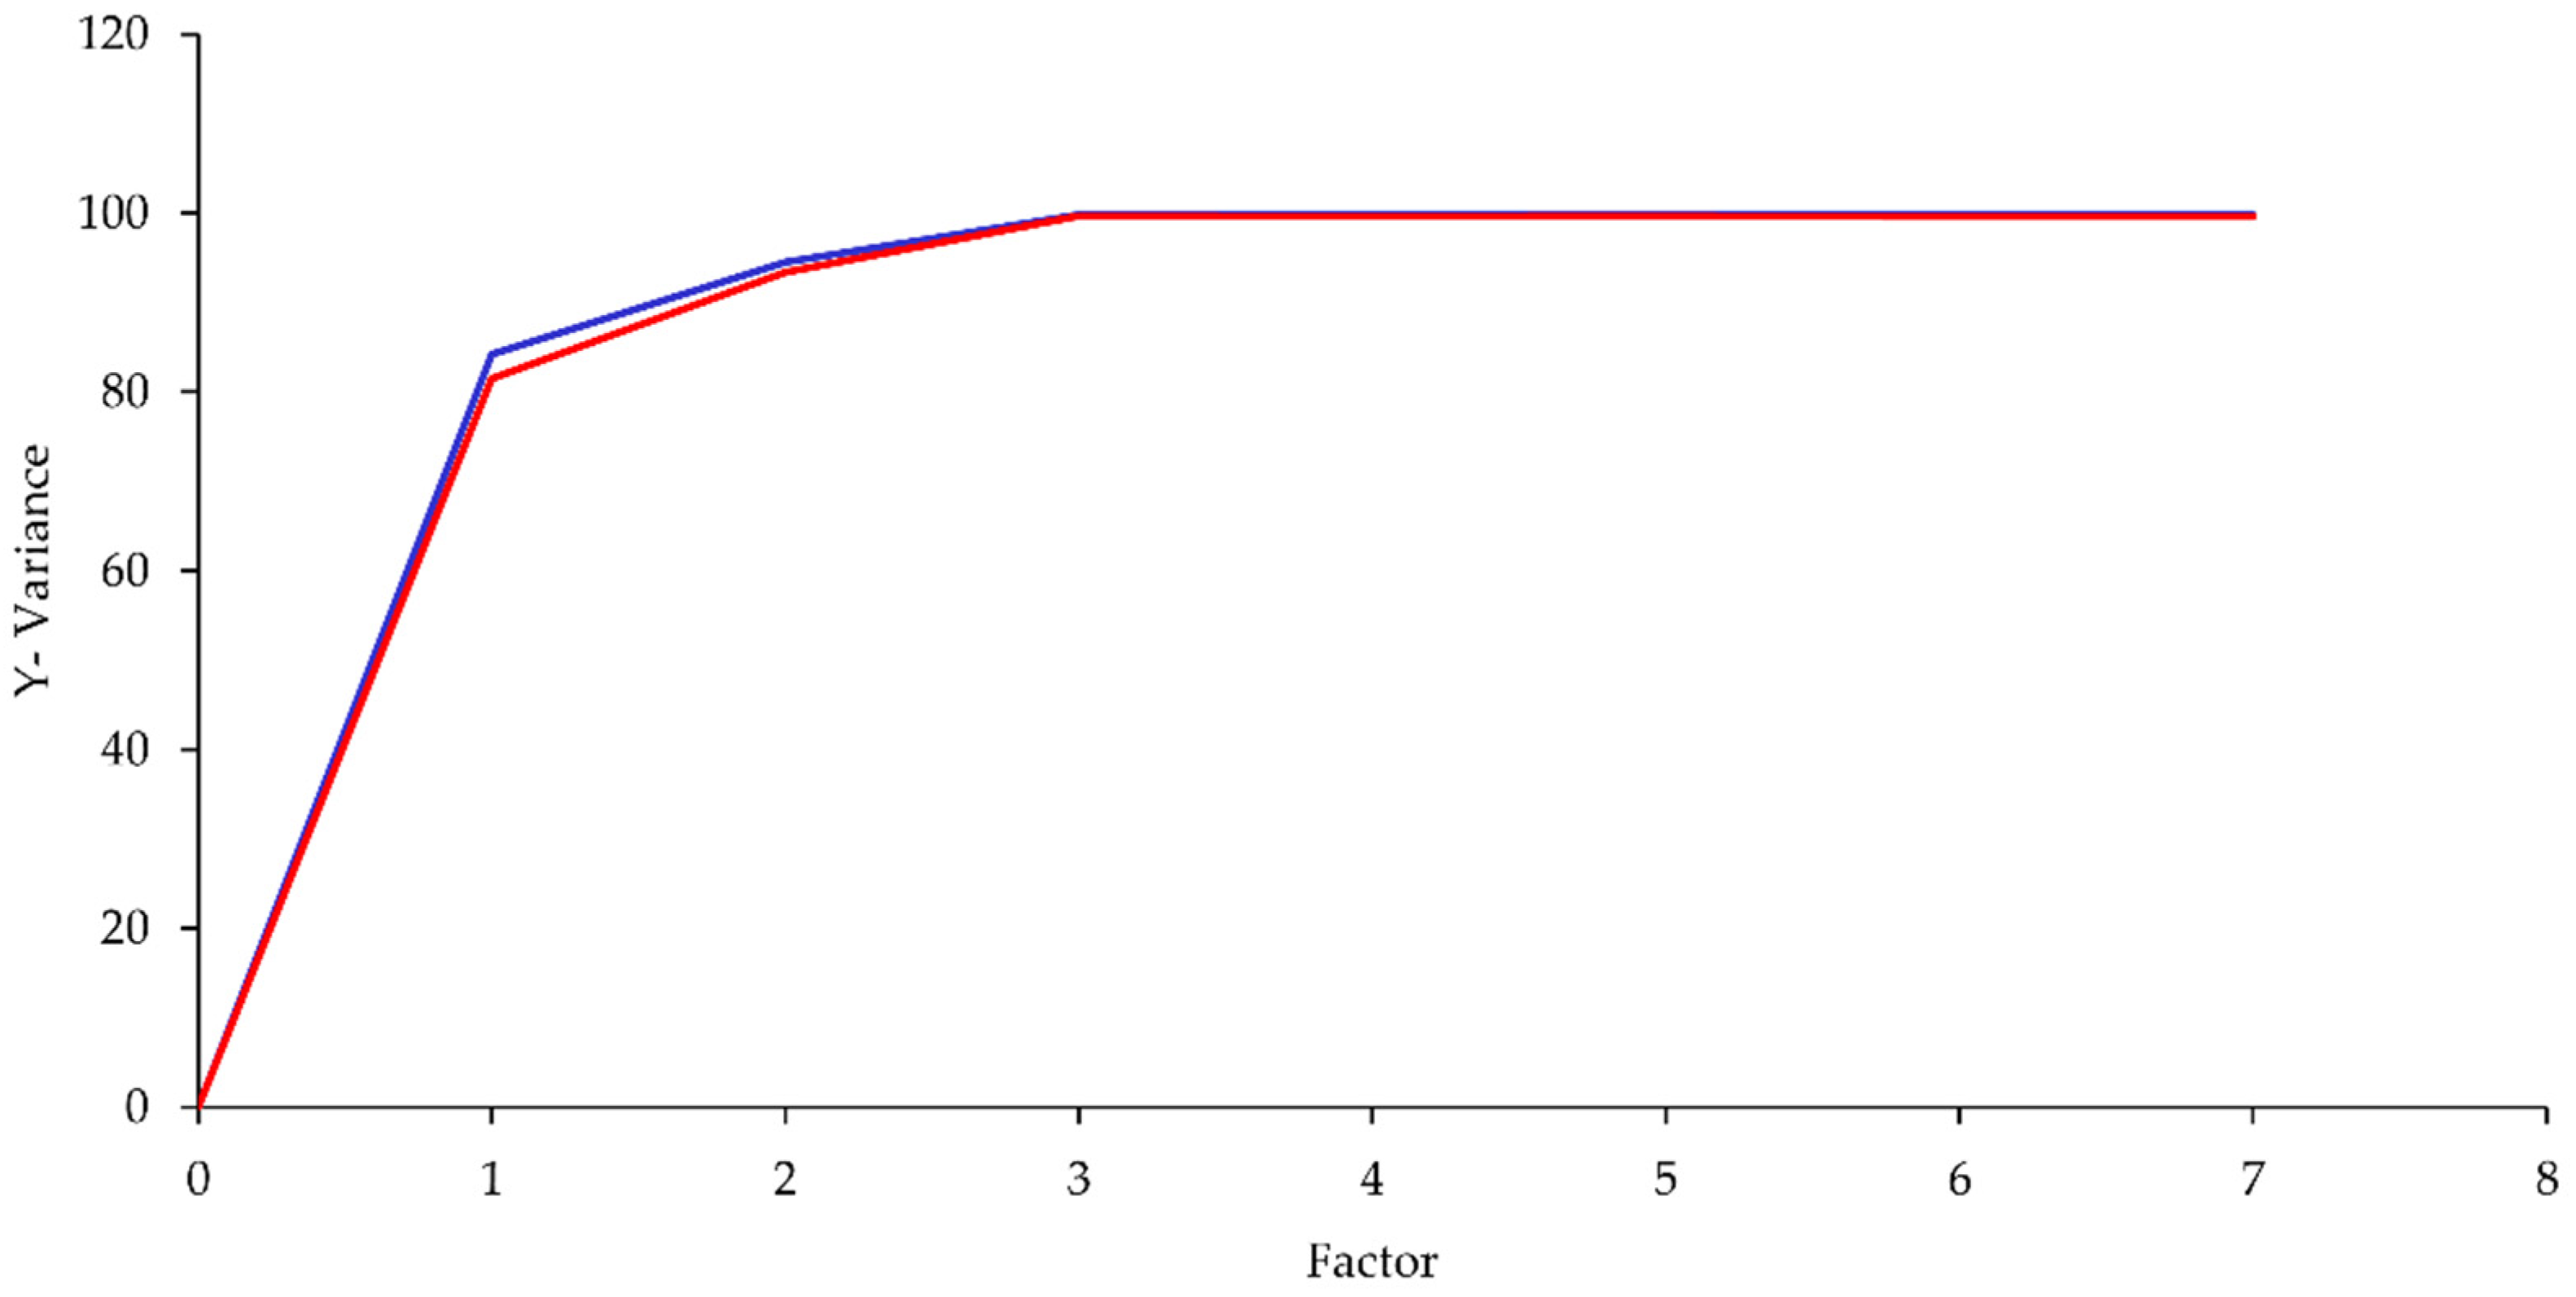
3.2.2. Selection of Principal Components and Variables
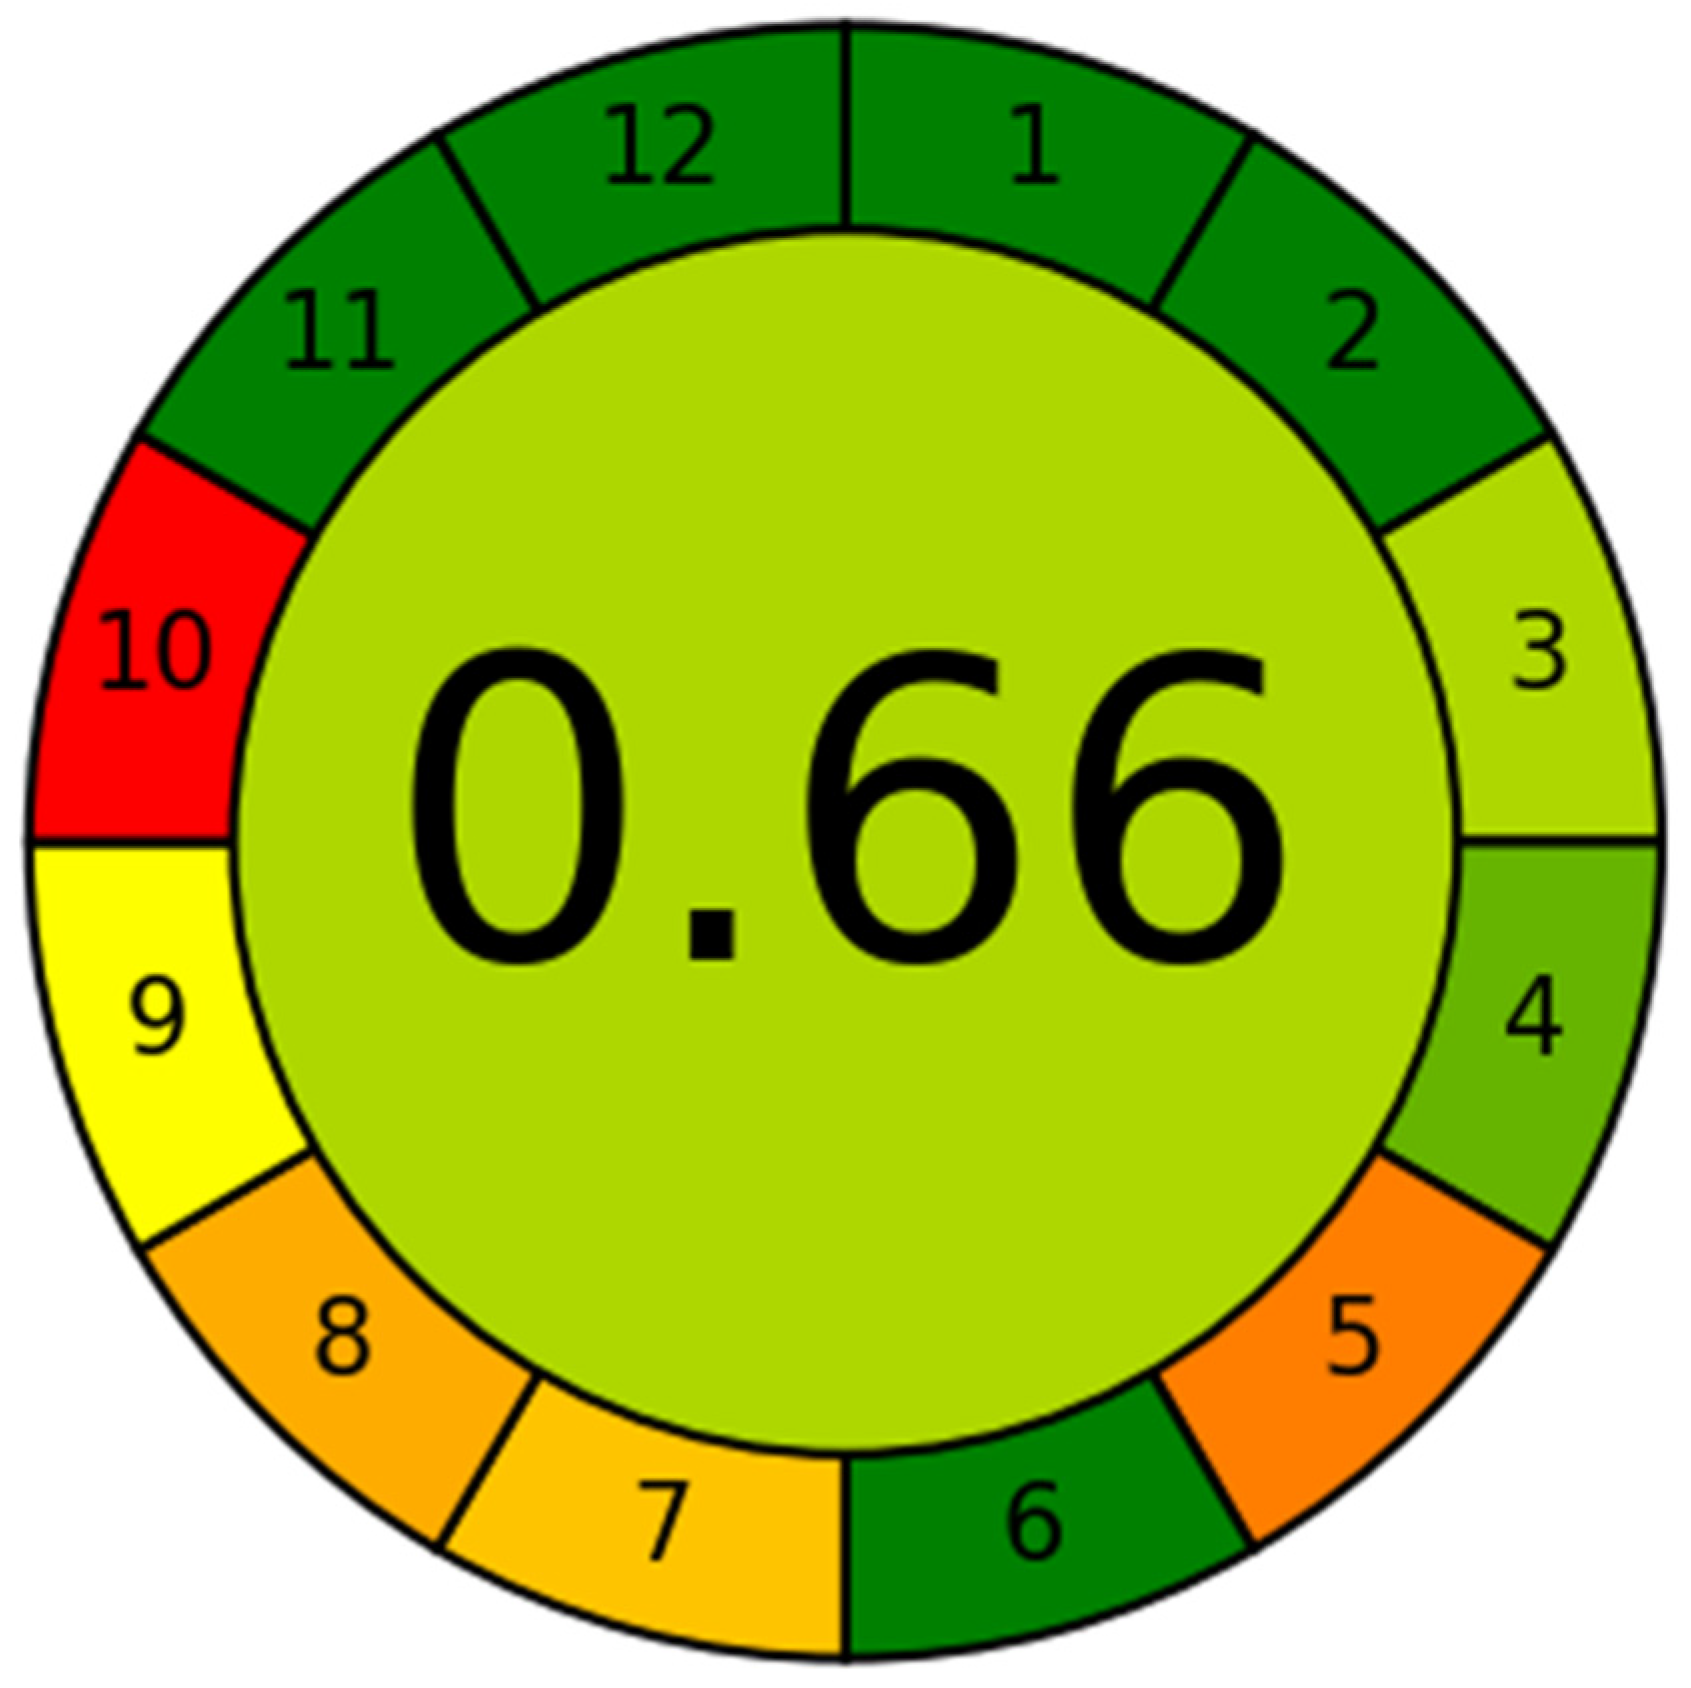
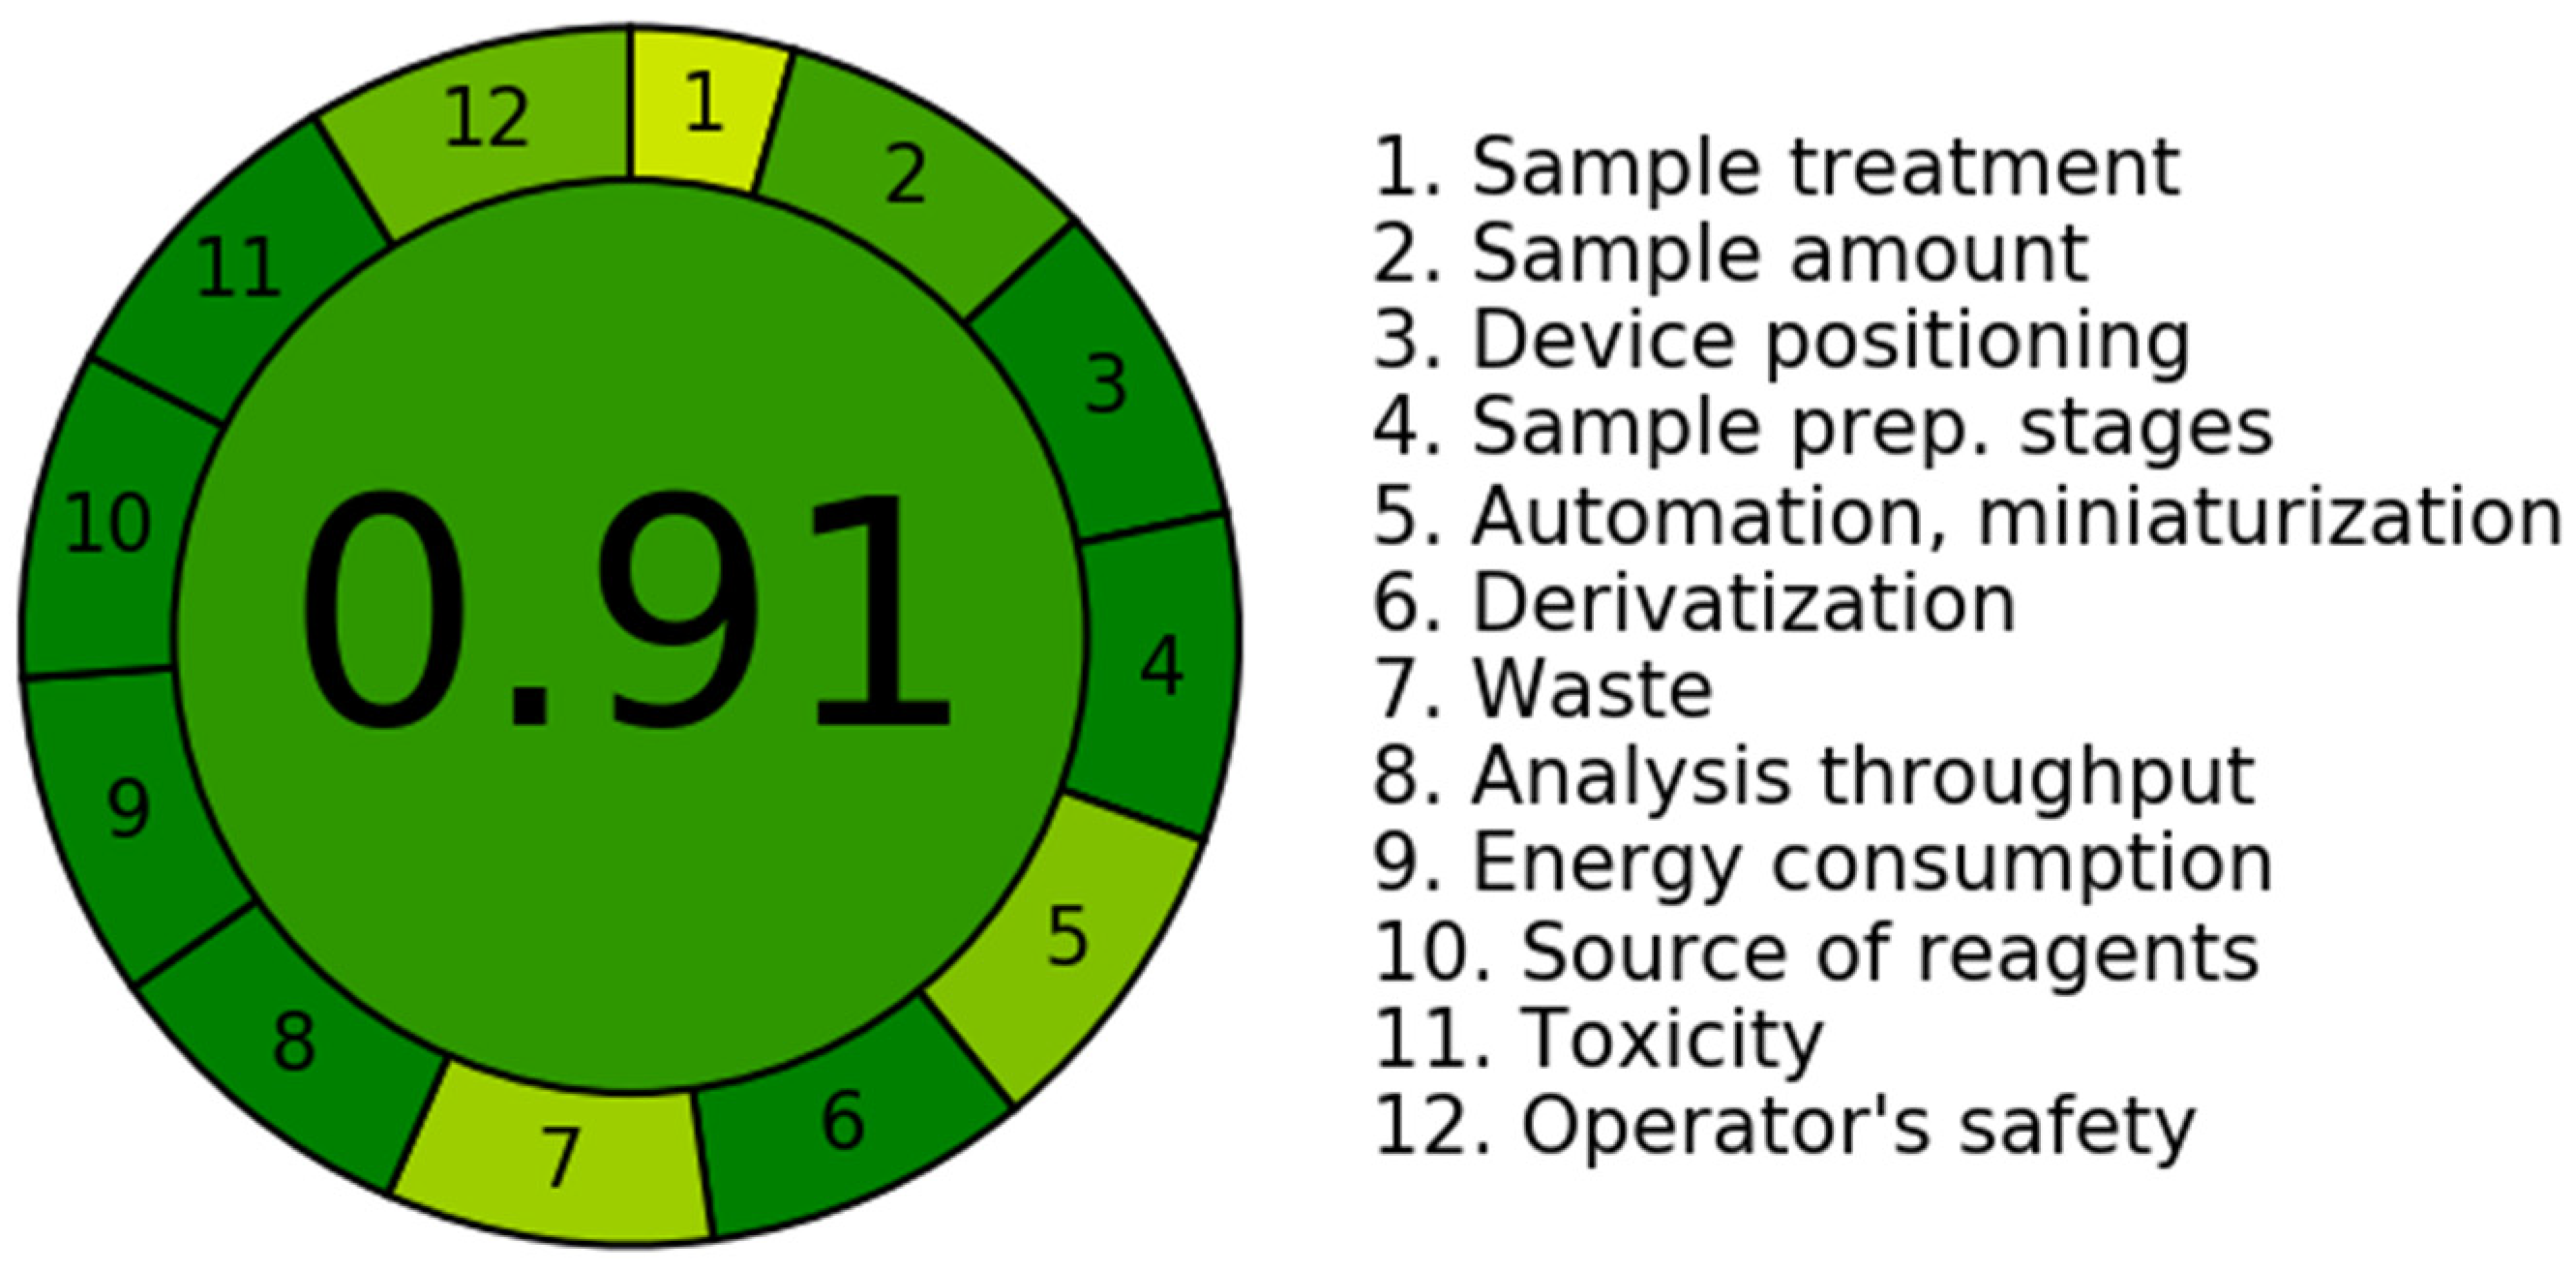
3.3. Assessment of Greenness of the Proposed Method
3.4. Application of the Developed Methods in Pharmaceutical Formulation
3.5. Statistical Comparison of the Developed Methods Using One-Way Analysis of Variance (ANOVA)
4. Conclusions
Author Contributions
Funding
Institutional Review Board statement
Informed Consent Statement
Data Availability Statement
Acknowledgments
Conflicts of Interest
References
- Williams, M. The Merck Index: An Encyclopedia of Chemicals, Drugs, and Biologicals. 14th Edition. Merck Inc., Whitehouse Station/Rahway, New Jersey, October 2006. Cloth 0-911910-00X. $125. Pp. 2564. Drug Dev. Res. 2006, 67, 870. [Google Scholar] [CrossRef]
- El-Gindy, A.; Emara, S.; Shaaban, H. Validation and Application of Chemometrics-Assisted Spectrophotometry and Liquid Chromatography for Simultaneous Determination of Two Ternary Mixtures Containing Drotaverine Hydrochloride. J. AOAC Int. 2010, 93, 536–548. [Google Scholar] [CrossRef] [PubMed] [Green Version]
- Ertokuş, G.P.; Yildiz, M. Chemometric Analysis of Paracetamol and Metaclopromide In Binary Drug Combinations. Int. J. Pharm. Sci. Res. 2018, 9, 1268–1273. [Google Scholar] [CrossRef]
- Rohman, A.; Dzulfianto, A.; Riswanto, F. The Employment of UV-Spectroscopy Combined with Multivariate Calibration for Analysis of Paracetamol, Propyphenazone and Caffeine. Indones. J. Pharm. 2017, 28, 191. [Google Scholar] [CrossRef]
- Glavanović, S.; Glavanović, M.; Tomišić, V. Simultaneous Quantitative Determination of Paracetamol and Tramadol in Tablet Formulation Using UV Spectrophotometry and Chemometric Methods. Spectrochim. Acta Part A Mol. Biomol. Spectrosc. 2016, 157, 258–264. [Google Scholar] [CrossRef] [PubMed]
- Carolin Nimila, I.; Balan, P.; Yaswanth Kumar, D.; Rajasekar, S. Simultaneous Estimation of Diacerein and Aceclofenac in Bulk and Pharmaceutical Dosage Form by UV Spectroscopy Method. Int. J. Pharm. Technol. Res. 2010, 2, 2313–2318. [Google Scholar]
- Ragupathy, V.; Arcot, S. Simultaneous Spectrophotometric Determination of Diacerein and Aceclofenac in Tablets By Chemometric Methods. Int. Res. J. Pharm. 2013, 4, 211–214. [Google Scholar] [CrossRef]
- Beckett, A.H.; Stenlake, J.B. Practical Pharmaceutical Chemistry, 4th ed.; CBS: London, UK, 1988. [Google Scholar]
- Kalyani, L.; Rao, C.V.N. Simultaneous Spectrophotometric Estimation of Salbutamol, Theophylline and Ambroxol Three Component Tablet Formulation Using Simultaneous Equation Methods. Karbala Int. J. Mod. Sci. 2018, 4, 171–179. [Google Scholar] [CrossRef]
- Héberger, K. Chemoinformatics-Multivariate Mathematical-Statistical Methods for Data Evaluation. In Medical Applications of Mass Spectrometry; Elsevier: Amsterdam, The Netherlands, 2008; pp. 141–169. [Google Scholar] [CrossRef]
- Tawakkol, S.M.; El-Zeiny, M.B.; Hemdan, A. Full Spectrum and Selected Spectrum Based Chemometric Methods for the Simultaneous Determination of Cinnarizine and Dimenhydrinate in Laboratory Prepared Mixtures and Pharmaceutical Dosage Form. Spectrochim. Acta Part A Mol. Biomol. Spectrosc. 2017, 173, 892–896. [Google Scholar] [CrossRef] [PubMed]
- Ghasemi, J.; Niazi, A. Simultaneous Determination of Cobalt and Nickel. Comparison of Prediction Ability of PCR and PLS Using Original, First and Second Derivative Spectra. Microchem. J. 2001, 68, 1–11. [Google Scholar] [CrossRef]
- Hadad, G.M.; El-Gindy, A.; Mahmoud, W.M.M. HPLC and Chemometrics-Assisted UV-Spectroscopy Methods for the Simultaneous Determination of Ambroxol and Doxycycline in Capsule. Spectrochim. Acta Part A Mol. Biomol. Spectrosc. 2008, 70, 655–663. [Google Scholar] [CrossRef]
- Wold, S.; Ruhe, A.; Wold, H.; Dunn Iii, W.J. The Collinearity Problem in Linear Regression. The Partial Least Squares (PLS) Approach to Generalized Inverses. SIAM J. Sci. Stat. Comput. 1984, 5, 735–743. [Google Scholar] [CrossRef] [Green Version]
- Sjöström, M.; Wold, S.; Lindberg, W.; Persson, J.Å.; Martens, H. A Multivariate Calibration Problem in Analytical Chemistry Solved by Partial Least-Squares Models in Latent Variables. Anal. Chim. Acta 1983, 150, 61–70. [Google Scholar] [CrossRef]
- Karstang, T.V.; Eastgate, R.J. Multivariate Calibration of an X-Ray Diffractometer by Partial Least Squares Regression. Chemom. Intell. Lab. Syst. 1987, 2, 209–219. [Google Scholar] [CrossRef]
- Esbensen, K.H.; Martens, H. Predicting Oil-Well Permeability and Porosity from Wire-Line Petrophysical Logs—A Feasibility Study Using Partial Least Squares Regression. Chemom. Intell. Lab. Syst. 1987, 2, 221–232. [Google Scholar] [CrossRef]
- Oliveri, A.J.; Faber, N.M. Uncertainity Estimation and Figure of Merit for Multivariate Calibration (IUPAC Technical Report). Int. Union Pure Appl. Chem. 2006, 78, 633–661. [Google Scholar] [CrossRef] [Green Version]
- Gałuszka, A.; Migaszewski, Z.M.; Konieczka, P.; Namieśnik, J. Analytical Eco-Scale for Assessing the Greenness of Analytical Procedures. In TrAC—Trends in Analytical Chemistry; Elsevier: Amsterdam, The Netherlands, 2012; pp. 61–72. [Google Scholar] [CrossRef]
- Pena-Pereira, F.; Wojnowski, W.; Tobiszewski, M. AGREE—Analytical GREEnness Metric Approach and Software. Anal. Chem. 2020, 92, 10076–10082. [Google Scholar] [CrossRef] [PubMed]
- ICH. Validation of Analytical Procedures: Text and Methodology Q2(R1) Current Step 4 Version. In Guideline on Validation of Analytical Procedures: Methodology Developed to Complement the Parent Guideline; International Council for Harmonisation of Technical Requirements for Pharmaceuticals for Human Use: Geneva, Switzerland, 2005; Volume Q2(R1). [Google Scholar]
- Brereton, R.G. Multilevel Multifactor Designs for MultivariateCalibration. Analyst 1997, 122, 1521–1529. [Google Scholar] [CrossRef]
- Valderrama, P.; Braga, J.W.B.; Poppi, R.J. Variable Selection, Outlier Detection, and Figures of Merit Estimation in a Partial Least-Squares Regression Multivariate Calibration Model. A Case Study for the Determination of Quality Parameters in the Alcohol Industry by near-Infrared Spectroscopy. J. Agric. Food Chem. 2007, 55, 8331–8338. [Google Scholar] [CrossRef] [PubMed]
- Haaland, D.M.; Thomas, E.V. Partial Least-Squares Methods for Spectral Analyses. 1. Relation to Other Quantitative Calibration Methods and the Extraction of Qualitative Information. Anal. Chem. 2002, 60, 1193–1202. [Google Scholar] [CrossRef]
- Camo. Workshop on Industrial Perspectives in Analytical Techniques & Training on Chemometrics Software; Camo: Bangalore, India, 2017. [Google Scholar]


| Standard Mixture | PAR | ACE | ES | |||
|---|---|---|---|---|---|---|
| Coding Level | Concentration (µg mL−1) | Coding Level | Concentration (µg mL−1) | Coding Level | Concentration (µg mL−1) | |
| Calibration Set | ||||||
| 1 | 0 | 15.00 | 0 | 4.61 | 0 | 3.46 |
| 2 | 0 | 15.00 | −2 | 3.69 | −2 | 2.76 |
| 3 | −2 | 12.00 | 2 | 3.69 | 2 | 4.15 |
| 4 | −2 | 12.00 | 2 | 5.53 | −1 | 3.11 |
| 5 | 2 | 18.00 | −1 | 4.15 | 2 | 4.15 |
| 6 | −1 | 13.50 | 2 | 5.53 | 0 | 3.46 |
| 7 | 2 | 18.00 | 0 | 4.61 | −1 | 3.11 |
| 8 | 0 | 15.00 | −1 | 4.15 | −1 | 3.11 |
| 9 | −1 | 13.50 | −1 | 4.15 | 1 | 3.80 |
| 10 | −1 | 13.50 | 1 | 5.07 | 2 | 4.15 |
| 11 | 1 | 16.50 | 2 | 5.53 | 1 | 3.80 |
| 12 | 2 | 18.00 | 1 | 5.07 | 0 | 3.46 |
| 13 | 1 | 16.50 | 0 | 4.61 | 2 | 4.15 |
| 14 | 0 | 15.00 | 2 | 5.53 | 2 | 4.15 |
| 15 | 2 | 18.00 | 2 | 5.53 | −2 | 2.76 |
| 16 | 2 | 18.00 | −2 | 3.69 | 1 | 3.80 |
| 17 | −2 | 12.00 | 1 | 5.07 | −2 | 2.76 |
| 18 | 1 | 16.50 | −2 | 3.69 | 0 | 3.46 |
| 19 | −2 | 12.00 | 0 | 4.61 | 1 | 3.80 |
| 20 | 0 | 15.00 | 1 | 5.07 | 1 | 3.80 |
| 21 | 1 | 16.50 | 1 | 5.07 | −1 | 0.05 |
| 22 | 1 | 16.50 | −1 | 4.15 | −2 | 2.76 |
| 23 | −1 | 13.50 | −2 | 3.69 | −1 | 3.11 |
| 24 | −2 | 12.00 | −1 | 4.15 | 0 | 3.46 |
| 25 | −1 | 13.50 | 0 | 4.61 | −2 | 2.76 |
| Prediction Set | ||||||
| 26 | 0 | 15.00 | 0 | 4.61 | 0 | 3.46 |
| 27 | −1 | 13.50 | 1 | 5.07 | 1 | 3.80 |
| 28 | 1 | 16.50 | 1 | 5.07 | 0 | 3.46 |
| 29 | 1 | 16.50 | 0 | 4.61 | 1 | 3.80 |
| 30 | 0 | 15.00 | 1 | 5.07 | −1 | 3.11 |
| 31 | 1 | 16.50 | −1 | 4.15 | −1 | 3.11 |
| 32 | −1 | 13.50 | −1 | 4.15 | 0 | 3.46 |
| 33 | −1 | 13.50 | 0 | 4.61 | −1 | 3.11 |
| 34 | 0 | 15.00 | −1 | 4.15 | 1 | 3.80 |
| Description | Observations | ||
|---|---|---|---|
| PAR | ACE | ES | |
| Detection wavelength (nm) | 243 | 272 | 262 |
| Solution stability standard, (% RSD) | 0.37 | 0.47 | 0.55 |
| Solution stability formulation, (% RSD) | 0.92 | 0.82 | 1.41 |
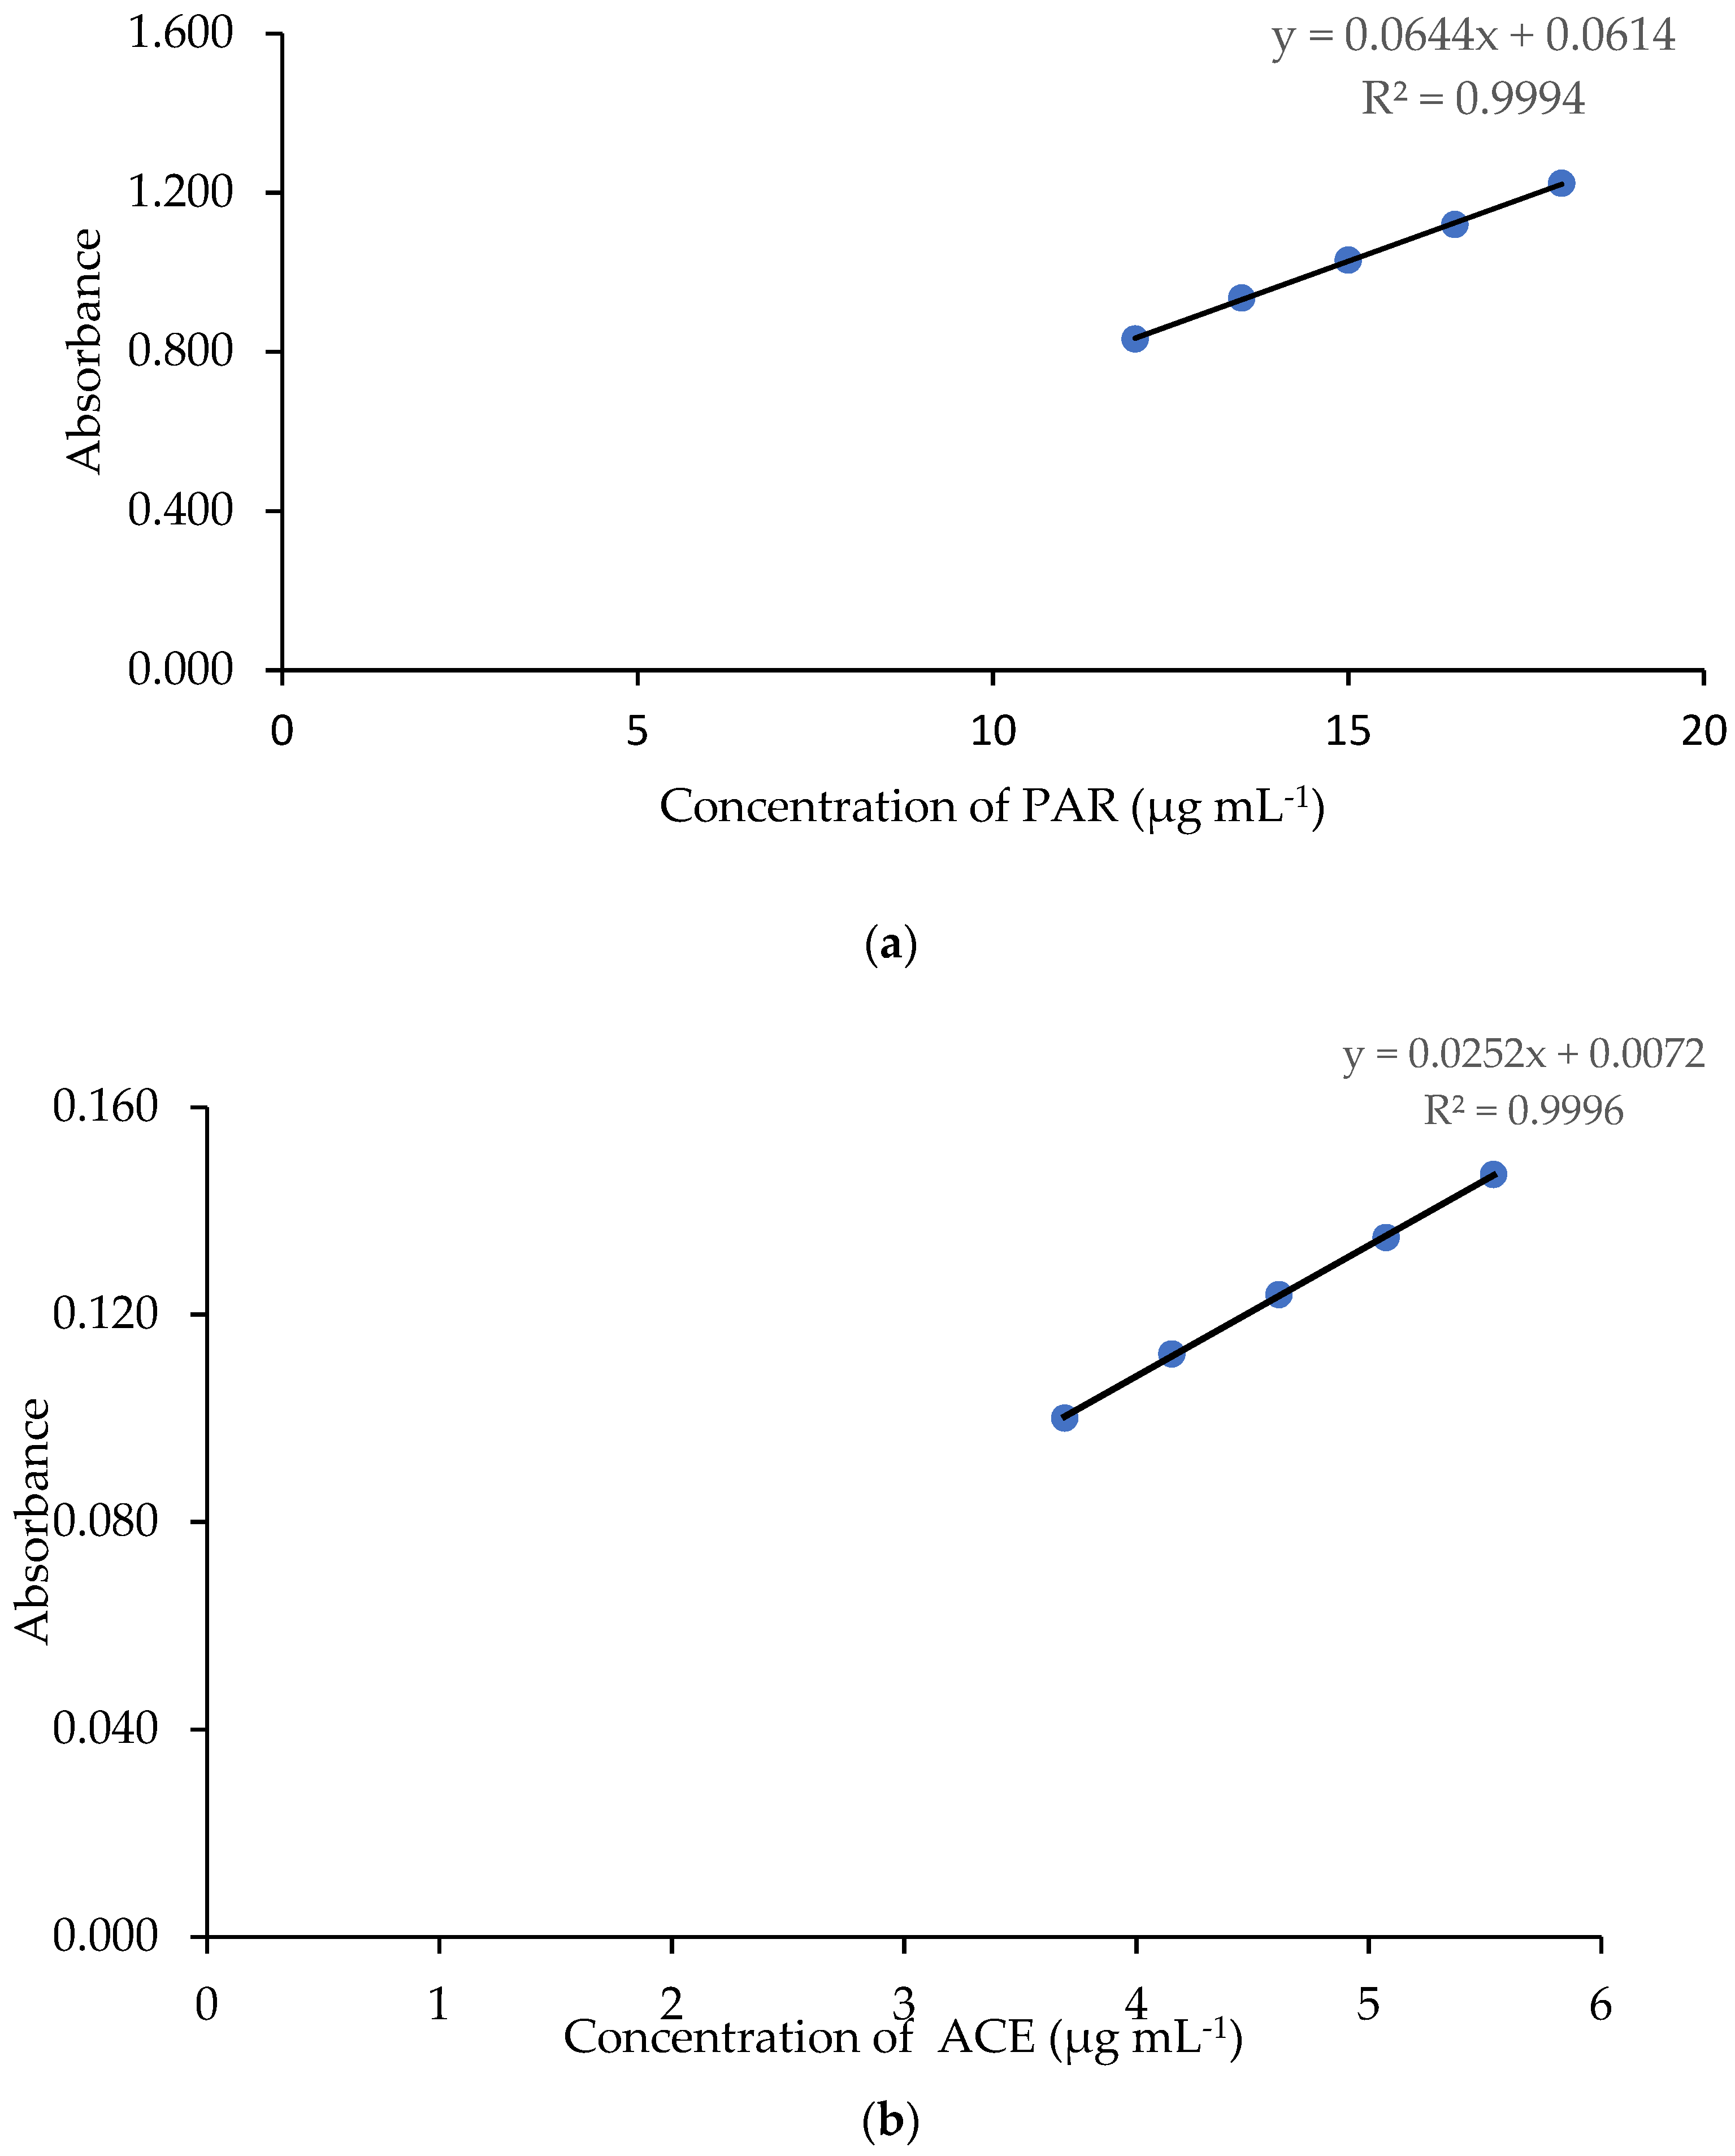
| Linearity a (µg mL−1) | 12–18 | 3.69–5.53 | 2.76–4.15 |
| LOD (µg mL−1) | 0.48 | 0.20 | 0.13 |
| LOQ (µg mL−1) | 1.44 | 0.61 | 0.38 |
| Slope | 0.0644 | 0.0252 | 0.0287 |
| Standard deviation of the slope | 0.0006 | 0.0003 | 0.0003 |
| Confidence limit of the slope 95% | 0.0005 | 0.0003 | 0.0003 |
| Intercept | 0.0614 | 0.0072 | 0.0062 |
| Standard deviation of the Intercept | 0.0093 | 0.0015 | 0.0011 |
| Confidence limit of the Intercept | 0.0081 | 0.0013 | 0.0010 |
| Regression coefficient (r2) | 0.9994 | 0.9996 | 0.9995 |
| System precision b, (% RSD) | 0.39 | 1.00 | 0.71 |
| Confidence limit for System precision | 0.0032 | 0.0010 | 0.0006 |
| Intraday precision b, (% RSD) | 0.32 | 0.31 | 0.15 |
| Confidence limit for Intraday precision | 0.2520 | 0.2436 | 0.1158 |
| Interday precision c, (% RSD) | 0.23 | 0.3476 | 0.35 |
| Confidence limit for Interday precision | 0.2252 | 0.1740 | 0.1834 |
| Accuracy d, % w/w | 98.25–100.43 | 98.16–100.33 | 99.23–100.07 |
| Confidence limit for accuracy | 0.5263 | 0.4050 | 0.1703 |
| Standard Mixture | PAR | ACE | ES | |||||||||
|---|---|---|---|---|---|---|---|---|---|---|---|---|
| PCR | PLS | PCR | PLS | PCR | PLS | |||||||
| Amount Found (µg mL−1) | % R | Amount Found (µg mL−1) | % R | Amount Found (µg mL−1) | % R | Amount Found (µg mL−1) | % R | Amount Found (µg mL−1) | % R | Amount Found (µg mL−1) | % R | |
| 1 | 15.01 | 100.07 | 15.01 | 100.07 | 4.61 | 100.05 | 4.61 | 100.05 | 3.46 | 100.01 | 3.46 | 100.01 |
| 2 | 15.09 | 100.57 | 15.08 | 100.53 | 3.72 | 100.77 | 3.72 | 100.72 | 2.78 | 100.68 | 2.78 | 100.64 |
| 3 | 11.89 | 99.09 | 11.89 | 99.12 | 3.65 | 98.99 | 3.65 | 99.04 | 4.13 | 99.52 | 4.13 | 99.55 |
| 4 | 12.00 | 99.98 | 12.00 | 100.02 | 5.53 | 100.01 | 5.53 | 100.04 | 3.10 | 99.81 | 3.11 | 99.86 |
| 5 | 17.76 | 98.69 | 17.76 | 98.69 | 4.09 | 98.54 | 4.09 | 98.54 | 4.10 | 98.68 | 4.10 | 98.68 |
| 6 | 13.49 | 99.92 | 13.49 | 99.90 | 5.53 | 99.92 | 5.53 | 99.91 | 3.45 | 99.79 | 3.45 | 99.78 |
| 7 | 18.09 | 100.48 | 18.09 | 100.48 | 4.64 | 100.56 | 4.64 | 100.56 | 3.12 | 100.48 | 3.12 | 100.48 |
| 8 | 15.04 | 100.29 | 15.04 | 100.29 | 4.16 | 100.33 | 4.16 | 100.33 | 3.12 | 100.27 | 3.12 | 100.27 |
| 9 | 13.46 | 99.74 | 13.46 | 99.72 | 4.14 | 99.69 | 4.14 | 99.68 | 3.79 | 99.82 | 3.79 | 99.80 |
| 10 | 13.60 | 100.76 | 13.58 | 100.62 | 5.11 | 100.75 | 5.10 | 100.64 | 4.18 | 100.80 | 4.18 | 100.73 |
| 11 | 16.50 | 99.99 | 16.50 | 99.99 | 5.53 | 99.93 | 5.53 | 99.93 | 3.79 | 99.84 | 3.79 | 99.84 |
| 12 | 18.05 | 100.29 | 18.05 | 100.29 | 5.08 | 100.27 | 5.08 | 100.26 | 3.47 | 100.18 | 3.47 | 100.18 |
| 13 | 16.47 | 99.80 | 16.47 | 99.81 | 4.59 | 99.67 | 4.60 | 99.68 | 4.14 | 99.78 | 4.14 | 99.80 |
| 14 | 14.94 | 99.61 | 14.94 | 99.61 | 5.51 | 99.59 | 5.51 | 99.59 | 4.13 | 99.58 | 4.13 | 99.58 |
| 15 | 17.64 | 98.01 | 17.65 | 98.06 | 5.42 | 98.02 | 5.42 | 98.08 | 2.70 | 97.98 | 2.71 | 98.09 |
| 16 | 18.03 | 100.19 | 18.03 | 100.15 | 3.70 | 100.18 | 3.69 | 100.11 | 3.81 | 100.21 | 3.81 | 100.16 |
| 17 | 12.04 | 100.32 | 12.04 | 100.31 | 5.08 | 100.30 | 5.08 | 100.29 | 2.76 | 100.16 | 2.76 | 100.16 |
| 18 | 16.54 | 100.21 | 16.54 | 100.22 | 3.70 | 100.25 | 3.70 | 100.26 | 3.47 | 100.25 | 3.47 | 100.25 |
| 19 | 11.94 | 99.49 | 11.97 | 99.75 | 4.59 | 99.56 | 4.60 | 99.76 | 3.79 | 99.64 | 3.79 | 99.76 |
| 20 | 15.31 | 102.06 | 15.31 | 102.06 | 5.17 | 102.01 | 5.17 | 102.01 | 3.88 | 101.99 | 3.88 | 101.99 |
| 21 | 16.56 | 100.37 | 16.56 | 100.37 | 5.09 | 100.36 | 5.09 | 100.36 | 3.12 | 100.28 | 3.12 | 100.28 |
| 22 | 16.60 | 100.62 | 16.60 | 100.61 | 4.18 | 100.79 | 4.18 | 100.78 | 2.78 | 100.73 | 2.78 | 100.72 |
| 23 | 13.52 | 100.18 | 13.53 | 100.20 | 3.70 | 100.22 | 3.70 | 100.26 | 3.12 | 100.21 | 3.12 | 100.23 |
| 24 | 11.97 | 99.77 | 11.97 | 99.77 | 4.14 | 99.79 | 4.14 | 99.79 | 3.45 | 99.85 | 3.45 | 99.85 |
| 25 | 13.37 | 99.01 | 13.37 | 99.02 | 4.57 | 99.03 | 4.57 | 99.04 | 2.73 | 98.95 | 2.73 | 98.96 |
| Standard Mixture | PAR | ACE | ES | |||||||||
|---|---|---|---|---|---|---|---|---|---|---|---|---|
| PCR | PLS | PCR | PLS | PCR | PLS | |||||||
| Amount Found (µg mL−1) | % R | Amount Found (µg mL−1) | % R | Amount Found (µg mL−1) | % R | Amount Found (µg mL−1) | % R | Amount Found (µg mL−1) | % R | Amount Found (µg mL−1) | % R | |
| 1 | 15.01 | 100.07 | 15.01 | 100.07 | 4.61 | 100.05 | 4.61 | 100.05 | 3.46 | 100.01 | 3.46 | 100.01 |
| 2 | 13.46 | 99.74 | 13.46 | 99.74 | 5.06 | 99.74 | 5.06 | 99.74 | 3.79 | 99.74 | 3.79 | 99.74 |
| 3 | 16.45 | 99.67 | 16.45 | 99.67 | 5.05 | 99.64 | 5.05 | 99.64 | 3.45 | 99.57 | 3.45 | 99.57 |
| 4 | 16.50 | 100.01 | 16.50 | 100.01 | 4.61 | 99.94 | 4.61 | 99.94 | 3.80 | 99.95 | 3.80 | 99.95 |
| 5 | 15.04 | 100.25 | 15.04 | 100.25 | 5.08 | 100.23 | 5.08 | 100.23 | 3.11 | 100.14 | 3.11 | 100.14 |
| 6 | 16.58 | 100.50 | 16.58 | 100.50 | 4.17 | 100.57 | 4.17 | 100.57 | 3.13 | 100.50 | 3.13 | 100.50 |
| 7 | 13.49 | 99.95 | 13.49 | 99.95 | 4.15 | 99.94 | 4.15 | 99.94 | 3.46 | 99.96 | 3.46 | 99.96 |
| 8 | 13.52 | 100.15 | 13.52 | 100.15 | 4.62 | 100.15 | 4.62 | 100.15 | 3.11 | 100.09 | 3.11 | 100.09 |
| 9 | 14.93 | 99.56 | 14.93 | 99.56 | 4.13 | 99.49 | 4.13 | 99.49 | 3.78 | 99.57 | 3.78 | 99.57 |
| Statistical Parameters | PCR | PLS | ||||
|---|---|---|---|---|---|---|
| PAR | ACE | ES | PAR | ACE | ES | |
| Concentration range (µg mL−1) | 12–18 | 3.69–5.53 | 2.76–4.15 | 12–18 | 3.69–5.53 | 2.76–4.15 |
| No. of factors | 3 | 3 | 3 | 3 | 3 | 3 |
| R2 | 0.9978 | 0.9977 | 0.9981 | 0.9978 | 0.9977 | 0.9981 |
| RMSEC | 0.0976 | 0.0306 | 0.0210 | 0.0976 | 0.0306 | 0.0210 |
| RMSECV | 0.1188 | 0.0370 | 0.0249 | 0.1214 | 0.0379 | 0.0255 |
| RMSEP | 0.0439 | 0.0137 | 0.0098 | 0.0976 | 0.09770 | 0.0210 |
| PRESS | 0.3686 | 0.0361 | 0.0163 | 0.3530 | 0.0344 | 0.0156 |
| Slope | 0.9978 | 0.9977 | 0.9981 | 0.9978 | 0.9977 | 0.9981 |
| Intercept | 0.0318 | 0.0102 | 0.0063 | 0.0317 | 0.0102 | 0.0210 |
| Calibration set Mean ± SD | 99.98 ± 0.77 | 99.98 ± 0.80 | 99.93 ± 0.76 | 99.99 ± 0.75 | 99.99 ± 0.78 | 99.89 ± 0.74 |
| Validation set Mean ± SD | 99.99 ± 0.30 | 99.97 ± 0.33 | 99.98 ± 0.77 | 99.99 ± 0.32 | 99.97 ± 0.33 | 99.95 ± 0.30 |
| Assay Mean ± SD | 99.85 ± 0.10 | 99.83 ± 0.10 | 99.98 ± 0.77 | 99.96 ± 0.10 | 99.83 ± 0.10 | 99.79 ± 0.18 |
| Parameters | PCR | PLS | ||||
|---|---|---|---|---|---|---|
| PAR | ACE | ES | PAR | ACE | ES | |
| Sensitivity (mL µg−1) | 1.0022 | 1.0023 | 1.0019 | 1.0022 | 1.0023 | 1.0019 |
| Analytical sensitivity γ−1 (µg mL−1) | 5.9337 | 5.5011 | 5.7088 | 5.9337 | 5.5011 | 5.7088 |
| LOD (µg mL−1) | 0.56 | 0.60 | 0.58 | 0.56 | 0.60 | 0.58 |
| LOQ (µg mL−1) | 1.69 | 1.82 | 1.75 | 1.69 | 1.82 | 1.75 |
| Description | Penalty Points | Total Penalty Points | Score |
|---|---|---|---|
| Phosphate buffer | 1 | 4 | 96 |
| Instrument | 0 | ||
| Occupational hazard | 0 | ||
| Waste | 3 |
| Drug | Description | Simultaneous Equation Method | Chemometrics Method | |
|---|---|---|---|---|
| PCR | PLS | |||
| PAR | Label Claim (mg) | 325 | 325 | 325 |
| Cx | 14.97 | 14.96 | 14.98 | |
| Amount found(mg) | 324.46 | 324.41 | 324.52 | |
| % Label Claim | 99.83 | 99.82 | 99.85 | |
| ACE | Label Claim (mg) | 100 | 100 | 100 |
| Cy | 4.59 | 4.58 | 4.59 | |
| Amount found(mg) | 99.66 | 99.42 | 99.69 | |
| % Label Claim | 99.66 | 99.42 | 99.69 | |
| ES | Label Claim (mg) | 75 | 75 | 75 |
| Cz | 3.43 | 3.43 | 3.45 | |
| Amount found(mg) | 74.32 | 74.40 | 74.78 | |
| % Label Claim | 99.09 | 99.20 | 99.71 | |
| Statistical Term | PAR | ACE | ES | ||||||
|---|---|---|---|---|---|---|---|---|---|
| Simultaneous Equation Method | Chemometrics Method | Simultaneous Equation Method | Chemometrics Method | Simultaneous Equation Method | Chemometrics Method | ||||
| PCR | PLS | PCR | PLS | PCR | PLS | ||||
| Mean | 99.83 | 99.82 | 99.85 | 99.66 | 99.42 | 99.69 | 99.09 | 99.20 | 99.71 |
| Mean ± S.D | 0.04 | 0.06 | 0.12 | 0.13 | 0.12 | 0.12 | 0.38 | 0.21 | 0.16 |
| n | 3 | 3 | 3 | 3 | 3 | 3 | 3 | 3 | 3 |
| F ratio | 0.13 | 4.31 | 4.58 | ||||||
| Theoretical F values at (p = 0.05) | 5.14 | 5.14 | 5.14 | ||||||
Publisher’s Note: MDPI stays neutral with regard to jurisdictional claims in published maps and institutional affiliations. |
© 2021 by the authors. Licensee MDPI, Basel, Switzerland. This article is an open access article distributed under the terms and conditions of the Creative Commons Attribution (CC BY) license (https://creativecommons.org/licenses/by/4.0/).
Share and Cite
Rathinam, S.; Karunanidhi Santhana, L. Ecofriendly Simple UV Spectrophotometric and Chemometric Methods for Simultaneous Estimation of Paracetamol Aceclofenac and Eperisone Hydrochloride in Pharmaceutical Formulation: Assessment of Greenness Profile. Processes 2021, 9, 1272. https://0-doi-org.brum.beds.ac.uk/10.3390/pr9081272
Rathinam S, Karunanidhi Santhana L. Ecofriendly Simple UV Spectrophotometric and Chemometric Methods for Simultaneous Estimation of Paracetamol Aceclofenac and Eperisone Hydrochloride in Pharmaceutical Formulation: Assessment of Greenness Profile. Processes. 2021; 9(8):1272. https://0-doi-org.brum.beds.ac.uk/10.3390/pr9081272
Chicago/Turabian StyleRathinam, Seetharaman, and Lakshmi Karunanidhi Santhana. 2021. "Ecofriendly Simple UV Spectrophotometric and Chemometric Methods for Simultaneous Estimation of Paracetamol Aceclofenac and Eperisone Hydrochloride in Pharmaceutical Formulation: Assessment of Greenness Profile" Processes 9, no. 8: 1272. https://0-doi-org.brum.beds.ac.uk/10.3390/pr9081272