1. Introduction
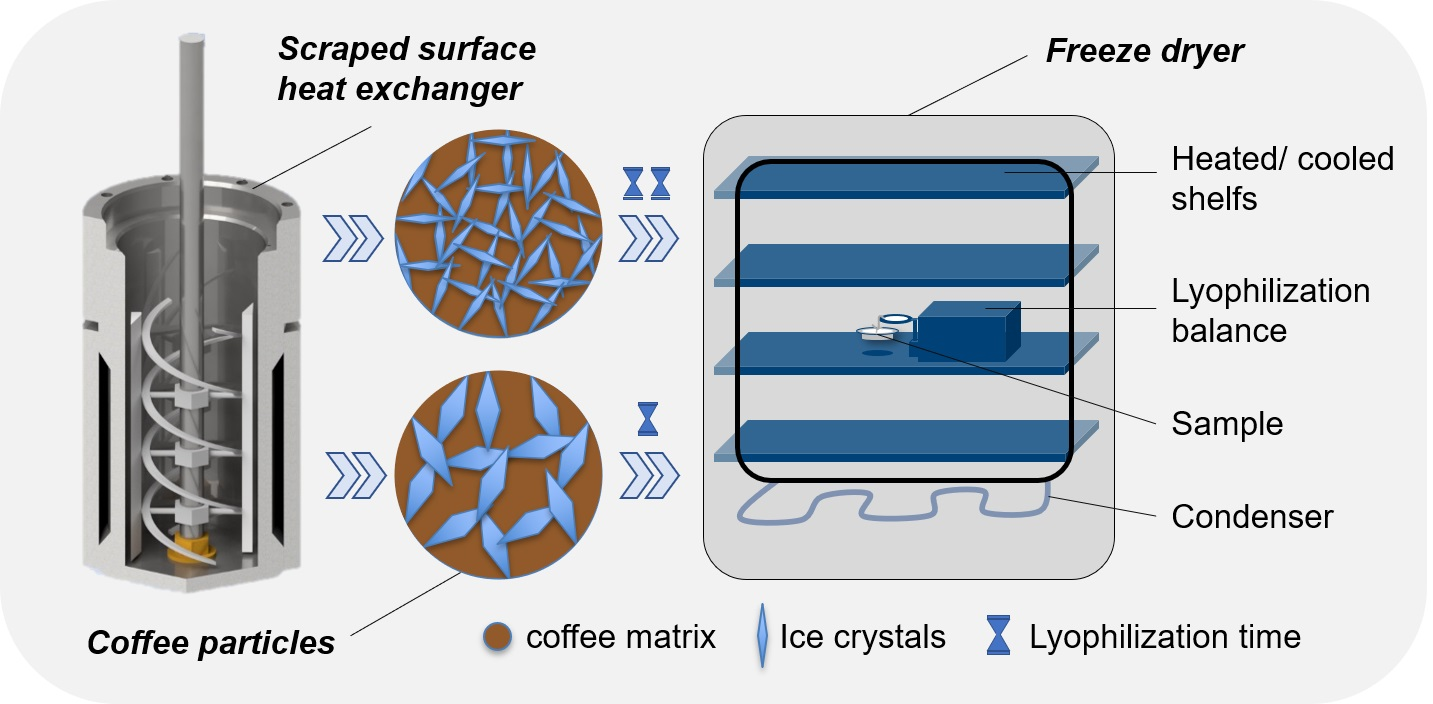
Freeze-drying in general is dependent on process variables like chamber pressure and product temperature, but these parameters are limited by product properties. The drying time is in most cases limited by heat and mass transfer within the product. In addition to chemical composition, the physical properties of the product are important where structure and other properties like the glass transition temperature and therefore the corresponding collapse temperature of the product are the main drivers. When chemical composition can hardly be changed to positively influence glass transition (e.g., for pure soluble coffee), the elevating screw for faster drying is based on physical parameters. Here, the internal structure and morphology of the product and the reached amount of cryo-concentration during the freezing step are critical drivers. Especially size and number of interconnecting pores drive the drying kinetics of single particles and when optimized, can help to reduce the overall drying times. Primary drying is improved by a good interconnection between the pores and increased mean ice crystal size. Secondary drying is furthermore influenced by the pore surface area, which can be enhanced by creating small ice crystals, so usually, a compromise has to be found [
1,
2,
3]. The basis to control the structure of a bulk product before freeze-drying is during the freezing process of the material, which can be split into two process steps: (a) supercooling, nucleation of crystals and crystal growth in a scraped surface heat exchanger (initial freezing) and (b) the hardening or final freezing in an air blast freezer as also known for other products like ice cream manufacturing [
4,
5]. In the scraped surface heat exchangers nucleation of ice crystals only occurs at the wall where the necessary supercooling is achieved. In general, the size and shape of the crystals depend on the cooling rate [
6] where the concentration of the solution, the refrigeration temperature (which is driving the cooling rate) and the scraping speed determine the size of the dendrites formed at the wall [
1,
7,
8,
9]. These dendritic ice crystals are crushed by the blades and transported from the wall into the solution where recrystallization takes place to minimize the free energy, the so-called Kelvin effect, where the form of the ice crystals is changing to a disc-shaped hexagonal form [
6,
7,
10]. Several mechanisms are known and increase the ice crystal size further. Before or during the hardening step, controlled temperature cycles can be used to trigger recrystallization and to further grow ice crystals [
1,
2,
11].
Even after the hardening step, parts of the water will stay unfrozen, which is typical in food-freezing processes, since the concentrated solution undergoes glass transition before being fully concentrated. The critical concentration C
g′, which is reached at maximum ice concentration, is dependent on the composition of the food matrix. For most of the monomeric and dimeric sugars, C
g′ was reported between 79 and 83% [
12], where C
g′ of instant coffee is in the range of 85% total solids content [
13]. Since these values are valid in equilibrium under very slow freezing conditions, they are usually never reached in industrial processes. Nevertheless, high matrix concentration is beneficial for faster drying time since water acts as a strong plasticizer decreasing glass transition temperature dramatically with an increasing water content of about 5 °C per percent of additional water content [
14]. For coffee, glass transition and sticking behavior were already analyzed confirming the high impact of water [
15,
16].
Attempts have been done to describe the evolution of the crystal size in ice cream by measuring chord length distribution of the crystals by focused beam reflectance measurement (FBRM), assuming a spherical shape of particles [
4,
10]. Promising results of indirect measurements of the crystal size of unidirectional frozen coffee extracts were shown by Pardo et al. [
17]. In this study, a very conservative freeze-drying profile was used to avoid collapse, assuming the size of the pores after freeze-drying to have the same size as the initial ice crystals. The influence of the ice crystal size on freeze-drying kinetics was not investigated.
So far, ice crystal formation in scraped surface heat exchangers was studied on model substances such as sugar solutions [
4,
18]. Ice formation in complex media was also studied with SSHE, e.g., for Sorbet and ice cream [
10,
11,
18,
19] and without SSHE for instant coffee directly in the freeze dryer [
17,
20]. The trends of how drying kinetics influence the drying time were investigated [
1,
2,
21], but the creation of ice crystal structures in complex media like coffee in an SSHE and the impact of that structure on drying kinetics were not intensively investigated so far. More data are needed to understand the complex interactions.
Optimization of the processes needs to be done to reduce the CO2 footprint of this expensive and energy-intensive technology. Therefore, a design of experiment study using the response surface design was set up to give more detailed information on how the structure of concentrated coffee liquor is influenced during freezing in a scraped surface heat exchanger (SSHE) and how this structure can be optimized to improve the drying kinetics.
2. Materials and Methods
2.1. Process Overview and Sample Preparation
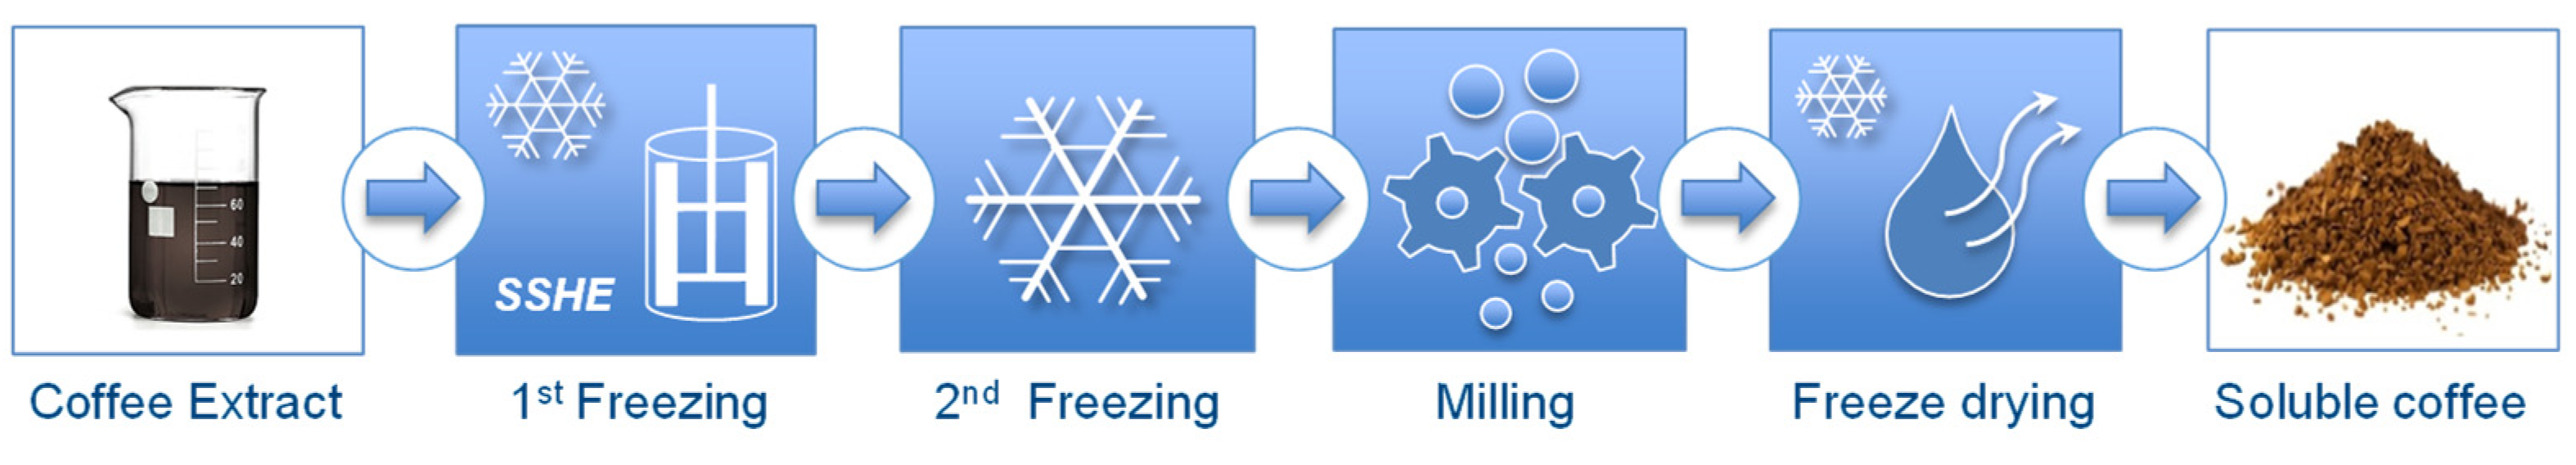
In
Figure 1 the process for the production of soluble coffee from the concentrated coffee extract to the final dried powder is shown. The coffee extract is getting structured by a first freezing step in a scraped surface heat exchanger, where ice nuclei of a certain size are generated. In the next step, the slurry gets hardened in a freezer by airblast freezing and is milled and sieved to a certain size class. In al last step the frozen granules are freeze-dried.
The coffee extract, which is used for the experiments, is derived from reconstituted spray-dried soluble coffee provided by Nestlé. Coffee solutions of 30% w/w were prepared at 40 °C and stirred for 1 h. After reconstitution, samples were degassed for 30 min in an ultrasound bath and cooled down in the SSHE to 0 °C before the experiment.
2.2. Setup of Equipment
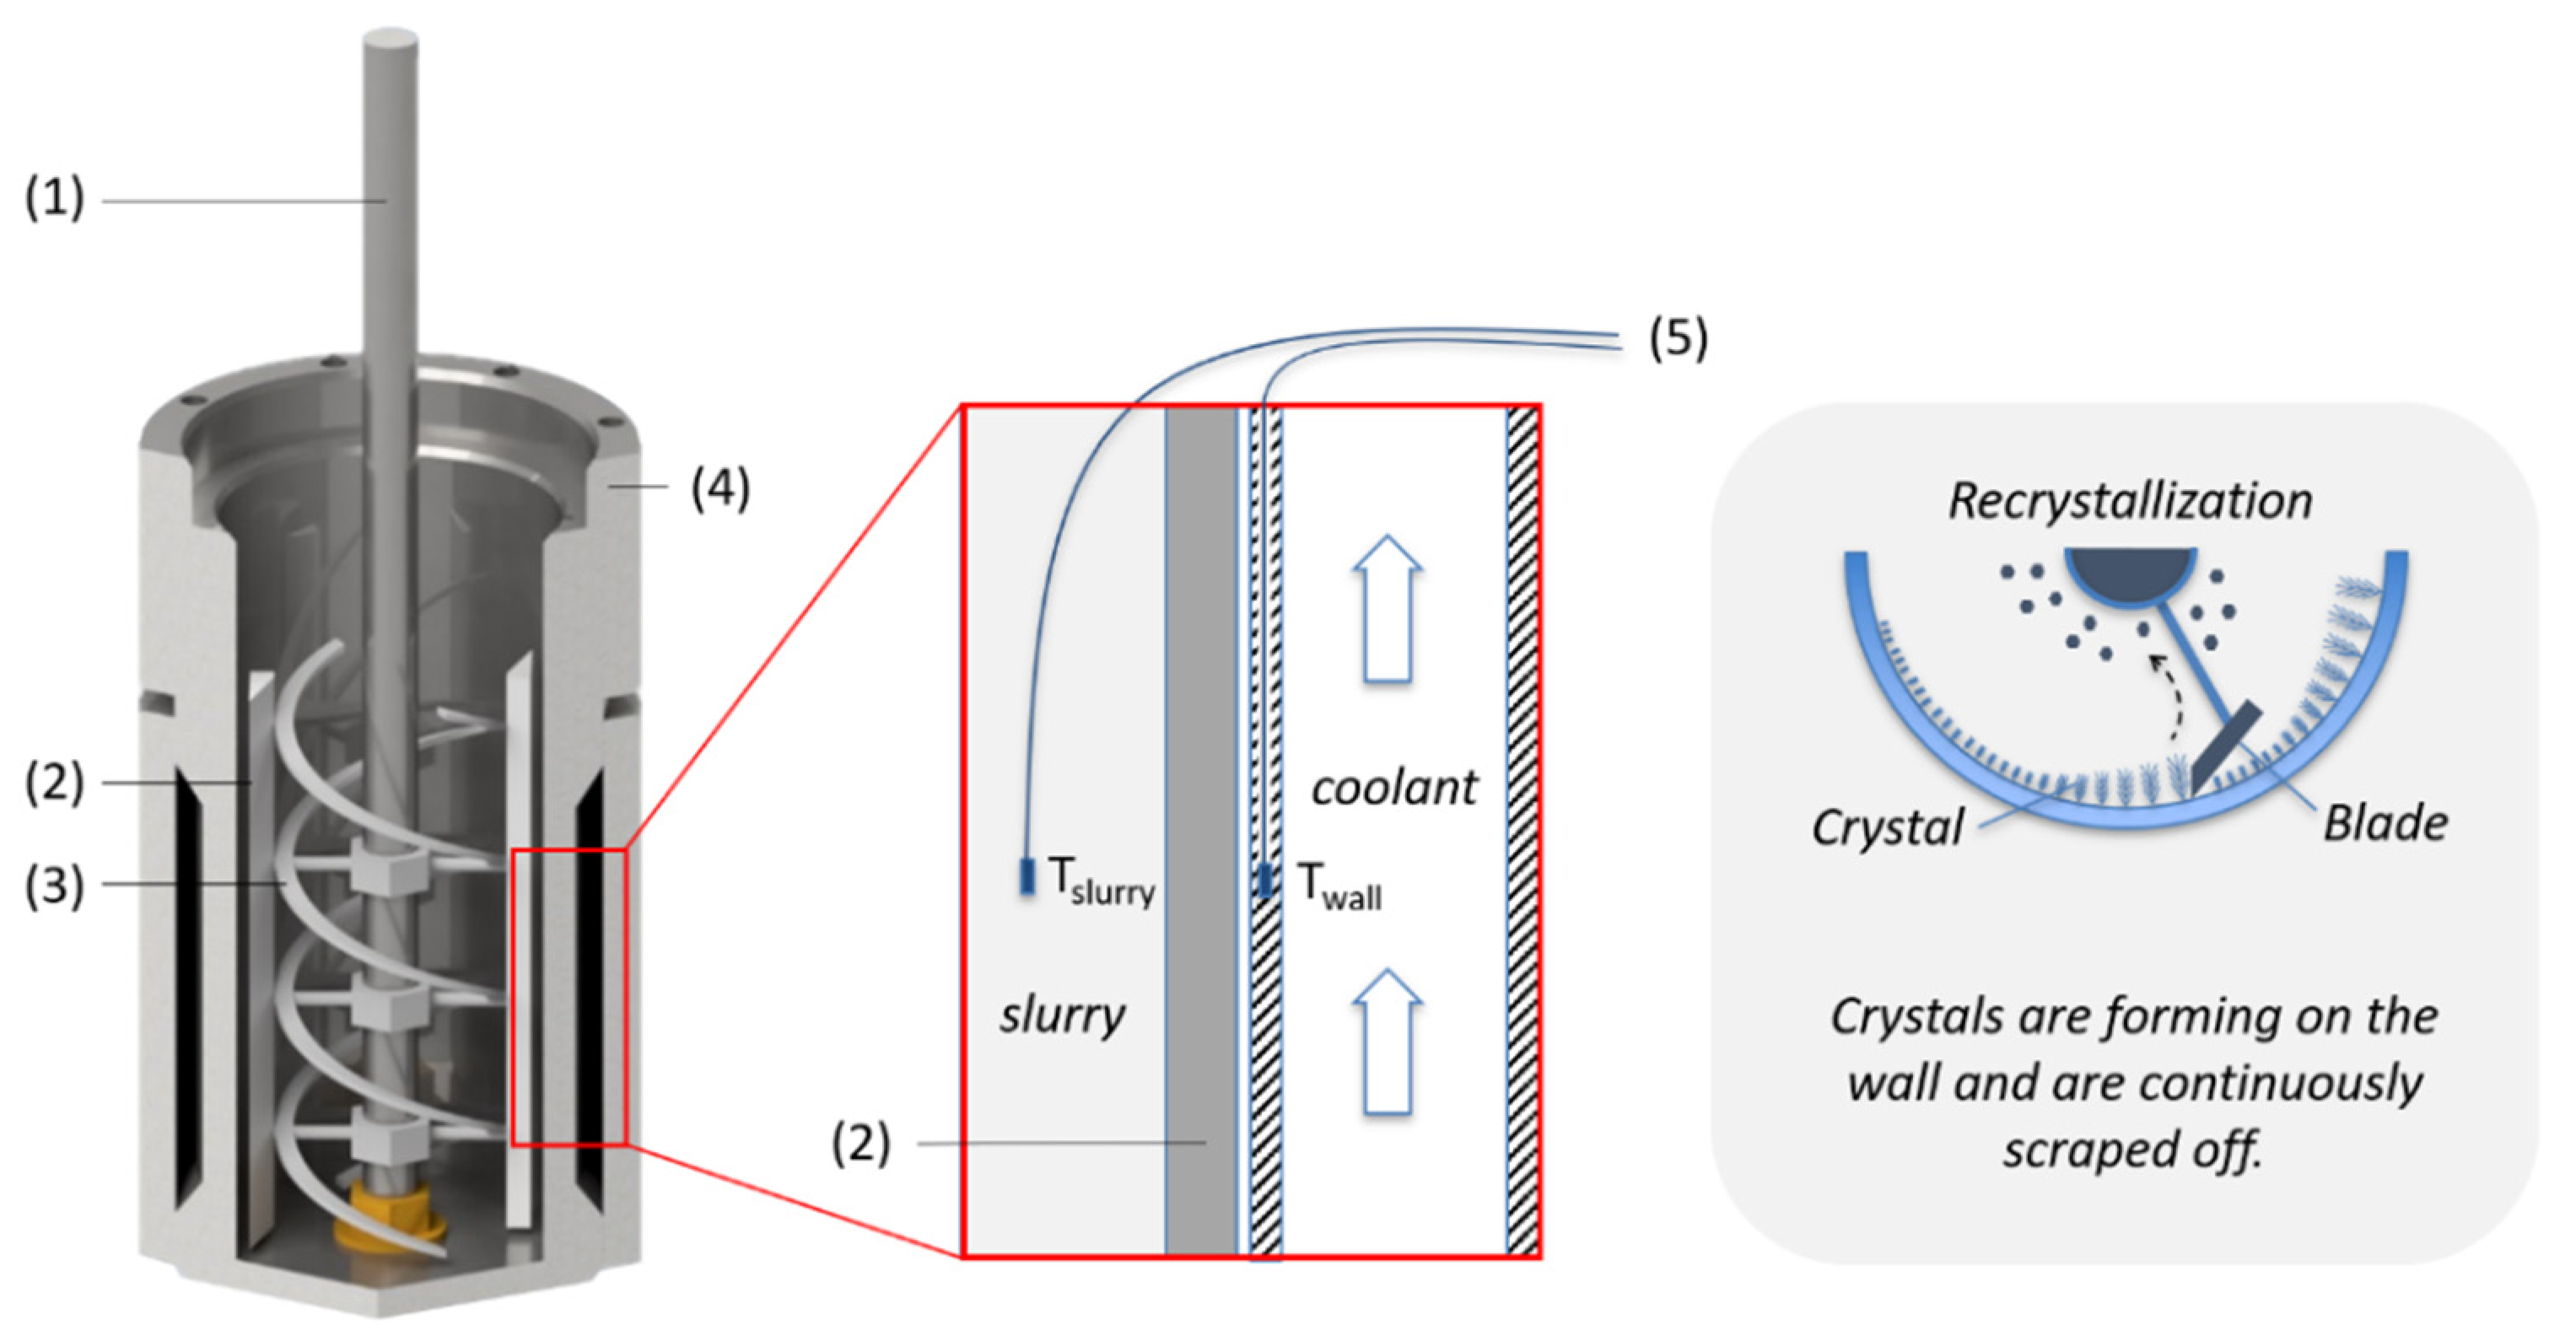
For the investigations, a batch SSHE with a volume of 500 mL was designed (
Figure 2) which was cooled with a double jacket by a cryostat (FP89-HL, Julabo, Seelbach, Germany). The cylindrical container had a height of 125 mm and a diameter of 73 mm. Two blades were loosely attached to a double helix mixer which ensures proper mixing and homogeneous samples. As soon as the rotor started circulation, the blades were pressed on the wall. The cylinder was closed tight by a lid to avoid random foam formation of the sample during the experiment. A servo motor was used for precise control of rotational speed. Two thermocouples (Class 1, type T, Omega, Buffalo, NY, USA) were used to measure the temperature of the product and inside of the cooling wall.
2.3. Influence of Process Parameters on Crystal Size
Three parameters were studied in SSHE: (a) the coolant temperature was varied between −20 °C and −65 °C, (b) the scraping speed (v) was varied between 100 and 300 rpm and c) 0 to 8 temperature cycles (NTC) were performed as soon as the slurry temperature reached −5.0 °C. One temperature cycle incorporates the heat up of the slurry temperature to −4 °C with a rate of 2 °C/min and the cooldown to −5 °C. The applied cooling rate (CR) is dependent on the applied coolant temperature for that trial (see Equation (5)). These cycles were used to trigger recrystallization and ice crystal growth. Since the heat transfer varies depending on the design of the scraper, the cooling rate was used as an input parameter. The cooling rate was found out to be proportional to the coolant temperature and straightforward to control.
Freezing in the SSHE was stopped at −6 °C. From the slurry temperature the ice fraction
was calculated, assuming homogeneous mixing and thermodynamic equilibrium in the slurry as follows:
where
is the initial coffee concentration and
is the final coffee concentration inside the slurry. From the general ice fraction of the slurry
, the ice fraction of the total water phase
can be calculated by
where
is the total solid content of soluble coffee. After nucleation of ice crystals in the scraped surface heat exchanger, the sample was transferred to an air blast freezer at −60 °C air temperature. During this final freezing step, the cake height was varied between 5 mm and 25 mm to allow different freezing rates during the hardening of the slurry. Before freeze-drying, frozen samples were ground and sieved to a size class of 1.7 to 2.24 mm to minimize the influence of particle size on drying kinetics.
2.4. Determination of Freeze-Drying Kinetics
The freeze-drying was performed in a tray freeze-dryer (Cryotec, Paillasse, Saint-Gély-du-Fesc, France) which was equipped with a lyophilization balance (Martin Christ Gefriertrocknungsanlagen, Osterode am Harz, Germany) to follow weight loss with an accuracy of 0.001 g and an infrared sensor to measure the surface temperature of the sample during drying. A total of 2 g of the sample were dried on a polymer mesh with a diameter of 50 mm. The mesh was open to the bottom allowing vapor transport in all directions to study the drying kinetics of a single layer of particles. Before sample loading, the shelves were refrigerated to −30 °C to avoid any collapse of the samples, according to the melting temperature onset of the cryo-concentrated solution
Tm′. The onset of glass transition temperature
Tg′ and the onset of melting
Tm′ of the cryo-concentrates sample was measured before the experiment by DSC. Therefore, about 25 mg of sample was cooled down to −100 °C by liquid nitrogen, one cycle of heating (slightly below
Tm) and cooling was performed and the sample was heated up with a heating ramp of 5 °C/min to 20 °C. The onset of
Tg′ was determined as a small material-specific endothermic change in heat capacity, while the onset of melting is characterized by a significant endothermic change in heat capacity [
22,
23].
For the drying, shelf temperature was increased by 2 °C/min as soon as the vacuum in the chamber was reached, then kept constant at 45 °C until drying was completed and reduced to 25 °C for 20 min before unloading the dryer. The vacuum of the chamber was kept constant during all trials at 0.4 mbar. The heating rate of 2 °C/min was chosen to guarantee reproducible shelf temperatures for each experiment, which is important to compare drying kinetics. During tests, no significant collapse was found to take place.
The drying time of the particles is characterized by the drying time t80, which describes the time when 80% of the moisture has been removed. The total drying time was reached 2% above the equilibrium residual moisture content.
2.5. Analysis Methods
For the trials, the design of experiment was used (Design Expert, StatEase, Minneapolis, USA) to consider the dependencies between the factors. A randomized response surface method approach was chosen using a central composite design. Therefore, 30 experiments were performed, including 6 center points and 8 star points, where α-levels were set as α = 2 (rotatable design).
For the analysis of the dried samples, the particle size distribution of the whole sample was measured, where x
area was determined (CAMSIZER XT, Retsch GmbH, Haan, Germany) to confirm the homogeneity of the particle size. Particles, smaller than 1 mm, were not considered to avoid the inclusion of fines in the Sauter mean diameter. Furthermore, the pore size distribution, porosity and envelop density were measured by mercury porosimetry (Pascal 140 + 440, Thermo Fisher Scientific Inc., Waltham, USA). Therefore, 150 mg of a sample was analyzed at pressures between 0.1 kPa and 400 MPa with an accuracy of 0.2%. The pressure ranges allow the analysis of pore diameters of 116–3.8 µm (Pascal 140) and 15–0.0036 µm (Pascal 440). The Washburn equation was used to relate the capillary pressure to the pore radius:
where
is the surface tension of mercury,
is the contact angle for mercury on the material (
= 140°) and
is the applied pressure to force the mercury into the pores of the pore radius
. The capillaries are assumed as cylinders. The porosity is calculated by the amount of intruded mercury into the sample. Further details about the measurement methods are described in Karathanos and Saravacos [
24].
For the determination of closed pore porosity a helium pycnometer (AccuPyc 1330, Micromeritics, Norcross, USA) was used, where 0.6 g of sample were analyzed in a 1 cm
3 cell at gauge pressures of 20 kPa. The apparent density (
) was measured with the dry coffee granules. The matrix density (
) was measured with disintegrated dry coffee powder to open up closed cavities. The closed pore porosity (
) was calculated by the following equation:
The pictures of selected particles were recorded by scanning electron microscopy (SEM) (Gemini 1530, Carl Zeiss Meditec, Jena, Germany). The particles were sputter-coated with a 40 nm gold layer to avoid interferences during measurements. Magnifications of 25, 100, 400 and 1000 times were performed with an electron beam of 5 kV.
To calculate the ice fraction of the produced ice slurries the freezing point of the coffee solutions was investigated. Coffee solutions with concentrations between 10%
w/
w and 55%
w/
w were filled into glass test tubes and placed into a cold bath with a temperature of 10 °C below the assumed melting temperature. The decreasing temperature of the solution was recorded. After a short period of supercooling, nucleation was observed and temperature increased to a stable value. This constant value was taken as the freezing point. This method was already described elsewhere for instant coffee [
25,
26].
3. Results
3.1. Determination of Cooling Rate
The relation between coolant temperature used for refrigeration of the scraped surface heat exchanger and the cooling rate of the slurry was determined empirically to make results more independent from device geometry using cooling rate instead of coolant temperature as an input parameter:
where
is the cooling rate (°C/min) and
is the temperature of the coolant used (°C). The coefficient of determination is R
2 = 0.995. For the determination of the average cooling rate, the difference in temperature between the start point of the experiment (0 °C) and the point where the first temperature cycle starts (−5 °C) was divided by the needed time. Scraping speed between 100 rpm and 300 rpm showed no significant impact on the cooling rate in comparison to the change in coolant temperature. Instead of coolant temperature, which is easier to control, but less meaningful, the cooling rate is used for the design of experiments.
Supercooling of the solution before nucleation plays an important role in the size and shape of the nuclei. The degree of supercooling increased with a higher cooling rate, but results show that the control of nucleation temperature becomes more difficult to control at higher cooling rates which increases standard deviation. For coolant temperatures at −65 °C, the degree of supercooling was even shown to decrease again or stayed at least constant, which could be explained due to inhomogeneities of the temperature inside the wall due to the high temperature difference at the beginning of the experiments.
The freezing rate during the hardening step was measured to be 0.25 ± 0.01 cm/min while varying cake size between 0.5 cm and 2.5 cm. It was defined as the cake thickness divided by the time until the thermocouple at the bottom of the cake detects a decrease in temperature from −10 °C to −30 °C, where the heat was predominantly was removed from the top. The freezing time as a function of layer thickness is given by the following expression:
where
is time (min) and
is the thickness of the frozen cake. The coefficient of determination is given with R
2 = 0.997.
3.2. Determination of Melting Temperatures
The melting temperature of the fully cryo-concentrated sample
Tm′ was determined by DSC to be −27.35 ± 0.30 °C (onset) and the glass transition temperature of the concentrated sample
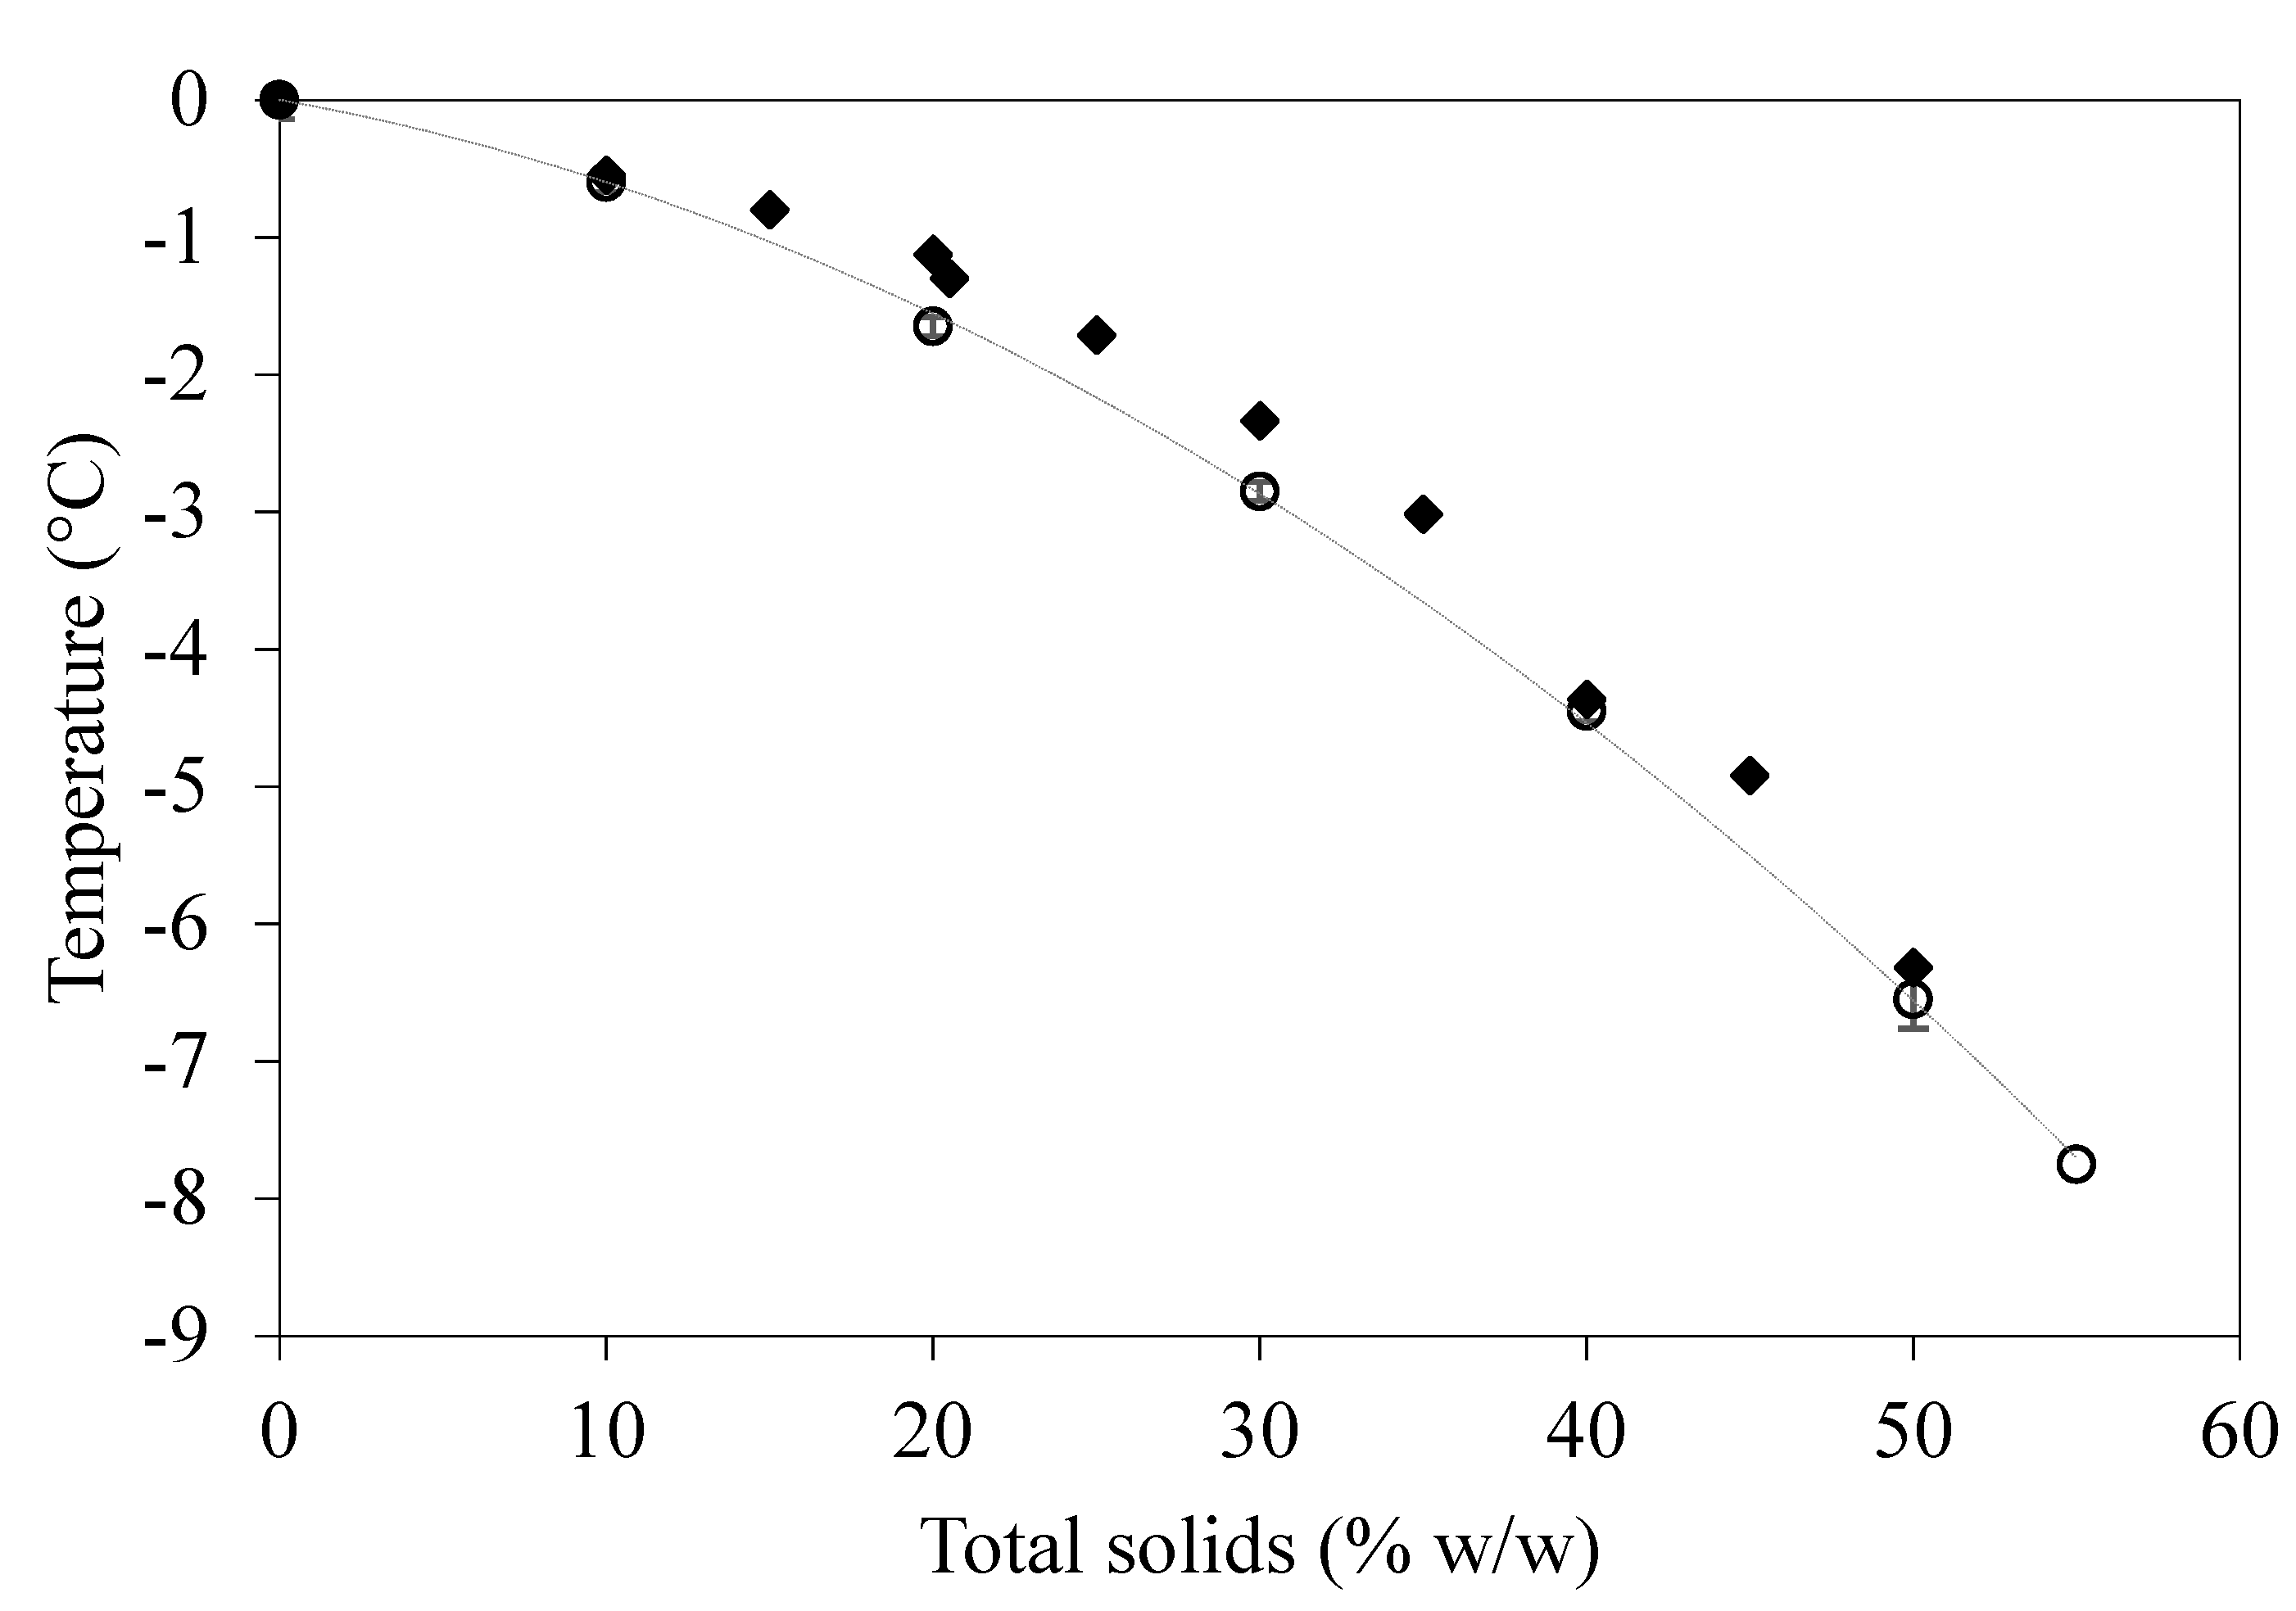
Tg′ was measured at −45.55 °C. The melting curve of the frozen coffee solutions is displayed in
Figure 3 and was used to calculate the ice fraction of the system according to Equations (1) and (2). Although the composition of various instant coffees differs, results are also in good agreement with Burmester et al. [
26]. The equation for the melting curve can be expressed as follows:
where
is the melting temperature (°C) and
is the concentration of the coffee (%
w/
w). The coefficient of determination is given with R
2 = 0.999.
Using Equation (7), the predicted solid content at −6 °C can be determined to 47.2% w/w and therefore the ice fraction before hardening can be calculated via Equations (2) and (5) with = 0.364 and = 0.521.
3.3. Structure
The particle size of all samples was in the same range using the Sauter mean diameter of the particle size distributions with d32 = 2.216 ± 0.058 mm. Particle porosity was determined for all samples with an average value of 0.722 ± 0.010. No significant dependencies of the porosities due to the varied parameters could be found. The variance in porosity also varies slightly per sample due to freeze concentration effects which overlying the investigated process parameter effects. Closed porosity was found to be fairly low with 0.021 ± 0.014 and comparable in all samples so that it can be concluded that the influence of closed porosity on drying kinetics is negligible for the experiments.
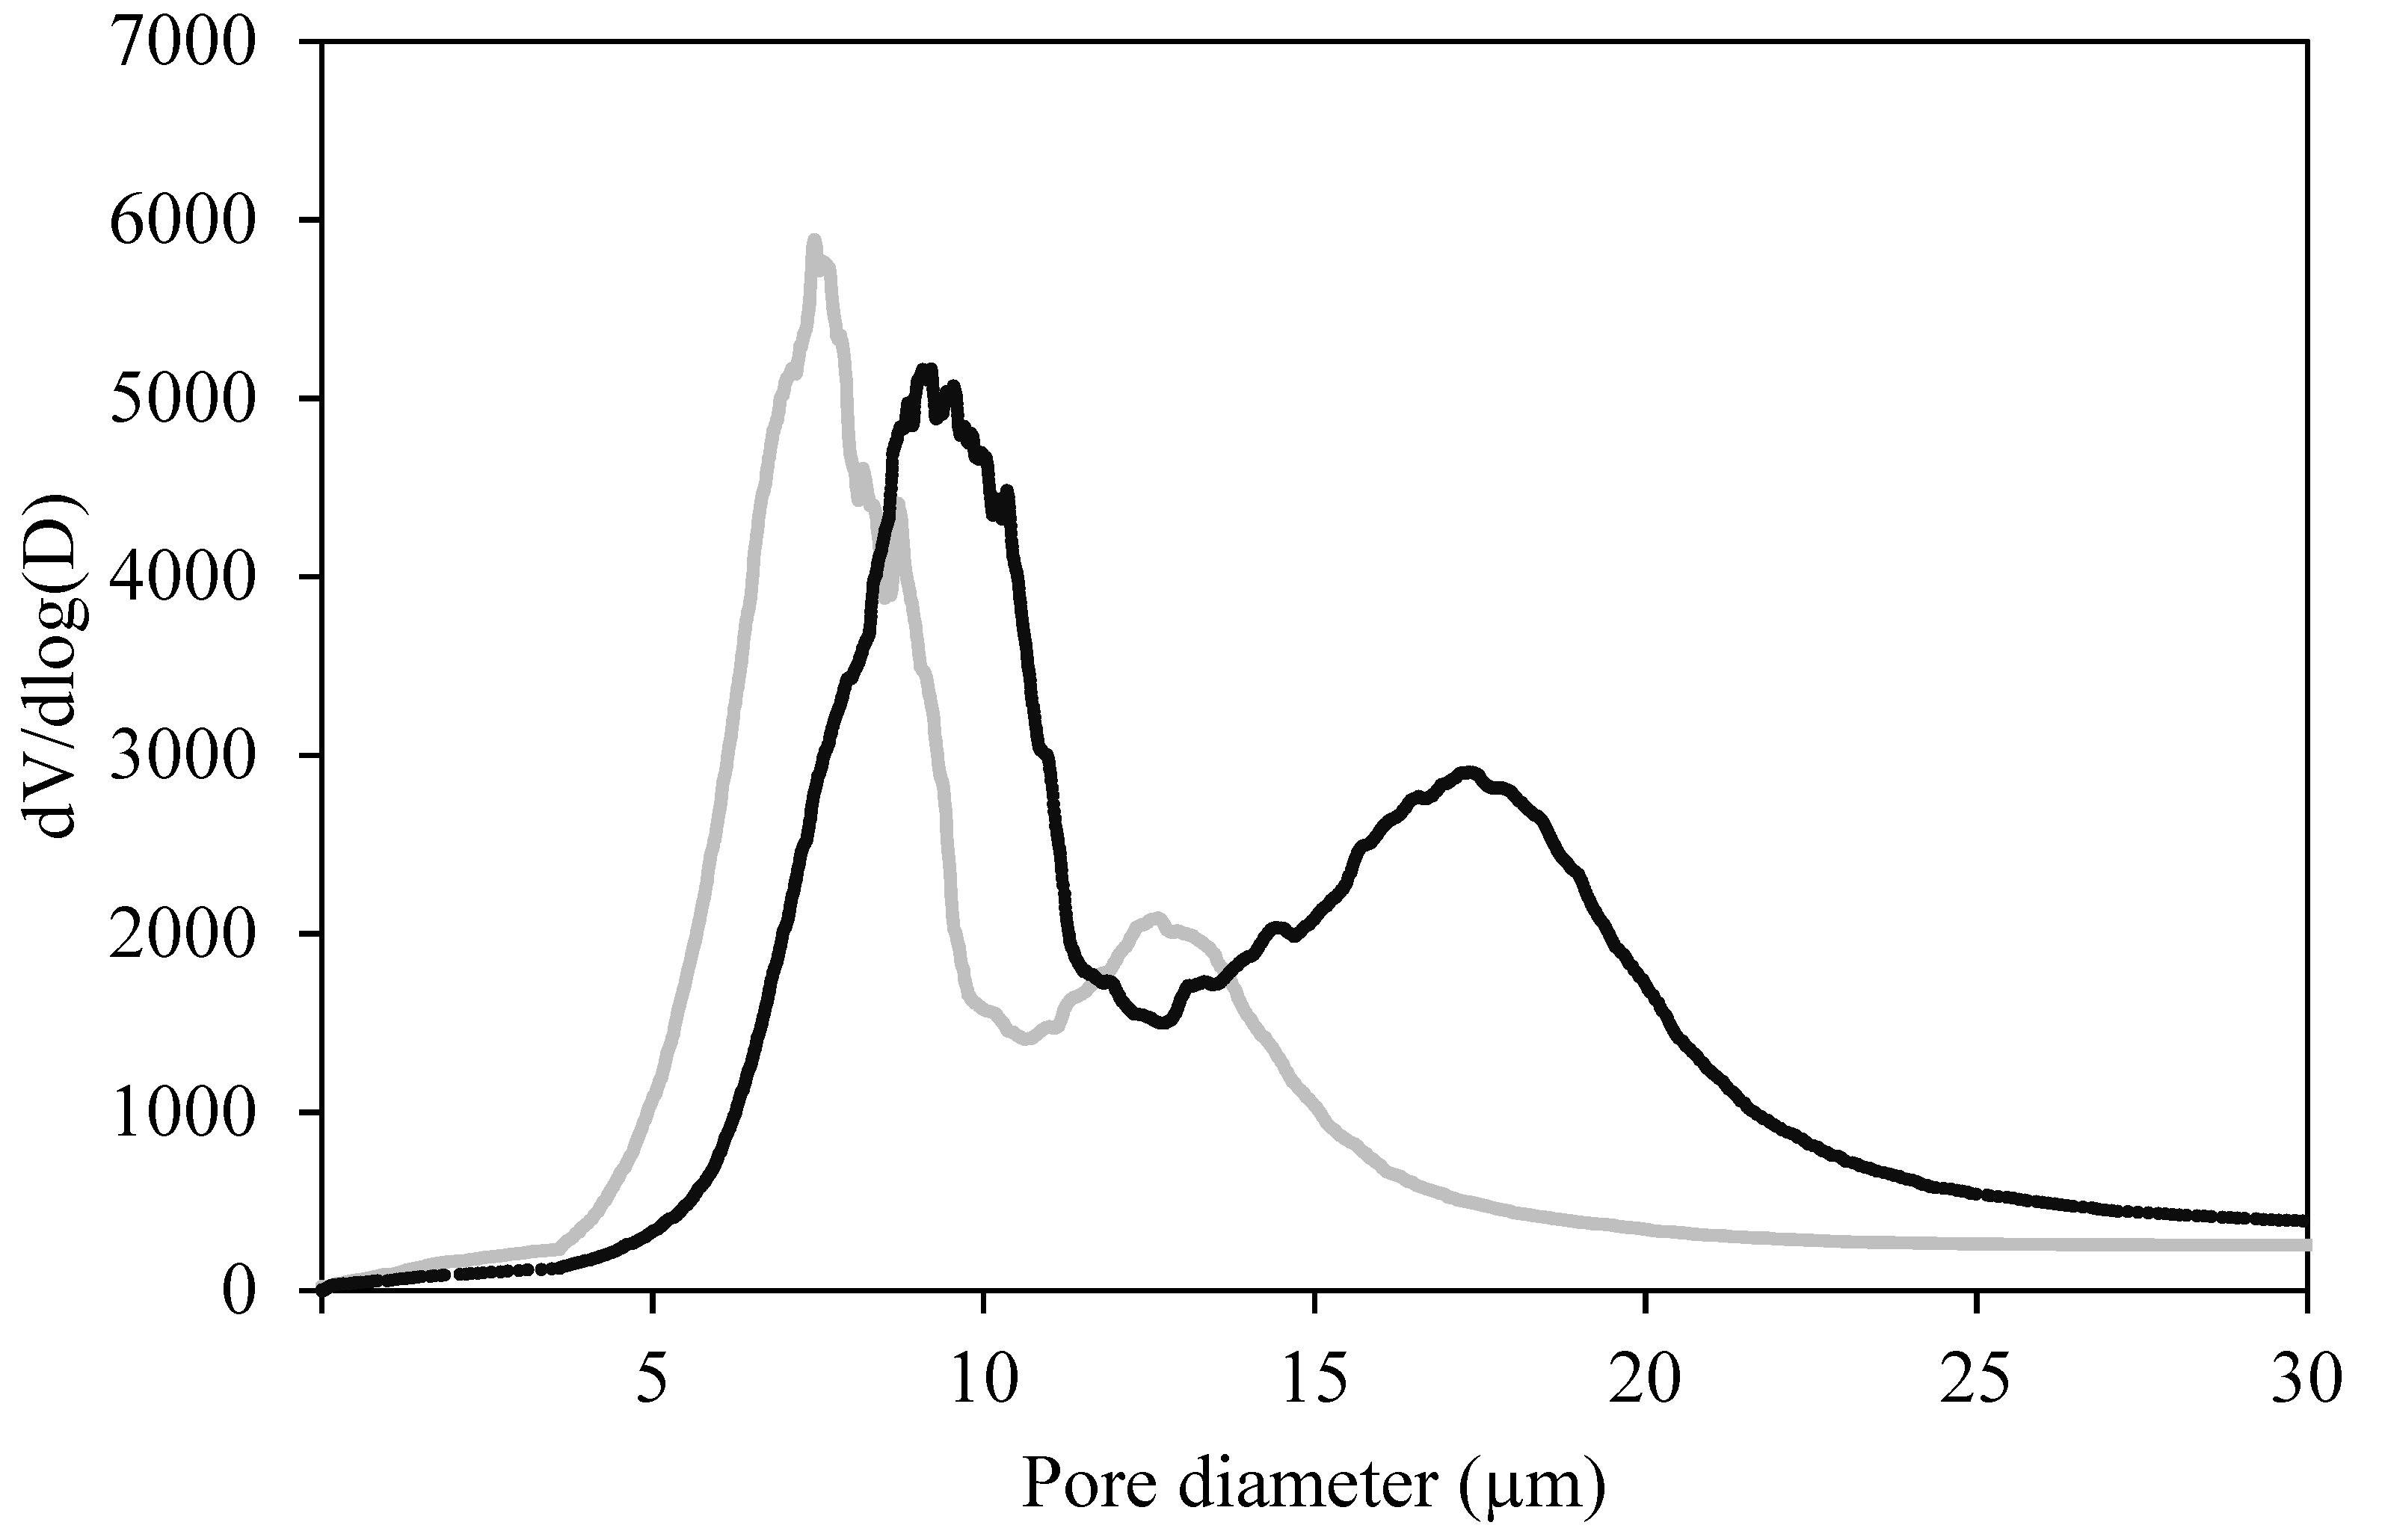
All samples which undergo controlled temperature cycles show bimodal pore size distributions since after the nucleation and crystal growth in the SSHE a second nucleation step is occurring during secondary freezing. The location of the first and the second peak of the distribution is characterized by a modal pore diameter and is strongly dependent on the freezing rates and temperature cycles. In
Figure 4, an exemplary plot for the bimodal pore size distributions is shown.
The modal pore diameter of the peak of the larger pores of the pore size distribution (dM,2) raised from pores which are created by the crystals created in the SSHE. Coolant temperature and the number of controlled temperature cycles which are part of the varied parameters in the SSHE show a significant effect on the modal pore diameter of the second peak. Cake thickness and therefore the secondary freezing rate has no significant influence on dM,2. Data shows that the higher the cooling rate in the SSHE, the smaller the initial crystals before secondary freezing, and therefore the smaller the modal pore diameter. Increasing the number of controlled temperature cycles gives more time for crystals to grow due to Ostwald ripening inside of the SSHE and therefore leads to larger crystals.
The most significant parameter to control the modal pore diameter of the smaller crystal fraction of the sample (
dM,1) is only the thickness of the cake and therefore the freezing rate of the cake. The cooling rate and the number of temperature cycles which are parameters applied in the SSHE have no significant influence on
dM,1. It was shown that a thicker cake leads to decreased freezing rates and therefore increases the modal pore diameter of the smaller ice crystal fraction. The following equations show the dependency of modal pore diameter of the first peak (
dM,1) and the second peak (
dM,2):
where
is the cooling rate (°C/min),
is the scraping speed (rpm),
is the number of temperature cycles and
is the thickness of the cake.
These data show that during air blast freezing of the cake with freezing rates of 2 °C/min and 10 °C/min (corresponding to cake thickness of 2.5 cm and 0.5 cm, respectively) no significant crystal growth of the ice fraction nucleated in the SSHE can be observed. It can be concluded that most of the water which is crystallizing during that step is found in the fraction of the smaller crystals. Further studies have shown that, at concentrations of 30%
w/
w coffee, freezing rates below 0.5 °C/min during secondary freezing leading to a monomodal pore size distribution. In comparison to the here shown results, at these low freezing speeds, the mass transfer of the water to the crystal is sufficient and no second step of nucleation is taking place. The coefficient of determination for the model of
was R
2 = 0.85 and for the model of
it was R
2 = 0.66, respectively. Where R
2 of
shows that the model is in good agreement with the results, the model of
shows significantly higher deviation, which may result from slightly changing conditions of the temperature cycles amplitude which could be controlled by ± 0.1 °C only, within an amplitude of 1.0 °C.
Table 1 summarizes the obtained results.
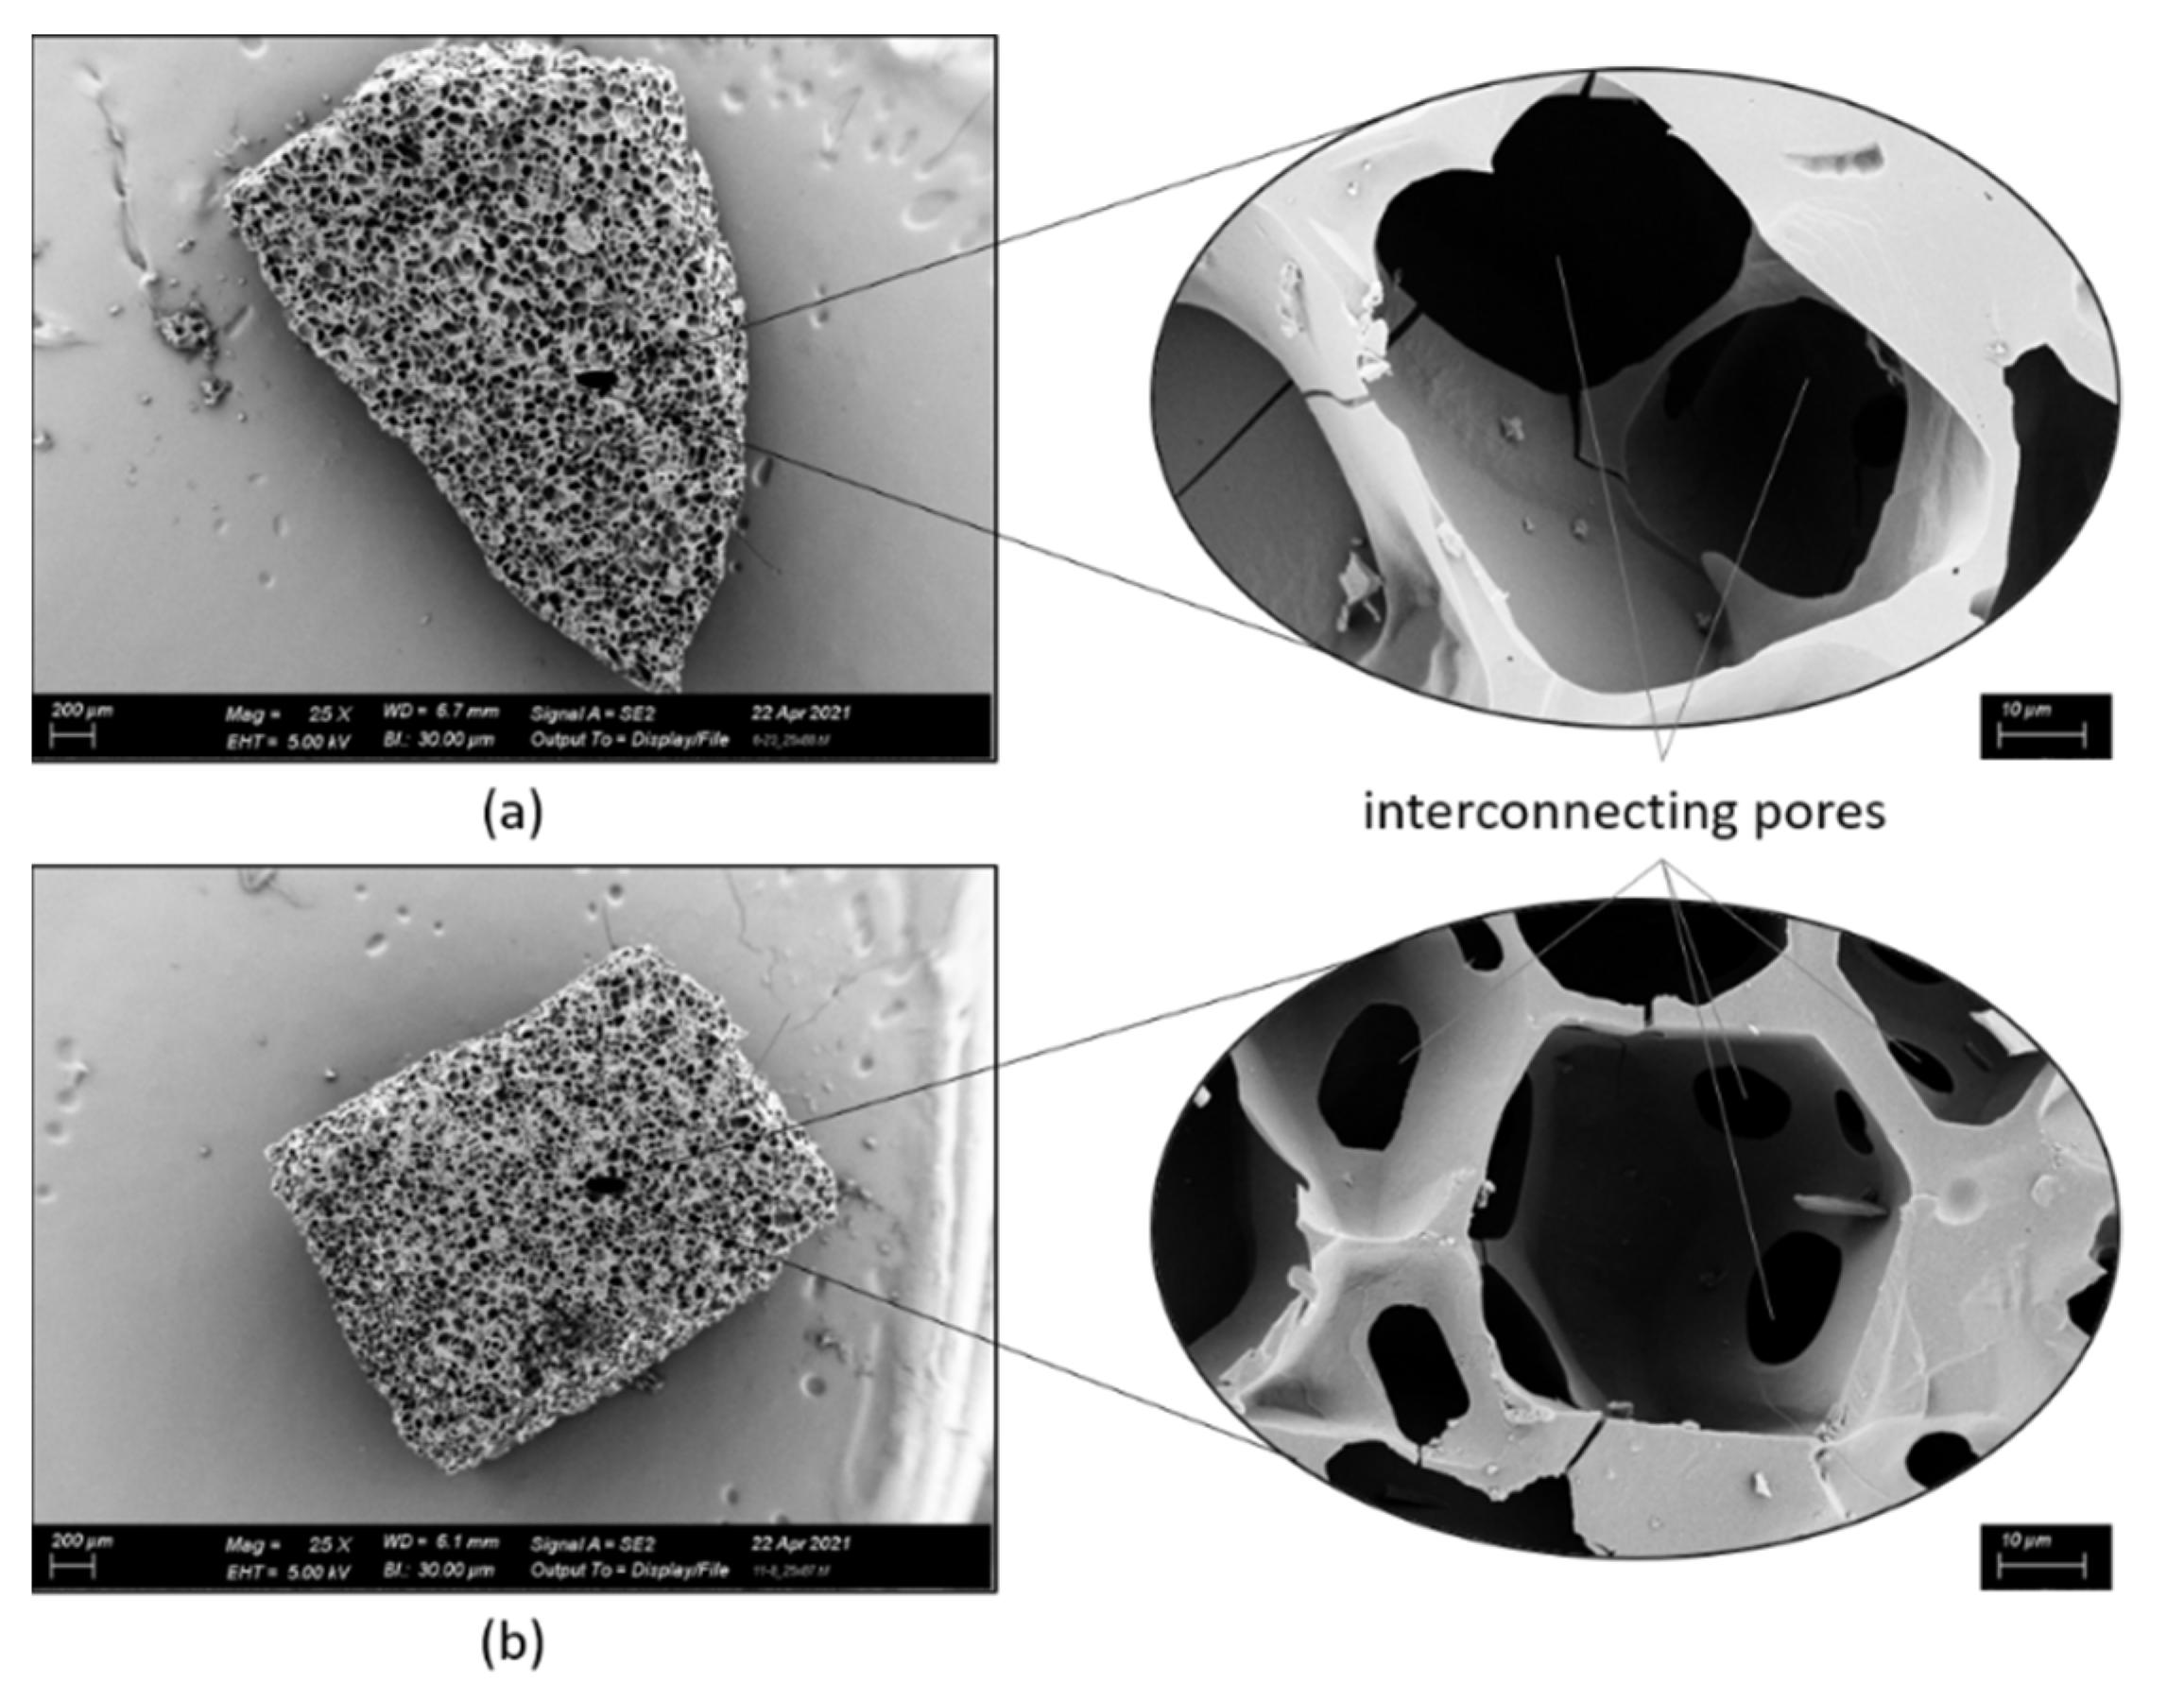
SEM images confirm the observations as displayed in
Figure 5, where in this example the extremes are shown. Samples with a high cooling rate, fewer temperature cycles and higher scraping speed show smaller interconnecting pores in the range of 7 µm to 12 µm compared to samples with low cooling rate, a high number of temperature cycles at lower scraping speed with interconnecting pores of 20 µm to 30 µm.
3.4. Primary Drying Time
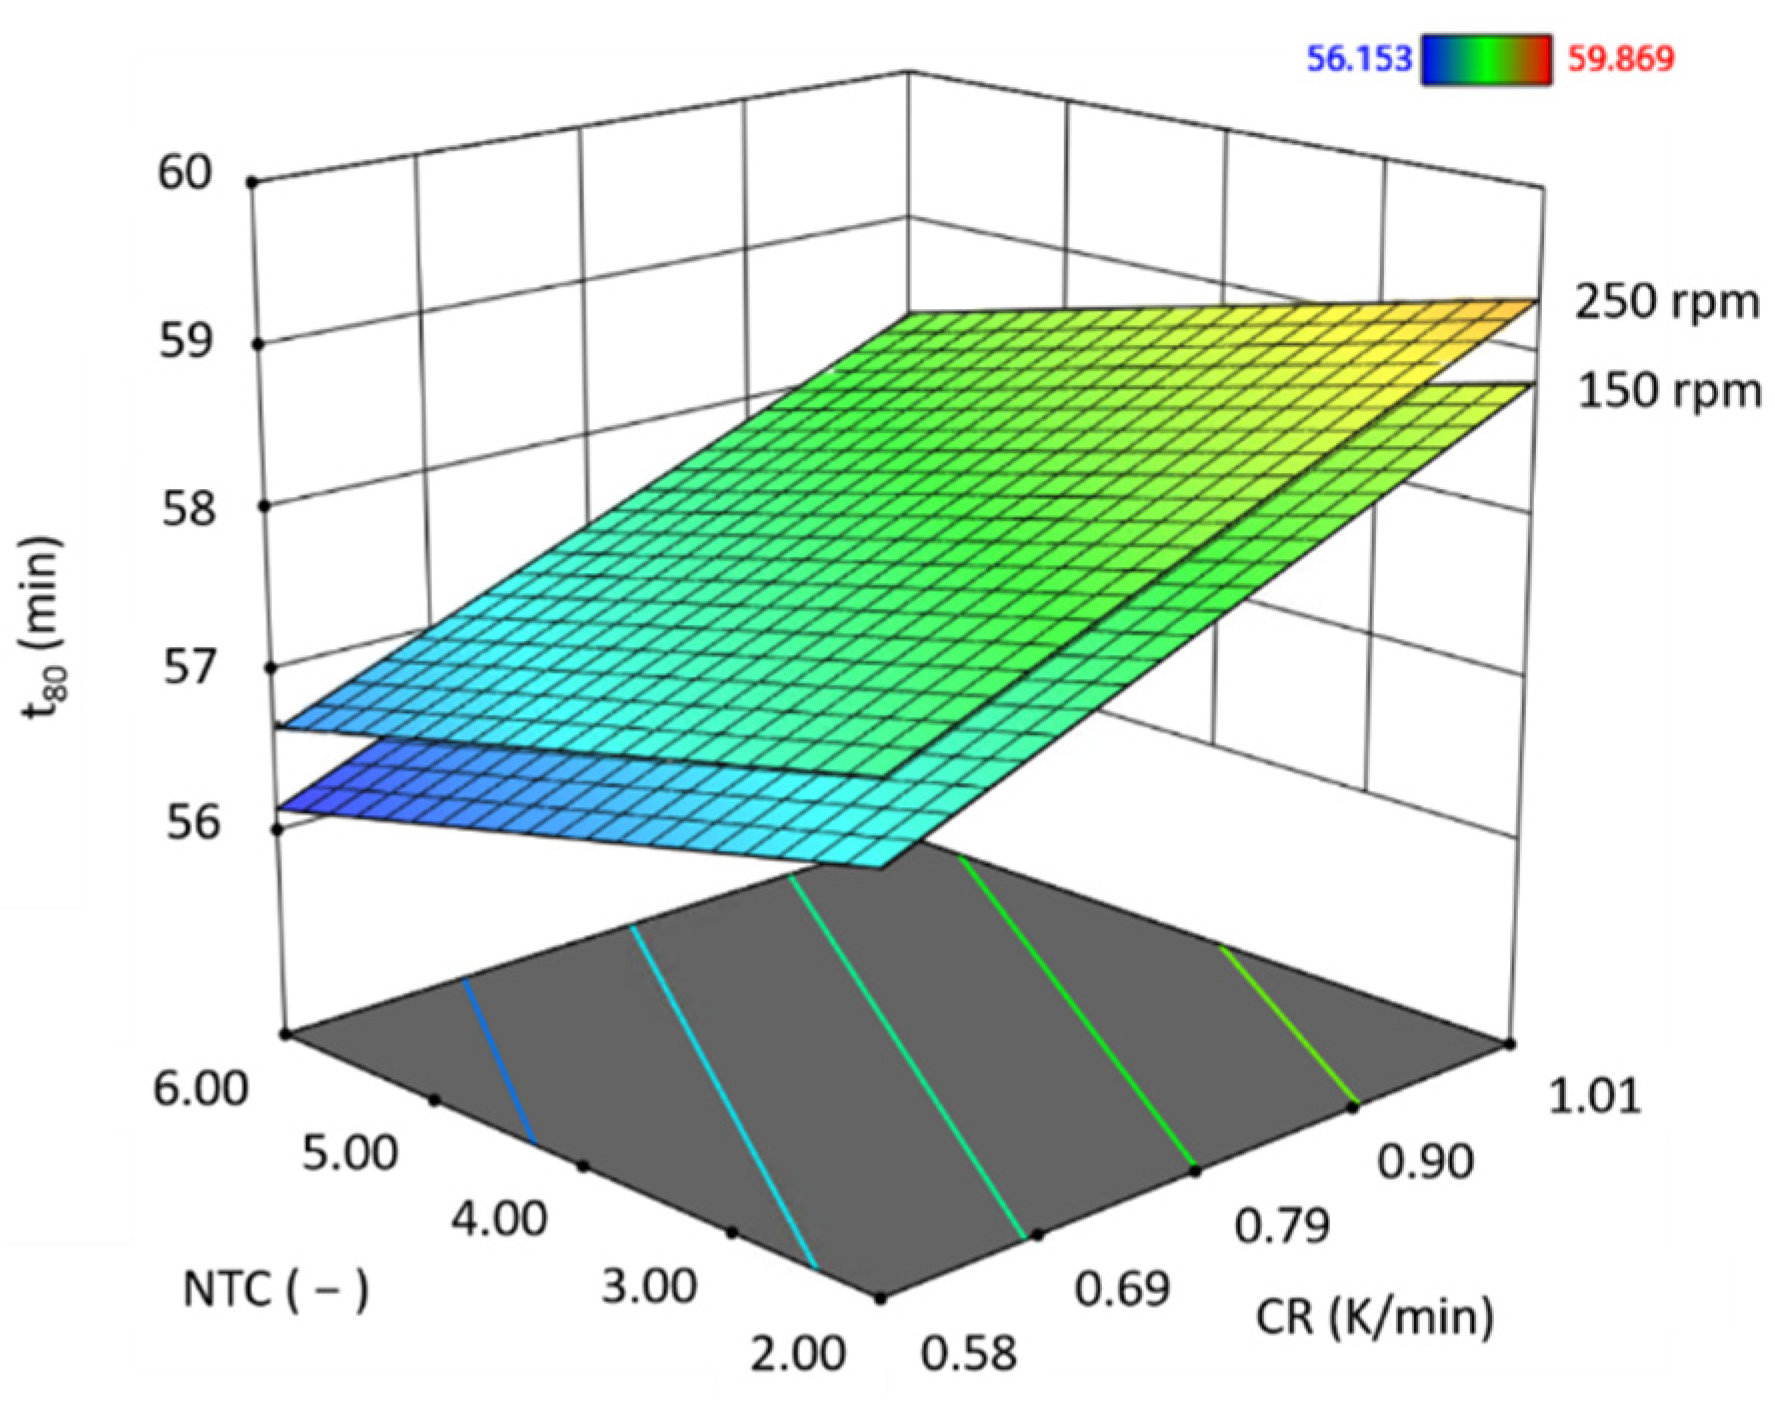
In
Figure 6, the influence of varied parameters on the primary drying time
t80 during the sublimation of ice is shown.
t80 is defined as the time where 80% of the moisture has been removed. Significant parameters influencing the primary drying time of the sample are the cooling rate, scraping speed and the number of temperature cycles. The thickness of the cake has only a small impact, which is not significant in the applied range. The applied linear model can be expressed by the following equation:
where
is the cooling rate (K min
−1),
is the scraping speed (rpm),
is the number of temperature cycles and
is the thickness of the cake. The applied model has a coefficient of determination R
2 = 0.87, which gives a good fit for the applied data, considering the deviation for structure creation and that the balance in the freeze-dryer undergoes high temperature changes during the drying process.
Findings show that drying time during primary drying is directly linked to ice crystal structure. Especially parameters applied in the scraped surface heat exchanger show a significant impact. An increase in the cooling rate, faster scraping of the crystals and fewer temperature cycles lead to smaller crystal size resulting in longer primary drying time of the samples. The thickness of the cake has an impact only on the smaller fraction of the bimodal function which does not show a significant impact on the primary drying rate. This fact suggests that the primary drying time of structures with bimodal ice crystal size distributions which are not limited by closed pore porosity can be reduced mainly by increasing the bigger fraction further. The small fraction seems to have only a minor impact in respect of the applied range of parameters.
The increased pore size diameter allows the faster mass transfer of the water from the inside to the outside of the particle since the diffusion coefficient in the Knudsen regime increases linearly with the pore diameter [
27].
3.5. Overall Drying Time
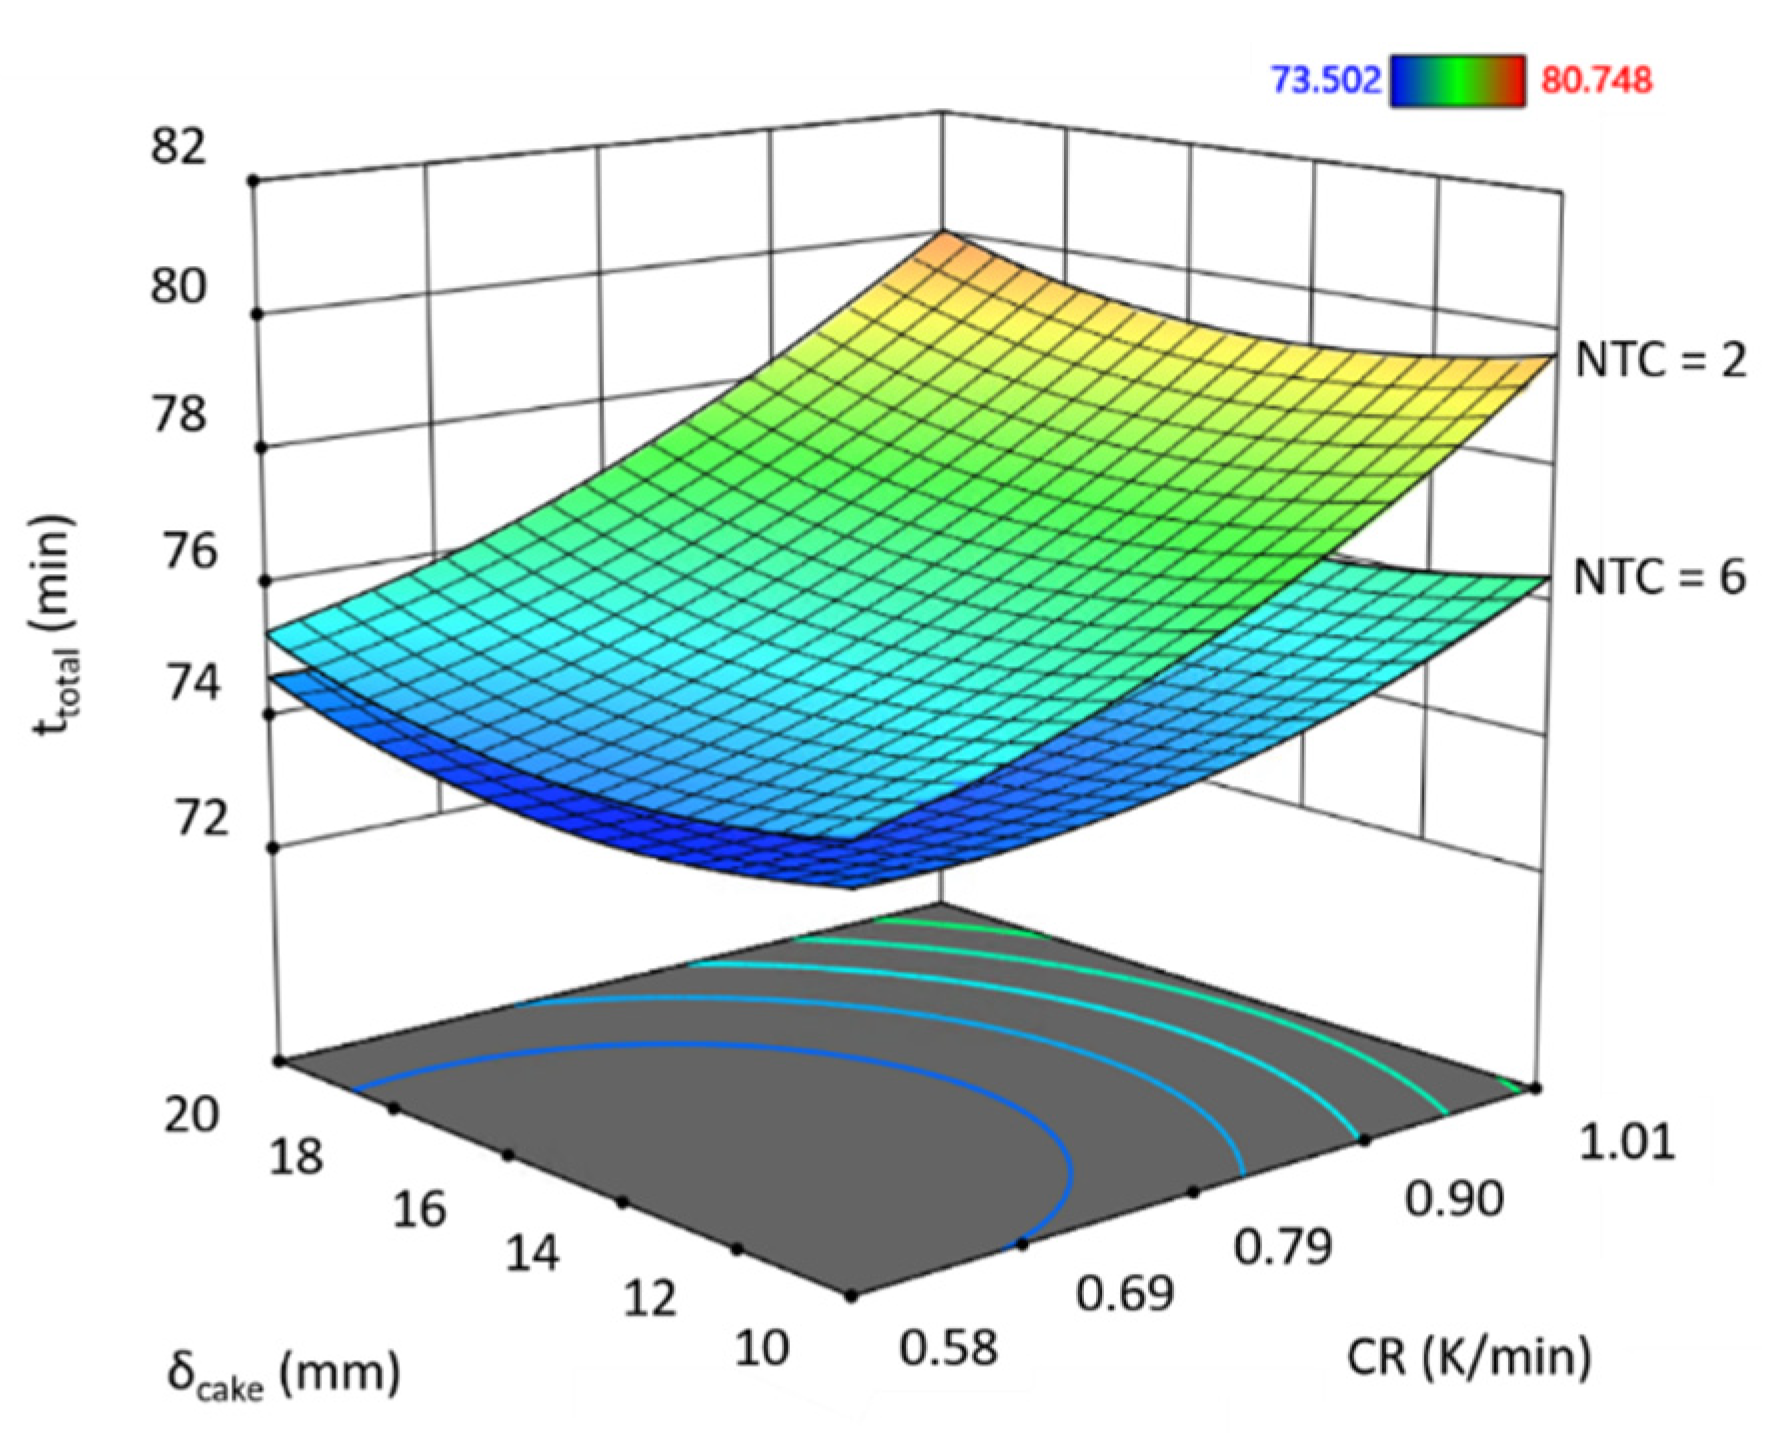
The overall drying time of the sample cannot only be described by primary drying but also secondary drying needs to be considered. Indeed, secondary drying is often the time-determining step for high concentrated materials, since the ratio of bound water to crystalline water is increasing with the dry matter content. In
Figure 7, the dependency of overall drying time on the influence parameters is shown. Significant parameters influencing the overall drying time of the sample are the cooling rate and the number of temperature cycles, while the thickness of the cake shows only minor effects. The scraping speed does not show a significant impact in the applied range. The used quadratic model can be expressed by the following equation:
The applied quadratic model has a determination coefficient of R2 = 0.80. Here, the observed deviation in structure, as well as high changes in temperature in the dryer, influences the weight loss detection. Overall drying time could be decreased by applying lower cooling rates, but this influence strongly depends on the number of temperature cycles that were applied. With a low number of temperature cycles, the impact of the cooling rate is significantly higher, since less recrystallization of the small crystal is happening. On the other hand, the cooling rate is less significant with a higher number of temperature cycles since the time for recrystallization is longer and the size of the crystals is aligning.
The total drying time includes the primary and the secondary drying time. While primary drying time is mostly determined by the mass transfer through the pores and the heat transfer through the dried layer, secondary drying is usually influenced by further parameters. Beyond the transport of the water vapor through the pores, the water transport within the solid matrix through moisture diffusion needs to be considered. This diffusion is impacted by the thickness of the lamella and the water concentration gradient. Higher pore surface and therefore smaller crystals were shown to have a positive impact [
1,
28].
For the moisture transport within the pores, big crystals are beneficial as they are creating large pores during primary drying and therefore improve the moisture transport as shown in the results. At least for bimodal pore size distributions, cake thickness was shown to have no significant effect on the pore vapor transport during primary drying, since the big pores are dominating the transport. For overall drying, it shows at least minor decreasing effects if the cake is thinner, freezing rates are higher and therefore crystals of the smaller fraction get smaller.
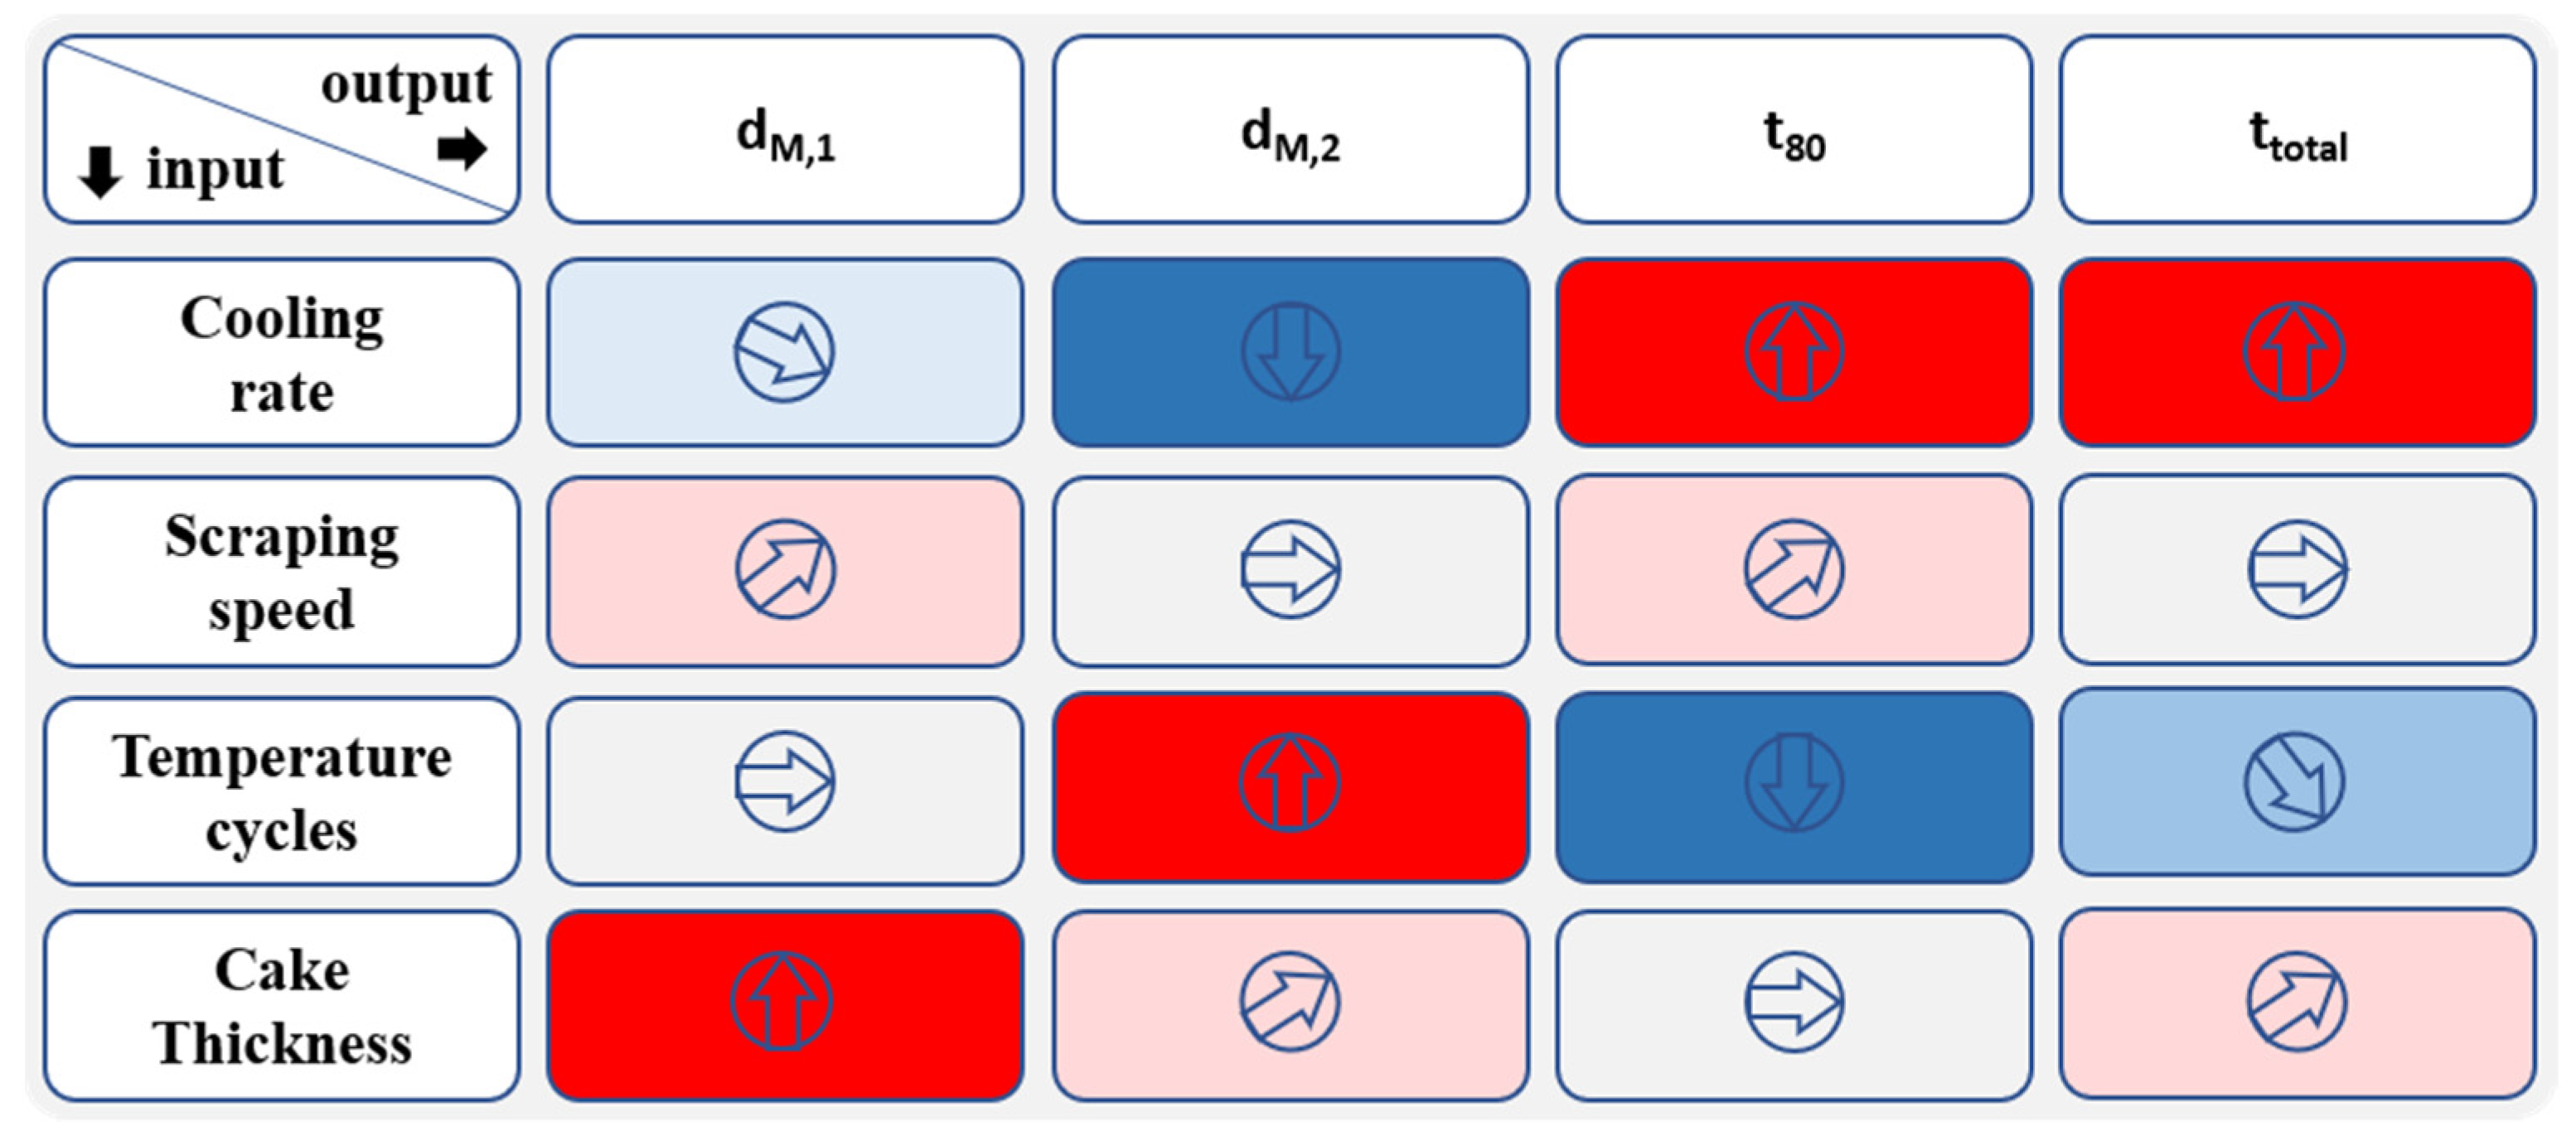
In
Figure 8, an overview of how the applied parameters were influencing the crystal size distribution and the primary and secondary drying time is shown. It can be seen that the cooling rate and the temperature cycles showed the highest impact on a change in structure and therefore on the drying kinetics.
4. Conclusions
Results show that freezing factors like supercooling, cooling rates and scraping speed have a significant impact on the internal porous structure of instant coffee and therefore influence the drying time of the single particle. In combination with applied temperature cycles in the SSHE, it was shown that the here applied freezing rates during the hardening step led to a second nucleation step resulting in bimodal ice crystal structures which were investigated in respect of primary and overall drying time.
Lower cooling rates during nucleation in the SSHE, a higher number of temperature cycles and low freezing rates were identified to increase ice crystal size, where the cooling rate and the number of temperature cycles had the biggest impact. The increased crystal size of the second peak was shown to reduce the primary drying time, where an increase of the crystal size of the small peak shows no significant impact on primary drying. The smaller ice crystal fraction affected the overall drying time, where the ice crystal size of this peak should be reduced to contribute to an improved secondary drying.
In the applied range of parameters, primary drying dominates the overall drying time, since higher temperature cycles, lower cooling rates and therefore an increase of crystal size leads to decreased drying times. Findings are consistent with available knowledge, confirming that reduction of overall drying time can be achieved by balancing the effects of primary and secondary drying which are shown to be strongly influenced by the pore size diameter.
This work focused mainly on the effect of pore size on the observed drying rates of instant coffee, where important structural parameters like overall porosity, closed pore porosity and tortuosity were tried to be kept constant. In a next study, an additional gassing step will be considered to allow an increase of solid content while keeping overall porosity constant.
Beyond the ice crystal size distribution and therefore the interconnecting pore size distribution, foamability, foam stability and interconnection between gas pores and ice crystals play an important role affecting tortuosity and closed pore porosity on the structure side. During gassing, closed pores can lead to a significant decrease in drying time. Detailed methods how to control a low level of closed pores at high solid content are still missing today. Therefore, the mechanisms at the solid-gas interface of instant coffee need to be further investigated.


