1. Introduction
The production and consumption of energy are vital for achieving and sustaining economic growth in the long term [
1]. At the same time, energy production and consumption have also created large-scale environmental concerns, as non-renewable energy sources such as the use of fossil fuels including coal, gas, and petroleum increase overall CO
2 emissions but also tend to increase the cost of energy with time. Increasing costs have created situations around many parts of the globe where deficiency of energy has not only created economic problems, but also seems to have contributed to growing poverty [
2] and created climate change issues as a result of increasing CO
2 emission [
3].
The importance of alternative or green energy sources can be assessed from the report of EIA (Energy Information Administration of USA), according to which the global energy demand will rise by 48% by 2040. This will put a great deal of stress on the environment, as it is an irrefutable fact that global energy production is one of the major causes of environmental pollution, mainly because most of the global energy production is fossil fuel-based [
4]. At the same time, one has to consider the fact that the global supply of fossil fuels is also limited. With the increase in global energy demand, humans are constantly looking for new resources of energy that can be replenished and at the same time do not put a strain on the Earth’s ecosystem [
5]. One of the major advantages of renewable energy lies in its overall cost, as the cost of this energy is much lower as compared to conventional, fossil fueled-based energy [
6]. The overall cost saving resulting from the use of alternative or green energy sources can be used to raise people’s general standard of living in the long term [
7] and at the same time will enable governments to address the environmental concern as well [
8,
9]. In the past few decades, the global drive to reduce the reliance on fossil fuel-based energy has seen a great deal of backing by both developed and developing economies in the past few decades [
10]. One such concerted effort was by the EU, as in 2009 the EU set the target of converting 20% of its energy sources to renewable energy sources by 2020, and all of the member countries agreed to national renewable energy action plans; according to international energy statistics, almost 19% of global energy needs are being fulfilled by renewable energy, and by 2050 this percentage is set to increase to 50% [
11,
12,
13].
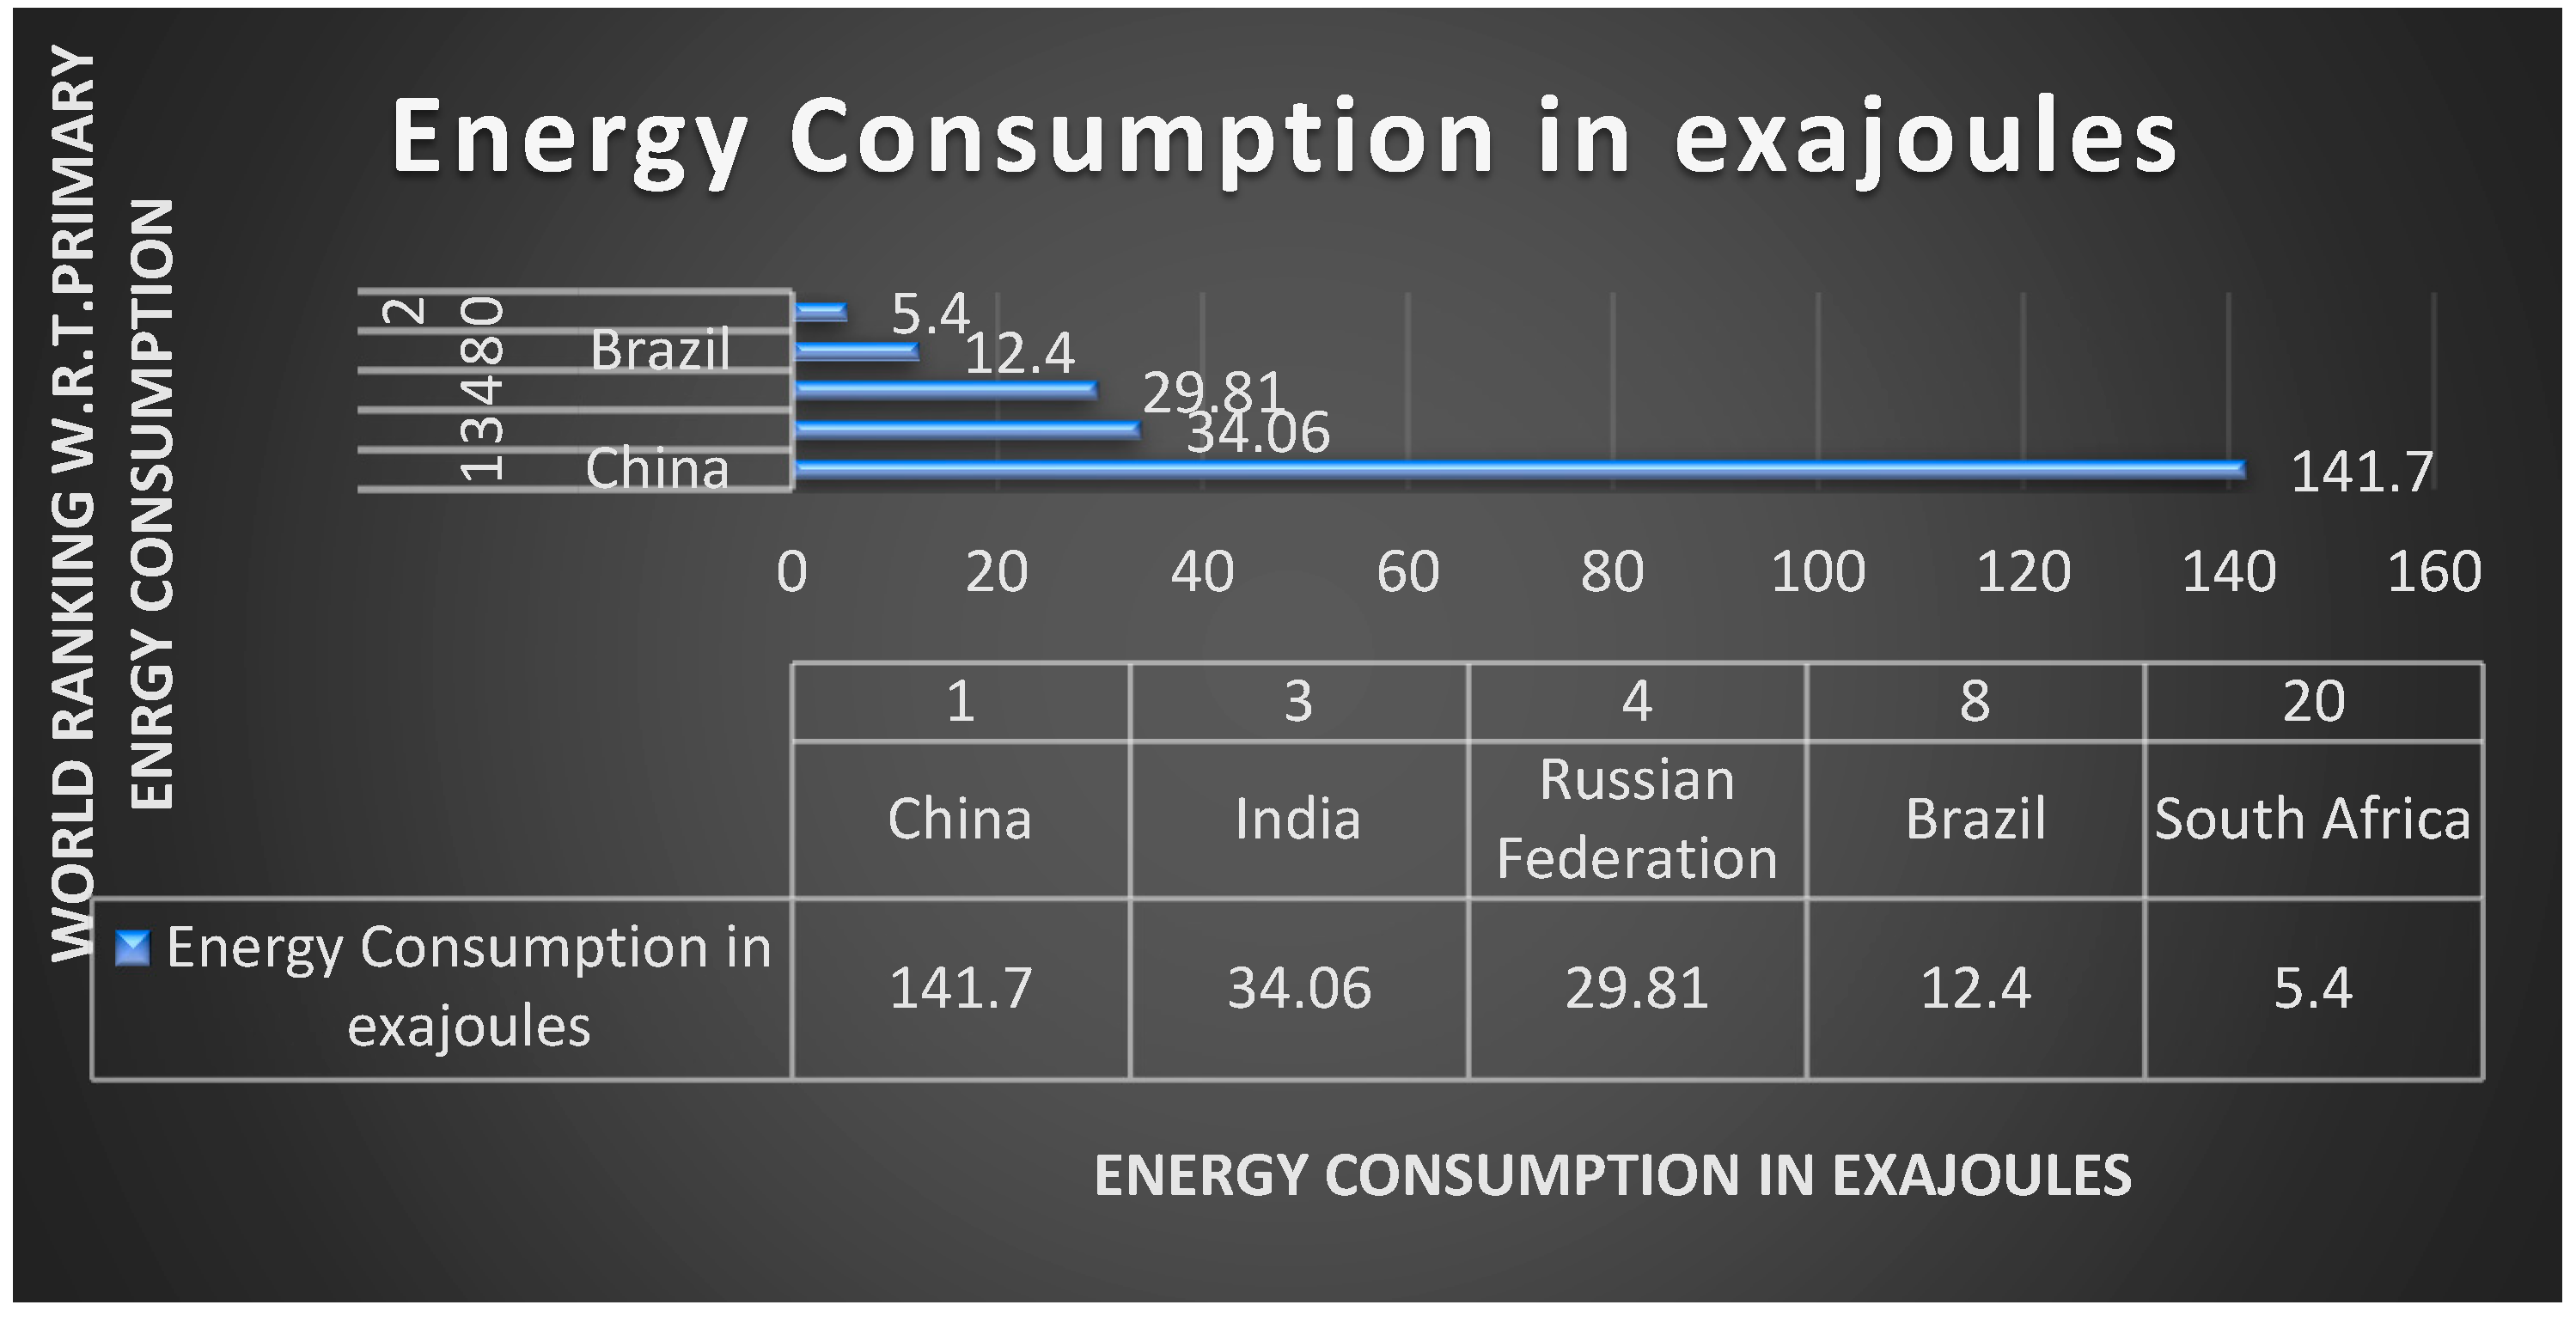
The importance of renewable energy cannot be ignored simply because the overall economic growth of the country mainly depends upon the consumption of energy. Economic growth and energy consumption go hand in hand with economic development and at present, all of the BRICS countries are classified as upper-middle-income economies. Economic development is taking place at a rapid pace, leading to the ever-increasing demand for energy. The main source of energy in the case of these developing economies is still conventional fossil fuels. The economic growth and dependence on fossil fuels for their energy requirements have created two major challenges, the first one being the sustaining of economic growth and the second being ensuring the continuous supply of energy at affordable prices. These economies are all heavily dependent upon the import of fossil fuels. These countries are ranked at the top of the list when it comes to the consumption of primary energy (the net demand for energy by country is known as primary energy consumption), and except for South Africa, are ranked amongst the top ten consumers of primary energy. Given the fact that only the Russian Federation can be considered as a major exporter of LPG and oil, all of the other nations are heavily dependent upon the import of fossil fuels, which accounts for a major portion of their imports. The summarized statistics of these countries related to the energy consumption of primary energy are provided in
Figure 1 below.
The selection of BRICS countries is based upon the Gini index (Gini index measures the extent to which the distribution of income or consumption expenditure among individuals or households within an economy deviates from a perfectly equal distribution)
. The GINI index of all BRICS countries can be found between 43 and 58, which provides us with a certain base for comparison. This is presented in
Figure 2 below.
Besides these, all of these countries have great potential for growth coupled with huge human and natural resource pools. All of these countries have operational stock exchanges. Their economic growth is fast-paced and overall yield is higher as compared to the developed economies. This is also taking into account that the overall country-specific risk in these countries is higher than that in developed countries—the return outweighs the risk factor [
14]. One of the main challenges in research related to measuring the contribution of renewable energy towards economic growth is the use of a singular model or techniques that may not be appropriate for the generalization of the results.
This study utilizes the application of multiple econometric-based models, which include the “Cross Dependency” test, the unit root test, and “CIPS” (cross-sectional augmented IPS), to measure the contribution of renewable energy towards economic growth. Along with this the second generation, stochastic models based upon econometrics, such as the DOLS test (dynamic ordinary least square) and the FMOLS (fully modified ordinary least square), are also applied for verification of the contribution of renewable energy towards the economic growth of the BRICS countries. Alongside these, one of the defining characteristics of the study relates to the application of sensitivity analysis to gauge the impact of GDP growth on CO2 emissions, and use of a regression model to identify the nature and magnitude of the relationship between the growth in GDP and increase in CO2 emissions. These helped in creating an EKC, which provided us with a turning point after which the relationship between CO2 emissions and economic growth become negative as the BRICS nations continue to increase the use of renewable energy to power economic growth.
The novelty of the study mainly stems from fact that these models are seldom applied in tandem and especially in the BRICS countries. This main distinction of the study defines its contribution towards the prevailing literature on the topic, as it includes the panel data of five emerging economies. Previous studies have either concentrated on developed countries or mostly centered around BRICS countries, as compared to the present study whose panel data cover a wide range of geographical regions of the world and which focuses on sustainable economic development. This is important, as these developing economies are pursuing the transition from conventional sources of energy mainly based upon the use of fossil fuels to renewable sources of energy to contribute to global efforts of environmental protection and sustainable economic development [
15,
16]. The present study aims to explore the impact of changes in the consumption and production of energy obtained from renewable sources on the overall growth of the economy, as through a thorough study of literature it was found that there was no comprehensive study that addresses this fundamental question in the context of economies of BRICS countries.
The results of the study indicate that the existence of the bi-directional relationship between the use of renewable energy and economic growth is mainly indicated by an increase in GDP, thus lending support to the feedback hypothesis. Moreover, the conservation hypothesis was proven by the existence of a unidirectional causality relationship between the use of renewable energy and CO2 emissions. Thus, it can be deduced that increase in CO2 emission is of major concern for the BRICS countries, which has led them to increase the production of renewable energy. Based upon the findings of the present study it is recommended that policymakers should encourage the use of renewable energy by offering incentives in financial terms, such as interest-free or low-interest loans, subsidies and feed-in tariffs. The results of sensitivity analysis also indicate that the rapid economic growth of BRICS nations also coincides with an increase in CO2 emissions; however, as the EK curve indicates that as these nations increase the share of renewable energy in overall energy consumption, this will not only increase the growth of GDP but will also decrease CO2 emissions in the long term. Thus, this proves the EKC theory in the context of BRICS nations.
2. Literature Review
The production process requires a great deal of energy and economic progress mainly relies on this process; thus, energy is considered as the backbone of modern industrial development, which in turn generates economic growth. Modern economic growth mainly depends upon energy consumption. The unit elasticity theory, which tends to measure the change in economic growth concerning change in energy consumption, has gained much prominence after the oil crisis of 1973, also known as the C74 crisis, and its impact on the OECD countries during this period. The unit elasticity for energy usage after that period has been recorded as less than 1%, which signifies that 1% economic growth requires a less than 1% increase in energy usage as far as OECD countries were concerned [
17,
18]. However, no one can deny the critical role energy consumption plays in generating GDP growth, mainly via industrial development. In terms of unit elasticity, in developing countries the figure is greater than one, while in developed countries it has been less than one since 1973.
In connection with the above-mentioned arguments, the major question that arises predominantly relates to how their adoption of renewable energy sources in the presence of economic constraints can be measured. This question has been subject to a great deal of research globally [
11,
19,
20]. The research targeting this question is related to the contribution of renewable energy towards sustainable economic growth (by contributing to the growth of their GDP) [
11]. The investment in renewable energy sources represents a sensible decision. The main purpose of this study is to explore the effects that the use of energy obtained from renewable sources have on CO
2 emissions and economic growth in the long term.
To further press our point regarding the limited research conducted on the BRICS nations regarding exploring the relationship between the use of renewable energy, economic growth, and CO
2,
Table 1 was created, which contains a summary of the most relevant literature on the topic. It is evident from the table that the research on the relationship between renewable energy, economic growth and CO
2 emissions in the BRICS nations can be considered limited; hence, the methodologies of this research as well as the comprehensive data set represent the novelty and importance of this study, as it is apparent that the majority of the studies have concentrated on developed and emerging markets, bypassing the BRICS economies. Given the importance of BRICS nations in the global economic system, it is paramount that the above-mentioned relationships are explored in the context of these countries [
21,
22].
There are volumes of research on the relationship between economic development, use of renewable energy and CO
2 emissions, but to provide a snapshot of previous research on the topic
Table 1 was created, containing the summarized form of the most relevant research.
When one analyses the existing literature, it is discovered that Barney and Franzi [
23] were the first academics to discuss the correlation between the consumption of energy and the growth of the economy. This was later followed by Schurr et al. [
24], who discussed how the living standards of the general public can be improved by increasing the consumption of energy to fuel economic growth. Barney and Franzi [
23] further investigated the role of energy consumption as a key element of the growth of the economy, as it stimulates industrial growth leading to an increase in GDP.
Fang [
25] used a regression-based model to ascertain the impact of renewable energy on the growth of Chinese GDP; they attributed 0.162% of growth in Chinese GDP to the use of renewable energy consumption. They also concluded that a 1% increase in the use of renewable energy in China led to increased growth rate with 0.44% among rural households. Besides this research, [
26] explored the strength of the relationship between the use of renewable sources of energy and the Chinese economy and concluded that the nature of the relationship was positive and bilateral. The major problem associated with the use of fossil fuels is not only the amount of environmental degradation but also of its impact on human health [
25]. The cost associated with such externalities tends to increase the net cost of fossil fuel-based energy many times over. In contrast, the same cost of externalities associated with renewable energy is minimal. At the same time, a major obstacle to renewable energy sources seems to be political barriers, such as obstructive policies based upon self-interest, problems related to coordination of activities, and problems related to geopolitical issues. These problems are further compounded by the limited research in the area [
18,
25].
Menegaki [
8] used a random effect model along with a model based upon panel error correction to determine the cointegration and validity of a neutrality hypothesis, respectively, using the data of twenty-seven European countries, and found evidence in favor of the neutrality hypothesis, which stated that renewable energy sources had a limited contribution towards their economic growth. Meanwhile, the study of Lean and Smyth [
27] found evidence in favor of the conservative hypothesis. They broke up energy consumption by types of fossil fuel, such as diesel and petrol, and examined their correlation with Malaysian economic growth. Their research indicated that there was a great deal of reliance on petrol and diesel for economic growth. The replacement of these fossil fuels with renewable energy sources, such as biodiesel, posed no threat to economic growth. The utilization of renewable energy resources and their impact on economic growth was also analyzed by Ferroukhi et al [
28]. This study tended to prove that scaling up renewable sources made economies much more competitive and presented opportunities for fulfilling global energy requirements, keeping in view the population growth; scaling up could also contribute to human welfare. The main reason stems from the fact that renewable sources increased the overall productivity of land and other natural resources; therefore, the trade-off between consumption of fossil fuel and economic growth can easily be ruled out. The adverse impact of economic development on the increase in CO
2 emissions is well documented, as pointed out by Aguinis [
20]. They employed panel spatial SEM and (GS2SLS) on (EU) countries and concluded that there exists a positive relationship between economic development and increase in CO
2 emissions; at the same time, they concluded that use of renewable energy sources seems to greatly reduce the overall level of CO
2 emissions. Shayanmehr [
21] and Nathaniel et al. [
22] had earlier noted the negative impact of CO
2 emissions on the economy in terms of climate change, as they concluded that even a small percentage change in CO
2 emissions tends to have a disastrous impact on food security and overall economic wellbeing of countries. They cited that this change mainly results from the changes in climatic patterns, which harm crops and cause issues of food security which in turn results in economic problems. Given the fact that most of the BRICS countries are or would face these issues in coming times, the issues related to CO
2 emissions need to be addressed on an urgent basis. Another issue that was highlighted by Barney and Franzi [
23] related to efficient usage of renewable energy sources for industrial growth, as many of the renewable energy sources tend to be more efficient as compared to fossil fuel-based energy sources, and many of the industries in China which have adopted these sources saw more efficiency in terms of production.
The economic progress of any nation is marred by environmental degradation, as the increase in economic activity results in an increase in CO
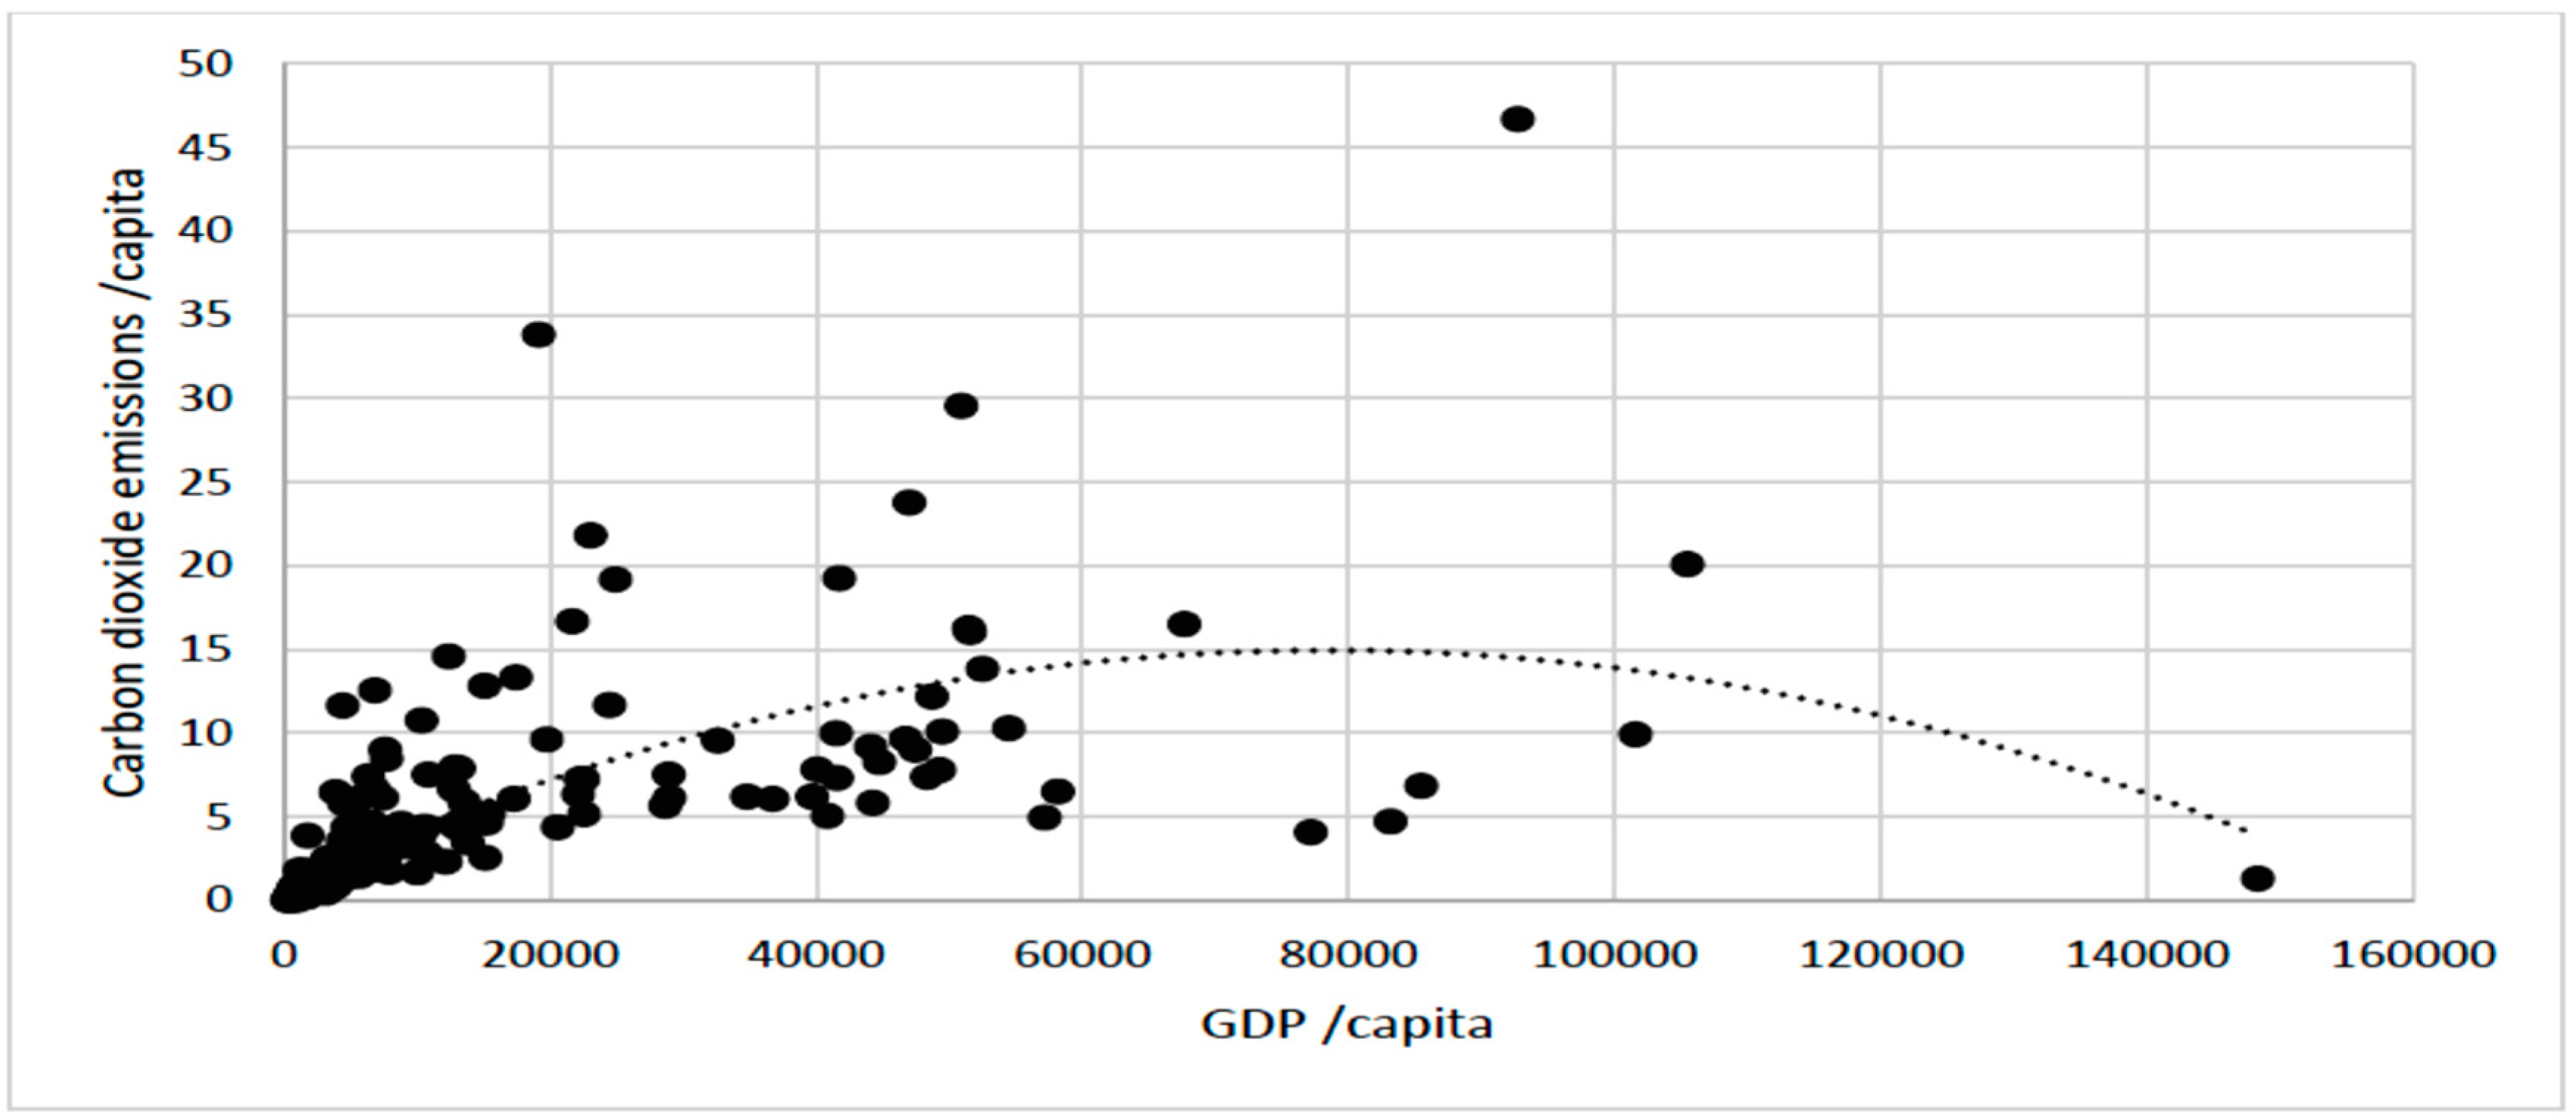
2 emissions as industrial and urban activities increase. This notion is widely held as fact, but many researchers note that this relationship exists but is more complex than usually thought of. This notion has been the subject of many studies, but the results are usually mixed. The present study also intends to investigate this relationship using sensitivity analysis. In this context, one cannot ignore the importance of the EKC (Environmental Kuznets Curve), as this curve indicates a point from which the relationship between economic growth and CO
2 emissions becomes negative. The EKC curve resembles an inverted U-shaped curve and is indicative of a negative relationship between CO
2 emissions and economic growth, which is represented by per capita GDP. This curve mainly depicts the impact of economic growth on the inequality of income distribution. The curve is based upon the EKC theory, which holds that once the economies of countries start the transition from agricultural economies to industrial economies, industrial production increases and, as a result, CO
2 emissions also increase. As a result of industrialization, the average income of households increases rapidly. With higher income levels heavy industrial production tends to be phased out and replaced with high-tech products, which tend to use less energy and can be powered by renewable energy sources. This also results in the development of the services sector, whose carbon footprint is much smaller than the industrial sector. This development also results in a decrease in the population growth rate, and the consumer tends to become more sensitive about the use of cleaner sources of energy by both the industrial and service sectors, forcing governments to formulate environmentally friendly regulations [
29,
30,
31]. One such example from BRICS countries is that of China.
From the analysis of the present literature, it can safely be concluded that the volume of research on the topic suggests that there is a certain limitation when it comes to the utilization of renewable energy sources for sustaining economic growth. The main limitations include the inconclusive evidence in favor of the positive relationship between economic growth and utilization of renewable energy, as different studies tend to prove different contradictory theories. Although the hypothesis of growth seems to find support amongst these studies, it is still not accepted by most of the studies. This has led to the strong incentive for further studies of the energy conservation hypothesis. Studies on the specific issues related to the consumption of renewable energy seem to be lacking, as previous studies have seldom addressed the impact of changes in production and consumption of renewable energy on overall economic growth.
3. Research Methodology
This study aims to examine three key issues. First, the impact of energy obtained from renewable sources on economic growth. Second, the impact of energy obtained from renewable sources on the emissions of CO2 by the BRICS countries selected for the present research. The third issue relates to the sensitivity of CO2 emissions to economic growth and whether or not the EKC theory can be proven in the case of BRICS nations.
The study intends to examine the correlation amongst these factors by application of the production function suggested by Pesaran [
32].
To achieve the objectives of the study, the following models were developed. The first model will be used to determine the relationship between economic growth and the use of renewable energy, formulated as:
In the above equation:
i denotes the country;
t denotes the time period;
GDP denotes the “Gross Domestic Product” of the country, which is an established measure of economic output for every country;
RESit denotes the use of renewable energy sources by the country over the given time period;
NRESit denotes the use of non-renewable (fossil fuel-based) energy sources by the country over the given time period;
K denotes the gross fixed capital formation, taken as constant at 2010 and measured in US dollars;
L denotes the labor force.
The consumption of energy from both sources, i.e., renewable and non-renewable, is measured by “Tera Joules rules”.
Since one of the main goals of this study relates to measuring the impact of energy consumption on CO2 emission, the second model was constructed. This model mainly aims to analyze the relationship between Carbon dioxide emission and consumption of renewable and non-renewable sources of energy (fossil fuel-based). Contrary to popular belief, even though the carbon footprint of the renewable sources may be minimum—or in some cases even neutral—its utilization in both domestic and industrial setups does create a significant carbon footprint.
The model is expressed as follows:
In the above equation:
i denotes the country;
t denotes the time period;
CO2it denotes the emission of CO2 as a result of the energy consumption regardless of the source;
Yit denotes the utilization of the energy by the given country over a given period of time;
RESit denotes the use of renewable energy sources by the country over the given time period;
NRESit denotes the use of non-renewable (fossil fuel-based) energy sources by the country over the given time period.
We used the panel unit root test to determine the relationship between said variables of model II. This test helped us to categorise the issue of stationarity between the variables. Since the study discovered stationarity between the variables, the panel co-integration test had to be applied. To eliminate the issue of cointegration between the variable, the study has to resort to the FMOLS test (fully modified ordinary least square) along with DOLS (dynamic ordinary least square), as these tests enabled us to determine the unit elasticity in the long term.
To conduct sensitivity analysis for BRICS countries the study adopted a simple regression model:
The variables used for the above model are explained below:
β0 denotes the constant of the regression model;
βx represents the coefficient for variable x which is CO2 emissions;
GDP/Capita represents the variable of GDP per capita for BRICS countries;
(GDP/Capita)2 represents the variable of GDP per capita squared for BRICS;
RESit denotes the use of renewable energy sources by the country over the given time
Period;
NRESit denotes the use of non-renewable (fossil fuel-based) energy sources by the
country over the given time period;
ε = denotes the error term.
In the above model, CO2 is considered the dependent variable and is expressed in terms of tons, which is considered to be a standard international measure; CO2 symbolizes the number of pollutants produced as it is also considered to be the main contributor to global warming and degradation of the environment globally. Therefore, it is of utmost importance to gauge the adverse impact brought about by the increase in GDP on the environment. Meanwhile, we included GDP per capita as the main variable in the study as it is considered as representative of the economic growth and social wellbeing of the nations; it is measured in US dollars. The reason for including (GDP/Capita)2 as this variable is that it makes the construction of the Brundtland or EKC curve possible, as both of these curves are polynomial. These curves enable the researchers to gauge the sensitivity of the growth in GDP concerning the increase in CO2 with respect to increase in GDP.
4. Results and Discussion
4.1. Panel Unit Root Test
The most crucial factor for the selection of unit root tests is the testing of cross-sectional interdependence in the panel data. The unit testing categorized as first-generation is mainly based upon the hypothesis of cross-sectional independence [
33]. Meanwhile, unit root tests classified as the second generation can be applied even with the presence of cross-sectional dependence [
32]. The CD test is centered on a means of all pairs of correlation coefficients between the OLS residuals acquired from standard augmented Dickey–Fuller regressions for all panel variables [
32]. The result of the CD test is provided in
Table 2.
ECT reveals the coefficient of the error correction term. The number of appropriate lags is two according to the Schwarz information criterion.
The results of the above table indicate the presence of cross-section dependence on the panel data set; therefore, this indicates that all units of the cross-sectional data used for the present research are correlated to each other, pointing to a common factor all units of the data. In our case, this is held to be their impact on the GDP.
4.2. Fully Modified Ordinary Least Square (FMOLS)
A fully modified ordinary least square (FMOLS) test was used to determine elasticity between the variables in the long term. The fully modified OLS test was first introduced by Pedroni [
34] to resolve issues of simultaneity bias, serial correlation, and issues related to non-homogeneity. This test also enables one to attain asymptotically reliable estimations in series of panel data [
34].
The results of this test are provided in
Table 3. Model 1 shows that a 1% increase in renewable energy leads to an increase in GDP by 0.16%, while the increase in 1% of non-renewable energy leads to an increase of 0.20% in GDP. Overall results in model 1 show that renewable and non-renewable energy both positively affect the GDP and results significantly.
Results in model 2 show an increase in GDP of 1% leads to an increase in CO2 of 31%, while a 1% increase in renewable energy leads to an increase of only 0.11% in CO2; contrastingly, a 1% increase in non-renewable energy leads to 0.4% in CO2. Overall results in model 2 show that non-renewable energy contributes more to CO2 as compared to GDP.
4.3. Dynamic Ordinary Least Square (DOLS) Test
Dynamic ordinary least square (DOLS) test was chosen based upon its qualities of robustness, which are of paramount importance in cases where the sample size is small; in such cases, it tends to outperform FMOLS and OLS as it estimates the unbiased estimators for small samples. This method is also deemed superior to DOLS when it comes to controlling of biases of endogeneity [
35]. The results of DOLS for elasticity in the long run for panel data are presented in
Table 4.
The results of DOLS for model 1 indicate that increasing the consumption of energy drawn from the renewable sources by 1% resulted in an increase in GDP growth of 0.26%, while increasing the consumption of non-renewable energy only contributed to an increase in GDP of 0.19%. Meanwhile, the results of model 2 indicate that a 1% increase in consumption of renewable energy resulted in an increase in CO2 emission of 0.11%, while the increase in consumption of fossil fuel-based energy resulted in an increase in CO2 emission of 0.19%. Our results obtained from the DOLS test and FMOLS test have confirmed that the use of renewable resources not only contributes to an increase in GDP, but also does so in a much more efficient manner as compared to conventional sources of energy.
4.4. Sensitivity Analysis
The sensitivity analysis of the BRICS countries using model 3 indicates a positive relationship between the increase in GDP and CO
2 emissions. These results indicate that as the BRICS economies grow, the amount of CO
2 emissions also increases as a result of increased industrial and economic activities, which is not surprising. The statistics of the model are provided in
Table 5 and please refer to
Figure 3 and
Figure 4.
This relationship becomes negative after a certain level, indicative of a possible polynomial form similar to the inverse U-shape of the EKC, known as the turning point. This indicates that after achieving higher GDP due to usage of renewable sources of energy the relationship between CO2 emission and GDP growth becomes negative, as indicated by the results. According to the results of the study, the usage of renewable sources of energy greatly decreases CO2 emissions. According to statistics, after the turning point, an increase of a single dollar in per capita GDP corresponds to a 1.44965 mg increase in CO2, given that other factors remain constant.
Based upon the results of the study it is quite evident that the use of renewable sources of energy not only has a positive impact on the environment in terms of carbon emission, as it emits less than fossil fuel-based energy sources, but also provides economic benefits Thus, this research confirms the important role renewable energy sources play in economic development alongside minimizing CO2 emissions at the global level. The positive results of both tests indicate a bright future for renewable energy sources, as these sources not only ensure continuous economic growth at a much higher pace than conventional sources but also have a minimal environmental impact as well. Thus, it can be concluded that green economic growth in BRICS nations can easily be fueled by renewable sources.
5. Conclusions, Limitations, and Future Research
The BRICS nations have been paying a great deal of attention to the development of alternative energy sources in the form of renewable energy resources. The results of the present study indicate support for the use of renewable energy resources, as these resources are less detrimental to the overall environment and ecosystems. The use of renewable energy resources produces considerably less CO2 emissions as compared to non-renewable sources. Our conclusion is in line with the previous research and is generally held as fact. The sustainable economic growth of developing countries is closely linked to the utilization of renewable sources. The results of the sensitivity analysis indicate that with an increase in economic growth—represented by an increase in GDP per capita—CO2 emissions also tend to increase as a result of increased economic and industrial activity, thus representing a significant positive relationship. Meanwhile, the EK curve indicates that once these economies reach a certain level of economic growth in terms of per capita GDP, this relationship becomes negative, as these nations continue to increase the use of renewable energy, which would decrease their carbon footprint as renewable energy consumption significantly reduces the CO2 emissions.
At the same time, these projects require further investment, both from governments and the private sector, as part of an appropriate ‘policy package’, rather than focusing on standalone policies.
Presently, the primary policies regarding the promotion of renewable energy include policies related to providing subsidies for importing and manufacturing alternative energy sources, lowering the interest rates on loans for starting and adopting such technologies, and allowing the trading of green certificates to generate electricity using such sources. Besides these, fixing tariffs and providing price guarantees for green electricity production are also vital components of such policies [
36]. The results of this study indicate that renewable energy consumption has a much greater impact on the pace of economic growth, which is also backed by fact that most BRICS countries have already started to shift from conventional energy sources to renewable energy sources. This sector in these countries has taken off and is starting to mature with time. Producers of renewable energy sources can take advantage of incentives such as green certifications, standardization of green portfolios, and application of feed-in tariffs to accelerate the shift in investment from fossil fuels to renewable energy sources. In this respect, India, South Africa, and China have taken considerable measures for the advancement of such technologies.
Future directions include the formation of public–private partnerships, steps for the development of the market for alternative energy sources, tax incentives, and providing interest-free or low-interest financing to encourage such projects. Besides these, research on the topic also needs to encourage further development of these technologies. The main issues in developing countries comprise political problems, socio-economic issues and problems related to barriers present in the markets. These barriers can be reduced by incorporating policies which tend to minimize risk related to such projects so the cost can be reduced. Alongside this, governments need to encourage a single-window system for the establishment of these projects, as compared to the present complex loan processes. One possible way of removing this barrier includes the formation of public–private partnerships to encourage investment in renewable energy production. The present paper for the purpose of analysis included the renewable energy sources as identified by EIA, which includes solar, wind power, biofuels, and biomass along with hydroelectric energy. This study refrains from including nuclear energy as a renewable energy source, as per the guidelines of EIA.
In the future, researchers can expand upon the present study by analyzing the relationship between economic growth and the generation of nuclear energy. Another issue that can be explored by researchers relates to the production of some of the biofuels such as palm, corn, and other crop-based fuels, as an increase in their production is the main cause of deforestation in tropical regions, causing loss of biodiversity along with the displacement of crops used for food production, which might cause food crises in the future. The research considers the production of renewable energy from biofuels. Biodiesel is made from palm oil, corn oil, and other such crops [
15]. To ensure the sustainable aspect of renewable energy sources, one has to ensure efficiency in terms of production and utilization of these fuels, which also presents another aspect for future researchers to consider.
The main limitation of this study also stems from the fact this study employed the Cobb–Douglas test, as this test suffers from some limitations; functions such as CES might seem to be more appropriate, but they cannot be transformed into log-linear form and this research includes log-linear transformation, hence the decision to opt for the Cobb– Douglas function.


 ,
, 


