Article

Optimization of Hydrolysis-Acidogenesis Phase of Swine Manure for Biogas Production Using Two-Stage Anaerobic Fermentation

1
Green Energy and Biotechnology Industry Research Center, Feng Chia University, Taichung City 40724, Taiwan
2
Master’s Program of Green Energy Science and Technology, Feng Chia University, Taichung City 40724, Taiwan
3
Department of Environmental Engineering and Science, Feng Chia University, Taichung City 40724, Taiwan
4
Department of Chemical and Environmental Engineering, Faculty of Science and Engineering, University of Nottingham Malaysia, Semenyih 43500, Selangor, Malaysia
5
Professional Master’s Program for Intelligent Manufacturing and Engineering Management, Feng Chia University, Taichung City 40724, Taiwan
6
Department of Landscape Architecture, Chung Chou University of Science and Technology, Changhwa 51000, Taiwan
*
Authors to whom correspondence should be addressed.
These authors contributed equally to this work.
Submission received: 30 June 2021 / Revised: 23 July 2021 / Accepted: 28 July 2021 / Published: 29 July 2021
(This article belongs to the Special Issue Redesign Processes in the Age of the Fourth Industrial Revolution)

Abstract

:
The traditional pig manure wastewater treatment in Taiwan has been low in methane production efficiency due to unstable influent concentration, wastewater volume, and quality. Two-stage anaerobic systems, in contrast, have the advantage of buffering the organic loading rate in the first stage (hydrolysis-acidogenesis phase), allowing a more constant feeding rate to the second stage (methanogenesis phase). Response surface methodology was applied to optimize the operational period (0.5–2.0 d) and initial operational pH (4–10) for hydrolysis and acidogenesis of the swine manure (total solid 5.3%) at 35 °C in batch operation mode. A methanogenesis verification experiment with the optimal condition of operational period 1.5 d and pH 6.5 using batch operation resulted in peak volatile acid production 7 g COD/L, methane production rate (MPR) 0.3 L-CH4/L-d, and methane yield (MY) 92 mL-CH4/g-CODre (chemical oxygen demand removed). Moreover, a two-stage system including a hydrolysis-acidogenesis reactor with the optimal operating condition and a methanogenesis reactor provided an average MPR 163 mL/L-d and MY 38 mL/g volatile solids, which values are 60% higher than those of a single-stage system; both systems have similar dominant methane-producing species of Firmicutes and Bacteroidetes with each having around 30%–40%. The advantages of a two-stage anaerobic fermentation system in treating swine manure for biogas production are obvious.

1. Introduction

The swine industry in Taiwan was mainly small-scale and decentralized in the early stage, and most of the swine manure was applied in the form of liquid fertilizer or compost to provide nutrients for crops. Currently, the disposal of manure has become a major public concern due to its huge potential threat to public health and depletion of natural resources if improperly managed [1,2,3]. The hog numbers are about 5.5 million heads, and the daily livestock slurry quantity is about 163,000 m3 from all swine farms in Taiwan [4]. The methane production yields from swine manure have been reported as 403 mL CH4/g VSadd (volatile solids added) [5]. If all the swine manure in Taiwan is converted to biogas by anaerobic digestion, predictable annual biogas production is 323,609,000 m3, and its bioelectricity would reduce the CO2 emissions of 362,813 tons annually. Carbon emission reduction is one of the important topics to promote a sustainable living world [6,7].
The anaerobic fermentation process applies a variety of microorganisms to convert complex organic matters into methane, carbon dioxide, water, hydrogen sulfide, ammonia, etc. Methane fermentation is a complex process including four phases: hydrolysis, acidogenesis, acetogenesis, and methanogenesis. Hydrolysis is usually considered a rate-limiting step because it relates to the conversion of complex organic matter (carbohydrates, lipids, and proteins) into soluble organic molecules (sugars, long-chain fatty acids, and amino acids) [8]. Many factors (such as temperature, reaction time, composition of organic matter, particles size of substrate, pH, hydrolyzed products (such as volatile fatty acids) concentration, etc.) would affect the hydrolysis efficiency [9]. Usually, carbohydrates can be hydrolyzed within a few hours, while lipids and proteins need several days, but the degradation rate of lignocellulose material is slow.
The composition of the end products in the acidogenesis and acetogenesis stages depends on fermentation conditions, substrate type, and microorganisms. These processes involve many types of symbiotic microorganisms, mainly acidogenic bacteria and methanogenic archaea. Due to the vast difference in the growth parameters and biological kinetics of the various microorganisms, the anaerobic fermentation process can be operated in two separated bioreactors to form a two-stage (hydrolysis-acidogenesis and methanogenesis phases) fermentation process. This two-stage process has advantages of being able to (1) select and enhance the microbial density and activity of each microbial community in individual reactors, (2) provide suitable substrates in the acidogenesis phase for the following methanogenesis tank, and (3) prevent a rapid pH decrease from failing the methanogenesis tank [8].
Many parameters, including substrate concentration, pH, temperature, hydraulic retention time (HRT), reactor type, and trace elements, are affecting the activities of β-glucosidase, protease, dehydrogenase to increase the abundance of hydrolytic, acetogenic, and methanogenic microorganisms [9,10]. The operational parameters of hydrolytic–acidogenic step in a two-stage anaerobic sequencing reactor system during co-digestion of tannery wastewater and tannery solid waste under mesophilic temperature have been reported to enhance the acidification products [11]. This study reveals that the optimal acidification and hydrolysis degree of 36.55% and 54.8%, respectively, were obtained at the substrate mixing ratio 50:50, HRT 5 days, organic loading rate 1.20 g COD/L-d, and pH 6.2.
Most previous studies optimize anaerobic processes with respect to only one response. The Taguchi fractional design method was used to exploit nutrient formulation for biological hydrogen production by anaerobic microflora in our previous study [12]. However, as mentioned above, there are many parameters affecting biogas production performance, especially for the two-stage system. Response surface methodology (RSM) is a powerful experimental design methodology and has been widely applied to determine the optimal operation parameter for biogas production with considering more responses [13]. The use of the statistical experimental design approach to improve the methane production in the two-stage anaerobic process is less reported. Therefore, the purpose of this work is aimed to optimize the volatile solid concentration of swine manure and the hydrolysis-acidogenesis conditions of operational time and pH in the first step by considering all of the important performance indices, such as methane production yield (MY) and methane production rate (MPR) in the methanogenesis step. Additionally, the optimal operational condition was applied in single-stage and two-stage systems with continuous operation to investigate the methane production performance and microorganism community variation.

2. Materials and Methods

2.1. Feedstock and Seed Inoculum

The feedstock was collected from a swine farm in Taichung City, Taiwan. This swine farm grows about 900 hogs and uses food waste as the main feed. The raw swine manure feedstock with the characteristics of chemical oxygen demand (COD) 37,934 mg/L, total solid (TS) 28,870 mg/L (2.9%, percentage by weight), volatile solids (VS) 21,190 mg/L, and NH3-N 1310 mg/L was collected in an adjustment tank and settled for one day before applied as the feedstock for a two-stage (two-phase) anaerobic fermentation process. The settled swine manure was separated to provide a supernatant liquid (COD 6825 mg/L, TS 4950 mg/L (0.5%, percentage by weight), vs. 2410 mg/L and NH3-N 1160 mg/L) and a settled sludge (COD 90,153 mg/L, TS 52,820 mg/L (5.3%, percentage by weight), vs. 40,460 mg/L and NH3-N 1520 mg/L).
The seed inoculum for batch and continuous methane production experiments was an effluent from a continuously stirred tank reactor (CSTR, working volume 2 L) cultivated with swine manure (TS 52,820 mg/L) at pH 7.0, temperature 35 °C and HRT 7 d.

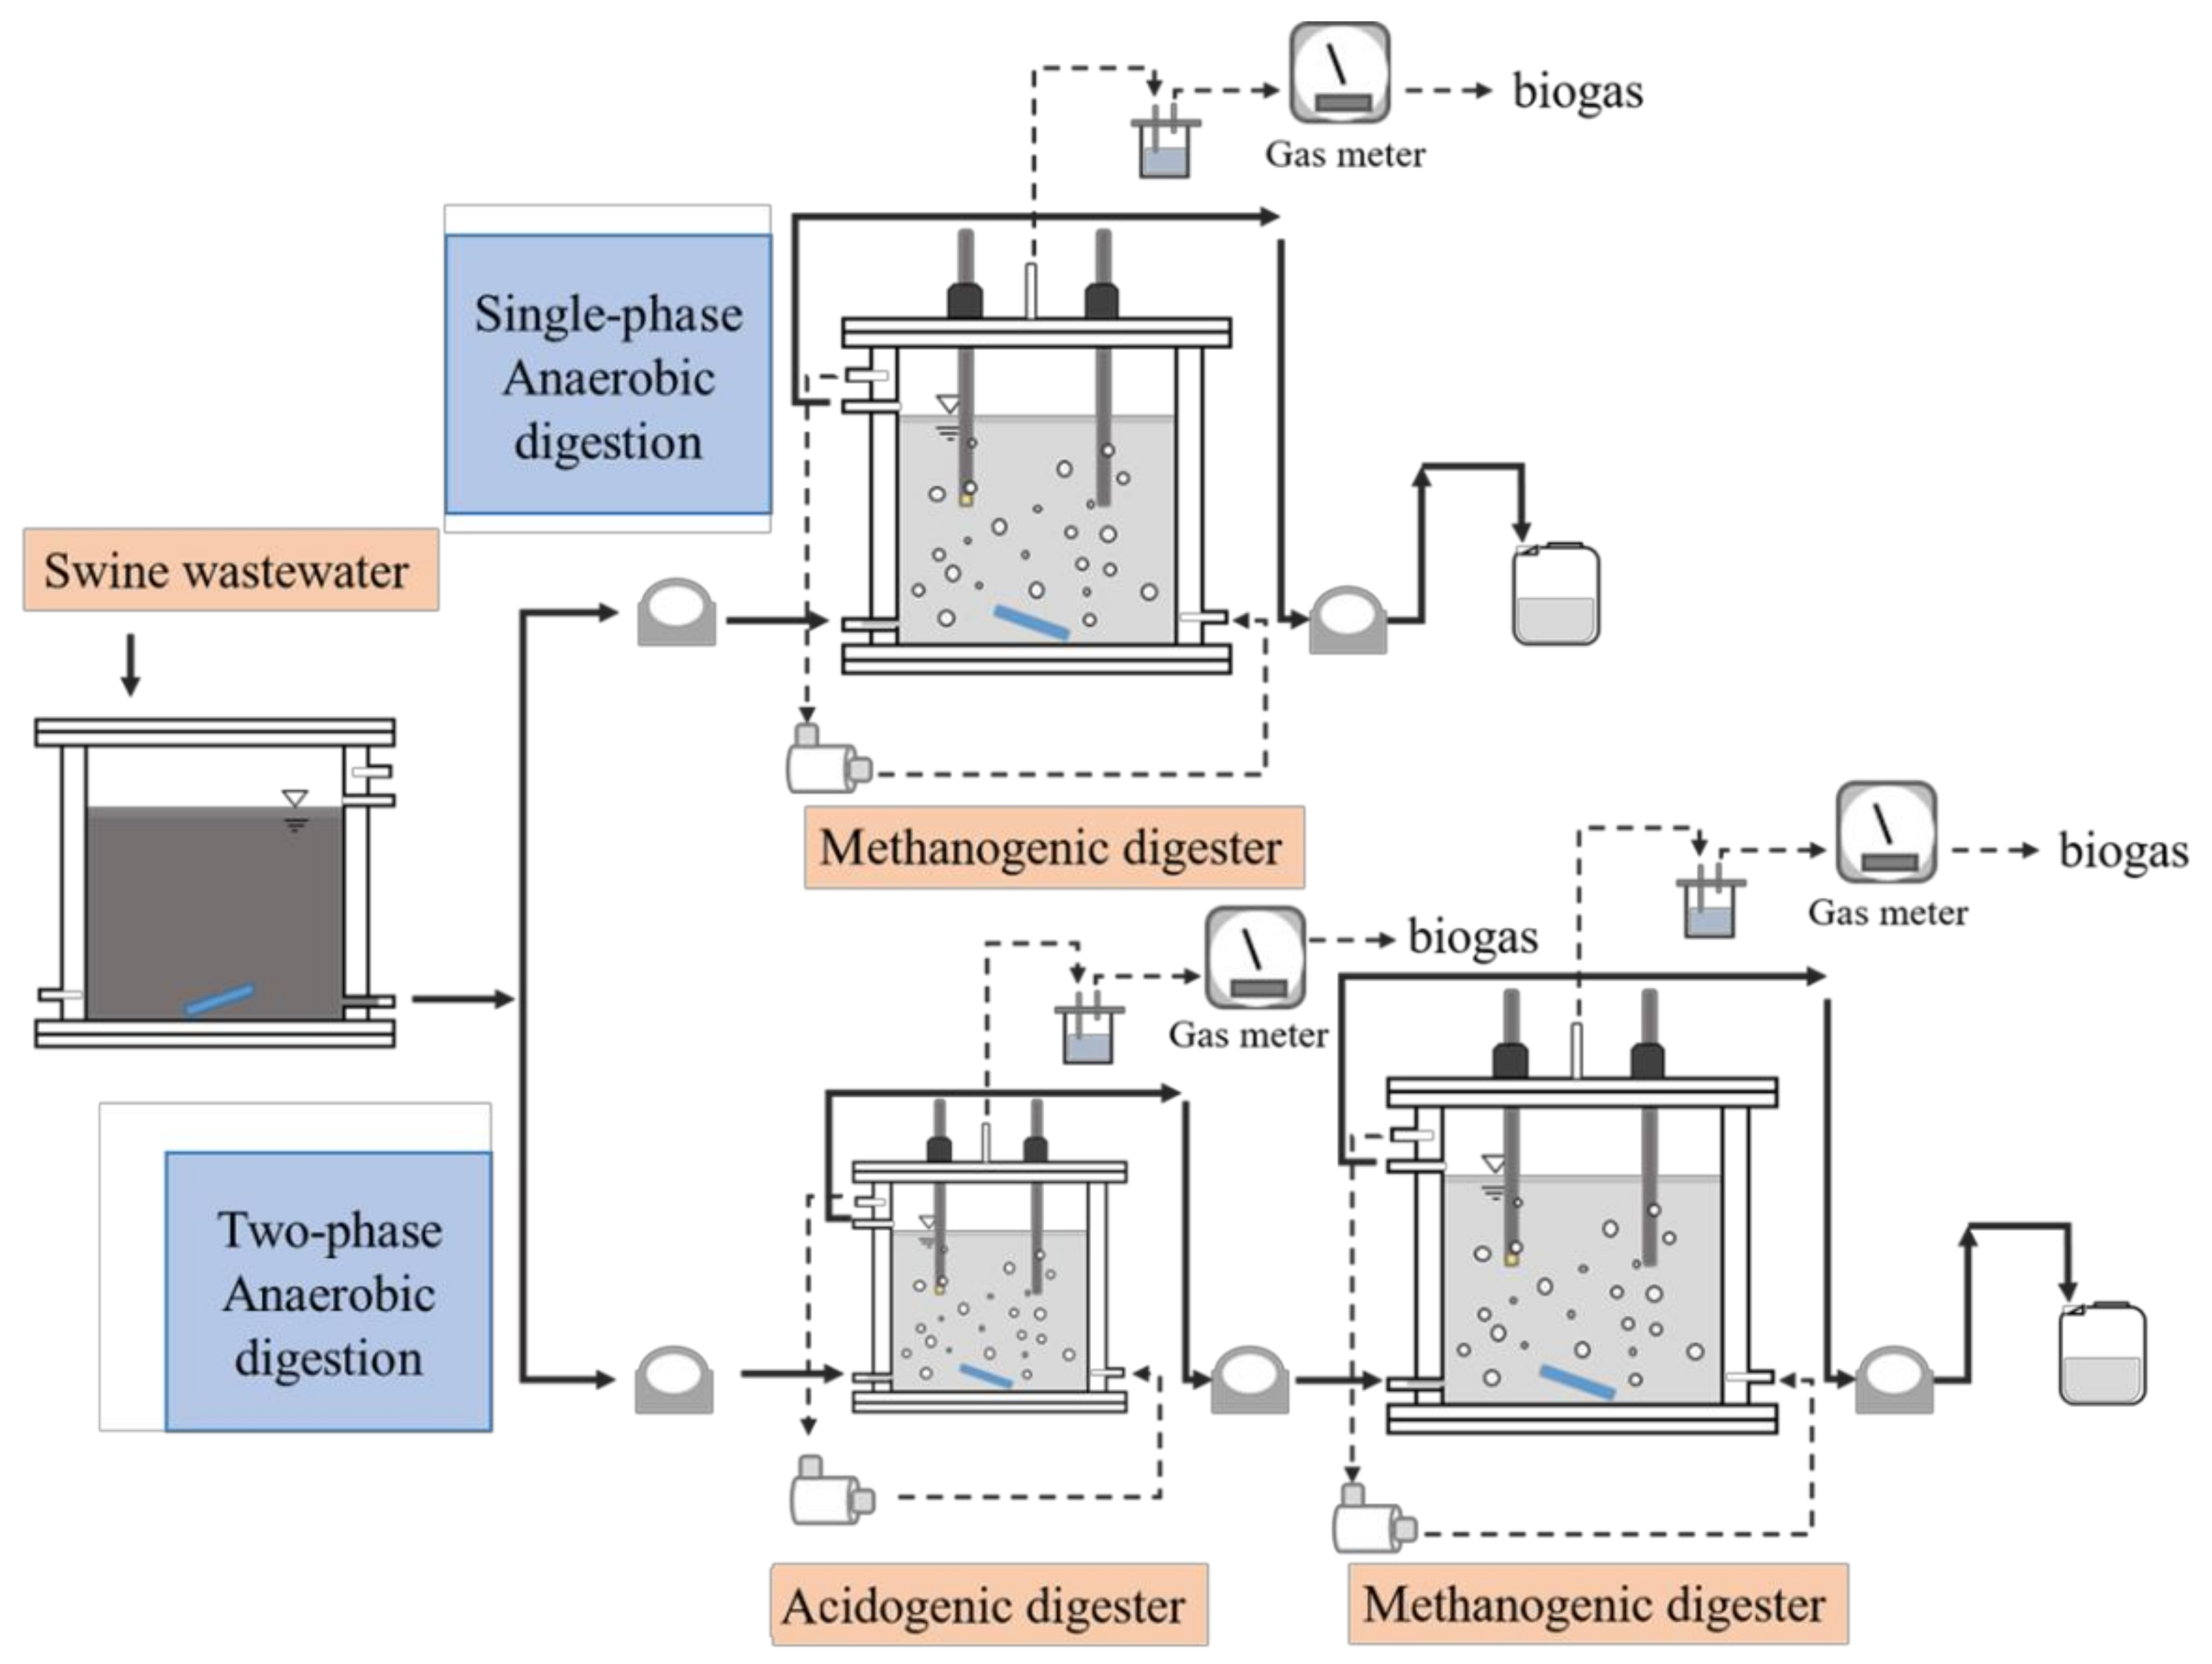
2.2. Experiment Design

Two series of experiments were conducted. Series I used batch tests with vial reactors to find out optimal operation conditions for obtaining peak biogas production. Series II used the optimal operation conditions obtained at Series I to operate single- and two-stage anaerobic systems that using CSTR fermenters to compare their biogas production performances.

2.2.1. Environmental Parameter Optimization of Methane Production in Batch Mode Operation

Effects of Solid Content on Single-Stage Fermentation

The batch methane production was performed in serum vials with a working volume of 225 mL. The weight percentage of solid content is defined as the weight of total solids over the weight of the solution. The seed inoculum (40 mL) and feedstock (40 mL) with supernatant liquid (TS 0.5%), raw swine wastewater (TS 2.9%), and settled sludge (TS 5.3%) were added into vials, and then the initial operational pH was controlled to 7.0 ± 0.2 by adding HCl solution (2.0 M). The vials were gassed with argon gas before being sealed with silicone rubber and aluminum cap, which were then placed in a reciprocal air-bath shaker at 15 rpm and 35 ± 1 °C for 30 d. The total gas production and composition were determined to measure the methane production every one to two days. The biogas production and composition were studied using the syringe method and gas chromatography, respectively, which is detailed in Section 2.3. Each experimental condition was carried out in triplicate.

Optimization of Hydrolysis-Acidogenesis Stage in Two-Stage Fermentation

The optimization experiments were performed in two stages. Stage I preliminary experiment was to select the hydrolysis-acidogenesis variables (reaction time and pH) with the range of level for designing the experimental matrix, and a biochemical methane potential (BMP) batch assays were used to elucidate the biomethane production efficiency of stage II. A full-factorial central-composite experimental design was employed in planning the batch assays to optimize the initial pH and operational time for efficient biogas production. The settled sludge feedstock (40 mL) and seed inoculum (40 mL) were mixed in serum vials (225 mL). The initial pH was adjusted with HCl solution (2.0 M) before the argon purging. The sealed vials were placed in a reciprocal air-bath shaker with 15 rpm and 35 ± 1 °C. After the hydrolysis-acidogenesis reaction, the BMP test was conducted with the reacted sludge of 30 mL and seed with methanogenic microorganisms (the effluent from the CSTR) of 60 mL. To initiate the anaerobic condition, the argon gas was expunged in the vials for 5 min after adjusting the initial pH to 4.0–10.0. All the reactors were incubated in an air-batch shaker with a mixing speed 15 rpm and 35 ± 1 °C. The total two-stage operational time for all experiments was 30 d. Each experimental condition was carried out in triplicate.

2.2.2. Continuous Operation with the Optimal Environmental Parameter Condition

For hydrolysis and acidogenesis fermentation, the optimal condition of pH 6.5, temperature 35 °C, and HRT 1.5 days obtained via the central composite design RSM method was applied in a double-layer glasses reactor (working volume 1 L). Then, the effluent of hydrolysis-acidogenesis reactor was fed into a double-layer glasses methanogenesis reactor (working volume 2 L) cultivated at pH 7.0, temperature 35 °C, and HRT 28.5 d. Another double-layer glasses reactor (working volume 2 L) was used for a single-stage fermentation with the operational condition of pH 6.5, temperature 35 °C, and HRT 30 days (Figure 1). Heat-treated (95 °C for 1 h) effluent of the CSTR was used as the seed inoculum for the hydrolysis-acidogenesis reactor of the two-stage system. Both the methanogenesis reactor of the two-stage system and the single-stage reactor were seeded with the untreated effluent of CSTR. In the start-up period, the seed inoculum and swine manure (TS 5.0%) were mixed in a volume ratio of 1:1. A semi-continuous operation strategy was applied to cultivate the two-stage system. The swine manure was fed into a hydrolysis-acidogenesis reactor every hour. The feeding frequency of the methanogenesis reactor and single-stage reactor was one time per day. The organic loading rate was fixed at 4.0 ± 0.3 g COD/L-d.

2.3. Analytical Methods

The analytical procedures of APHA Standard Methods were used to determine pH, oxidation-reduction potential (ORP), total chemical oxygen demand (TCOD), total phosphorus (TP), total Kjeldahl nitrogen (TKN), ammonia (NH3-N), and suspended solids (SS) concentrations of the liquid contents [14]. Biomass taken from the batch enrichment assays at the initial operational was also analyzed as volatile suspended solids (VSS) according to the standard methods. Ethanol and volatile fatty acids (VFAs) concentrations were analyzed with a gas chromatograph (GC) equipped with a glass column (packing, Celite® @ FON 10%) and a flame ionization detector (Shimadzu GC-2014, Kyoto, Japan). The oven, injector, and detector temperatures were 190, 200, and 200 °C, respectively, and N2 was the carrier gas. Biogas volume was determined by a gas-tight syringe in the batch experiment and wet gas meter (RITTER TG1, Schwabmünchen, Germany) at room temperature (20 °C) and pressure (760 mm Hg) [15,16,17,18,19]. The composition of the product gas in the batch enrichment assays and continuous systems was measured with a CHINA Chromatography 8700T GC equipped with a stainless steel column (packing, Porapak Q) and a thermal conductivity detector. Oven, injector, and detector temperatures were all at 40 °C, and argon was the carrier gas.

2.4. Statistical Study

RSM was used to highlight the relationship between the response functions and variables [20]. The methane production efficiency can be optimized by means of the existing relationship between the response functions and process variables. In this study, MY is defined as the methane production per gram of added swine manure (mL CH4/g VSadd), and MPR is defined as the methane production per reactor’s working volume per day (L CH4/L-d); they were used as the response variables. For the batch test, peak MY and MPR values were determined based on the methane production potential and maximum MPR data obtained from the modified Gompertz equation (Equation (1)) [21].
H t = P · exp exp R m · e P λ t + 1
where H(t) is the cumulative methane production (mL); P is the methane production potential (mL); Rm is the maximum methane production rate (mL/h); e is 2.71828; λ is the lag phase time (h); and t is the operational time (h).
Experimental data given by CCD-RSM were used for generating the best fit for second-order polynomial regression in two variables as follows (Equation (2)):
Y = β0 + β1X1 + β2X2 + β11X12 + β22X22 + β12X1X2
where Y is the response of the dependent variable of MY (mL CH4/g VSadd) and MPR (mL CH4/L-d); β0, β1, and β2 represent linear coefficients; β11 and β22 represent quadratic coefficients; β12 represents an interaction coefficient; and X1 and X2 represent the independent variables, viz., hydrolysis-acidogenesis reaction time and pH, respectively. Interactions between independent variables and their effective relationship with response were analyzed by performing an analysis of variance (ANOVA) to check the model adequacy. Sigmaplot Software (trial version 9.0, Systat Software Inc., San Jose, CA, USA) was used for regression and graphical analysis of the obtained data, respectively.

2.5. Molecular Microbial Analysis

The stable microbial sludge in the reaction tank was subjected to DNA extraction and stored at −70 °C, and then sent to the NGS core laboratory of Genomics BioSci & Tech. Co. Ltd., New Taipei City, Taiwan, which was sequenced by Illumina Miseq sequencer after qualitative and quantitative testing. The analysis software was Quantitative Insights Into Microbial Ecology (QIIME) and mothur. The extraction method for the DNA extraction kit used in this experiment is as follows:
  • Weigh 0.25 g of sample and add 750 μL of PowerBead solution into the bead tube.
  • Add 60 μL of C1 solution and mix well. Heat the bead tube at 65 °C for 10 min. Use a shaker to fix the bead tube horizontally, shake at the maximum speed for 10 min, and then centrifuge the bead tube at a speed of 13,000 rpm for 1 min. Transfer the supernatant to a clean 2 mL collection tube, and obtain approximately 400 to 500 μL of the supernatant.
  • Add 250 μL of C2 solution and shake for 5 s, and refrigerate at 2–8 °C for 5 min, then centrifuge the sample tube at 13,000 rpm for 1 min, and transfer 600 μL of supernatant to a clean 2 mL test tube in.
  • Add 200 μL of C3 solution and shake for 5 s, and refrigerate at 2–8 °C for 5 min.
  • Centrifuge the sample tube at 13,000 rpm for 1 min. Transfer 750 μL of supernatant to a clean 2 mL test tube (the particles in the tube contain non-DNA organic and inorganic substances, including polysaccharides, cell debris, and proteins. In order to obtain the best DNA yield and quality, avoid sampling any particles).
  • Add 1200 μL C4 solution to the collection tube and shake for 5 s. Add 650 μL of supernatant to the MB Spin upper filter paper, centrifuge the sample tube at a speed of 13,000 rpm for 1 min, pour out the filtered liquid and repeat the operation until all the supernatant has been processed.
  • Add 500 μL of C5 solution and centrifuge the sample tube at 13,000 rpm for 30 s.
  • Place the MB centrifuge tube in a clean 2 mL test tube, add 100 μL of C6 solution to the center of the filter paper (sterile DNA-free PCR-grade water or TE buffer can be used), centrifuge the tube at a speed of 13,000 rpm for 1 min, where DNA precipitation occurs, and then store the test tube at −20 to ·80 °C.
  • Illumina Miseq models.
Sequencing method: using Miseq V3 kit 300PE to amplify 16s V3~4 area by PCR and sequencing depth is average reads greater than 50,000.

3. Results

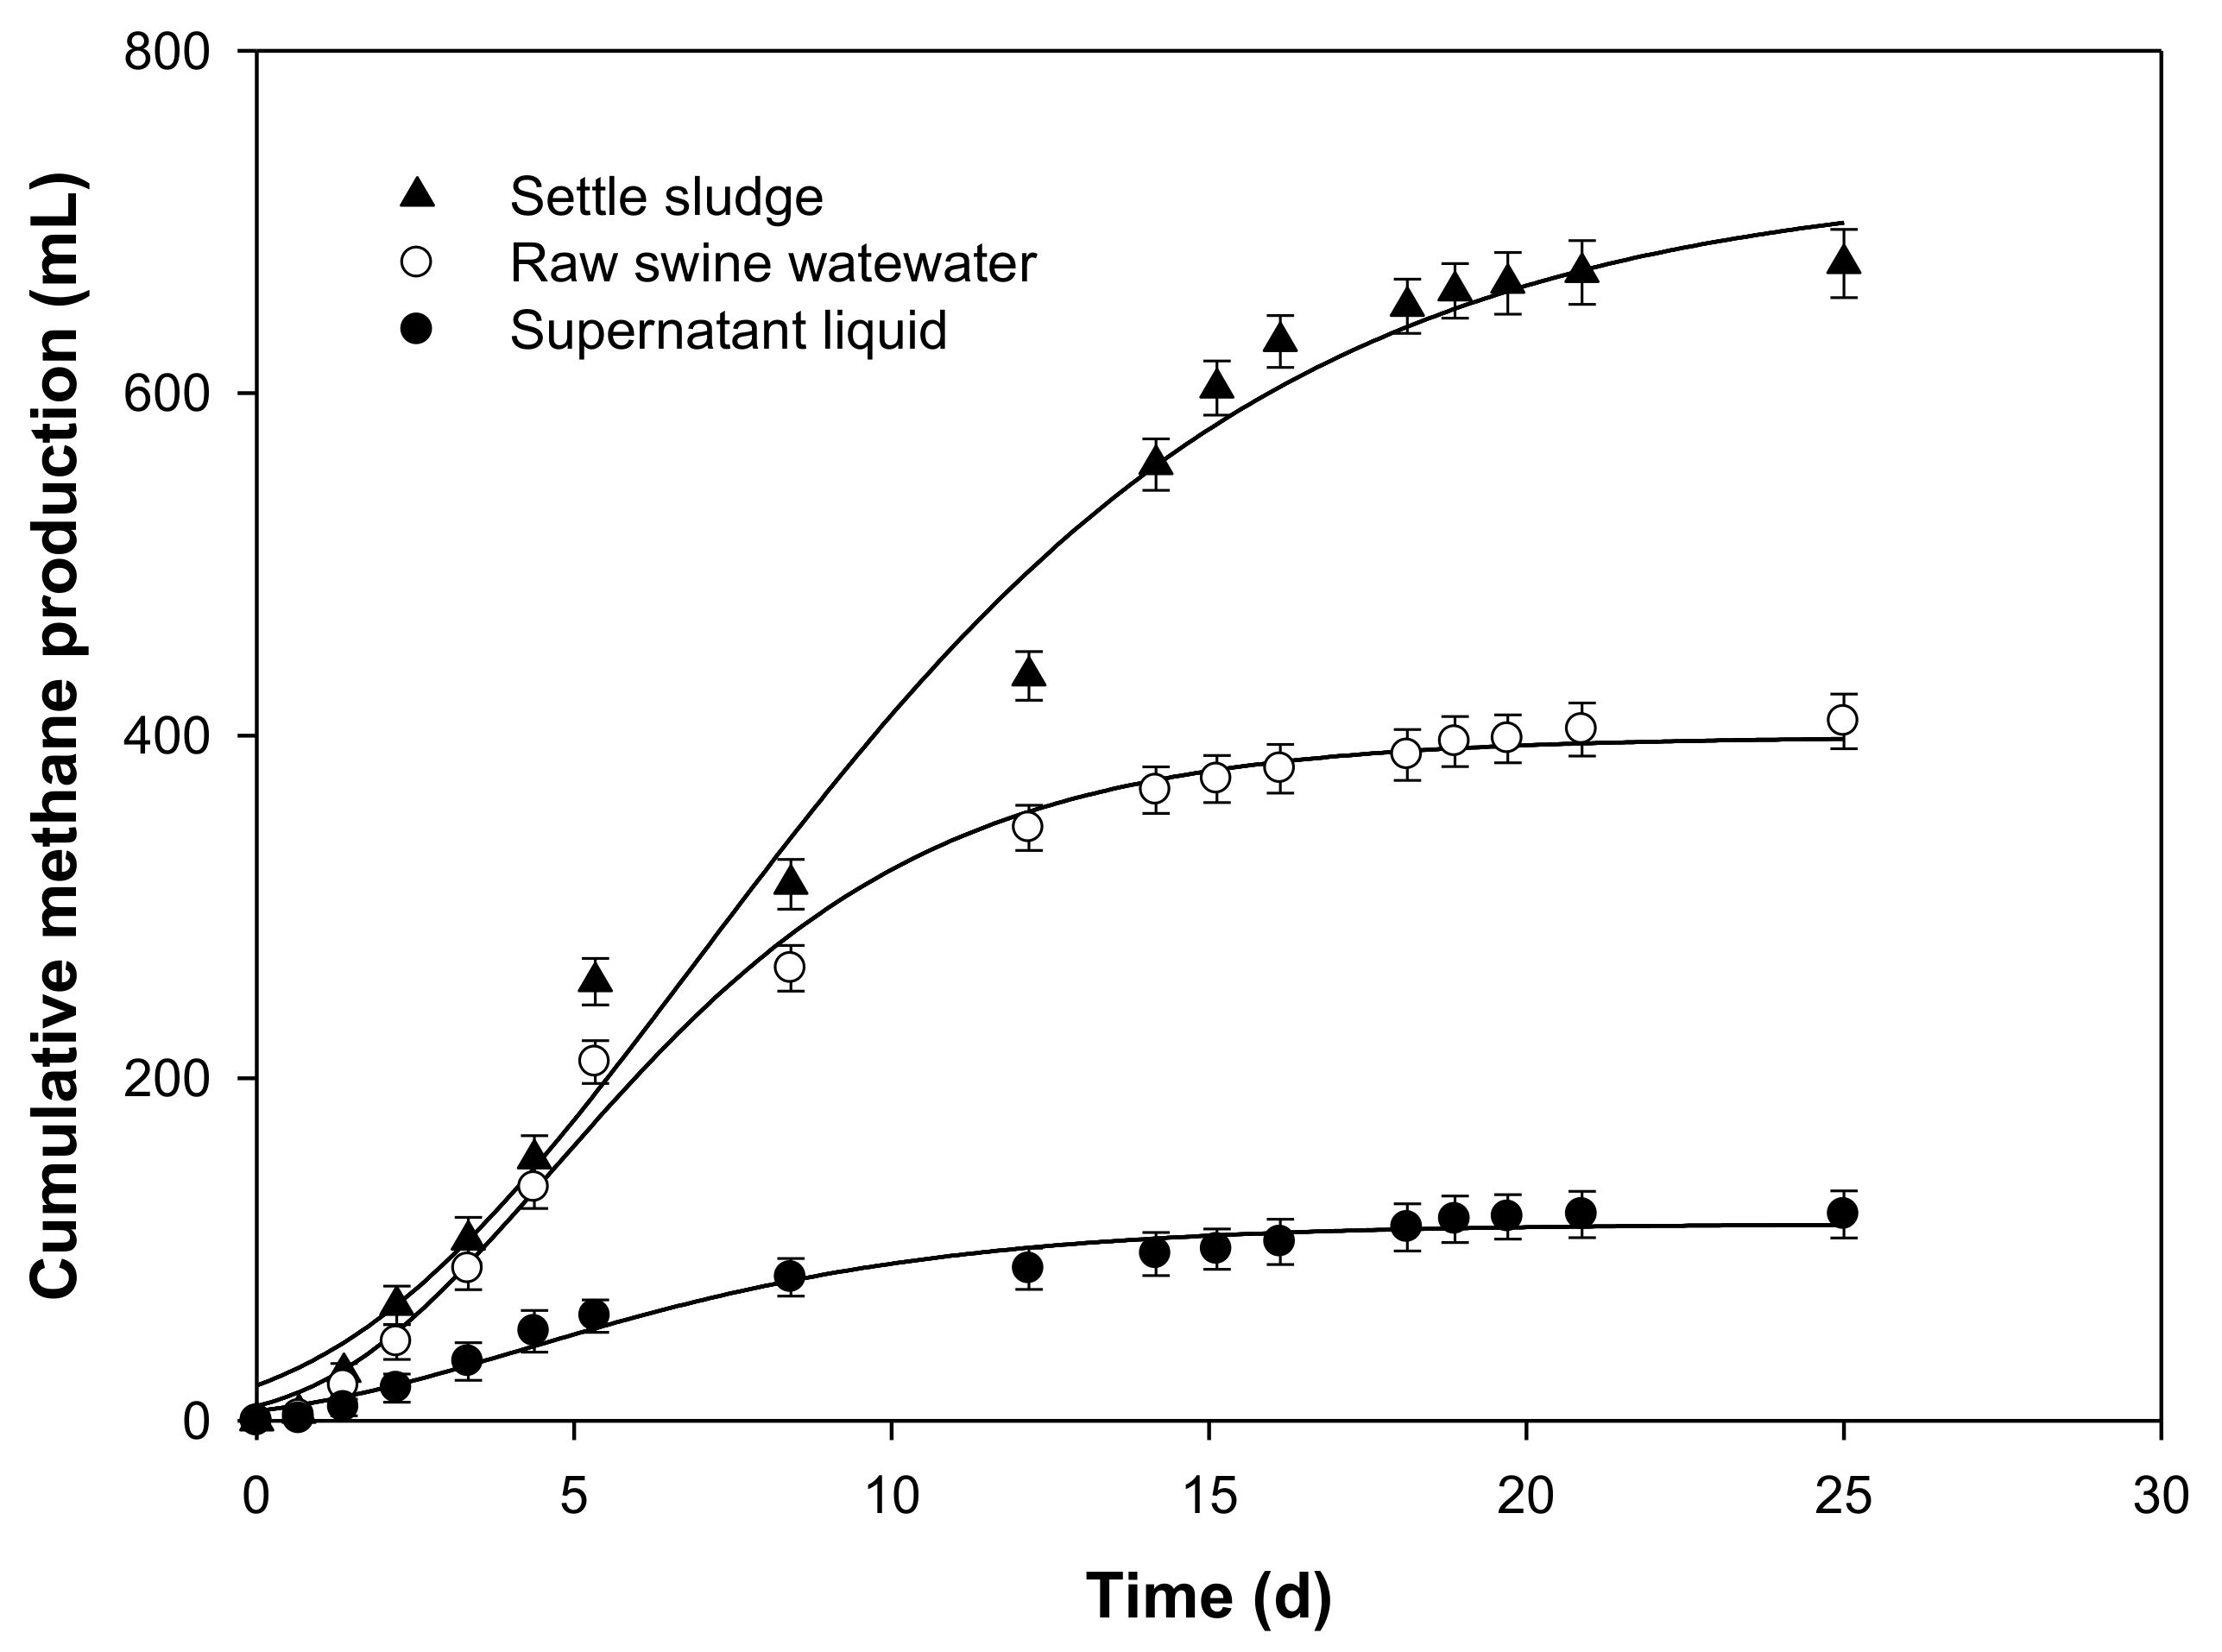
3.1. Effects of Solid Content

Table 1 reveals the cumulative methane productions from raw swine wastewater, settled swine sludge, and supernatant liquid. The results show that higher solid content can obviously enhance the accumulative methane production and MPR. In Figure 2, after 25 days of operation, the highest accumulative methane production reached 676 mL when using settled sludge feedstock (TS 5.3%), followed by raw swine wastewater (TS 2.9%, 408 mL) and supernatant liquid (TS 0.5%, 120 mL). The highest MPR of 608 L/L-d was obtained from settled sludge feedstock, which is 1.14 and 4.37 times higher compared to raw swine wastewater (530 L/L-d) and supernatant liquid (139 L/L-d), respectively. On the other hand, the highest MY (316 mL/g-VS) was obtained when using the supernatant liquid feedstock because of the lowest TS concentration (0.5%), followed by raw wastewater feedstock (178 mL/g-VS) and settled sludge (160 mL/g-VS). However, it was stated that low solids concentration results in low soluble COD concentration, which is unfavorable for organic acid and methane production. The solid content will decompose into more substrates and accumulate more volatile acids, which will provide a more adequate source of feed for methanogens [22].

3.2. Optimization of Hydrolysis-Acidogenesis Stage in Two-Stage Fermentation

Conversion efficiencies in terms of MPRmax and MY values were determined for the swine manure. The relationship between the parameter in the hydrolysis-acidogenesis stage and the conversion efficiency was studied by constructing a design matrix (Table 2). The results show that the cumulative methane production was 19.3–46.3 mL, and methane gas contents in the biogas were 35.7%–49.7%. MPR values of 8.97–36.42 mL/L-d and MY values of 9.13–22.45 mL/g VSadd were calculated by the parameter values from the modified Gompertz equation. A regression analysis of the design matrix was used to create ternary plots (Figure 3). Equations (3) and (4) are the mathematical models resolved by the CCD to determine the predicted optimized MPR and MY for each independent variable during the two-stage anaerobic fermentation process.
MPR (mL/L-d) = 80.18 + 0.1542X1 + 0.2727X2 − 16.7275X12 − 17.4525X22 + 7.975X1X2
MY (mL/g-VSadd) = −90.5793 + 22.8356X1 + 54.4389X2 − 1.8985X12 − 23.2465X22 + 2.0967X1X2
The adequacy and significance of the mathematical regression model were determined by ANOVA, which is a very important tool in finding the best fitted mathematical model. The ANOVA results for the response surface quadratic models of MPRmax and MY are shown in Table 3 and Table 4, respectively. For the MPRmax model, the F-value of 4.25 implies the model is significant. There is only a 4.28% chance that an F-value this large could occur due to noise. p-values less than 0.05 indicate that model terms are significant. In this case, A2, B2 are significant model terms. The lack of fit value of 39.32 implies it is significant due to noise. The R2 value of 0.7520 reveals that this mathematical model could explain the 75.20% variability in the methane yield response. The R2 value range of 0.75–1 shows that it had a well statistical model [23]. For the MY model, the F-value of 7.56 implies that the model was significant. p-values of A2, B2 are also significant. The lack of fit value of 20.37 implies that it is significant due to noise. The R2 value for the MY model is 0.8437, which is higher than the MPRmax model.
The RSM analysis results show that pH 6.5 and reaction time 1.5 days were the optimal conditions for maximum methane production performance. A verification experiment with the optimal condition in another batch-type operation was conducted, and the highest volatile acid production 7 g COD/L, MPR 0.3 L-CH4/L-d, and MY 92 mL-CH4/g-CODre were obtained.

3.3. Continous Operation

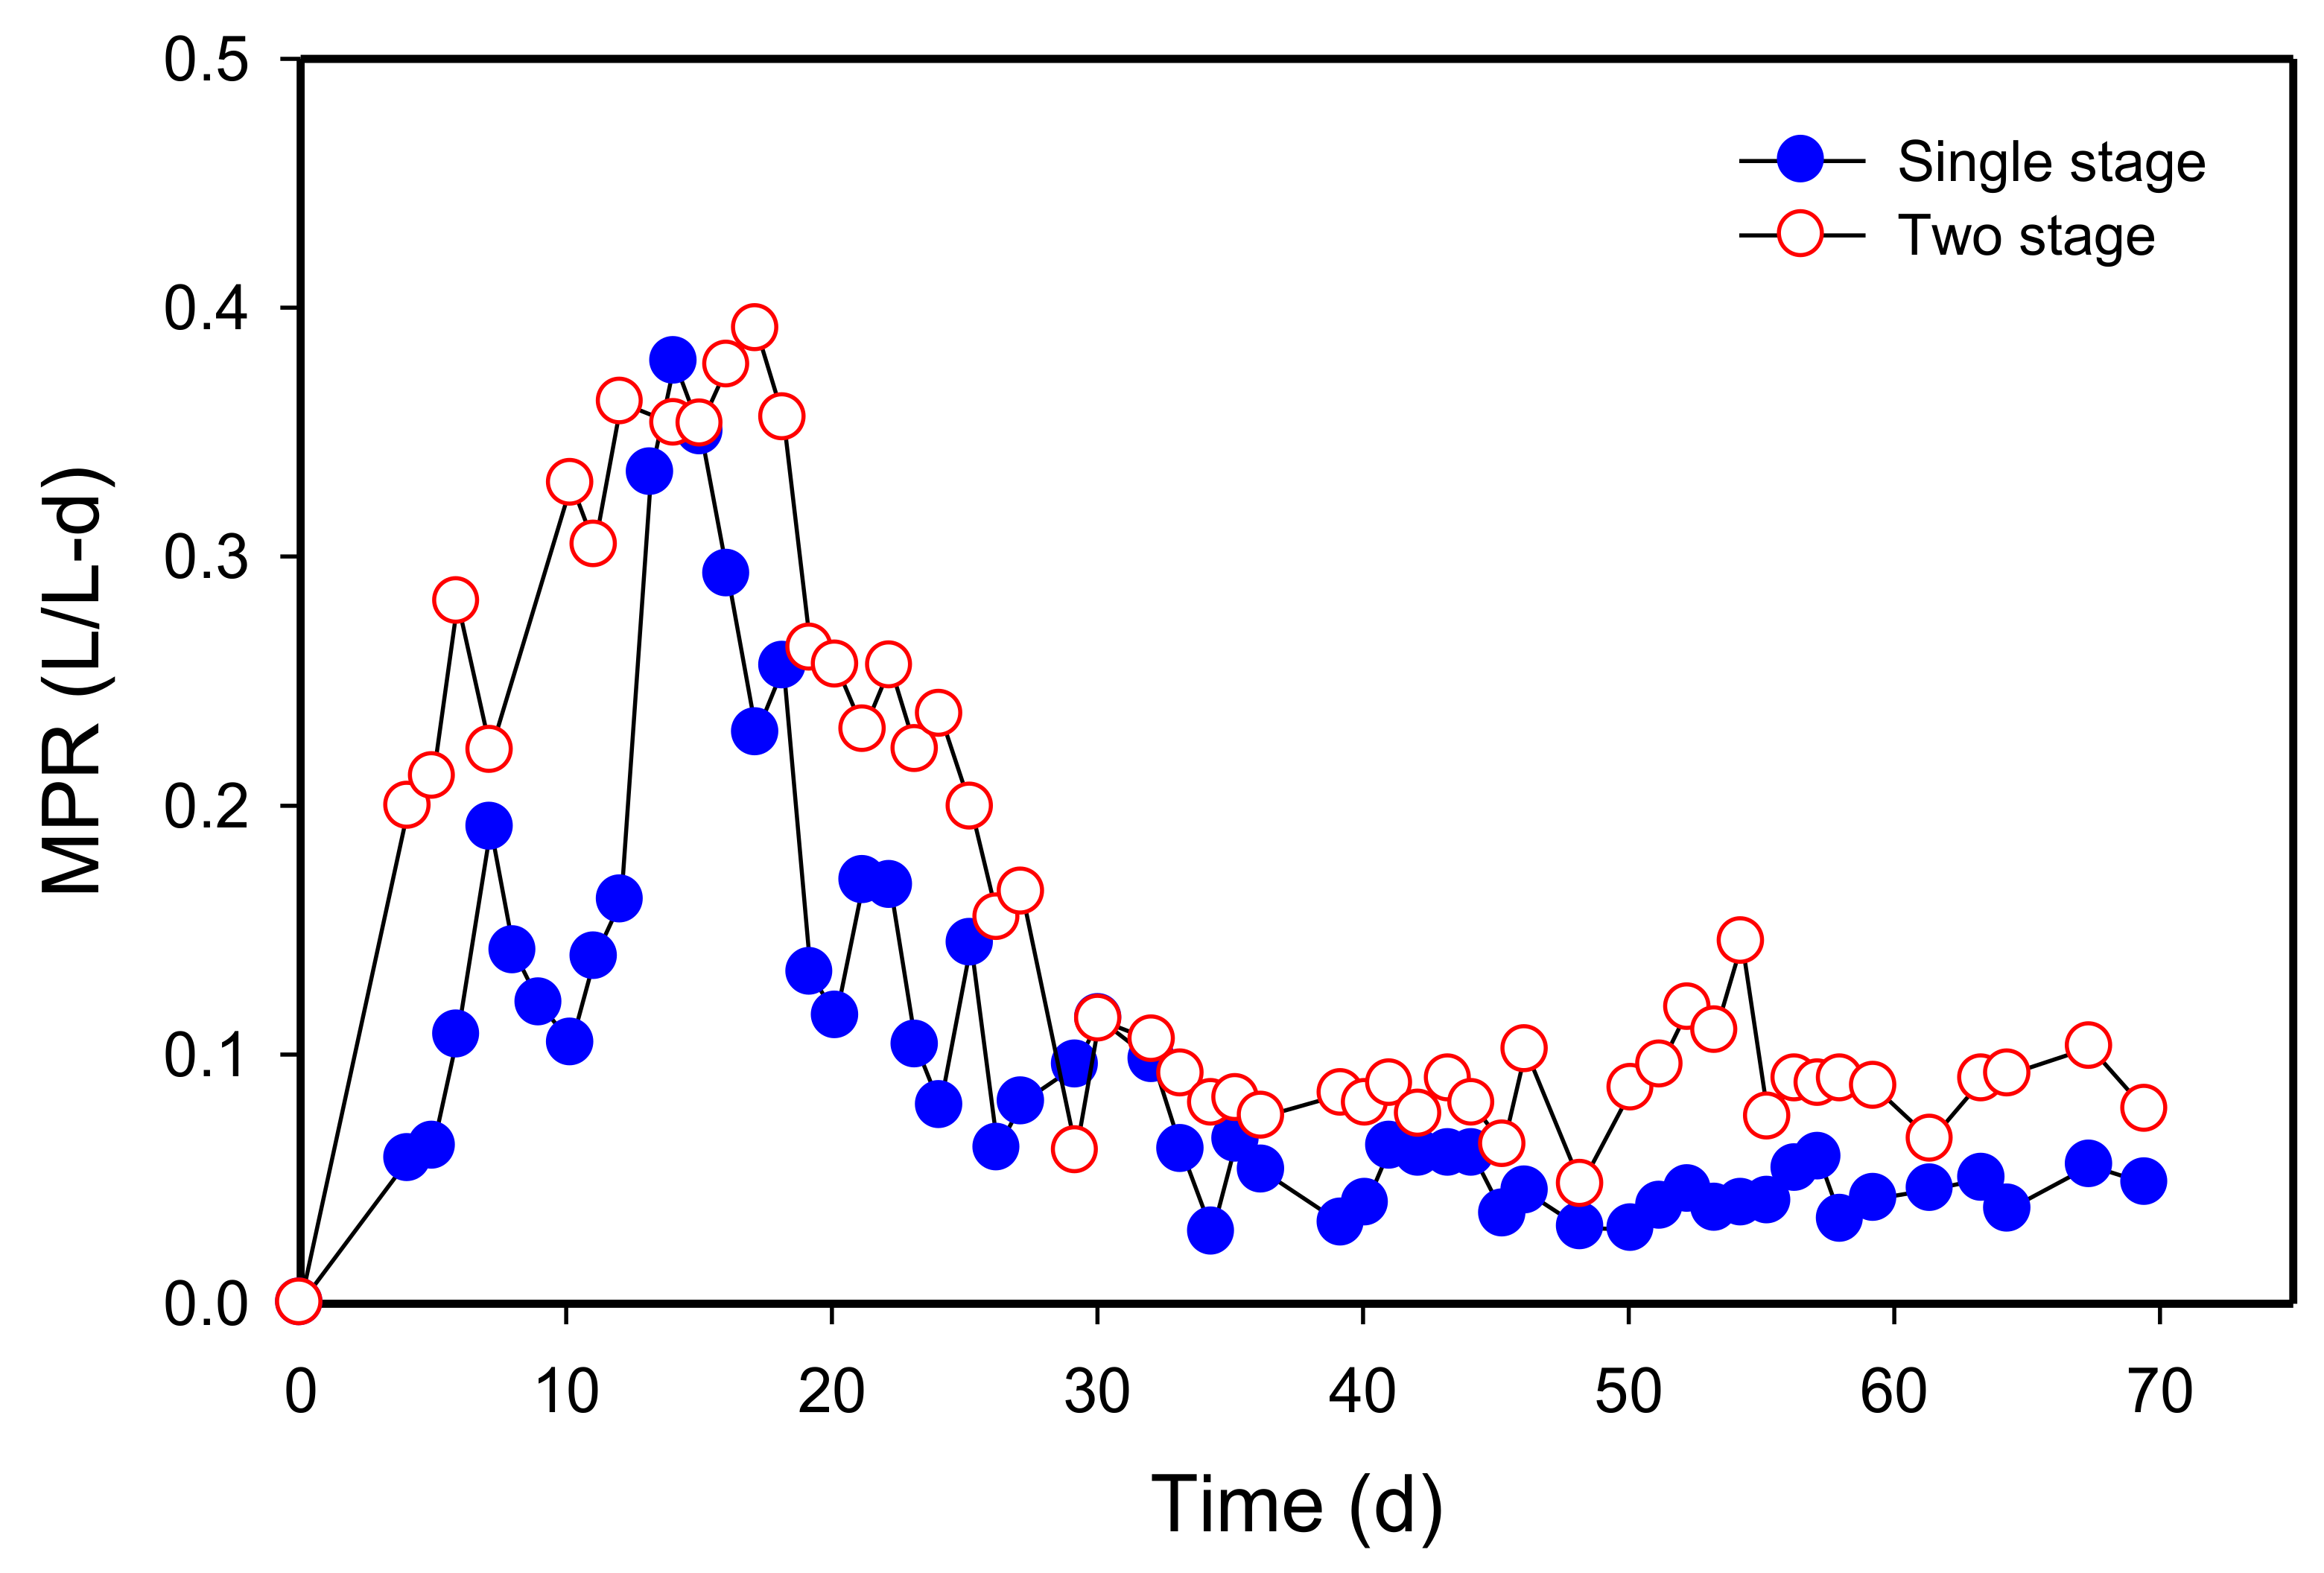
3.3.1. Methane Production Yield in Single- and Two-Stage System

Both single-stage and two-stage systems were cultivated at the organic loading rate of 4.0 ± 0.3 g COD/L-d with TS 5.0% ± 0.2% and HRT 30 d. In Figure 4, during 70 days operation, the peak MPR value 391 mL/L-d with the MY value of 293 mL/g vs. at day 14 was obtained in the two-stage system, compared to the MPR 378 mL/L-d with the MY 284 mL/g vs. at day 17 in the single-stage system. After day 18, the MPR value dropped rapidly because of lower soluble organic matter concentration in the feedstock resulted from using a lot of water to cool down the pig farm in summer. The average biogas production rate in the two-stage system was 320 mL/L-d, which is slightly higher than 300 mL/L-d in a single-stage system. However, the average MPR of 163 mL/L-d and MY of 38 mL/g vs. were obtained in the two-stage system, which is 60% higher than that of the single-stage system (MPR of 101 mL/L-d and MY of 18 mL/g VS) that having lower methane composition. The two-stage system had TS and COD removal efficiencies of 52% ± 4% and 70% ± 3%, respectively; they were 39% ± 3% and 61% ± 4% in the single-stage system. The efficiencies of a two-stage anaerobic fermentation system are shown, and this agrees with a report elucidating that two-stage anaerobic digestion should be more productive than the traditional process of single-stage digestion [15].
Cremonez‘s review article [24] reveals that two-stage digesters present higher fermentation stability for providing the optimized condition of various microorganism communities, tolerance to organic loading as well as the substrate conversion of hydrogen and methane. It also reported that two-stage digesters can increase the methane yield between 10% and 30% compared to the single-stage digester. The two-stage system in this study can create a 60% increase in MY and MPR compared to the single-stage digester.
HRT is one of the key parameters in the effect of the degradation efficiency of solid matters. The HRT of the first stage (including hydrolysis, acidogenesis, and acetogenesis reactions) and second stage (methanogenesis) processes typically range from 2 to 4 days and from 8 to 10 days, respectively [24]. The total solid reduction in the HAD of the two-stage system is 10% ± 2%, which is much lower than 52% ± 24% in this study. Obviously, it is caused by the shorter HRT for the HAD, even though a separated hydrolysis-acidogenesis tank could increase the total solid reduction in the MD to 52% ± 4%, which is higher than the 39% ± 3% in the single-stage system (Table 5).
In the two-stage system, the first acidogenesis stage involves the conversion of those organic components into hydrogen, carbon dioxide, and soluble metabolic products such as alcohols and VFAs while they can be converted into methane and carbon dioxide in the second stage [25]. The main VFAs in the effluents of both single-stage and two-stage methane digesters in this study were acetic acid (45%), propionic acid (45%); other VFAs were butyric acid (5%) and valeric acid (5%). During the anaerobic fermentation process, the favorable thermodynamic reaction for carbohydrates such as glucose could be converted into acetate and butyrate (Equations (5) and (6)). Another thermodynamic reaction would occur to consume the H2 to propionate (Equation (7)).
C6H12O6 + 4H2O → 2CH3COO + 4H2 + 2HCO3+4H+ ΔG0 = −206.3 kJ/mol
C6H12O6 + 4H2O → 2C3H7COO + 2H2 + 2HCO3 + 3H+ ΔG0 = −254.8 kJ/mol
C6H12O6 + 2H2 → 2C2H5COO + 2H2O + 2H+ ΔG0 = −359 kJ/mol
4H2 + CO2 → CH4 + 2H2O ΔG0 = 135.6 kJ/mol
The low carbon and nitrogen (C/N) ratio could cause the metabolic pathway to shift to accumulate propionate and consume hydrogen production [26]. It will reduce methane production by hydrogenotrophic methanogens (Equation (8)). Recently, the co-digestion strategy to provide a suitable C/N ratio was widely applied to enhance biogas production efficiency. Moreover, various organic compositions (such as carbohydrates, proteins, and lipids) from different organic wastes could provide many kinds of electron donors for anaerobic microorganisms. For example, Wang et al. [27] developed a two-stage anaerobic fermentation system on co-digestion of food waste and cow manure with different ratios and digestate recirculation with different recirculation ratios to investigate the substrate degradation and energy production in continuous systems. The results showed the acetic acid and butyric acid are the main metabolites in both bio-H2 and bio-CH4 reactors. Acetic acid and butyric acid are the favorites for acetoclastic methanogens to produce methane.

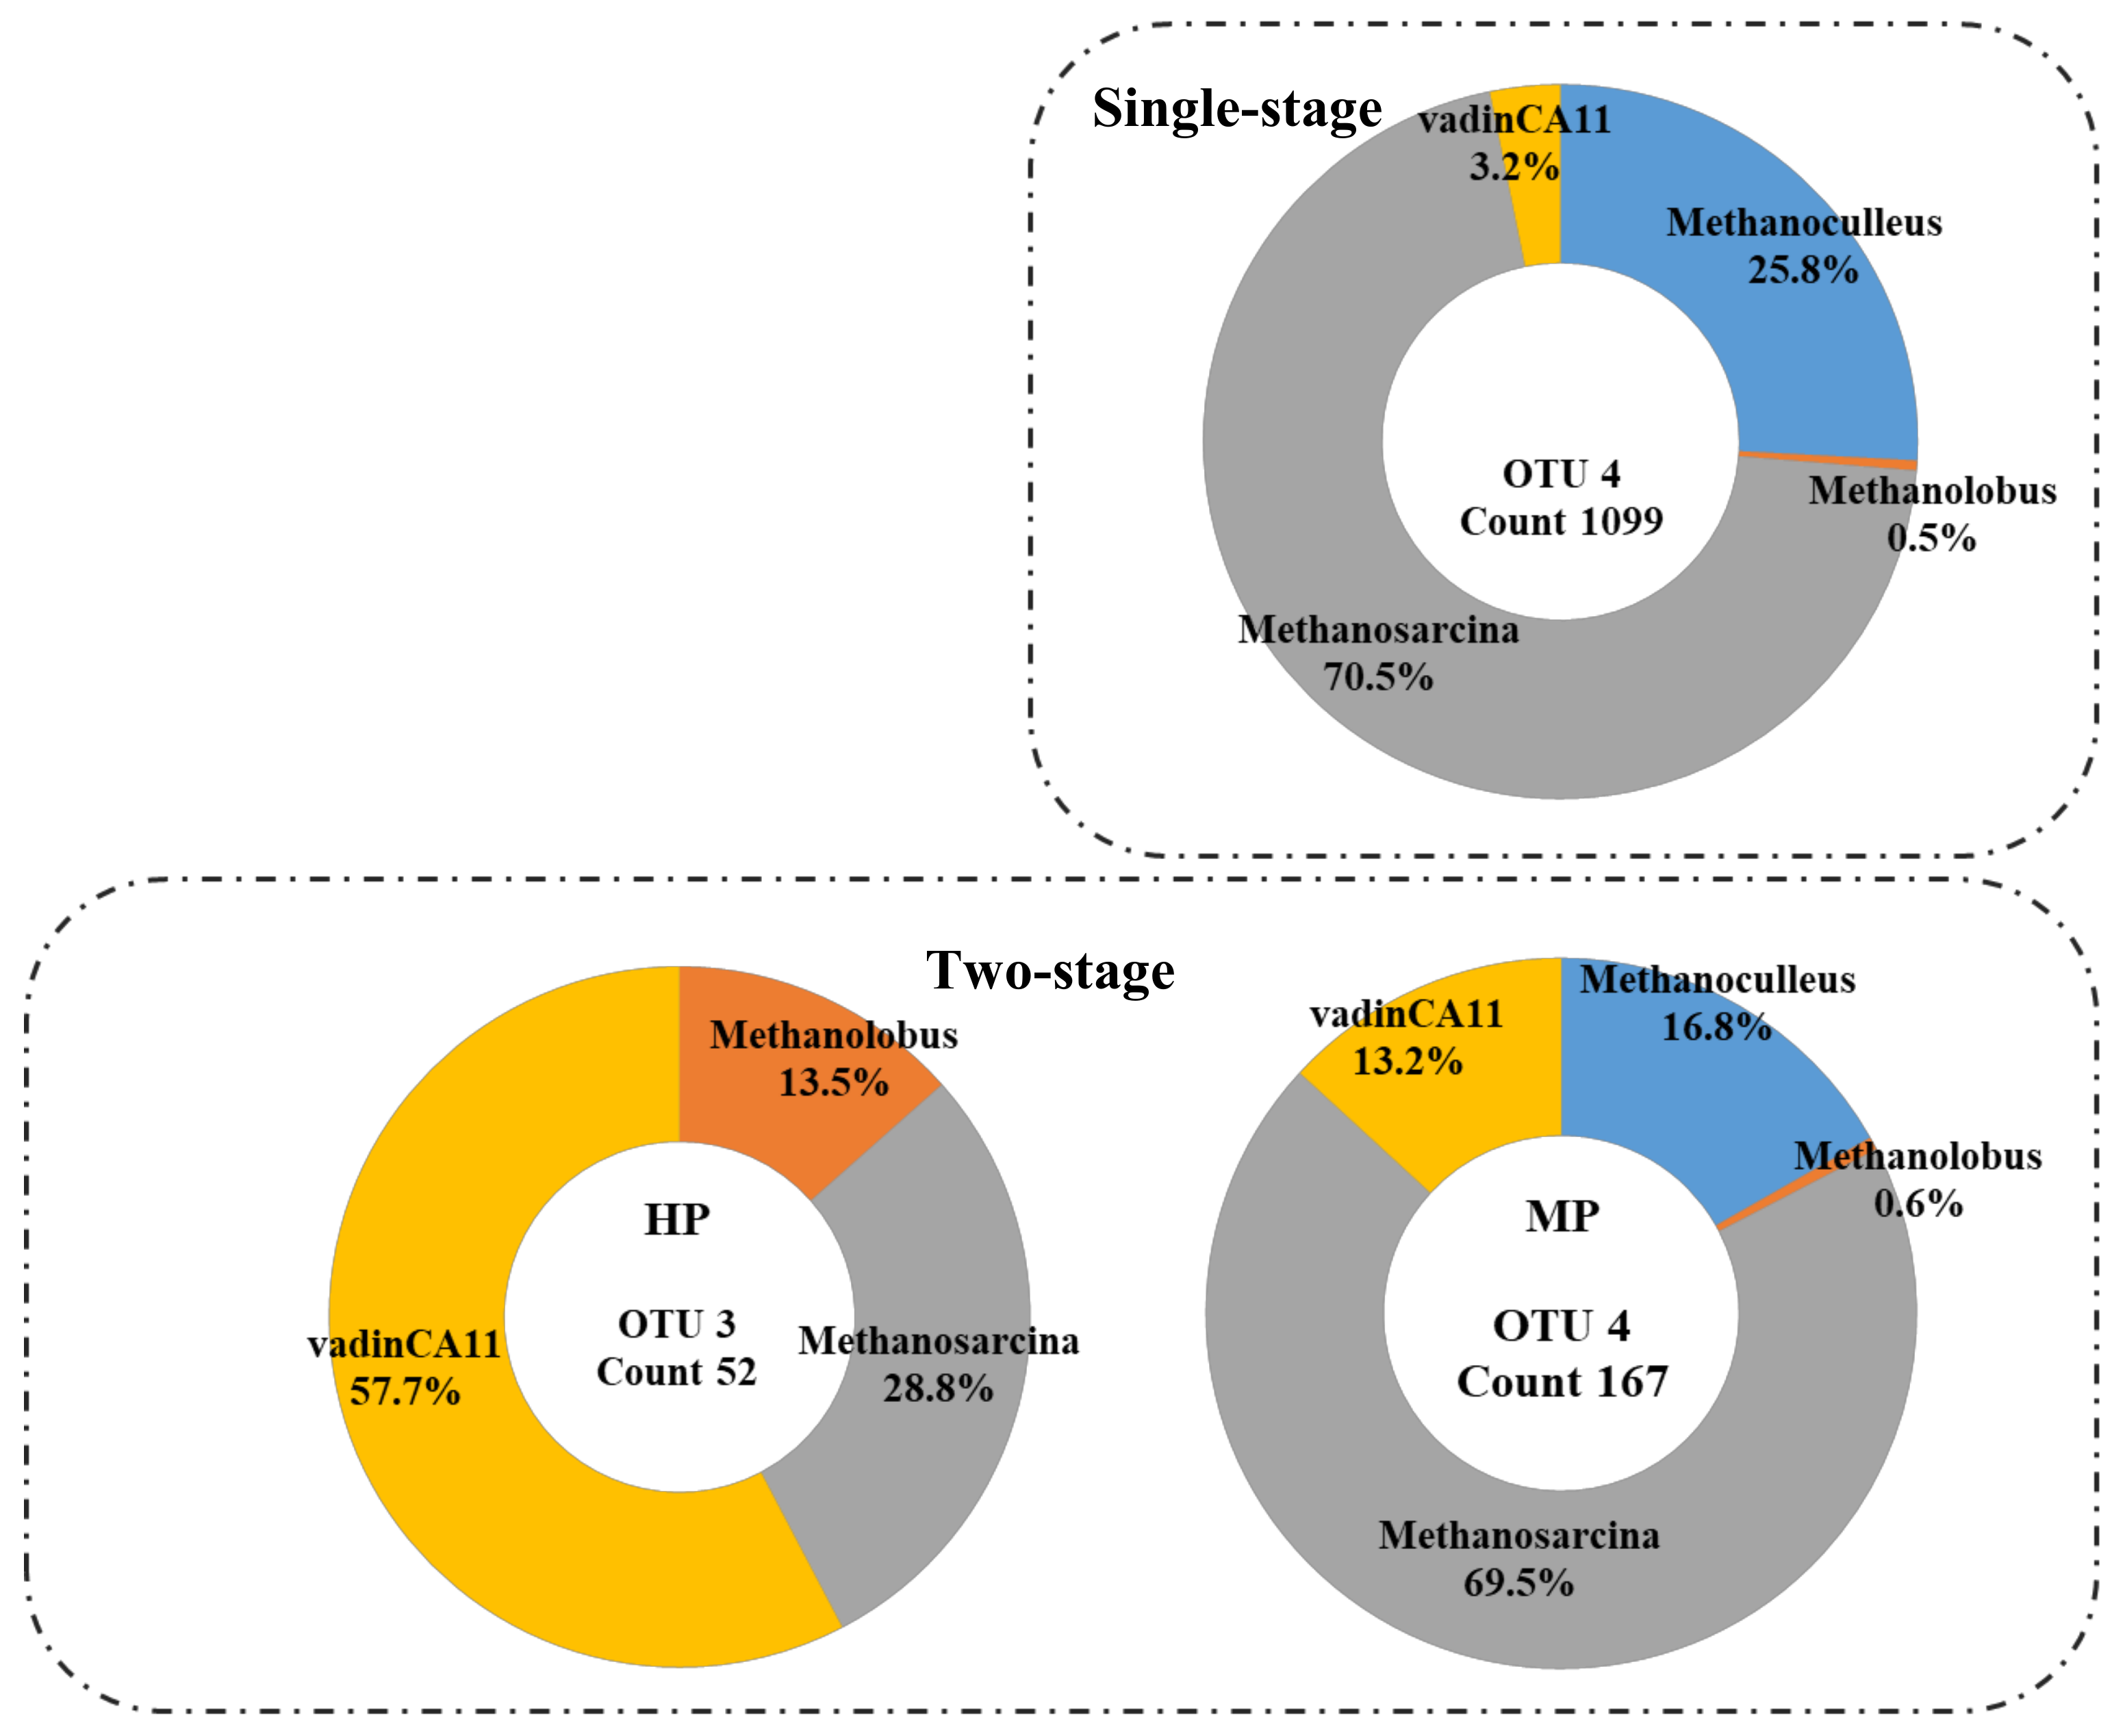
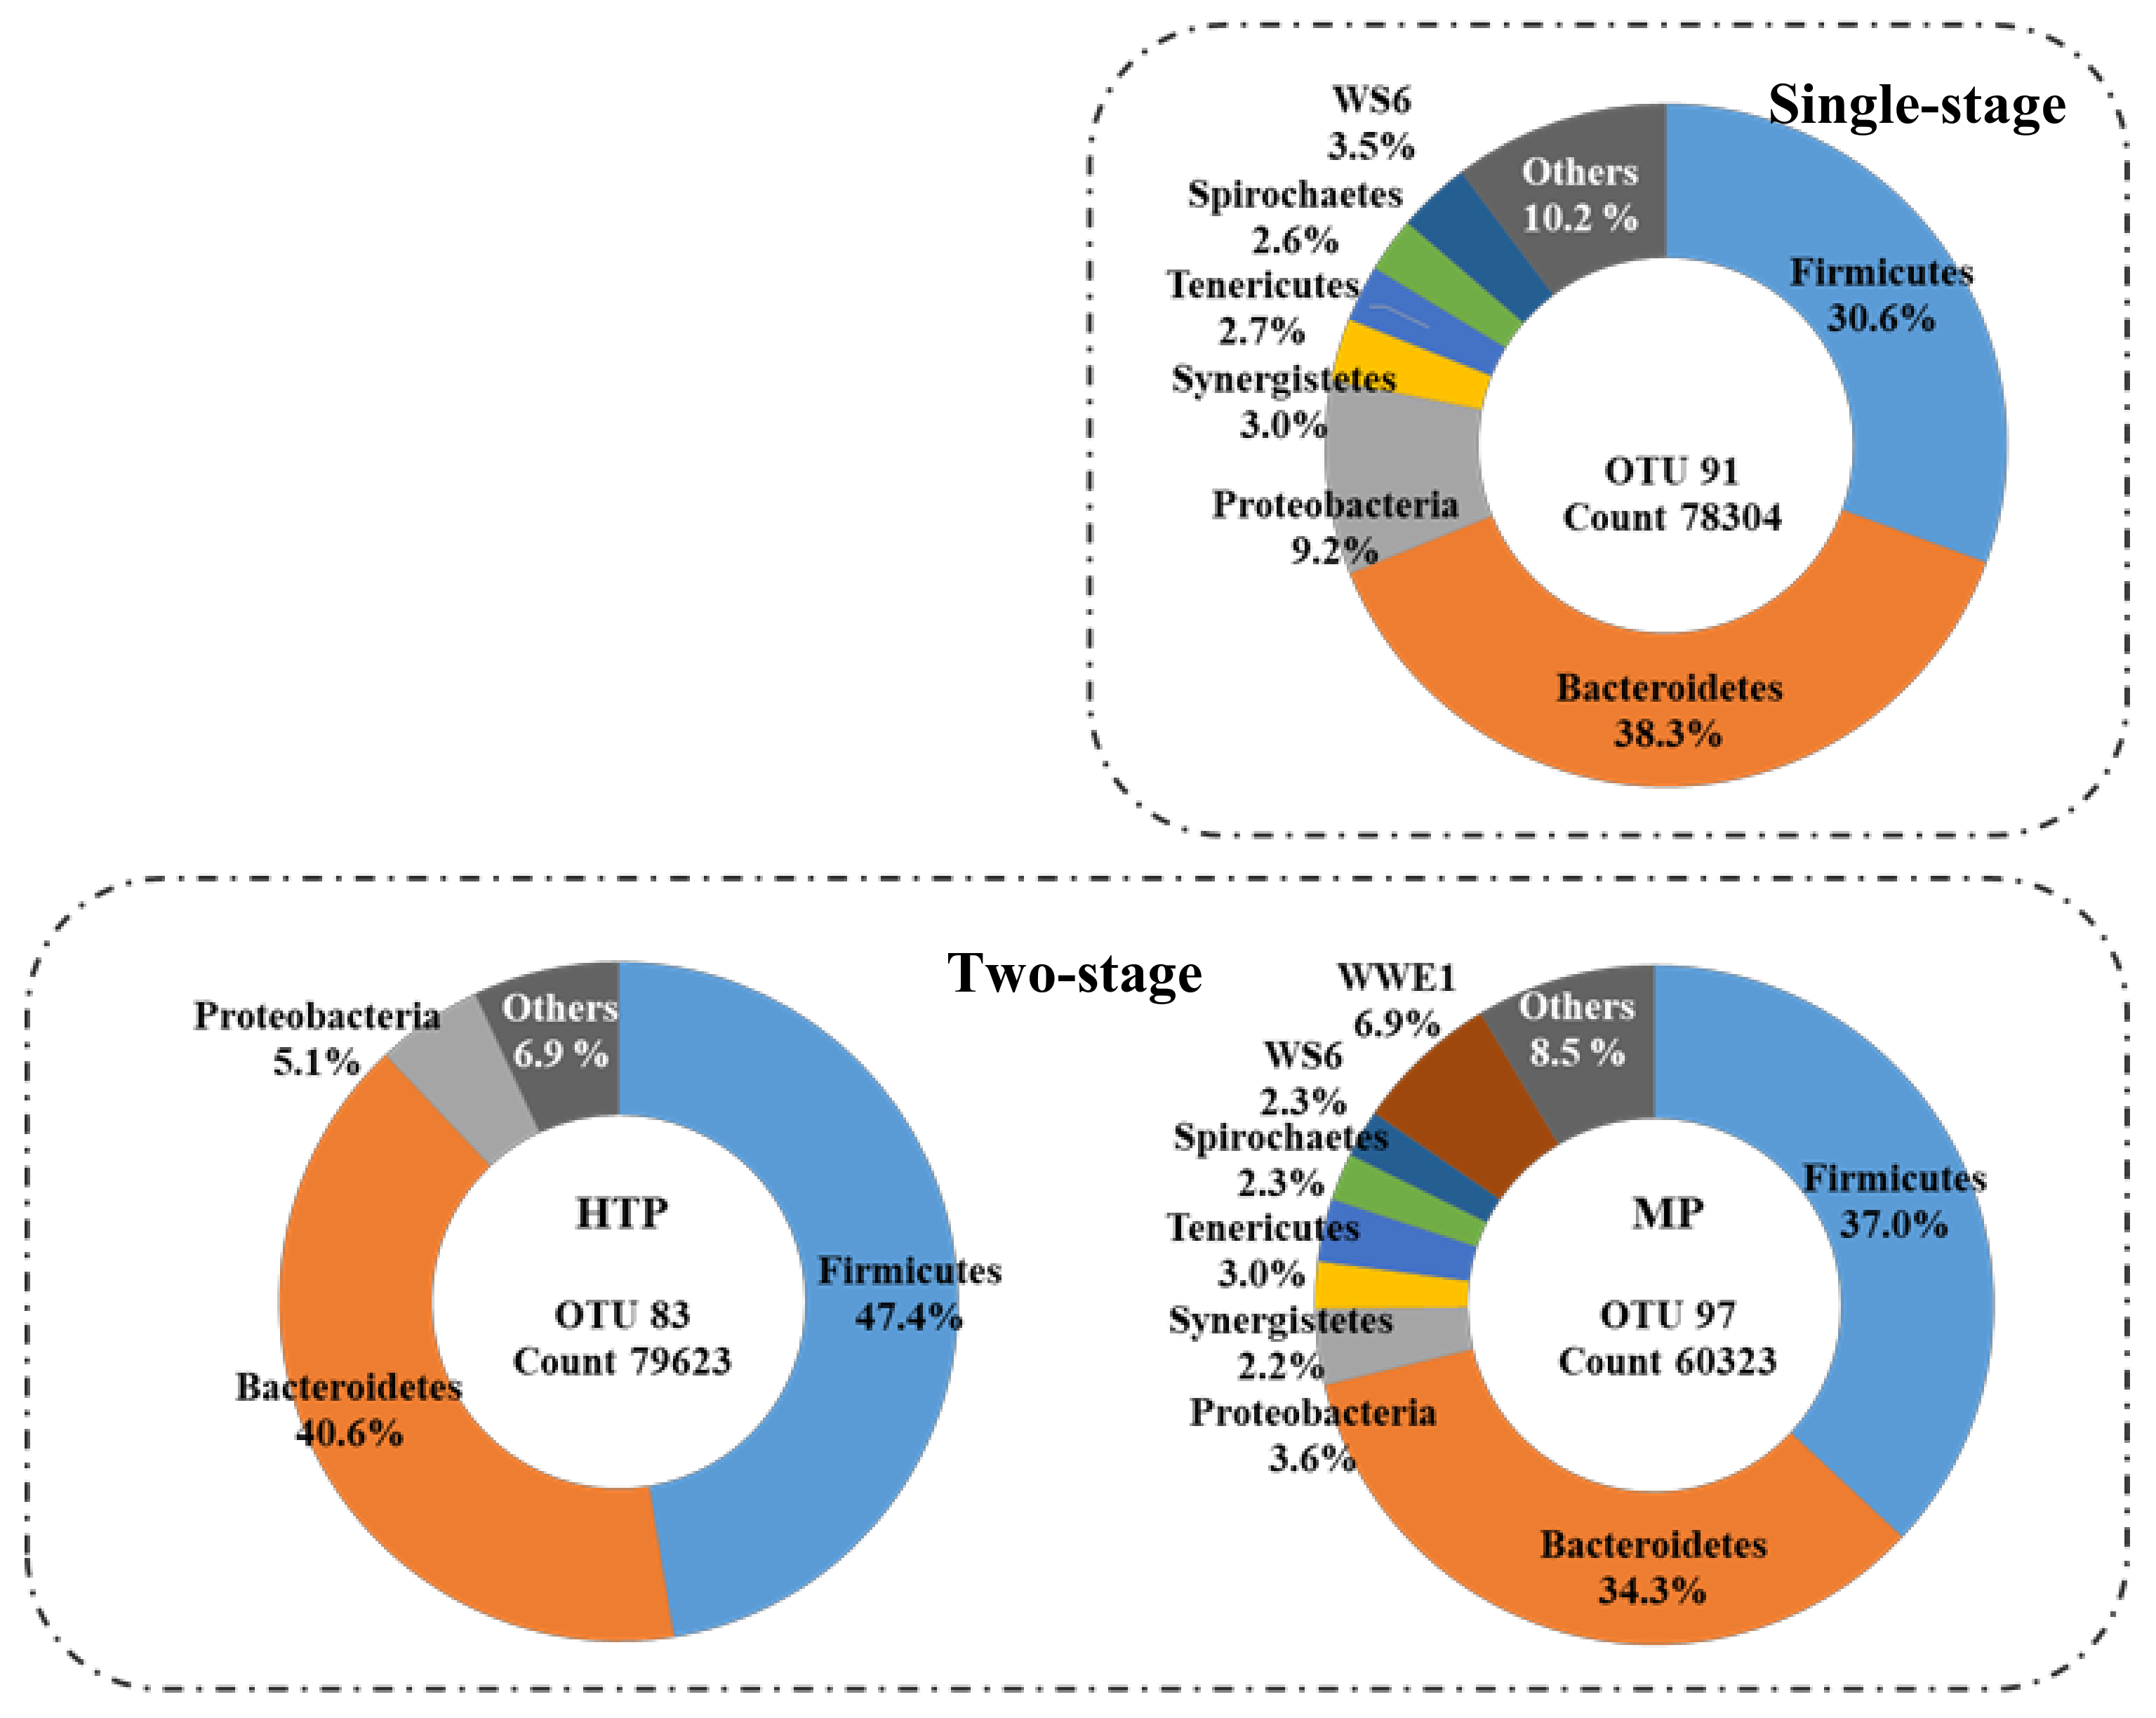
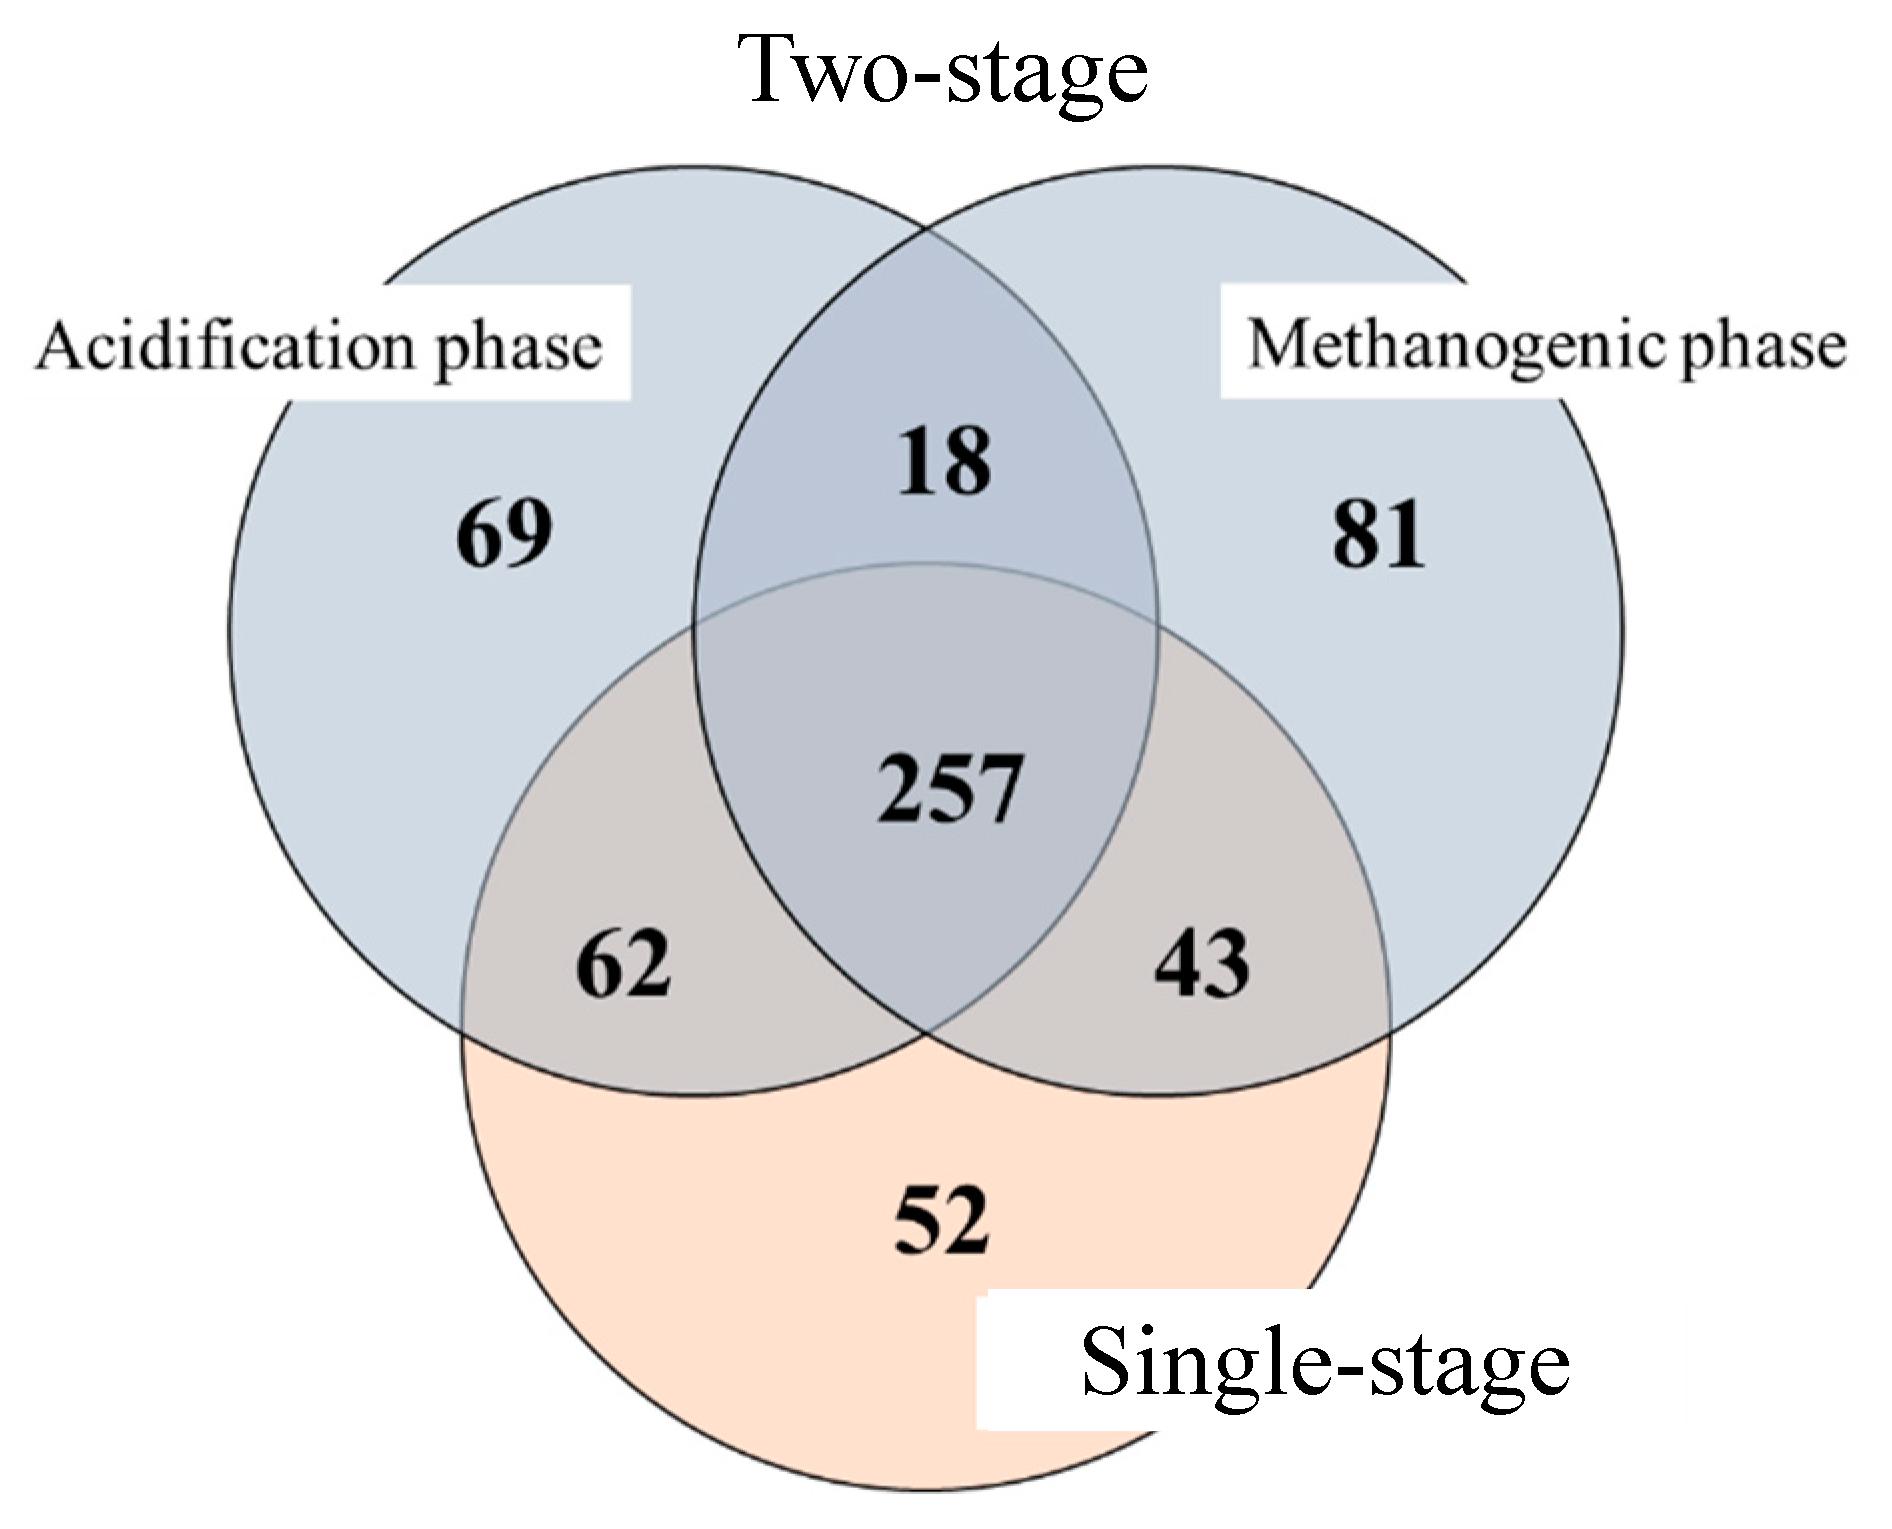
3.3.2. Microbial Community

16S rRNA gene selection was used to observe the microbial population structure. According to taxonomic analysis, the microbes in single- and two-stage systems were classified in the genus. For archaea (Figure 5), the main archaea species were Methanosarcina and Methanosarcina Genus (Methanoculleus) (a total of more than 96%), and a small number of other species such as Methanolobus and vadinCA11 (Methanomassiliicoccaceae). Methanosarcina has a high growth rate and can resist systemic condition mutations caused by pH changes [28,29]. Methanosarcina is an acetic acid-using methanogen; it can also use H2 and CO2 to produce methane [30]. Therefore, when Methanosarcina is the dominant flora, the anaerobic digestion system can maintain a relatively stable gas production performance [31]. Methanoculleus can use H2 + CO2 or formate as a carbon source to produce methane and is a typical hydrogen-using methanogen. This genus is relatively tolerant to ammonia nitrogen [32].
Figure 6 shows the microbial communities in the single- and two-stage systems. Obviously, these two systems had different effects on bacteria (non-archaea) and archaea communities. The methane phase of the two-stage system was dominated by Firmicutes, accounting for 37.0%, followed by Bacteroidetes (34.3%), WWE1 phylum (6.9%), and Proteobacteria (3.6%). In the single-stage system, Bacteroidetes accounted for 38.3%, followed by Firmicutes (30.6%) and Proteobacteria (9.2%). In the two-stage acidification phase, Firmicutes accounted for 47.4%, followed by Bacteroidetes (40.6%) and Proteobacteria (5.1%). Sun et al. reported that the phyla Firmicutes, Bacteroidetes, Proteobacteria, and WWE1 were detected during continuous anaerobic digestion of straw and cow manure [33]. Clostridia is one class of the phylum Firmicutes. Venkiteshwaran et al. also indicated that Bacteroidetes, Chloroflexi, Firmicutes, and Proteobacteria are phyla that contain most identified species of acidogenic bacteria, and they associate the breakage of polymeric matters, such as polysaccharides, lipids, and proteins, to their respective monomers or oligomers using extracellular enzymes [34].
In order to further illustrate the relationship between the single- and two-stage acid-producing phases and the microbes in the methane phase, the genus of bacteria in the individual tanks was analyzed by Venn diagram (Figure 7). Using the overlapping number of operational taxonomic units (OTUs) to illustrate the relationship between different reactors, it can be seen that there were more overlaps (319) of microbial populations in single-stage and two-stage acidification phases.

4. Conclusions

The swine manure was pre-treated by gravity settling to provide settled sludge and supernatant liquid, and their biogas production performances were compared with that of raw swine wastewater. The settled sludge was more suitable for methane production than the raw swine wastewater and supernatant. The conditions of pH 6.5 and reaction time of 1.5 days would provide peak volatile acid production of 7 g COD/L, MPR of 0.3 L-CH4/L-d, and MY of 92 mL-CH4/g-CODre. Moreover, two-stage operation results in higher methane concentration, methane production rate, and methane yield than those of the single-stage system; both systems have similar dominant methane-producing species of Firmicutes and Bacteroidetes, with each having around 30%–40%.

Author Contributions

Conceptualization, C.-Y.L. (Chun-Yi Lee); methodology, C.-Y.L. (Chiu-Yue Lin); software, C.-H.L.; validation, W.S.C. and C.-C.C.; formal analysis, C.-Y.L. (Chiu-Yue Lin) and W.S.C.; investigation, C.-Y.L. (Chiu-Yue Lin); resources, C.-Y.L. (Chun-Yi Lee); data curation, C.-Y.L. (Chiu-Yue Lin); writing—original draft preparation, C.-Y.L. (Chyi-How Lay) and W.S.C. writing—review and editing, C.-C.C. and W.S.C.; visualization, C.-C.C. and P.L.S.; supervision, C.-Y.L. (Chiu-Yue Lin); project administration, C.-H.L.; funding acquisition, C.-H.L. All authors have read and agreed to the published version of the manuscript.

Funding

The authors gratefully acknowledge the financial support from Taiwan’s Ministry of Science and Technology (MOST 108–2221-E-035–056; 108–2221-E-035 -036 -MY3; 109–2221-E-035–028).

Institutional Review Board Statement

Not applicable.

Informed Consent Statement

Not applicable.

Data Availability Statement

Not applicable.

Conflicts of Interest

The authors declare no conflict of interest.

References

  1. Ström:, G.; Albihn, A.; Jinnerot, T.; Boqvist, S.; Andersson-Djurfeldt, A.; Sokerya, S.; Osbjer, K.; San, S.; Davun, H.; Magnusson, U. Manure management and public health: Sanitary and socio-economic aspects among urban livestock-keepers in Cambodia. Sci. Total Environ. 2018, 621, 193–200. [Google Scholar] [CrossRef] [PubMed]
  2. Zhang, L.; Li, L.; Sha, G.; Liu, C.; Wang, Z.; Wang, L. Aerobic composting as an effective cow manure management strategy for reducing the dissemination of antibiotic resistance genes: An integrated meta-omics study. J. Hazard. Mater. 2020, 386, 121895. [Google Scholar] [CrossRef] [PubMed]
  3. Bui, X.; Wolff, A.; Madsen, M.; Duong Bang, D. Fate and durvival of Campylobacter coli in swine manure at various temperatures. Front. Microbiol. 2011, 2, 262. [Google Scholar] [CrossRef] [Green Version]
  4. Executive Yuan. Report on the Number of Pigs Survey; Council of Agriculture: Taipei, Taiwan, 2021. [Google Scholar]
  5. Chae, K.J.; Jang, A.; Yim, S.K.; Kim, I.S. The effects of digestion temperature and temperature shock on the biogas yields from the mesophilic anaerobic digestion of swine manure. Bioresour. Technol. 2008, 99, 1–6. [Google Scholar] [CrossRef]
  6. Chai, W.S.; Bao, Y.; Jin, P.; Tang, G.; Zhou, L. A review on ammonia, ammonia-hydrogen and ammonia-methane fuels. Renew. Sustain. Energy Rev. 2021, 147, 111254. [Google Scholar] [CrossRef]
  7. Chai, W.S.; Chew, C.H.; Munawaroh, H.S.H.; Ashokkumar, V.; Cheng, C.K.; Park, Y.-K.; Show, P.L. Microalgae and ammonia: A review on inter-relationship. Fuel 2021, 303, 121303. [Google Scholar] [CrossRef]
  8. Lay, C.-H.; Vo, T.-P.; Lin, P.-Y.; Abdul, P.M.; Liu, C.-M.; Lin, C.-Y. Anaerobic hydrogen and methane production from low-strength beverage wastewater. Int. J. Hydrog. Energy 2019, 44, 14351–14361. [Google Scholar] [CrossRef]
  9. Lin, C.-Y.; Lay, C.-H.; Sen, B.; Chu, C.-Y.; Kumar, G.; Chen, C.-C.; Chang, J.-S. Fermentative hydrogen production from wastewaters: A review and prognosis. Int. J. Hydrog. Energy 2012, 37, 15632–15642. [Google Scholar] [CrossRef]
  10. Liang, Y.; Xu, L.; Bao, J.; Firmin, K.A.; Zong, W. Attapulgite enhances methane production from anaerobic digestion of pig slurry by changing enzyme activities and microbial community. Renew. Energy 2020, 145, 222–232. [Google Scholar] [CrossRef]
  11. Berhe, S.; Leta, S. Anaerobic co-digestion of tannery wastes using two stage anaerobic sequencing batch reactor: Focus on process performance of hydrolytic–acidogenic step. J. Mater. Cycles Waste Manag. 2019, 21, 666–677. [Google Scholar] [CrossRef]
  12. Lin, C.-Y.; Lay, C.-H. A nutrient formulation for fermentative hydrogen production using anaerobic sewage sludge microflora. Int. J. Hydrog. Energy 2005, 30, 285–292. [Google Scholar] [CrossRef]
  13. Pramanik, S.K.; Suja, F.B.; Porhemmat, M.; Pramanik, B.K. Performance and kinetic model of a single-stage anaerobic digestion system operated at different successive operating stages for the treatment of food waste. Processes 2019, 7, 600. [Google Scholar] [CrossRef] [Green Version]
  14. APHA. Standard Methods for the Examination of Water and Wastewater, 17th ed.; American Public Health Association: Washington, DC, USA, 1989. [Google Scholar]
  15. Lopez, S.; Newbold, C.J. Analysis of methane. In Measuring Methane Production from Ruminants; Makkar, H.P.S., Vercoe, P.E., Eds.; Springer: Dordrecht, The Netherlands, 2007; pp. 1–13. ISBN 978-1-4020-6133-2. [Google Scholar]
  16. Soliva, C.R.; Hess, H.D. Measuring methane emission of ruminants by in vitro and in vivo techniques. In Measuring Methane Production from Ruminants; Makkar, H.P.S., Vercoe, P.E., Eds.; Springer: Dordrecht, The Netherlands, 2007; pp. 15–31. ISBN 978-1-4020-6133-2. [Google Scholar]
  17. Deuri, P.; Sood, N.; Wadhwa, M.; Bakshi, M.P.S.; Salem, A.Z.M. Screening of tree leaves for bioactive components and their impact on in vitro fermentability and methane production from total mixed ration. Agrofor. Syst. 2020, 94, 1455–1468. [Google Scholar] [CrossRef]
  18. Melesse, A.; Steingass, H.; Schollenberger, M.; Holstein, J.; Rodehutscord, M. Nutrient compositions and in vitro methane production profiles of leaves and whole pods of twelve tropical multipurpose tree species cultivated in Ethiopia. Agrofor. Syst. 2019, 93, 135–147. [Google Scholar] [CrossRef]
  19. Filer, J.; Ding, H.H.; Chang, S. Biochemical methane potential (BMP) assay method for anaerobic digestion research. Water 2019, 11, 921. [Google Scholar] [CrossRef] [Green Version]
  20. Chen, C.-Y.; Lu, W.-B.; Wu, J.-F.; Chang, J.-S. Enhancing phototrophic hydrogen production of Rhodopseudomonas palustris via statistical experimental design. Int. J. Hydrog. Energy 2007, 32, 940–949. [Google Scholar] [CrossRef]
  21. Lay, C.-H.; Chen, C.-C.; Lin, H.-C.; Lin, C.-Y.; Lee, C.-W.; Lin, C.-Y. Optimal pH and substrate concentration for fermentative hydrogen production from preserved fruits soaking solution. J. Environ. Eng. Manag. 2010, 20, 35–41. [Google Scholar]
  22. Brown, D.; Shi, J.; Li, Y. Comparison of solid-state to liquid anaerobic digestion of lignocellulosic feedstocks for biogas production. Bioresour. Technol. 2012, 124, 379–386. [Google Scholar] [CrossRef]
  23. Kainthola, J.; Kalamdhad, A.S.; Goud, V. V Optimization of methane production during anaerobic co-digestion of rice straw and hydrilla verticillata using response surface methodology. Fuel 2019, 235, 92–99. [Google Scholar] [CrossRef]
  24. Cremonez, P.A.; Teleken, J.G.; Weiser Meier, T.R.; Alves, H.J. Two-stage anaerobic digestion in agroindustrial waste treatment: A review. J. Environ. Manag. 2021, 281, 111854. [Google Scholar] [CrossRef]
  25. Lay, C.-H.; Kumar, G.; Mudhoo, A.; Lin, C.-Y.; Leu, H.-J.; Shobana, S.; Thi Nguyen, M.-L. Recent trends and prospects in biohythane research: An overview. Int. J. Hydrog. Energy 2020, 45, 5864–5873. [Google Scholar] [CrossRef]
  26. Lay, C.-H.; Sen, B.; Chen, C.-C.; Lin, C.-Y. Continuous anaerobic hydrogen and methane production using water hyacinth feedstock. Arab. J. Sci. Eng. 2016, 41, 2563–2571. [Google Scholar] [CrossRef]
  27. Wang, Y.; Wang, Z.; Zhang, Q.; Li, G.; Xia, C. Comparison of bio-hydrogen and bio-methane production performance in continuous two-phase anaerobic fermentation system between co-digestion and digestate recirculation. Bioresour. Technol. 2020, 318, 124269. [Google Scholar] [CrossRef]
  28. De Vrieze, J.; Hennebel, T.; Boon, N.; Verstraete, W. Methanosarcina: The rediscovered methanogen for heavy duty biomethanation. Bioresour. Technol. 2012, 112, 1–9. [Google Scholar] [CrossRef]
  29. Conklin, A.; Stensel, H.D.; Ferguson, J. Growth kinetics and competition between Methanosarcina and Methanosaeta in mesophilic anaerobic digestion. Water Environ. Res. 2006, 78, 486–496. [Google Scholar] [CrossRef]
  30. Xing, L.; Yang, S.; Yin, Q.; Xie, S.; Strong, P.J.; Wu, G. Effects of carbon source on methanogenic activities and pathways incorporating metagenomic analysis of microbial community. Bioresour. Technol. 2017, 244, 982–988. [Google Scholar] [CrossRef] [PubMed]
  31. Boucias, D.G.; Cai, Y.; Sun, Y.; Lietze, V.-U.; Sen, R.; Raychoudhury, R.; Scharf, M.E. The hindgut lumen prokaryotic microbiota of the termite Reticulitermes flavipes and its responses to dietary lignocellulose composition. Mol. Ecol. 2013, 22, 1836–1853. [Google Scholar] [CrossRef] [PubMed]
  32. Fotidis, I.A.; Karakashev, D.; Angelidaki, I. Bioaugmentation with an acetate-oxidising consortium as a tool to tackle ammonia inhibition of anaerobic digestion. Bioresour. Technol. 2013, 146, 57–62. [Google Scholar] [CrossRef] [PubMed] [Green Version]
  33. Sun, L.; Pope, P.B.; Eijsink, V.G.H.; Schnürer, A. Characterization of microbial community structure during continuous anaerobic digestion of straw and cow manure. Microb. Biotechnol. 2015, 8, 815–827. [Google Scholar] [CrossRef] [Green Version]
  34. Venkiteshwaran, K.; Bocher, B.; Maki, J.; Zitomer, D. Relating anaerobic digestion microbial community and process function. Microbiol. Insights 2015, 8 (S2), 37–44. [Google Scholar] [CrossRef] [Green Version]
Figure 1. Scheme of single-stage and two-stage systems.
Processes 09 01324 g001
Figure 2. Cumulative methane production from various swine manure sources.
Processes 09 01324 g002
Figure 3. Methane production rate (MPR) (a) 3D surface plot, (b) contour plot and methane production yield (MY) (c) 3D surface plot, (d) contour plot at various initial pH and reaction times for the hydrolysis-acidogenesis stage.
Processes 09 01324 g003
Figure 4. Methane production rate at two-stage and single-stage systems.
Processes 09 01324 g004
Figure 5. Archaea community at static state period of two-stage and single-stage systems.
Processes 09 01324 g005
Figure 6. Bactria community at static state period of two-stage and single-stage systems.
Processes 09 01324 g006
Figure 7. Venn diagram of core OTUs at static state period of two-stage and single-stage systems.
Processes 09 01324 g007
Table 1. Methane production and pollutant removal efficiency from various swine manure sources.
FeedstockCH4 (mL)CH4 Content (%)Modified Gompertz Equation Parameter ValueMPRmax (mL/L-d)MY (mL/g VSadd)TCOD Removal (%)TS Removal (%)
P (mL)Rm (mL/d)λ (d)R2
Supernatant
liquid
120 ± 13.857 ± 6114 ± 1011.1 ± 0.20.42 ± 0.10.9765139 ± 3316 ± 3757 ± 737 ± 2
Raw swine
wastewater
408 ± 15.959 ± 9399 ± 1442.4 ± 0.31.20 ± 0.20.9943530 ± 4178 ± 759 ± 925 ± 2
Settled
sludge
676 ± 19.956 ± 8725 ± 1848.6 ± 0.41.44 ± 0.30.9891608 ± 6160 ± 556 ± 916 ± 1
Table 2. Central composite design matrix of two variables in the coded and natural unit along with observed responses for optimizing the hydrolysis-acidogenesis stage.
RunCoded VariablesNatural VariablesCH4 (mL)CH4 Content (%)Modified Gompertz Equation Parameter ValueMPRmax (mL/L-d)MY (mL/g VSadd)
X1X2pHTime (d)P (mL)Rm (mL/d)λ (d)R2
1−1−15.51.039.244.038.66.160.830.987861.624.65
2−115.52.028.441.531.73.670.800.983136.717.86
31−18.51.029.249.030.75.801.020.986358.018.36
4118.52.028.443.929.56.551.080.992665.517.86
5007.01.542.546.243.48.001.030.993280.026.73
6007.01.544.148.047.98.501.010.992285.027.74
7007.01.546.349.752.67.590.960.987875.929.12
82010.01.526.443.053.92.850.780.982928.516.60
9−204.01.527.446.538.94.580.940.981045.817.23
10027.02.524.731.235.14.281.010.962642.815.53
110−27.00.519.335.726.82.862.570.957928.612.14
Table 3. ANOVA results for the response surface quadratic model (MPRmax).
SourcedfSum of SquaresMean SquareF-Valuep-Value *
Model53851.97770.394250.0428
A-pH10.19040.19040.00010.9751
B-Time10.59500.59500.00330.9559
AB1254.40254.401.400.2750
A211946.51946.510.730.0136
B212118.892118.8911.680.0112
Std. Dev. 13.47
Adj-R2 0.5749
Lack of Fit31228.35409.4539.320.0020
Pure Error441.6510.41
Cor Total125121.97
* Probability value (p < 0.05 assumed significant, p > 0.05 assumed not significant); df = degree of freedom.
Table 4. ANOVA results for the response surface quadratic model (MY).
SourcedfSum of SquaresMean SquareF-Valuep-Value *
Model5339.4467.897.560.096
A-pH16.456.450.71770.4249
B-Time10.77860.77860.08670.7770
AB19.899.891.100.3289
A21126.93126.9314.130.0071
B21234.96234.9626.160.0014
Std. Dev. 3.00
Adj-R2 0.7321
Lack of Fit359.0119.6720.370.0069
Pure Error43.860.9657
Cor Total12402.31
* Probability value (p < 0.05 assumed significant, p > 0.05 assumed not significant); df = degree of freedom.
Table 5. Performance of single-stage and two-stage production reactors.
ParametersUnitSingle-Stage SystemTwo-Stage System
HAD *MD *
HRTdays301.528.5
Temperature°C353535
pH-7.0 ± 0.46.5 ± 0.47.0 ± 0.4
Working volumeL212
Feedstock
Total solidg/L5.0 ± 1.25.0± 1.2-
Organic loading rateg COD/L-d4.0 ± 0.34.0 ± 0.3-
Effluent of total solid%2.9 ± 0.44.5 ± 0.32.3 ± 0.2
Total solid reduction%39 ± 310 ± 252 ± 4
Effluent of volatile solid%1.4 ± 0.21.5 ± 0.31.1 ± 0.3
Volatile solid reduction%63 ± 360 ± 372 ± 4
Effluent of total CODg/L35 ± 580 ± 624 ± 36
Total COD reduction%61 ± 411 ± 270 ± 3
Biogas production ratemL/L-d300 ± 213ND *320 ± 225
Biogas production yieldmL/g-VSadd60 ± 4ND64 ± 6
CH4 content%30 ± 59 ± 460 ± 6
CH4 production ratemL/L-d101 ± 85ND163 ± 103
CH4 production yieldmL/g-VSadd18 ± 2ND38 ± 6
* HAD, hydrolysis-acidogenesis digester; MD, methanogenesis digester; ND, not detectable.
Publisher’s Note: MDPI stays neutral with regard to jurisdictional claims in published maps and institutional affiliations.

