Article

The Effect of Initial Conditions with Aerobic Biological Treatment on Aniline Dyeing Wastewater

1
College of Civil Engineering, Kashi University, Kashi 844006, China
2
School of Chemistry and Chemical Engineering, Shanghai University of Engineering Science, Shanghai 201620, China
3
Department of Science, Zhengzhou University, Zhengzhou 450000, China
*
Author to whom correspondence should be addressed.
Submission received: 21 June 2021 / Revised: 24 July 2021 / Accepted: 27 July 2021 / Published: 30 July 2021
(This article belongs to the Special Issue Advances in Water and Wastewater Treatment Processes)

Abstract

:
According to the characteristics of aniline dyeing wastewater, aerobic biological treatment was adopted herein, and high-throughput sequencing technology was used to analyze the changes to the microbial community structure and diversity in the aerobic sludge acclimation stage. As a result, according to the experimental study on the effects of different biomass, the initial pH value and the salinity with the aerobic biological treatment, the chemical oxygen demand (COD) degradation rate can increase linearly with the increase in biomass under different biomass conditions. The organic matter degradation rate is 6.24 mg/L COD·h−1·(mg/L·MLSS)−1, with a correlation coefficient (R2) of 0.98704. When the initial pH value is less than 7.0 ± 0.2, the COD degradation rate increases with the increase in the initial pH value and then decreases gradually. The optimal sludge concentration is 4 g/L; the optimal initial pH value is in the range of 7.0–8.0; the optimal salinity is 1.7%. When the initial concentration of COD is 3000 mg/L, the COD value gradually stabilizes and decreases to 1500 mg/L after 32 h, the degradation rate reaches 50%, and the pH decreases from 7.5 to 4.5. Sphingopyxis has been detected in sludge samples from the third cycle of acclimation, which can biodegrade aromatic compounds, anthraquinone dyes, and their intermediates, and the relative abundance of Sphingopyxis increased from 0.18% to 5.08%, indicating a potential biodegradation ability of aniline dyeing wastewater.

1. Introduction

In China, the dyestuff industry is a traditional chemical industry, and the dye production quantity is higher than 60% of the total production of other countries. The export and consumption quantities are the highest in the world. According to research, the annual production value of the dyestuff industry in China is 100,000 tons, and production has been rising gradually, recently [1]. In the production of dyes and the use of various processes, dyeing wastewater discharge exceeds 16% of industrial wastewater, as it contains many inorganic salts, such as NaCl, CaCl2, and Na2SO4 [2,3,4,5,6], thereby causing serious pollution to the environment. In addition, the salinity in industrial wastewater has reached 10–20% [7], increasing the difficulty of treating aniline dyeing wastewater. In addition to high salinity, numerous toxic and difficult-to-degrade pollutants, such as benzene ring compounds, are present in aniline dyeing wastewater. When aniline dyeing wastewater is directly discharged into the natural environment, the soil, groundwater, and surface water are seriously polluted. Thus, the European Union issued a social convention to prevent the aquatic environment from being harmed by organic wastewater with higher salinity. In particular, high salinity increases the difficulty of biodegrading hydrocarbons and benzene ring compounds in aniline dyeing wastewater.
At present, biological treatment methods are used to treat aniline organic wastewater, and several beneficial results for engineering applications have been obtained. According to the results, the traditional activated sludge process for organic pollutant removal significantly reduces the rate when the salt content exceeds a certain range, and can even lead to a system collapse. Through the domestication and screening of microorganisms, they can gradually adapt to an environment with high salt content and organic concentration, such that they can perform normal oxidation and decomposition reactions. In the mid-1990s, the aerobic biological treatment of high-salt wastewater technology developed rapidly. Aerobic biological methods mainly include activated sludge and biofilm methods. Among them, the sequencing batch reactor activated sludge process (SBR) method has often been used to treat aniline dyeing wastewater because of its strong resistance and flexible application. Zobell et al. [8] used biological methods for the first time to treat high-salt wastewater, in which microorganisms were selected from domestic sludge, soil, and seawater. The results showed that when the salt content reached 28%, the survival rate of microorganisms was very low, at 0%, less than 1%, and less than 2%, respectively. Thus, an essential prerequisite for the biological treatment of high-salt wastewater is to screen out the salt-tolerant microorganisms with high organic pollutant degradation rates from activated sludge. Uygur et al. [9] observed that when the SBR method was used to treat high-salt wastewater, the chemical oxygen demand (COD) degradation rate decreased with the increase in salinity, which was only about 33% when the salinity exceeded 6%. Hamoda et al. [10] domesticated the activated sludge that used to treat high-salt wastewater, and the TOC degradation rate reached about 97% when the NaCl content was 3%. He Jian et al. [11] domesticated and screened out microorganisms with high salinity tolerance by gradually increasing the organic load and salt content. Their results showed that when the mass concentration of sodium chloride in the influent was within the range of 26.8–47.2 g/L, the COD degradation rate and phenylacetic acid were both above 95%.
In this study, the characteristics of aniline dyeing wastewater, the effect of biomass, initial pH, and salinity during aerobic biological treatment on organic pollutant degradation at different stages of the situation were investigated. In addition, high-throughput sequencing technology was used to study and analyze the changes to the microbial community diversity and structure at the aerobic biological treatment stage, thereby providing a theoretical basis for subsequent application of the sequencing technology.

2. Materials and Methods

2.1. Material

The test water was obtained from a dye and chemical company and had a salt content of 17%, a pH of 11.03, and a COD of approximately 30,000 mg/L. The specific water quality indexes are shown in Table 1. The aerobic sludge inoculated into the experiment was obtained from the bottom of the aeration tank of the Wulongkou sewage treatment plant in Zhengzhou City. The total solid was 5.81 g/L, and the volatile solid accounted for 54.47% of the total solid. The sludge was exposed for about 1 day before being used in the experiment; it gradually changed from black to brown.

2.2. Sludge Domesticated

A total of 2 L of activated sludge was inoculated into the reactor, and 4 L of water, with the pH value of approximately 7.5 at room temperature, was added to the reactor. During the test, the COD value in the wastewater was regularly sampled and measured until the COD gradually reached stability, which was regarded as a domestication cycle. During the process of sludge acclimation, the mixed liquor suspended solids (MLSS) of the sludge in the reactor were kept at 5 g/L by a regular sludge discharge, and the change in the COD during the acclimation process was measured.

2.3. Effects of Biomass, Initial pH, and Salinity

The quantitative domesticated and matured sludge was inoculated into reactors R1, R2, R3, and R4, and the MLSS values in the four reactors were 1, 3, 6, and 9 g/L, respectively. The influent organic matter concentration was 2700–2900 mg/L, the initial pH was 7.5, and the dissolved oxygen (DO) was approximately 4.0–6.0 mg/L. During the experiment, the COD changes at different reaction moments were measured after sampling regularly and centrifuging for 10 min. The sludge concentration of suspended solids (SS) can be considered to remain constant within an operating cycle.
Under other experimental conditions, namely the sludge concentration of 4 g/L, salinity of 1.7%, and COD of about 2800 mg/L, the initial pH value of the four reactors were 5.0 ± 0.2, 6.0 ± 0.2, 7.0 ± 0.2 and 8.0 ± 0.2. With regular sampling at different reaction times, the COD and pH changes were measured. The sludge concentration of SS can be considered to remain the same within an operating cycle.
In the case of other experimental conditions, namely the sludge concentration of 4 g/L, an initial pH of 7.0 ± 0.2, and COD of about 2800 mg/L, the salinity concentration in the four reactors were 1%, 1.7%, 2.5%, and 4%, respectively. With regular sampling at different reaction times, the COD and pH changes were measured. The sludge concentration of SS can be considered to remain the same within an operating cycle.

2.4. High-Throughput Sequencing

Sludge samples were taken from before acclimation and the third, and sixth cycles of acclimation of activated sludge and labeled as Group 1, Group 2, and Group 3, respectively. High-throughput sequencing was then performed on the three samples to analyze changes to the microbial community structure and diversity in the samples. The main test steps are as follows:
(1)
Genome extraction from sludge samples;
(2)
Initial PCR amplification;
(3)
Second extended amplification sequencing primer;
(4)
Quantitative mixing;
(5)
Sample database construction and sequencing;
(6)
Sequence analysis [12].
All sequences obtained after removing the primers and tags from the high-quality sequences were compared using the Mothur software. Chimeras, primers, and sequences less than 200 bp in length were removed, and the genetic distances of the sequences were calculated at a 97% similarity level to determine the operational taxonomic units. In addition, based on the analysis of species richness, the Mothur software was used to calculate the richness (Chao1 index, ACE index), the diversity index (Simpson and Shannon–Wiener indexes), and the coverage of alpha diversity index. Furthermore, the 16S rDNA gene series was compared with the silva database to determine the taxonomic status of the corresponding microorganisms. Based on the UniFrac distance, the online UniFrac program was used to perform the weighted principal coordinate analysis of the three sludge samples, and the similarity of bacterial communities in each sample was compared via a cluster analysis diagram.

3. Results and Discussion

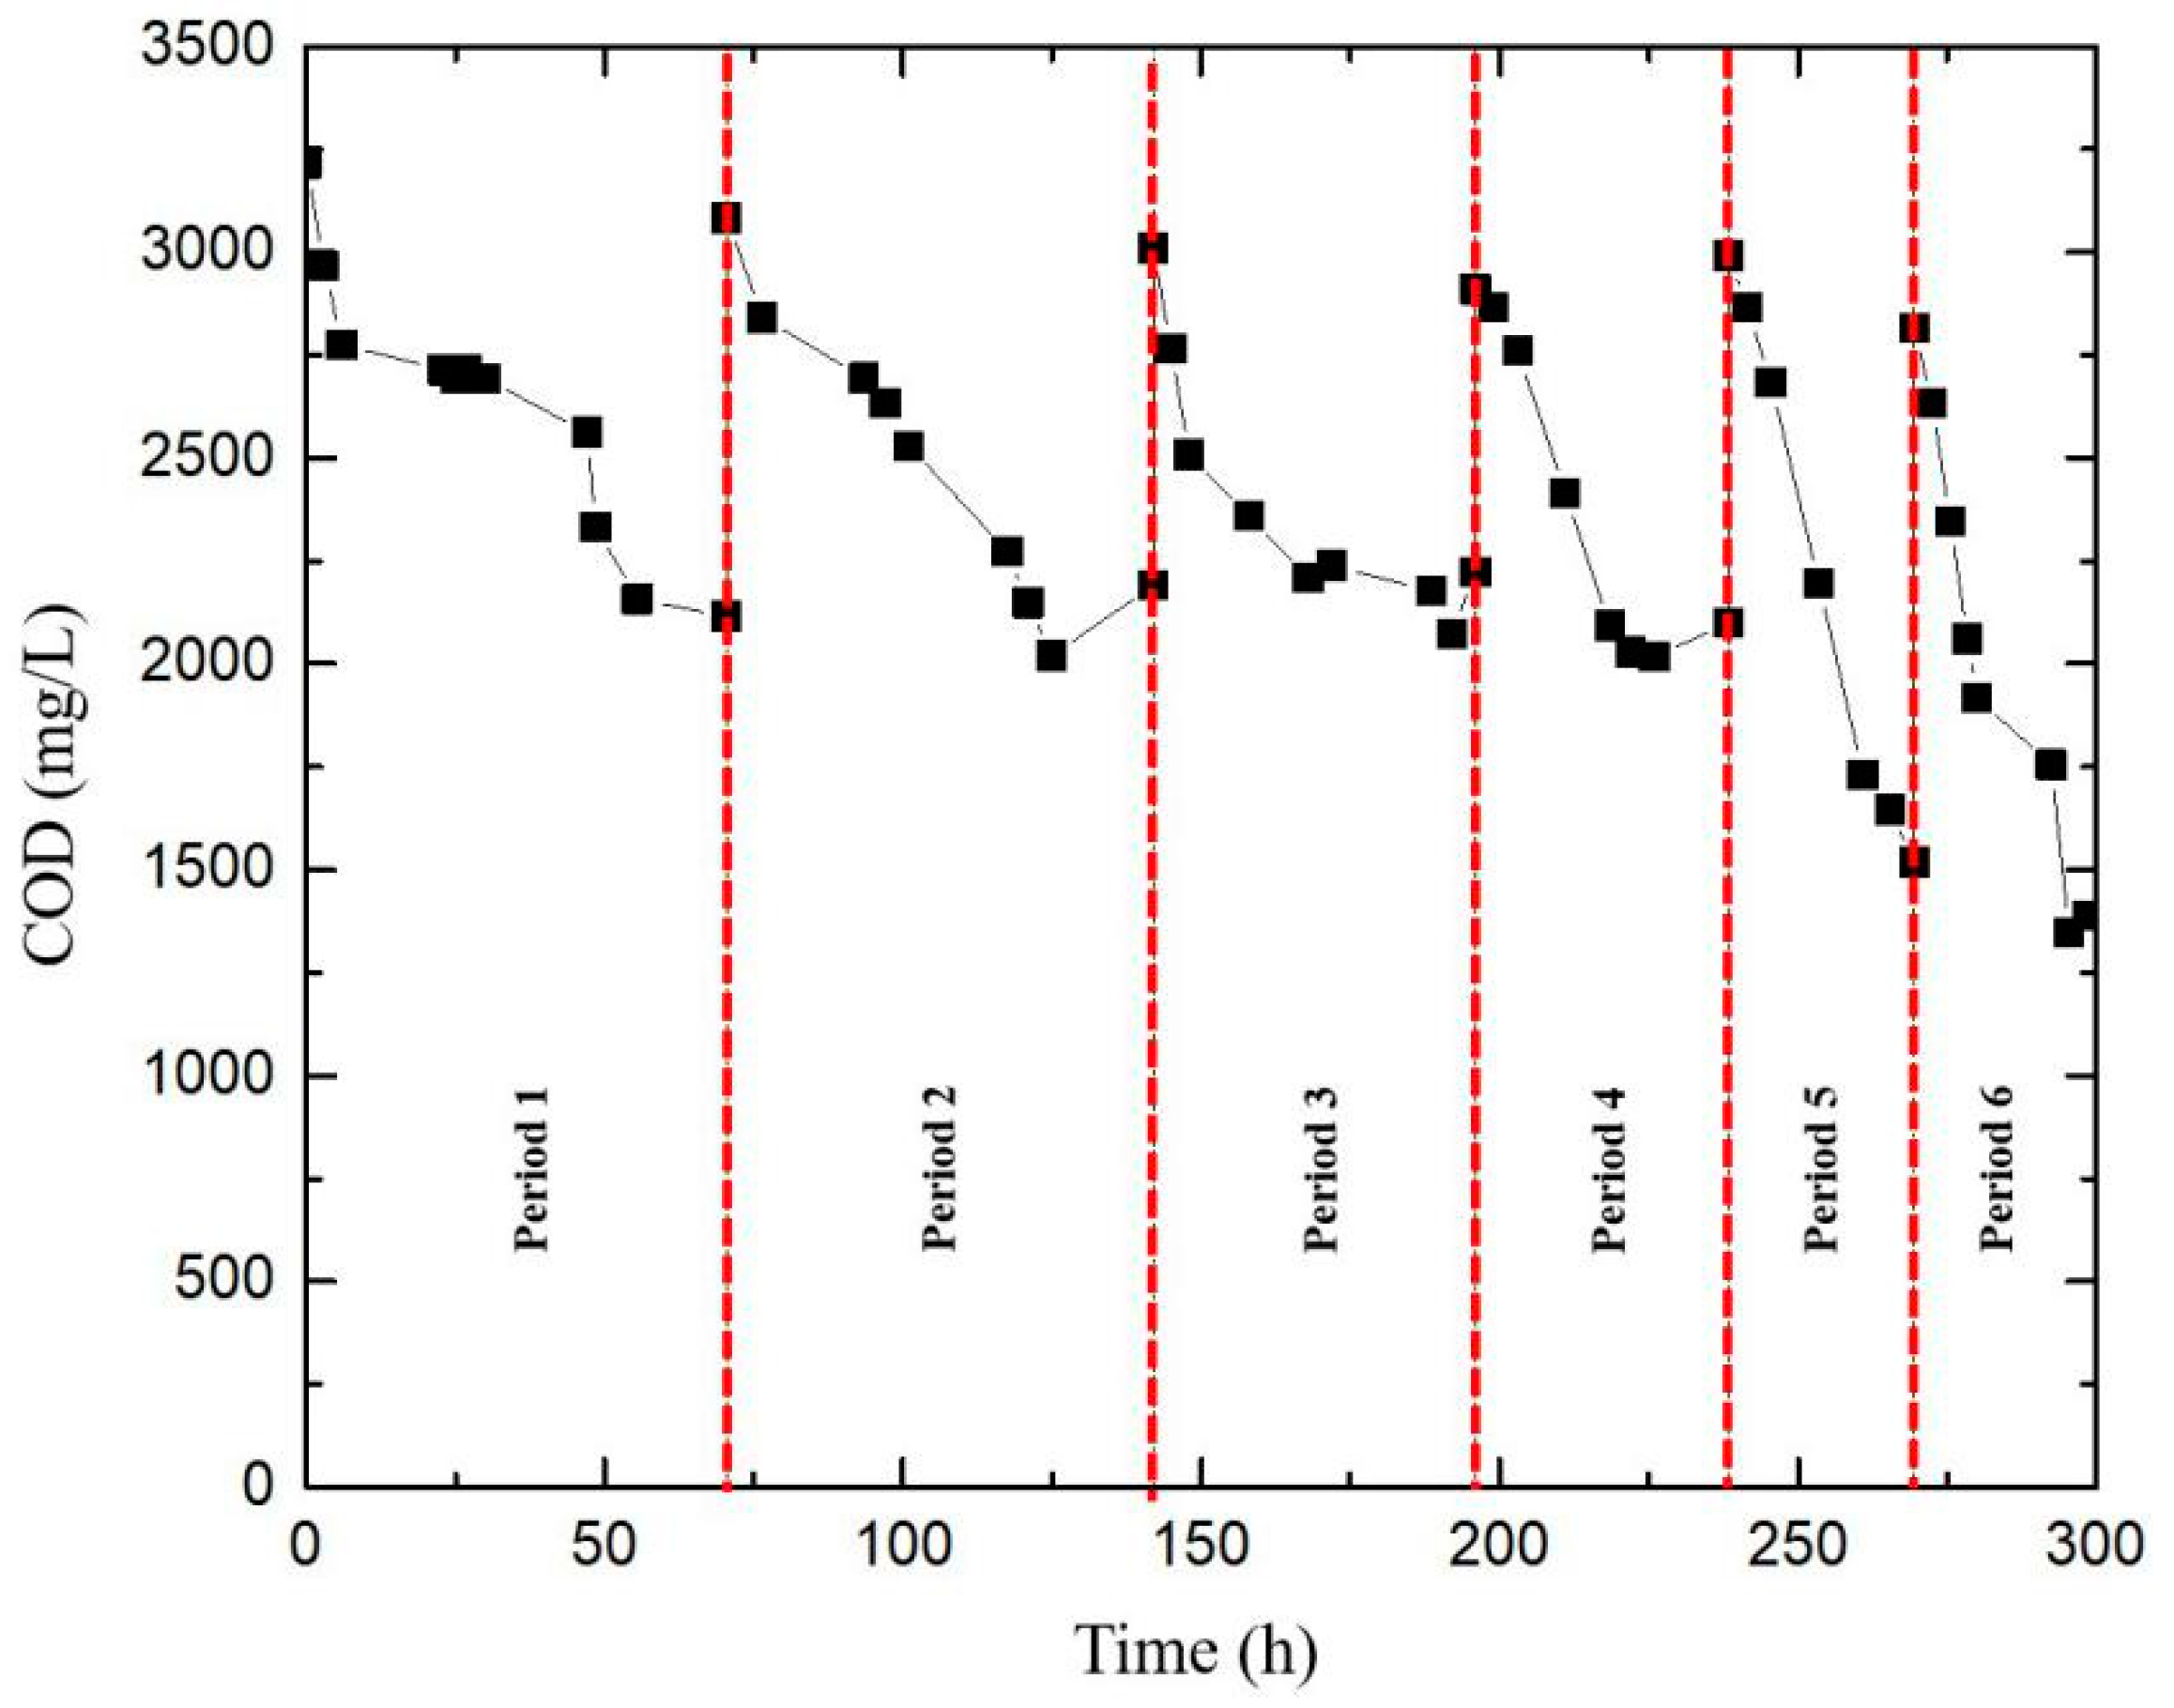
3.1. COD Change in Each Cycle of Sludge Acclimation

Activated sludge was inoculated into the reactor, and the COD degradation in the wastewater by activated sludge at each acclimation stage was measured, as shown in Figure 1 and Table 2. As can be seen in Figure 1, in the early stages of acclimation, the COD needed a long residence time to reach stability. In the first cycle, the COD value dropped to about 2158 mg/L after the reaction time of 70.5 h, and the COD degradation rate was low, only 15.6%, indicating that the microorganisms, in the early stages of acclimation, were unable to adapt to the wastewater quality. After four acclimation cycles, the time required for the COD to reach stability was significantly shortened, and the removal rate of the COD increased gradually. In the fifth and sixth acclimation cycles, after 32 h of reaction, both the effluent COD concentration and COD degradation rate gradually reached a stable level; the degradation rate was about 50%. Moreover, the sludge flocs were compact and had good precipitation performance. It can be considered that the acclimation and maturation of sludge had the activities needed to degrade the organic pollutants in the wastewater, that is, the acclimation process of the microorganisms was basically complete.

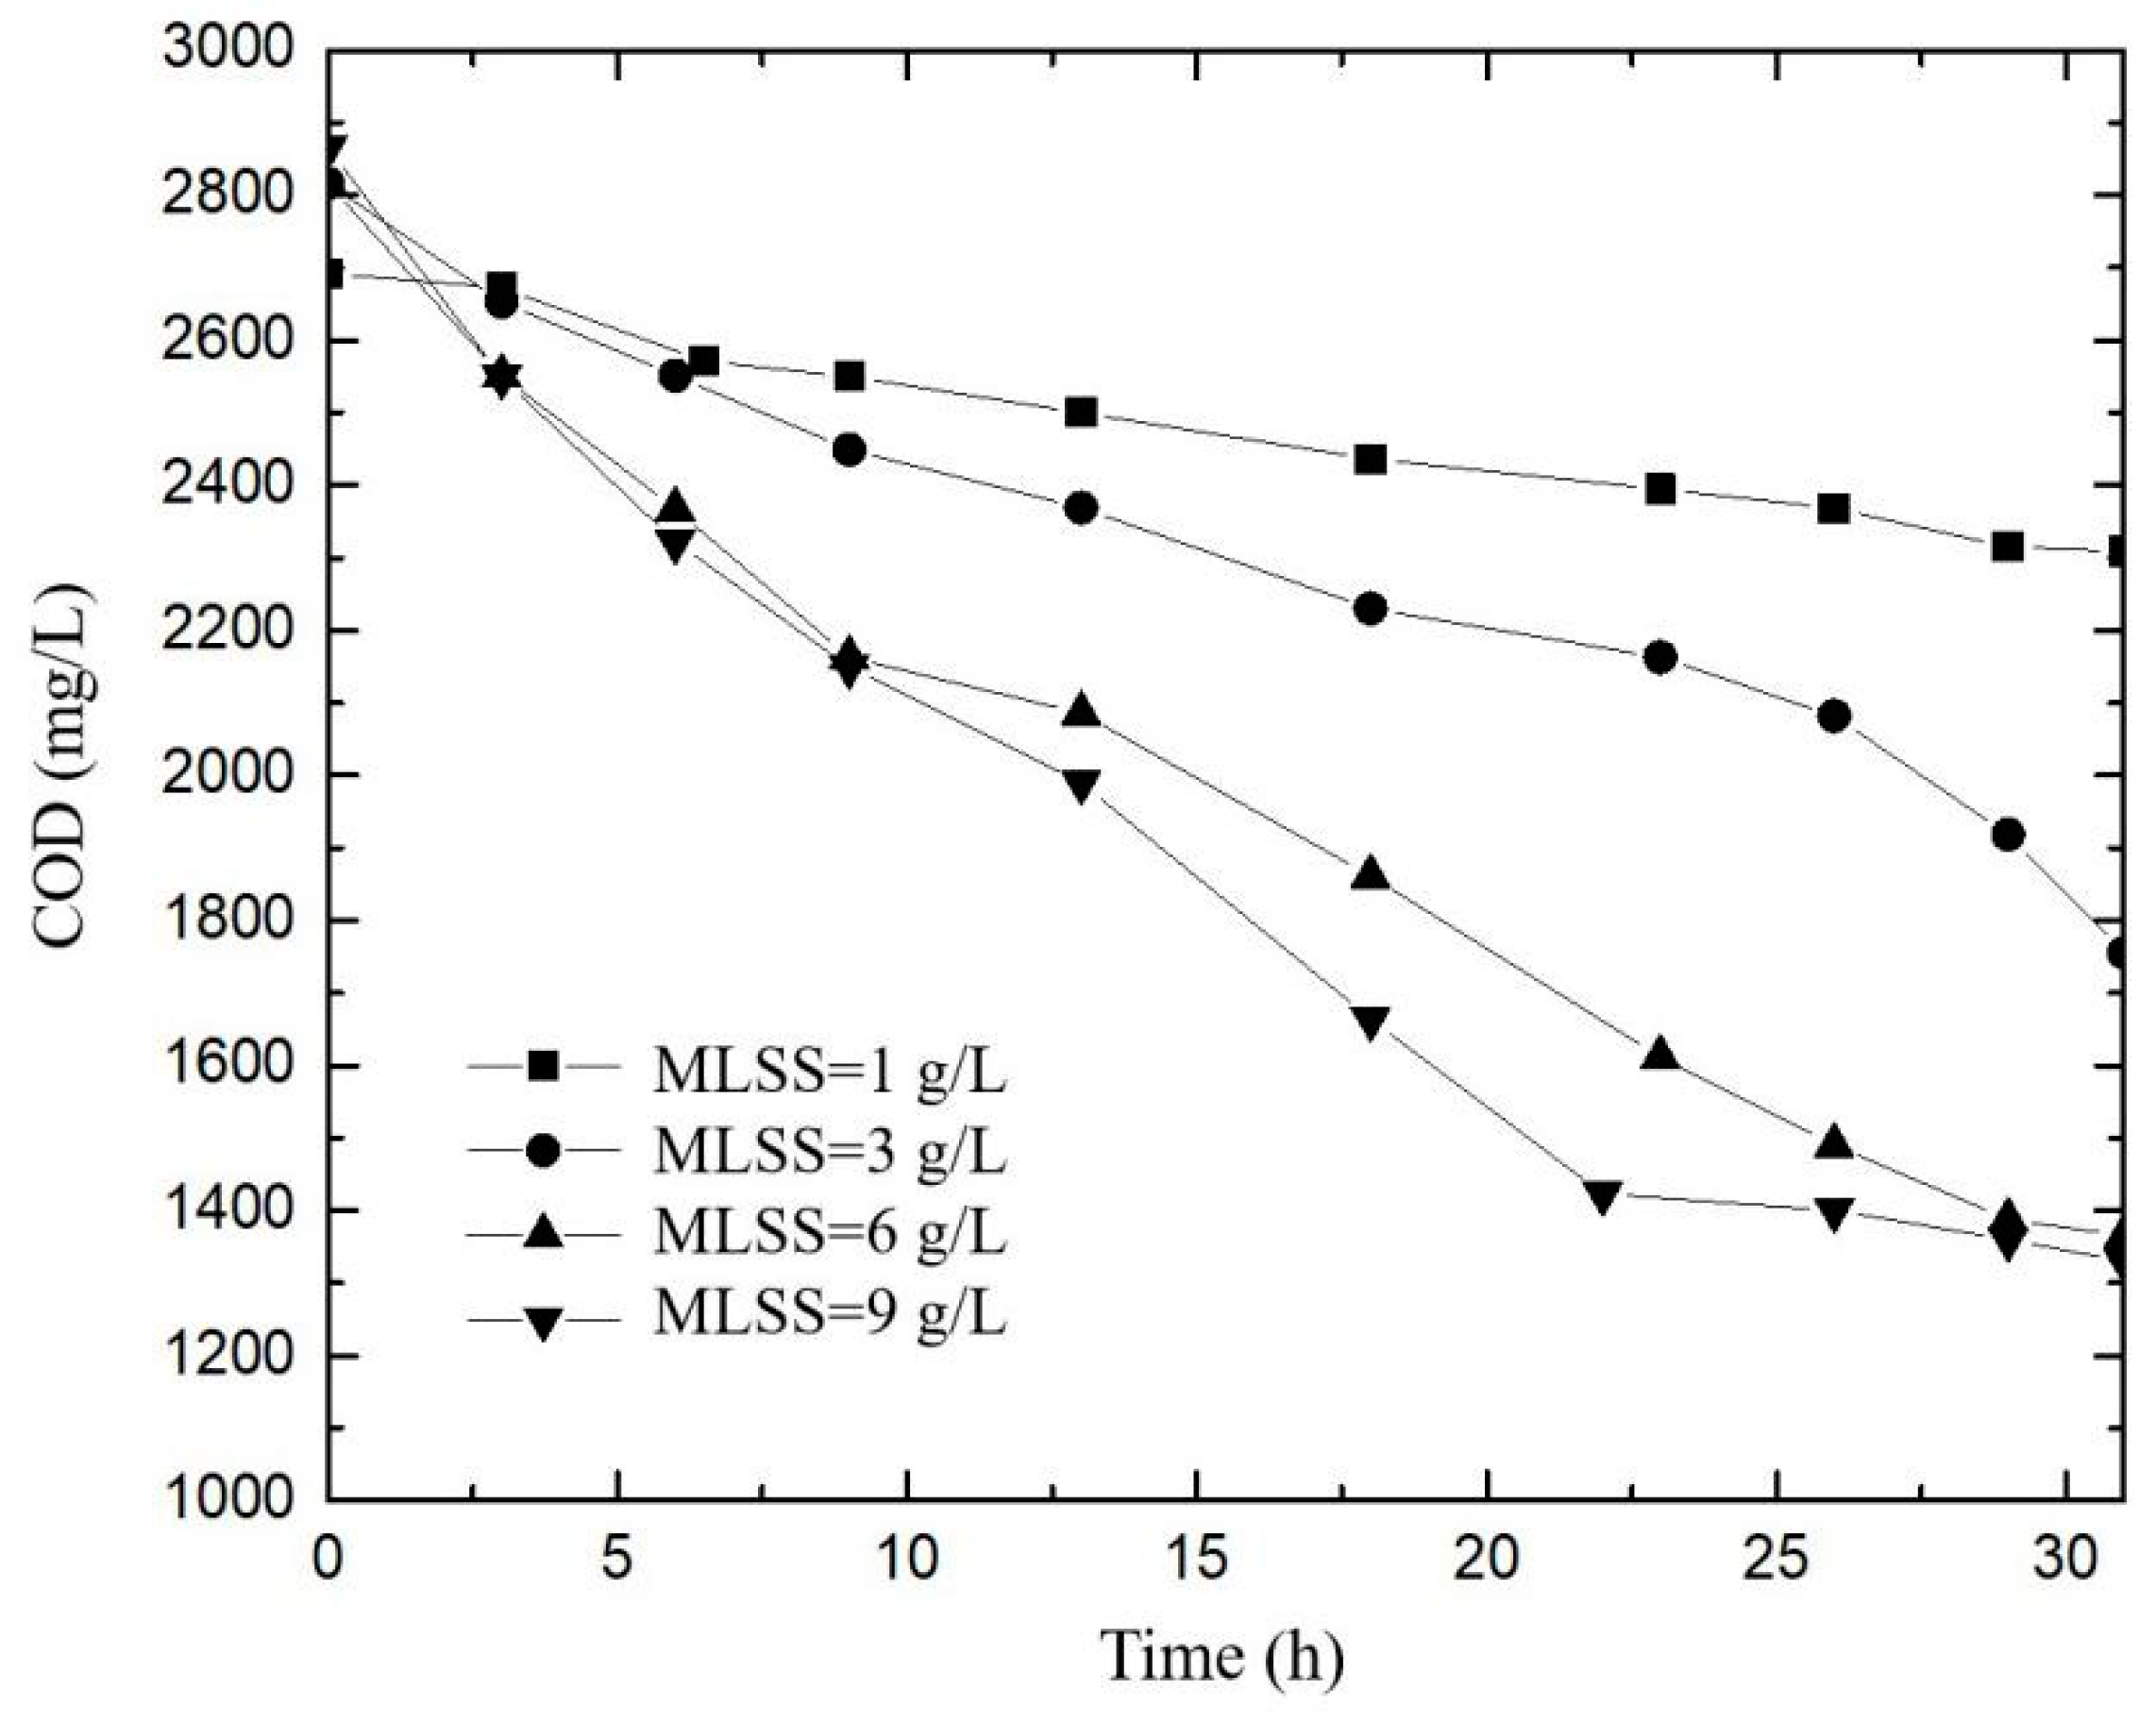
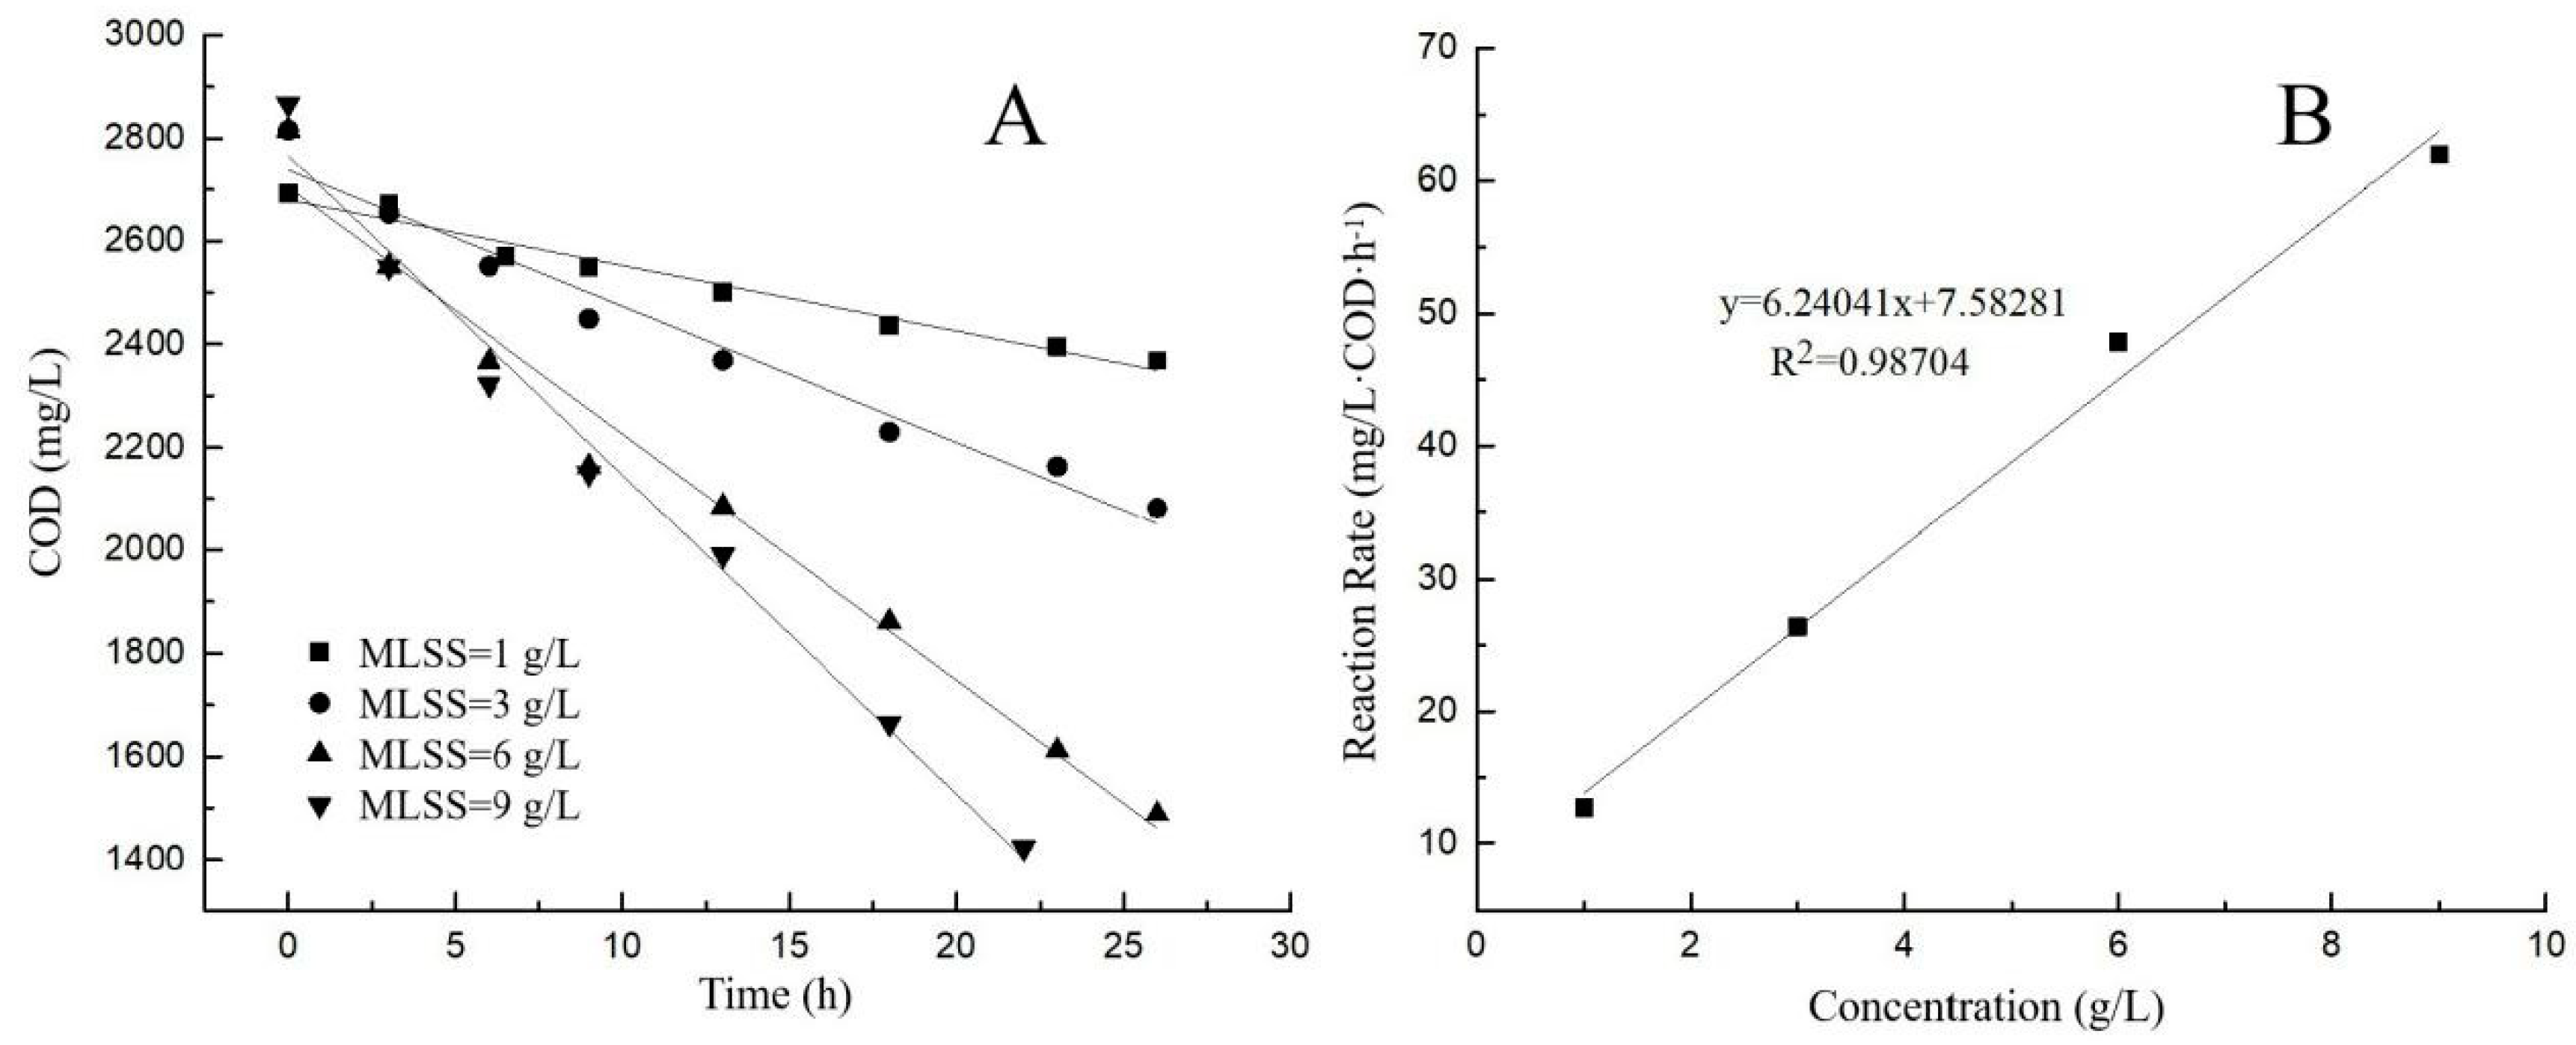
3.2. Effect of Biomass on COD Change

Sludge concentration refers to the MLSS, including active microorganisms, organic matter adsorbed on the sludge, residues of microbial oxidation, and inorganic substances. Changes in activated sludge concentration have a significant effect on the organic pollutant degradation rate. This experiment investigated COD degradation under different biomass conditions, and the test results are shown in Figure 2.
As can be seen in Figure 2, with the increase in MLSS, the time for the COD to reach stability was gradually shortened, and the degradation rate was gradually increased. This is because, with the increase in the sludge concentration, the microbial biomass increased, and the organic matter use rate increased, that is, the degradation rate increased. When the MLSS content was 1 g/L and the reaction time was 26 h, the COD value gradually reached stability and dropped to 2368 mg/L, and the COD degradation rate was low, only 12%. This is because, in the case of low biomass, the organic substrate is relatively sufficient and the microbial enzyme is in the saturated state, thereby causing the low COD degradation rate. When the MLSS content was 3 g/L, after 31 h reaction time, the COD decreased to 1755 mg/L and still had a decreasing trend, reaching a degradation rate of 37.7%. When the MLSS content was 6 g/L and the reaction time was 29 h, the COD value gradually reached a stable level and dropped to 1500 mg/L; the degradation rate was approximately 46.7%. When the MLSS content was 9 g/L and the reaction time was 22 h, the COD value gradually reached a stable level and dropped to 1423 mg/L; the degradation rate was approximately 50.3%.
As can be seen in Figure 3A, when the MLSS content increased gradually, the COD degradation rate also increased continuously; when the MLSS content was 1, 3, 6, and 9 g/L, the COD degradation rate was 12.69, 26.40, 47.85, and 61.96 mg/L COD·h−1, respectively.
By linear fitting of the reaction rates with the MLSS content, the COD degradation rate per unit of MLSS content can be obtained (Figure 3B). Figure 3B shows the reaction rate under different MLSS contents. As can be seen in the figure, within a certain range of MLSS content, the organic matter degradation rate increased with the increase in MLSS content, and the two were positively linearly correlated. Through linear fitting, the organic matter degradation rate per unit of MLSS content was determined to be 6.24 mg/L COD·h−1·(mg/L MLSS)−1, with a correlation coefficient of (R2) = 0.98704. The results show that if the initial MLSS content is too high, it will affect the organic matter degradation rate. It will require high aeration equipment and increase the effluent suspended matter, and it will also lead to competition among the microorganisms for nutrients, resulting in a serious lack of nutrients in the water, which will affect the normal physiological activities of microorganisms and make the final treatment effect worse. The sludge concentration in the following sections of this experiment was 4 g/L.

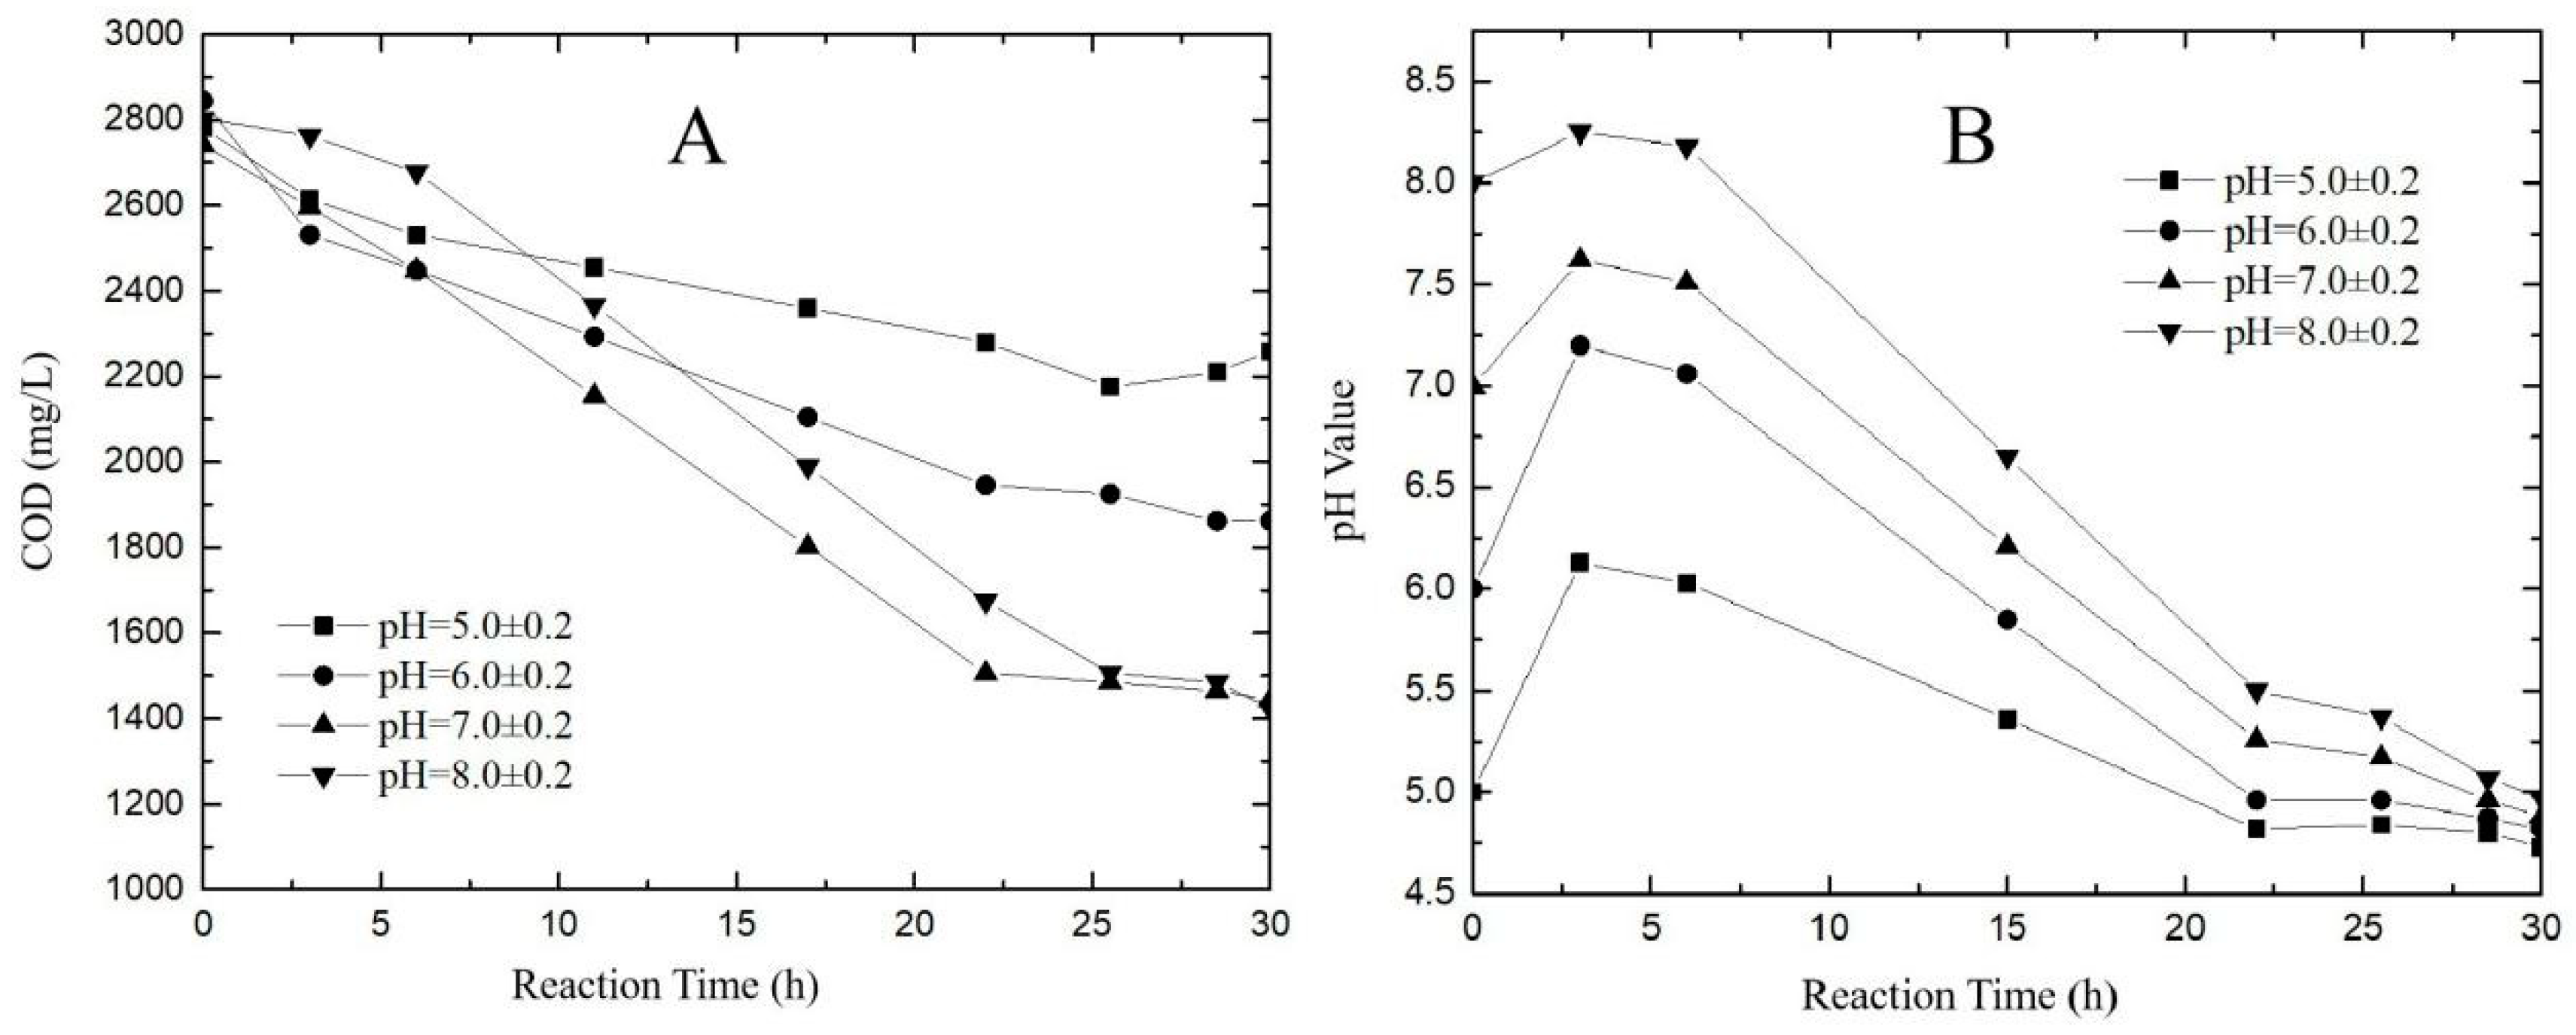
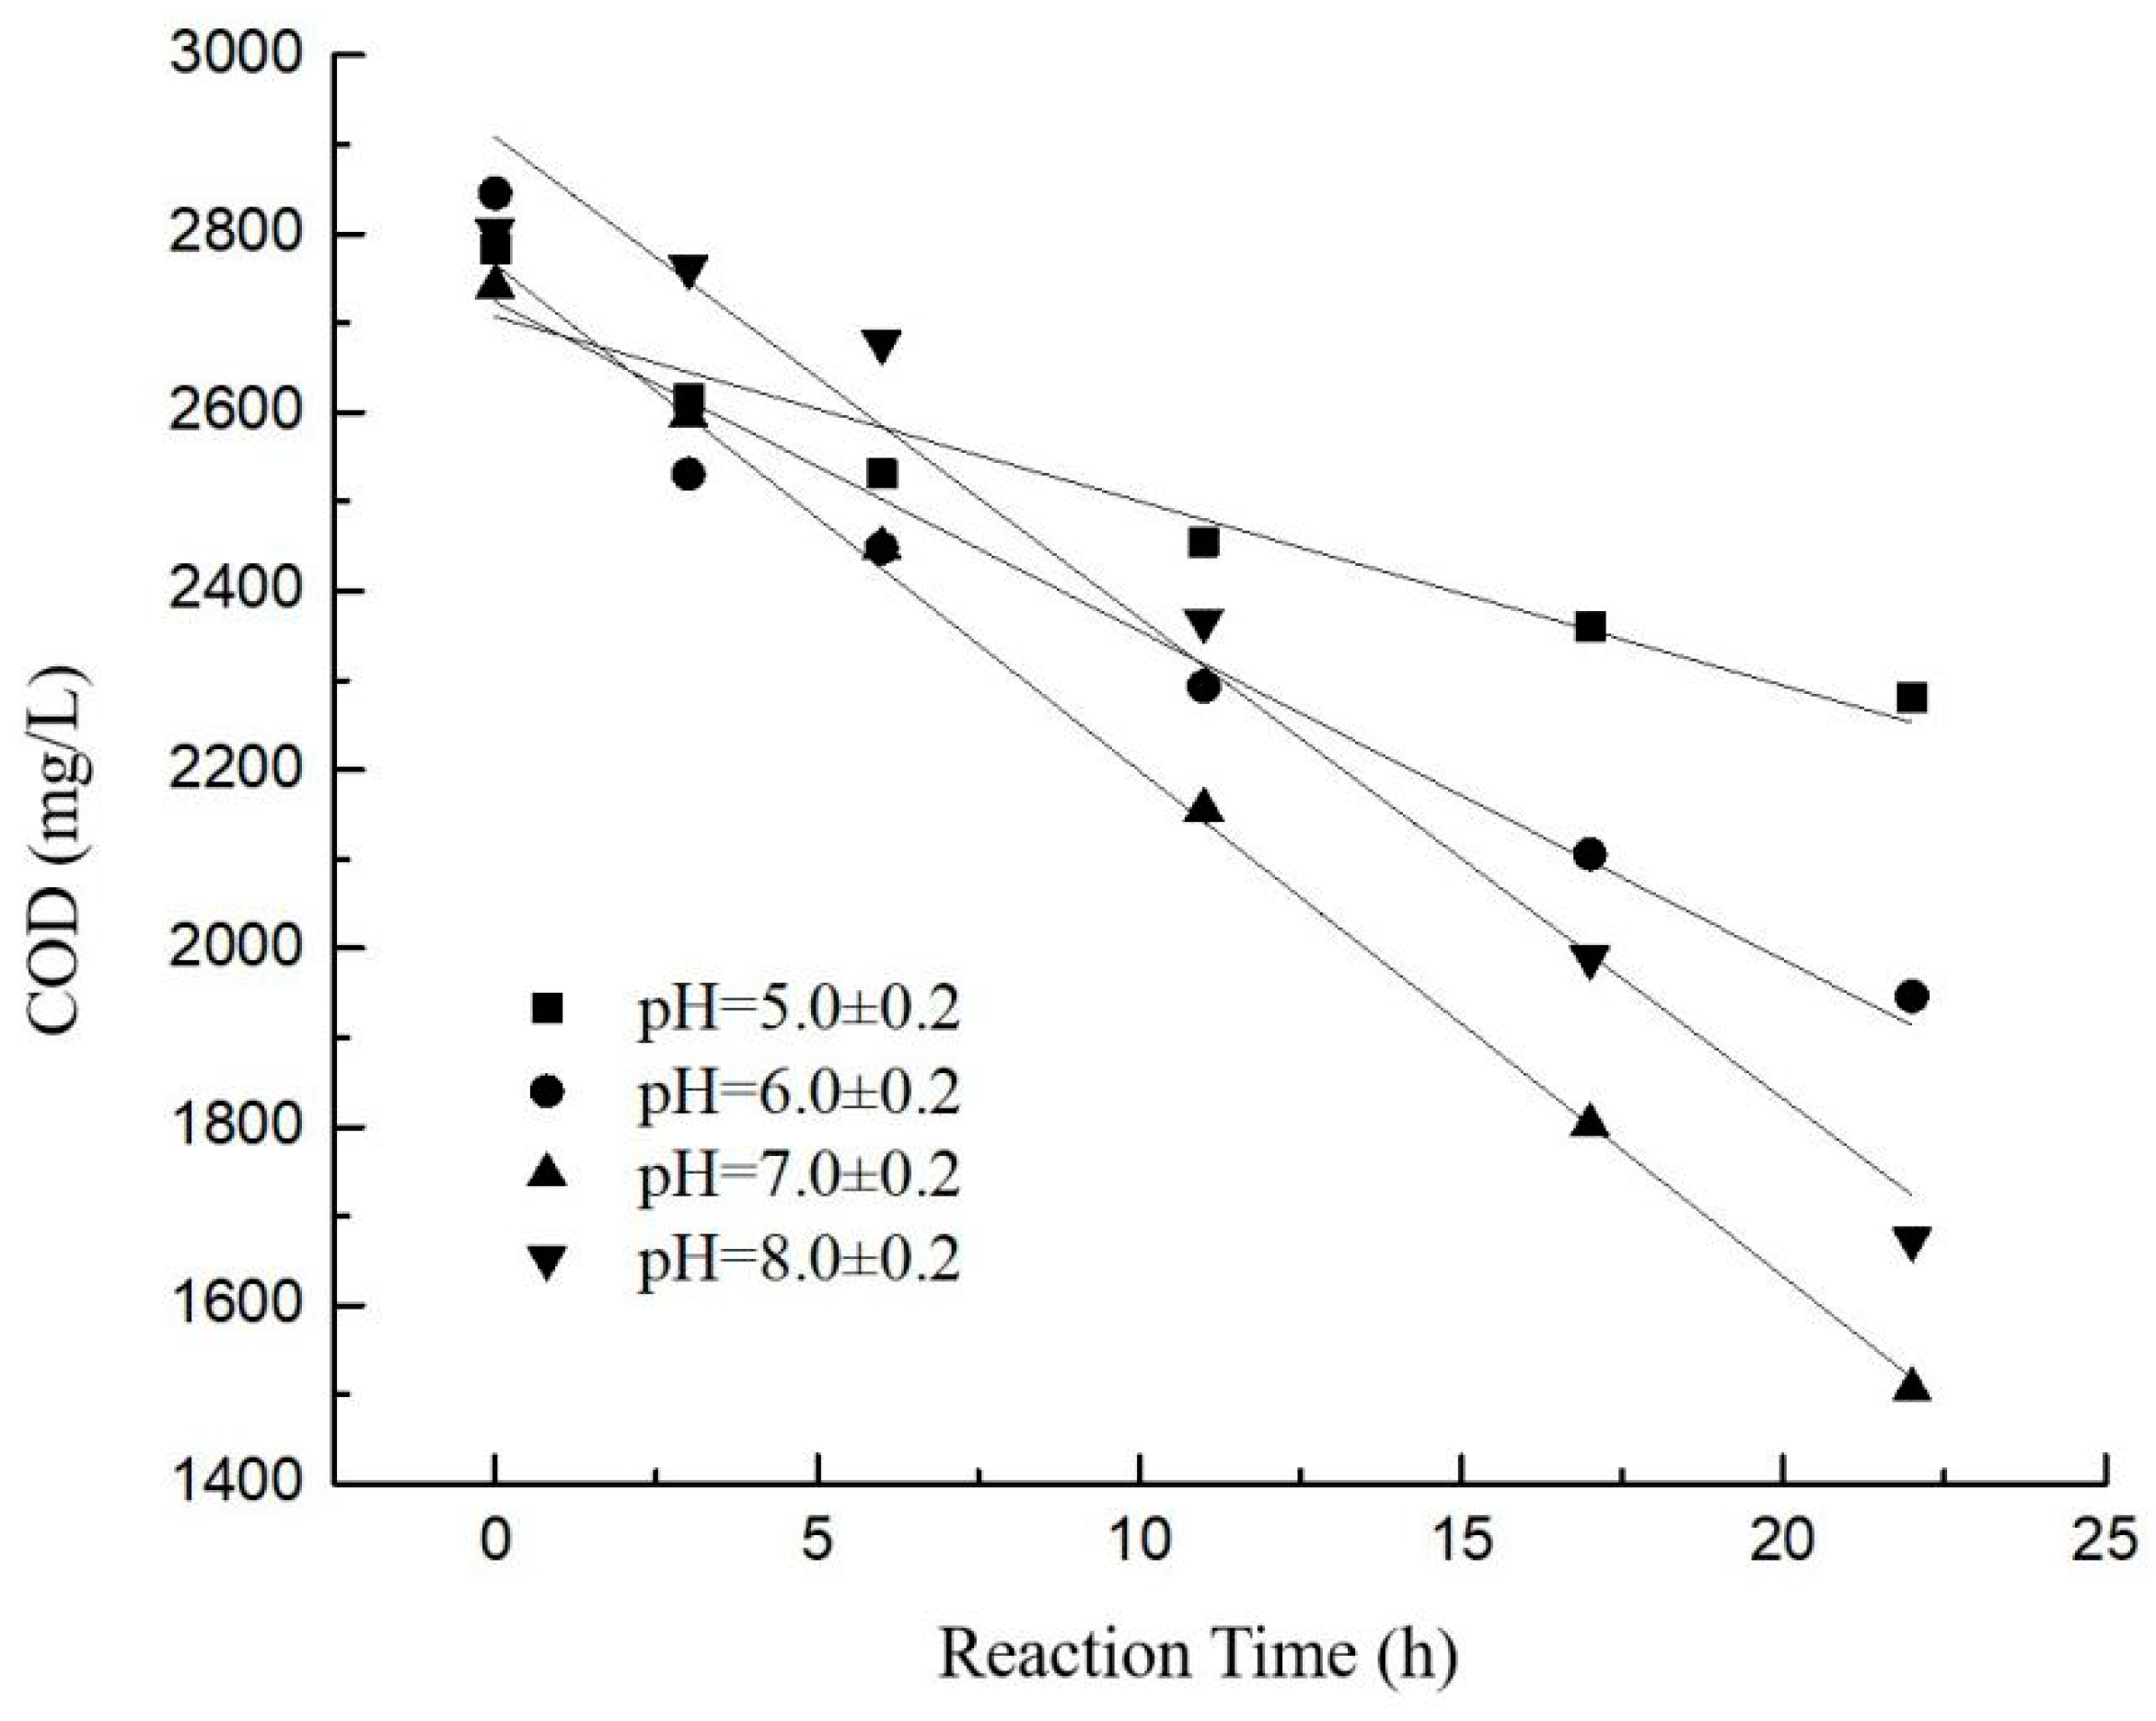
3.3. Influence of Initial pH Value on COD and pH Change

The pH value can reduce the microbial cell activity of the enzyme, and even the deactivation, which affects the microbial metabolic activity. Different microorganisms require different pH value; a high pH value is not conducive to the growth of the sludge or damage to the sludge, and a low pH value can make the filamentous bacteria multiply, thus inhibiting more growth. For aerobic bacteria, a pH value of around 6.5–8.5 is most suitable. Under the conditions of different initial pH values, changes in the COD and pH are shown in Figure 4.
As can be seen in Figure 4B, the pH of the reaction showed an increasing trend within 3 h. A preliminary analysis showed that it was due to the oxidation of organic matter containing carbon, which was mainly oxidized into CO2 and reacted in the water to generate H2CO3, HCO3, and CO32−, and the pKa of the buffer system comprising HCO3 and CO32− was 10.25. Thus, establishing this equilibrium caused the pH of the water to rise. After the reaction time of 3 h, the pH value gradually decreased, indicating that the organic matter in the wastewater was gradually degraded into acidic substances.
The COD changes at different initial pH values were linearly fitted to obtain the reaction rates under various reaction conditions, as shown in Figure 5 and Table 3. From Figure 5, when the initial pH value was less than 7.0 ± 0.2, the COD degradation rate increased with the increasing initial pH value, and with the initial pH value of 7.0 ± 0.2, the COD degradation rate reached a maximum of 56.64 mg/L·COD·h−1. When the initial pH value was 8.0 ± 0.2, the reaction rate was slightly lower at 53.84 mg/L·COD·h−1. Therefore, the aerobic biological treatment of the initial pH value should be controlled at about 7.0–8.0 for a better treatment effect.

3.4. Effect of Salinity on COD and pH Changes

In the aerobic activated sludge process of aniline dyeing wastewater treatment, high-salt wastewater affects microorganism growth, which has a certain degree of influence on organic matter degradation. The salinity of the biological system can be in a certain range of saline wastewater treatment to achieve good results, but the impact of different salinities will have different effects on the biological treatment. Thus, in this experiment, by taking a certain control condition, the impact of salinity and the relationship between the COD changes were investigated. The experiment results are shown in Figure 6 and Figure 7 and Table 4.
From the experiment results, when the salt concentration was 1% and 1.7%, the COD change trend was similar, and the effect of microbial degradation of organic matter was good. At the beginning of the reaction, the COD was rapidly consumed, and its degradation rate was relatively high. When the reaction had lasted about 6 h, the COD degradation began to slow down. When the reaction proceeded for about 26 h, the COD change curve gradually flattened and stabilized, dropping to about 1265 mg/L and no longer degrading. At this time, the maximum COD removal rate reached about 52.9%. With the gradual increase in salt concentration, when the salt concentration was 2.5%, the degradation effect was significantly reduced. After about 23 h, the COD concentration reached a stable level of 1727 mg/L; the COD degradation rate was 36.8%. However, when the salt concentration continued to increase to 4%, some microorganisms died because they could not adapt to the high-salt environment, and the degradation effect was dramatically reduced. After only 6 h, the COD concentration reached a stable level of about 2249 mg/L, and the COD degradation rate was only 17%, indicating that the reactor system was seriously affected by the impact of salinity. As can be seen in Figure 7, pH showed an upward trend within 3 h after the reaction and then gradually decreased, which was the same as the changing trend under different initial pH values, indicating that pollutant degradation in wastewater could be qualitatively judged by pH changes in engineering applications. When the salinity was between 1.0% and 1.7%, the degradation degree and pH value of the organic matter were relatively similar. Considering the consistency before and after this study and the convenience of comparison, 1.7% salinity was used in other experiments.

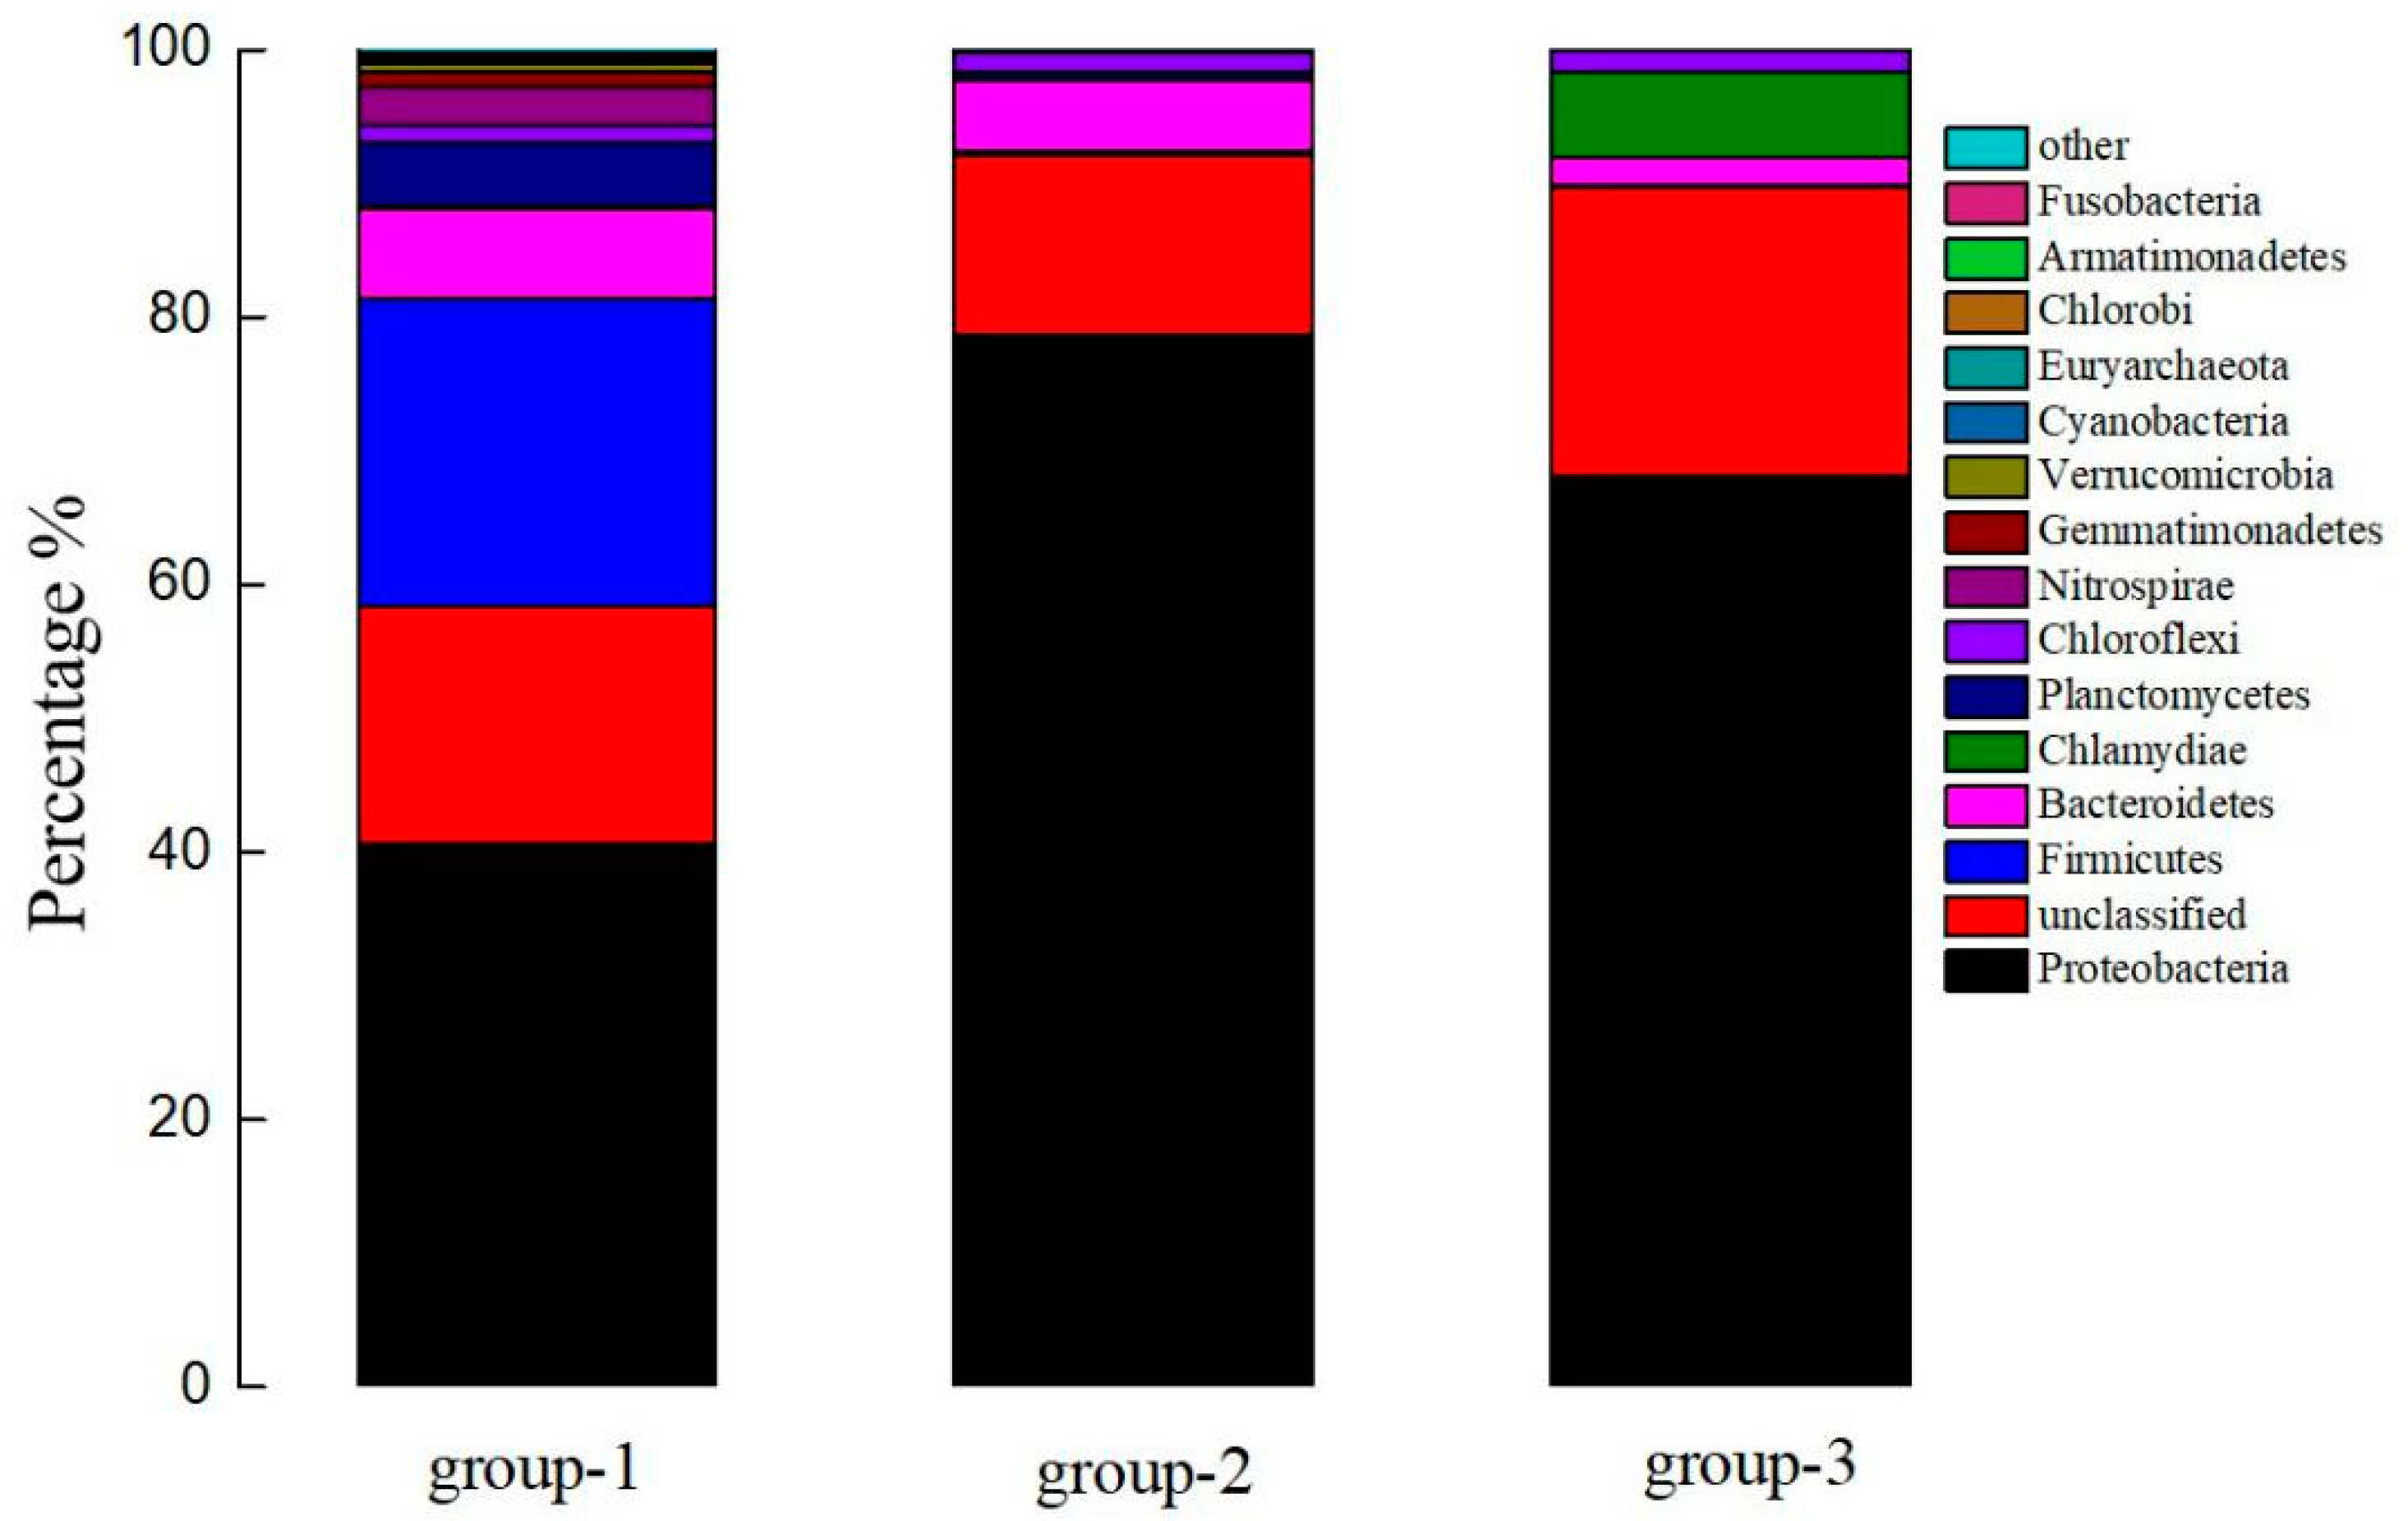
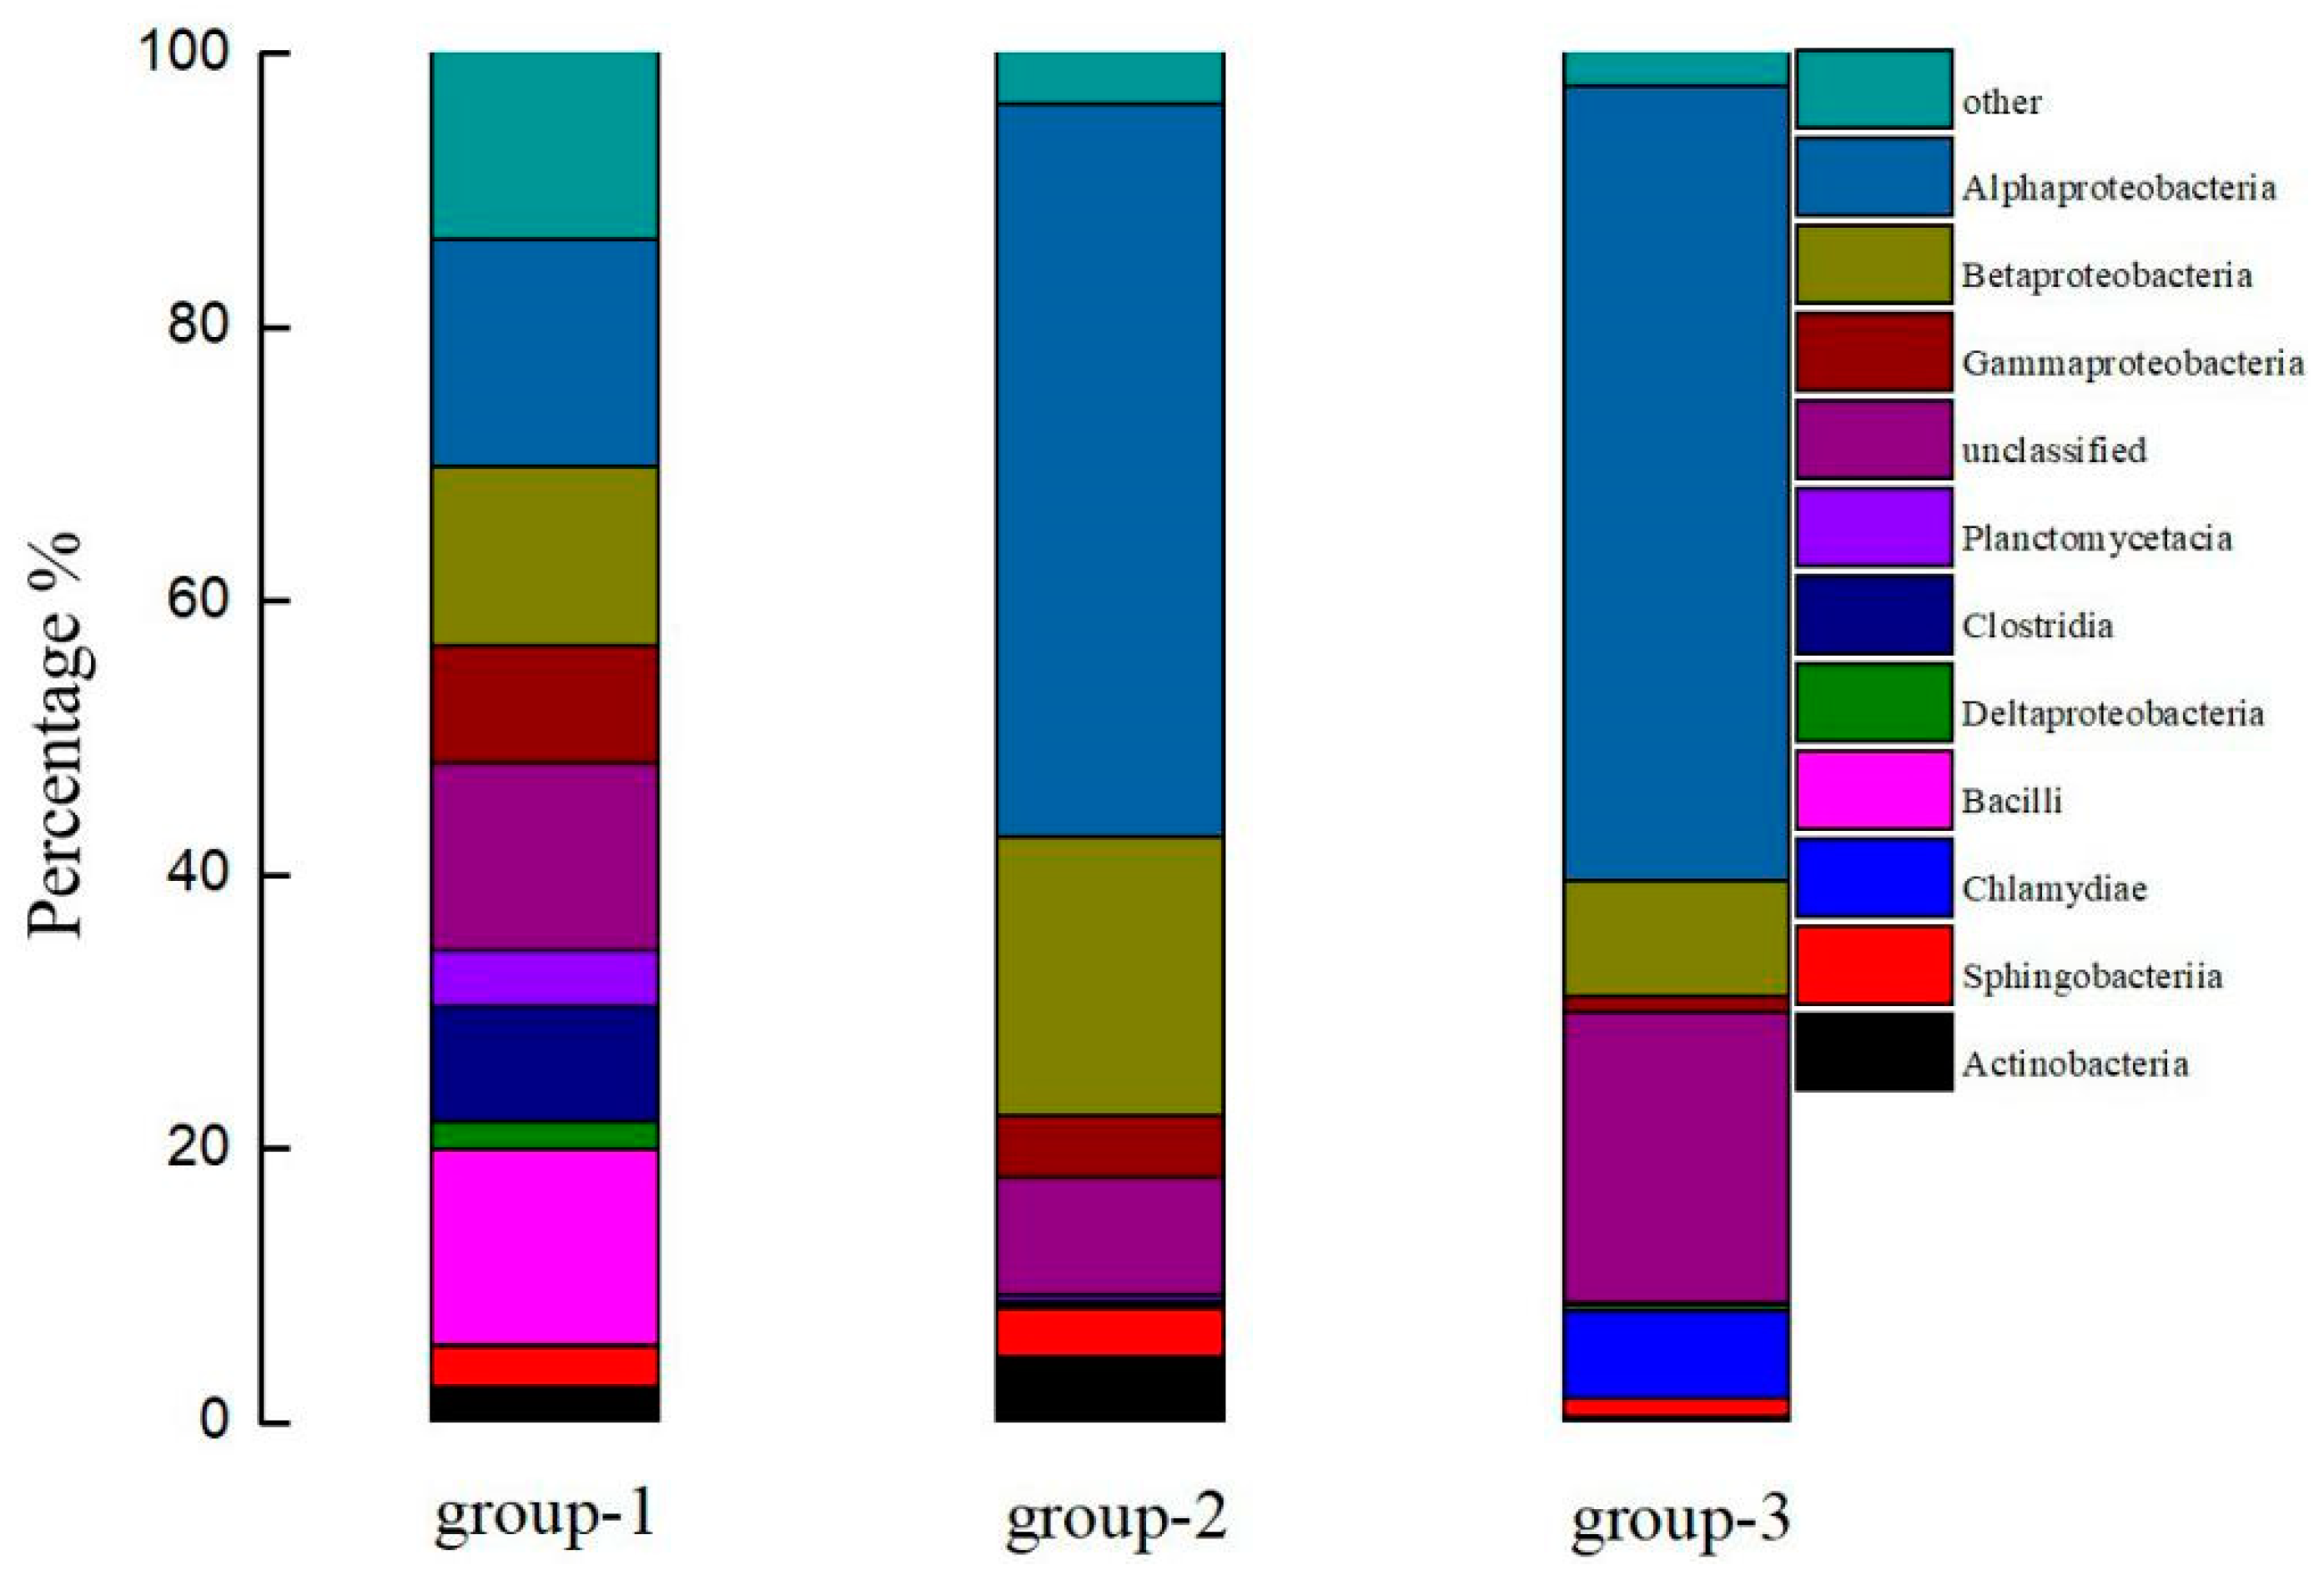
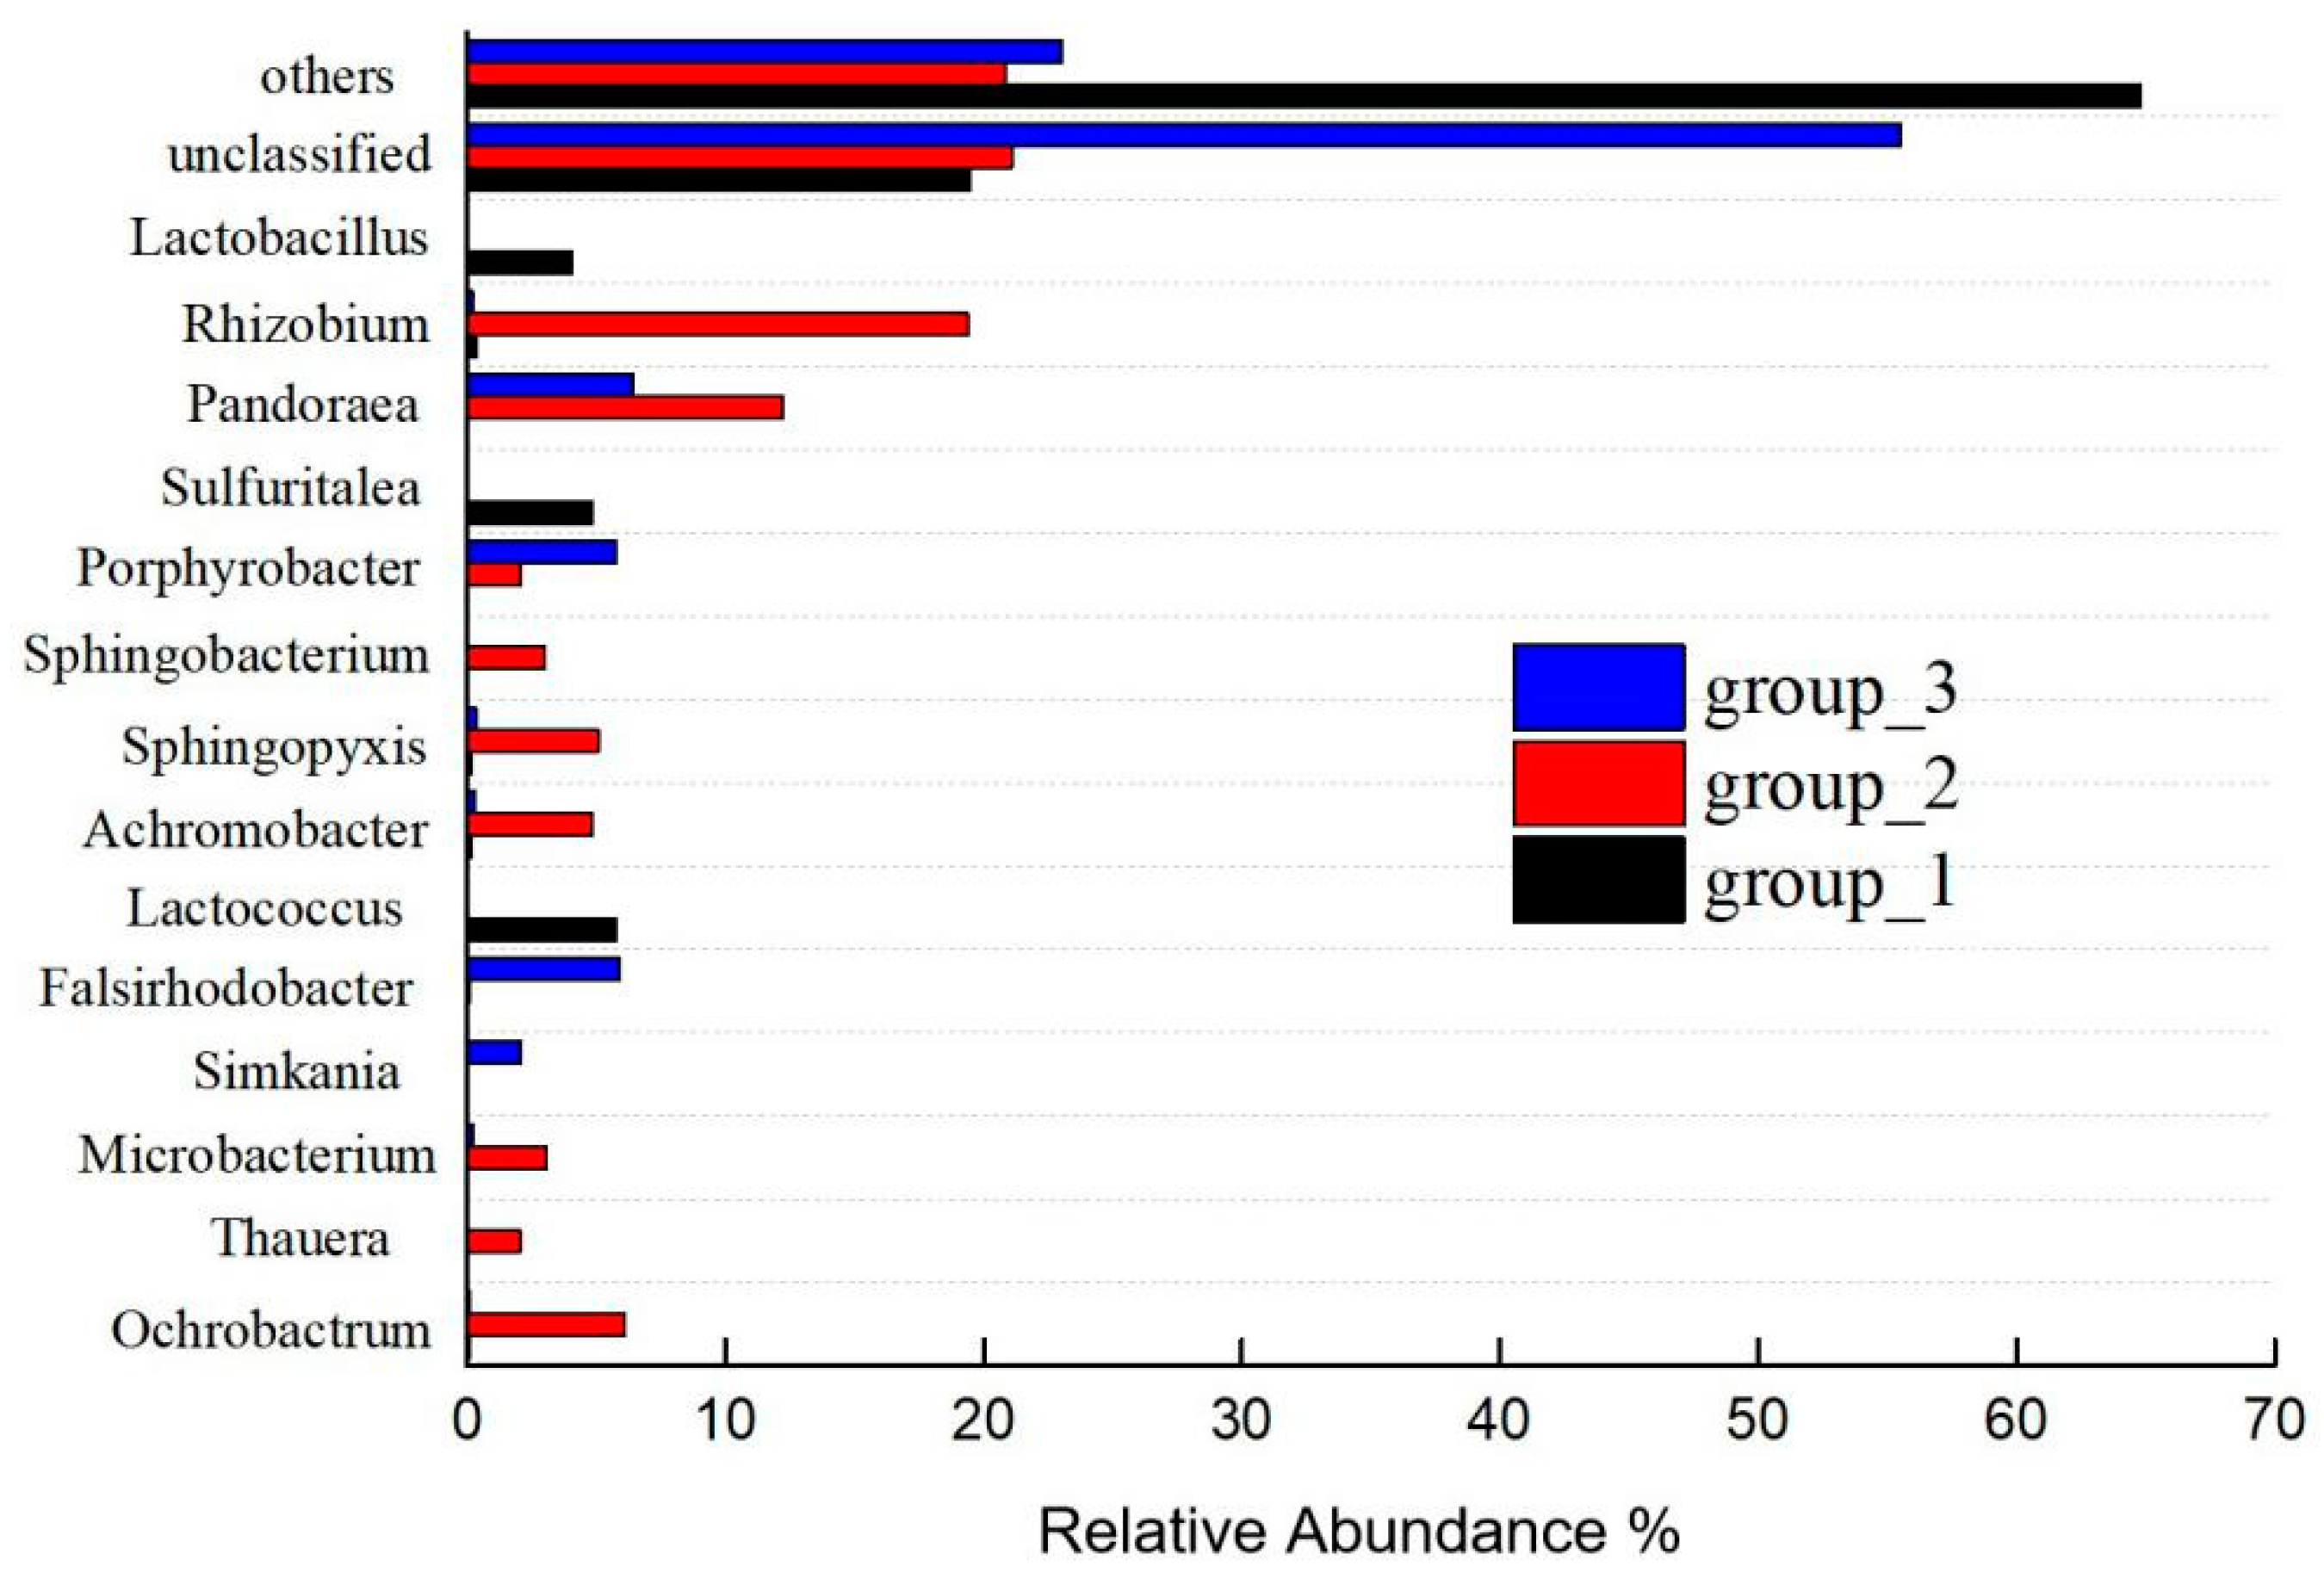
3.5. Results and Analysis of Microbial Community Structure Change

The high-throughput sequences of the three sludge samples were compared with the SILVA database with the Mothur software [13,14]. A total of 16 main bacterial phyla were detected, and the community composition percentages at the phylum and class levels are shown in Figure 8 and Figure 9. The classification levels of the phylum and the community structures of the three sludge samples changed significantly. Proteobacteria occupied a dominant position in all samples, and α-, β-, and γ-proteobacteria were the main bacterial groups. It has been shown that the main bacterial groups in freshwater and low-salt water are proteobacteria [15]. In addition to proteobacteria, Bacteroidetes, Planctomycetes, and Verrucomicrobia were detected.
As can be seen in Figure 9, the relative percentage of α-proteobacteria gradually increased, indicating that salinity had a significant effect on the composition of the bacterial community in activated sludge. Because α-proteobacteria predominantly live in saline environments [16], the relative percentage of α-proteobacteria increased with the continuous acclimation of sludge, which is consistent with the research results in the literature [17]. β-proteobacteria are mainly found in freshwater environments [18] and are typical freshwater bacteria. With the increase in the acclimation cycle, the relative abundance of β-proteobacteria first increased and then decreased, indicating that nutrient input could promote the massive proliferation of some bacterial groups.
To further explore the changes of the bacterial community in the sludge during the domestication process, the bacterial community was analyzed at the genus level, and 16 bacterial groups with relative abundance greater than 2% were obtained from the three sludge samples. The analysis results are shown in Figure 10; with the increase in the domestication cycle, the bacterial community significantly changed. α-proteobacteria can be detected and analyzed at the genus level. With the increase in the domestication cycle, Sphingopyxis, Porphyrobacter, Rhizobium, unclassified Erythrobacteraceae, unclassified Ruminococcaceae, and so forth, changed. The relative abundance of Sphingopyxis in surface and deep subsurface sediments, rivers, rhizosphere, and oceans increased from 0.18% to 5.08% with the increase in acclimation cycles because some bacterial groups are capable of biodegrading aromatic compounds, especially in the degradation of polycyclic aromatic hydrocarbons and hexachlorocyclohexane isomers, which has unique advantages. In addition, sphingosine can degrade bacterium anthraquinone dyes and their intermediates. Increasing the advantage groups could reduce microbial diversity, as is in agreement with previous studies [19]. Under pressure in a certain environment, due to certain bacteria of a special function, the material utilization ability and tolerance are strong, affecting their ability to proliferate, and thus, the diversity of the microbial community. Many bacterial groups in Erythrobacteraceae live in saline habitats [20]. Many can synthesize bacterial chlorophyll on a low nutrient medium under aerobic and semi-aerobic conditions. Many can degrade cellulose to a certain extent. Further, the genus Falsirhodobacter generally thrives at 1–3% salinity, 30 °C, and a pH of 7.0 [21], so with the domestication process, its relative abundance increased from 0% to 5.94%. The relative abundance of Pandoraea increased from 0% to 6.43% due to its resistance to antibiotics and high motility, which could adapt to the environment in wastewater.

4. Conclusions

Through the gradual acclimation of aerobic sludge, microorganisms in the sludge gradually adapted to the quality of wastewater. The effluent COD reached a stable level of about 1450 mg/L in the sixth cycle, and the degradation rate was about 50%. In addition, the time required for COD to reach a stable level in one acclimation cycle was significantly shortened, from 70.5 to 32 h, indicating that the sludge acclimated and matured.
The aerobic biological treatment experiments with acclimated and matured activated sludge showed that the COD degradation rate increased with the increase in biomass under different biomass conditions. The optimal initial pH value was in the range of 7.0–8.0, and the optimal pH value was approximately 7.0. The optimal salinity was 1.7%. Under these test conditions, when the initial COD concentration was 3000 mg/L, after 32 h of reaction, the COD value gradually stabilized and decreased to 1500 mg/L, the degradation rate reached approximately 50%, and the pH change trend decreased from 7.5 to 4.5. With different biomasses, the COD degradation rate increased linearly with the increase in biomass. The degradation rate of organic matter per unit of sludge concentration was 6.24 mg/L COD·h−1·(mg/L MLSS)−1, with R2 = 0.98704. When the initial pH value was less than 7.0 ± 0.2, the COD degradation rate increased with the gradual increase in the initial pH value and then decreased gradually.
During the aerobic sludge acclimation, the diversity of microflora decreased, indicating that water quality conditions, such as salinity and aniline, had a selective effect on functional bacteria. During the process of acclimation, halophilic bacteria, mainly metamorphic phylum, were abundant and belonged to the dominant bacteria, which reduced the diversity of bacterial communities in the water. An increase in the relative abundance of Sphingopyxis from 0.18% to 5.08% was detected in sludge samples from the third cycle of acclimation. Some of the bacterial groups are capable of biodegrading aromatic compounds and anthraquinone dyes as well as their intermediates, indicating that there are microorganisms suitable for wastewater quality in the sludge, which can be used in aerobic biological treatment experiments.

Author Contributions

Conceptualization, W.M.; methodology, H.D.; validation, H.Z. and X.Y.; investigation, H.L.; data curation, H.G.; supervision, R.W.; project administration, L.Y. All authors have read and agreed to the published version of the manuscript.

Funding

This research was funded by the Scientific Research Projects for Higher Educational Universities in Xinjiang Uygur Autonomous Region, grant number XJEDU2021Y041.

Institutional Review Board Statement

Not applicable.

Informed Consent Statement

Not applicable.

Data Availability Statement

Not applicable.

Acknowledgments

This work was supported by the Scientific Research Projects for Higher Educational Universities in Xinjiang Uygur Autonomous Region, grant number XJEDU2021Y041, and the Xinjiang Biomass Solid Waste Resources Technology and Engineering Center.

Conflicts of Interest

The authors declare no conflict of interest.

References

  1. Long, F. Electrolytic contact oxidation process dyeing wastewater. J. Nanyang Inst. Technol. 2012, 4, 111–115. [Google Scholar]
  2. Olivier, L.; Rene, M. Treatment of organic pollution in industrial saline wastewater: A literature review. Water Res. 2006, 40, 3671–3682. [Google Scholar]
  3. Woolard, C.R.; Irvine, R.L. Response of a periodically operated Halophilic biofilm reactor to changes in salt concentration. Water Sci. Technol. 1995, 31, 41–50. [Google Scholar] [CrossRef]
  4. Lei, Y.; Xie, Q.; Li, Y. The study on the treatment of high salinity wastewater. Environ. Sci. Manag. 2007, 32, 49–53. [Google Scholar]
  5. Yu, S.; Tao, G. Study on the treatment of waste water with high salinity and high organic contents by evaporation-resource recycling. J. Xuzhou Inst. Archit. Technol. 2006, 6, 38–40. [Google Scholar]
  6. Zhang, X.; Zhang, Y.; Zhou, X.; Ma, X.; Zhao, J. Studied on the debugging and project of pesticide wastewater with high concentration COD and salt. Ind. Water Treat. 2007, 27, 22–24. [Google Scholar]
  7. Li, W.; Ma, F.; Su, J.; Wei, L.; Xu, Z. Isolation and identification of a moderately halophilic bacterium and its bioaugmention in intensifying high-salty organic wastewater treatment. J. Hunan Univ. 2008, 35, 84–88. [Google Scholar]
  8. Zobell, C.E.; Anderson, D.Q.; Smith, W.W. The bacteriostatic and bactericidal action of great salt lake water. J. Bacteriol. 1937, 33, 253–262. [Google Scholar] [CrossRef] [PubMed] [Green Version]
  9. Uygur, R.; Kargi, F. Salt inhibition on biological nutrient removal from saline wastewater in a sequencing batch reactor. Enzym. Microb. Technol. 2004, 34, 313–318. [Google Scholar] [CrossRef]
  10. Hamoda, M.F.; Al-Atlar, M.S. Effects of high sodium chloride concentrations on activated sludge treatment. Water Sci. Technol. 1995, 31, 61–72. [Google Scholar] [CrossRef]
  11. He, J. Biological treatment of industrial salinity wastewater. China Biogas 2000, 18, 12–16. [Google Scholar]
  12. Hong, A.; Liu, D.; Liu, C. Main microbial community in activated sludge and the research method of it. Ind. Water Treat. 2009, 29, 10–14. [Google Scholar]
  13. Dong, H. The Effects of Anlines Dyeing Wastewater on the Microbial Community Structure in Activated Sludge. Yunnan Chem. Technol. 2020, 3, 55–57. [Google Scholar]
  14. Dong, H. Experimental Study on the Treatment of the Anilines Dyeing Wastewater by Aerobic Biological—Fenton Oxidation. Master’s Thesis, Zhengzhou University, Zhengzhou, China, 2016. [Google Scholar]
  15. Wu, Q.L.; Zwart, G.; Schauer, M.; Kamst-van Agterveld, M.P.; Hahn, M.W. Bacterioplankton community composition along a salinity gradient of sixteen high-mountain lakes located on the Tibetan Platean, China. Appl. Environ. Microbiol. 2006, 72, 5478–5485. [Google Scholar] [CrossRef] [Green Version]
  16. Glockner, F.O.; Fuchs, B.M.; Amamn, R. Bacterioplankton compositions of lakes and oceans:a first comparison based on fluorescence in situ hybridization. Appl. Environ. Microbiol. 1999, 65, 3721–3726. [Google Scholar] [CrossRef] [Green Version]
  17. Kirchman, D.L.; Dittel, A.I.; Malmstrom, R.R.; Cottrell, M.T. Biogeography of major bacterial groups in the Delaware Estuary. Limnol. Oceanogr. 2005, 50, 1697–1706. [Google Scholar] [CrossRef]
  18. Zwart, G.; Crump, B.C.; Kamst-van Agterveld, M.P.; Hagen, F.; Han, S.K. Typical freshwater bacteria: An analysis of available 16S rRNA gene sequences from plankton lakes and rivers. Aquat. Microb. Ecol. 2002, 28, 141–155. [Google Scholar] [CrossRef] [Green Version]
  19. Sjöstedt, J.; Koch-Schmidt, P.; Pontarp, M.; Canbäck, B.; Tunlid, A.; Lundberg, P.; Hagström, Å.; Riemann, L. Recruitment of members from the biosphere of marine bacterioplankton communities after an environmental disturbance. Appl. Environ. Microbiol. 2012, 78, 1316–1369. [Google Scholar] [CrossRef] [Green Version]
  20. Zhao, R. Studies of Cultivated Marine Bacterial Diversities in Two Specific Ecological Environments in Qingdao Coastal Area and Taxonomic Analysis of Three Novel Bacteria. Ph.D. Thesis, Ocean University of China, Qingdao, China, 2012. [Google Scholar]
  21. Wang, L.; Zhou, Z.; Wu, G.; Chen, M.; Lin, M.; Zhang, W.; Chen, W. Falsirhodobacter deserti sp. nov., isolated from sandy soil in the Takla Makan desert edge of China. Int. J. Syst. Evol. Microbiol. 2014, 65, 650–655. [Google Scholar] [CrossRef]
Figure 1. COD change at each acclimation stage of activated sludge.
Processes 09 01329 g001
Figure 2. COD changes under different MLSS.
Processes 09 01329 g002
Figure 3. (A) COD changes with different MLSS contents using linear fitting; (B) COD degradation rates with different MLSS contents.
Processes 09 01329 g003
Figure 4. (A) Changes in COD under different initial pH values; (B) changes in pH under different initial pH values.
Processes 09 01329 g004
Figure 5. Changes in COD with different initial pH values using linear fitting.
Processes 09 01329 g005
Figure 6. COD changes under different salinity.
Processes 09 01329 g006
Figure 7. Effect of salinity on the pH Value by aerobic sludge.
Processes 09 01329 g007
Figure 8. The relative percentages of the community constitution at the phylum level.
Processes 09 01329 g008
Figure 9. The relative percentages of the community constitution at the class level.
Processes 09 01329 g009
Figure 10. Relative abundance of the dominant genus in the different acclimation cycles at a genus level.
Processes 09 01329 g010
Table 1. Quality of the original wastewater.
ItemCOD
(mg/L)
BOD5
(mg/L)
NH3-N
(mg/L)
pHCOD
(mg/L)
Salinity (%)SO42− (mg/L)
Data30,00012,00012.6111.036001770,480
Table 2. Changes in the degradation rate and average reaction rate of the COD during the acclimation.
Domestication CycleCOD Removal Rate (%)Average Reaction Rate
(mg/L COD•h−1)
128.015.60
228.916.85
330.918.56
437.432.76
552.634.04
652.246.88
Table 3. The kinetic parameters under different MLSS.
MLSSParameterMeasured S0 (mg/L)
K1 (h−1)S0 (mg/L)R2
112.692142679.30.967682692
326.399762737.50.965412816
647.850042704.40.977062816
961.957092766.10.983062866
K1 is the COD degradation rate, S0 is the influent COD concentration, and R2 is the correlation coefficient.
Table 4. The kinetic parameters under different initial pH values.
The Initial pHParameterMeasured S0 (mg/L)
K1 (h−1)S0 (mg/L)R2
120.650722706.90.9188715.60
236.835112723.50.9360916.85
356.641902765.00.9984418.56
453.842082908.10.9707632.76
520.650722706.90.9188734.04
636.835112723.50.9360946.88
K1 is the COD degradation rate, S0 is the influent COD concentration, and R2 is the correlation coefficient.
Publisher’s Note: MDPI stays neutral with regard to jurisdictional claims in published maps and institutional affiliations.

