
Numerical and Experimental Analyses on Motion Responses on Heaving Point Absorbers Connected to Large Semi-Submersibles


Abstract
:1. Introduction
2. Numerical Methods
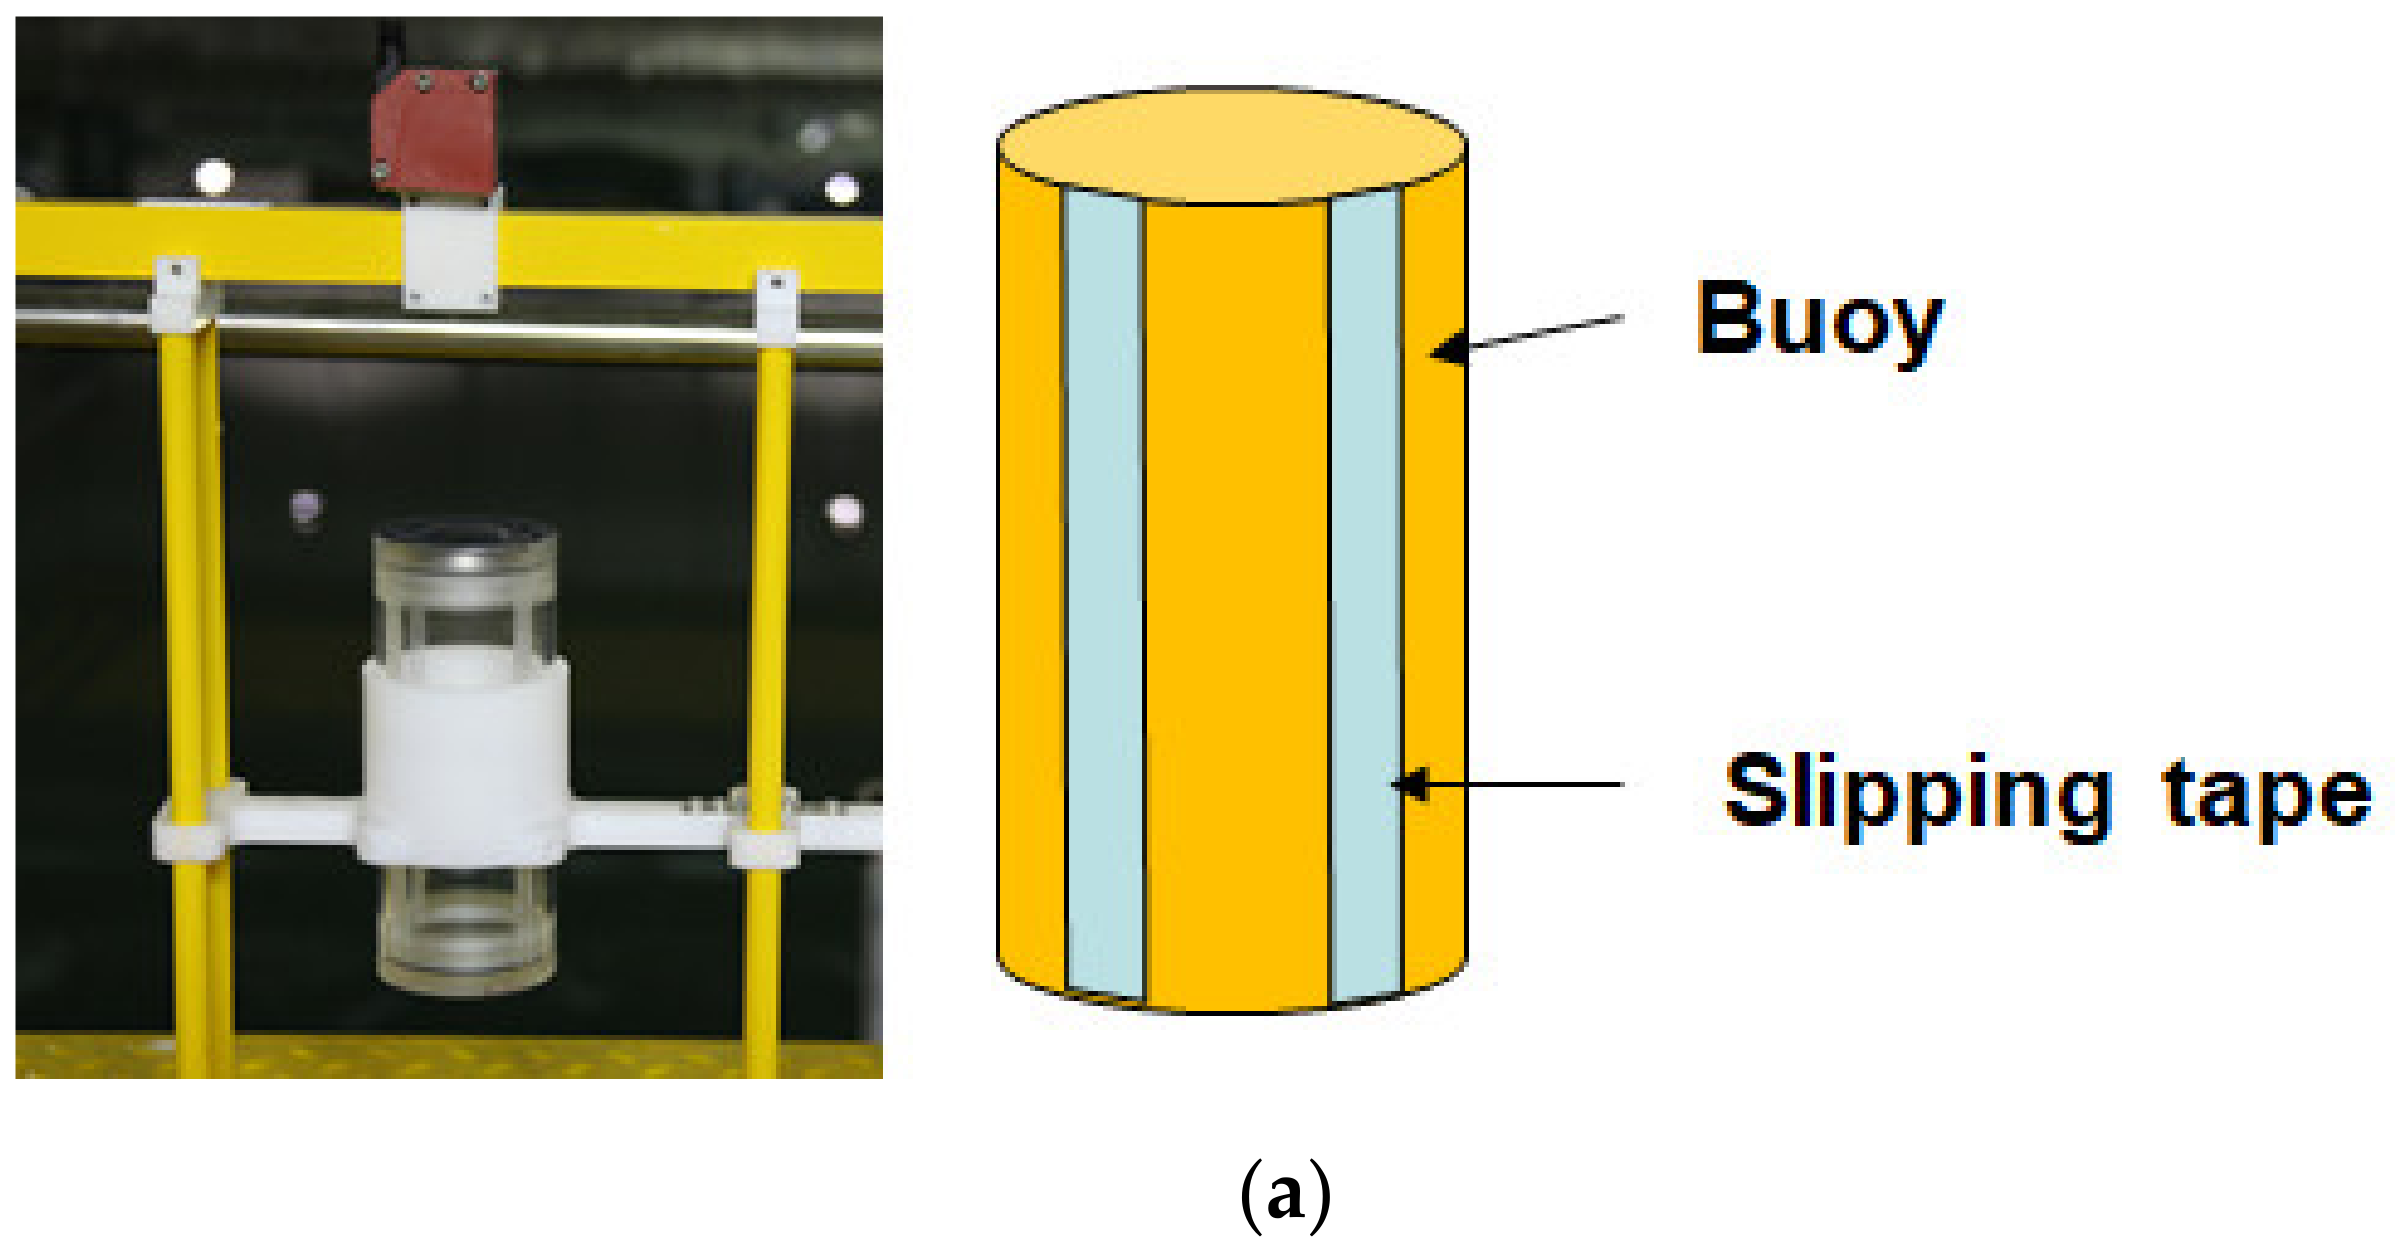
2.1. Target Model
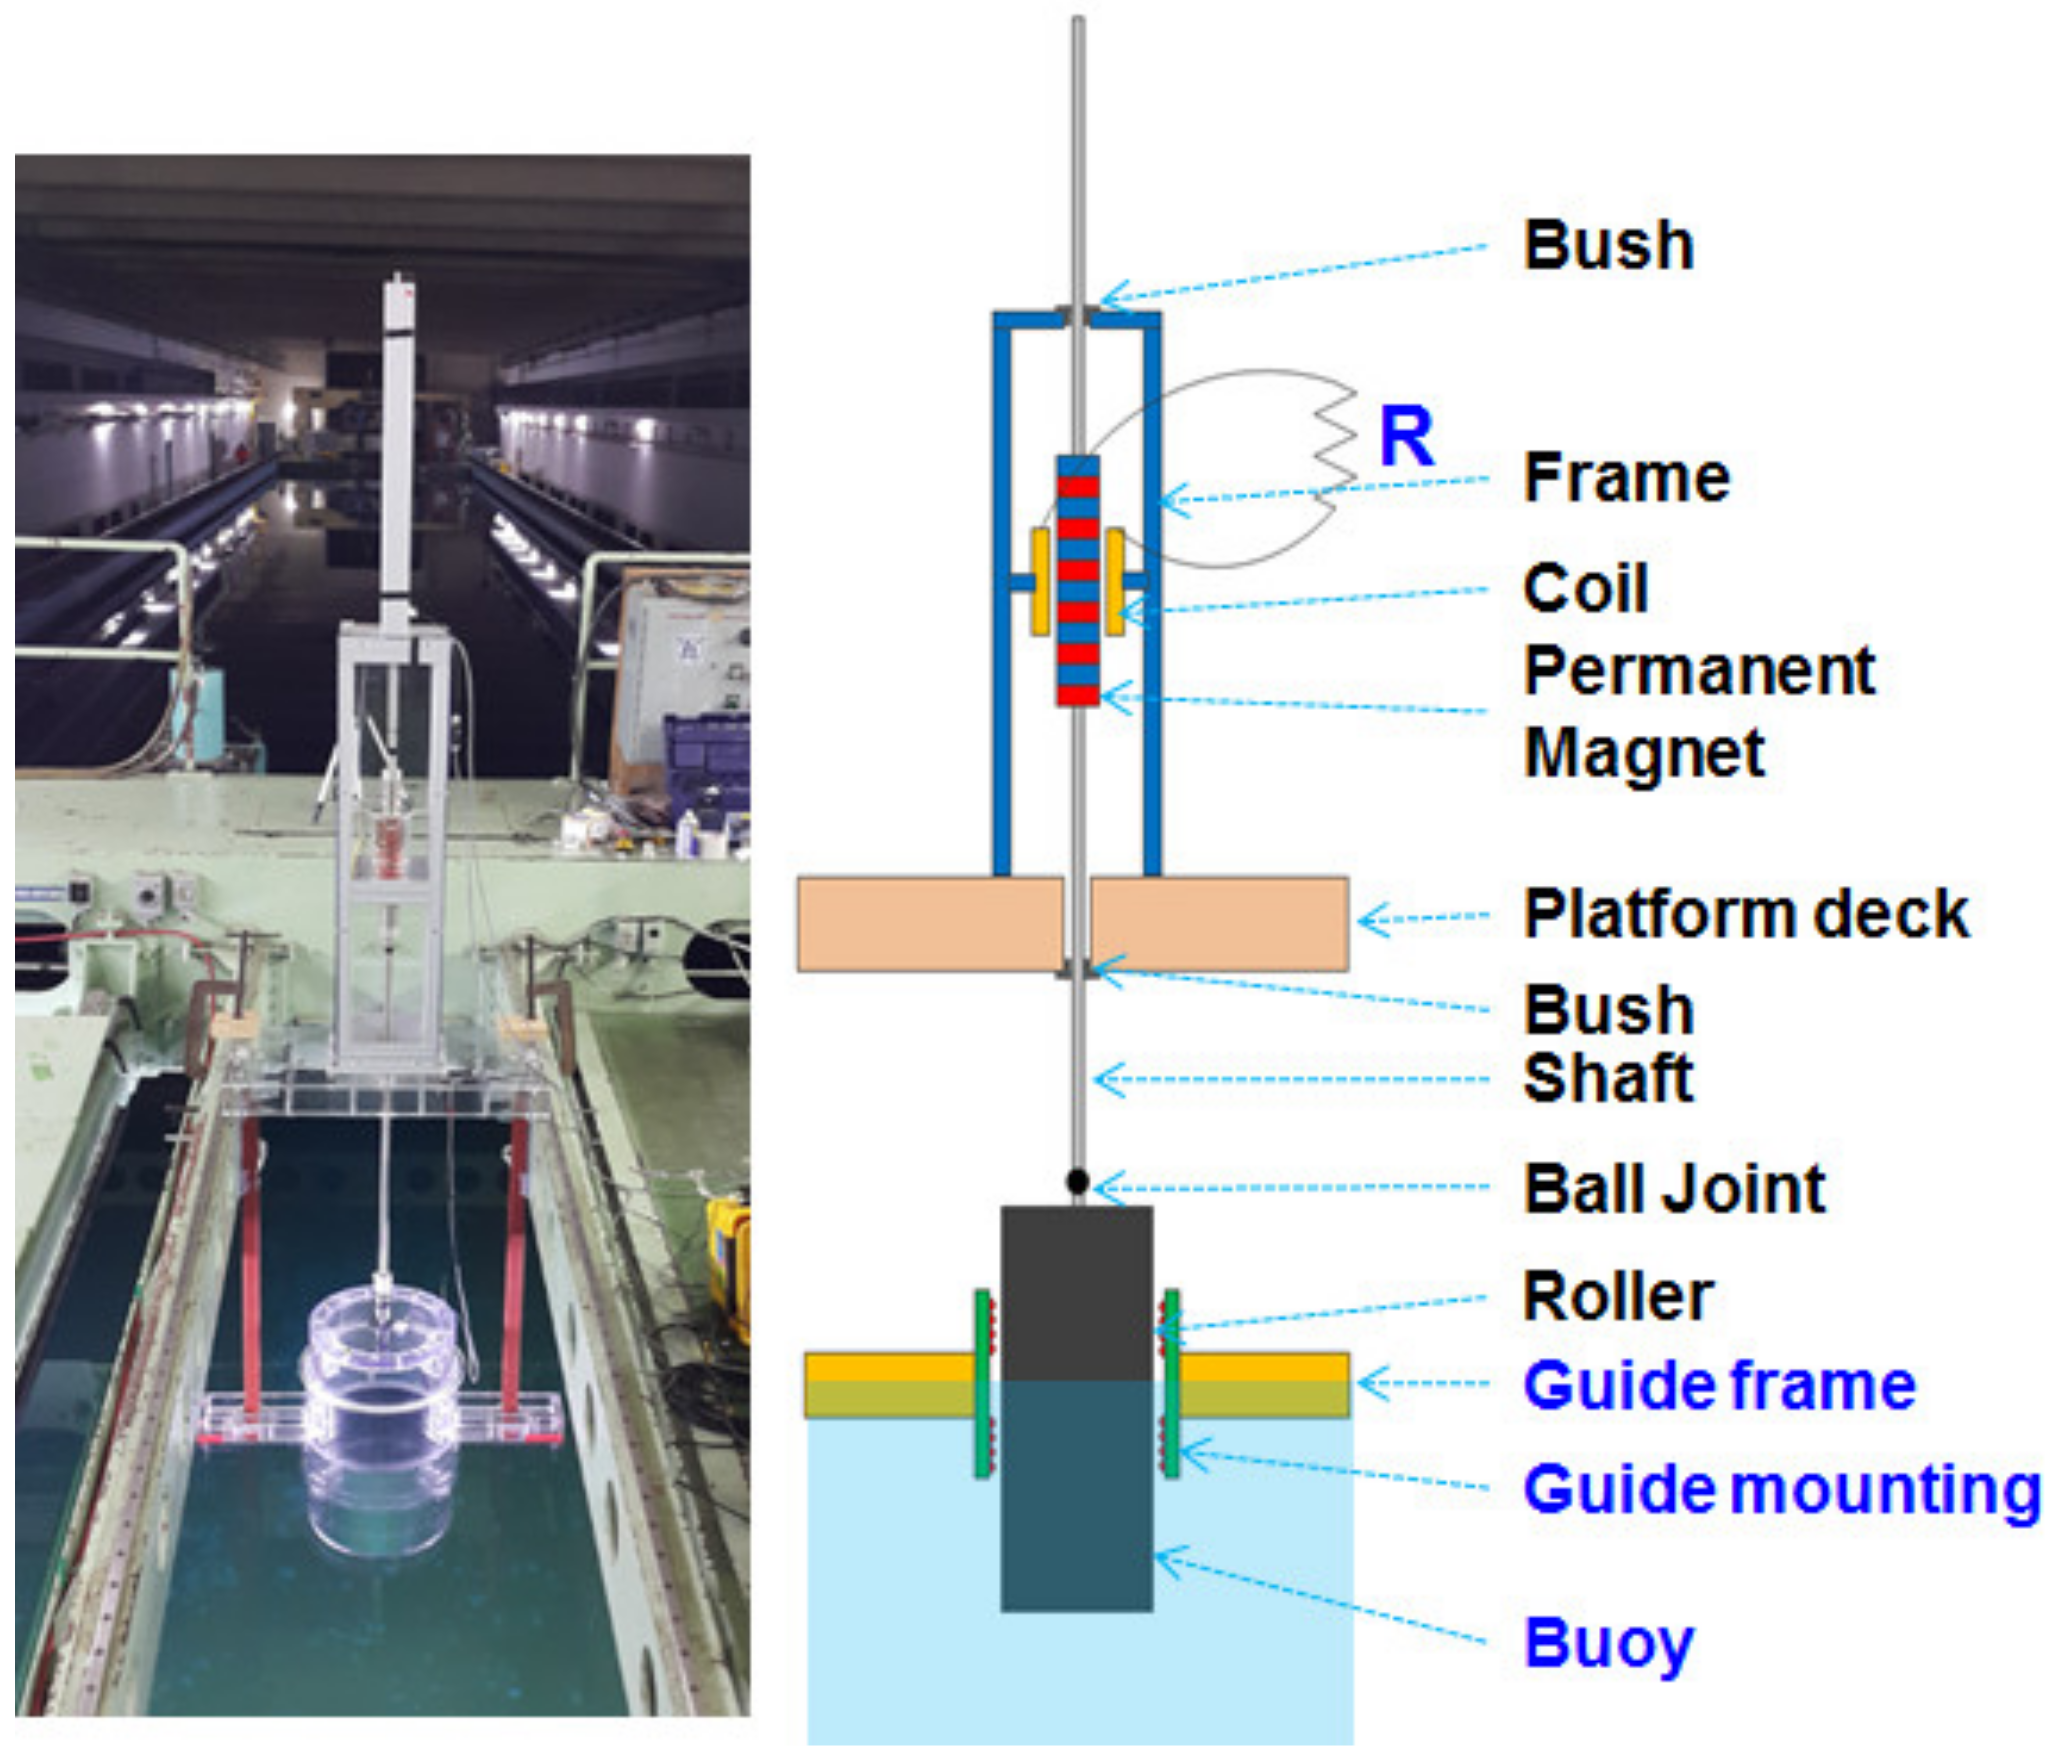
2.2. Single HPA
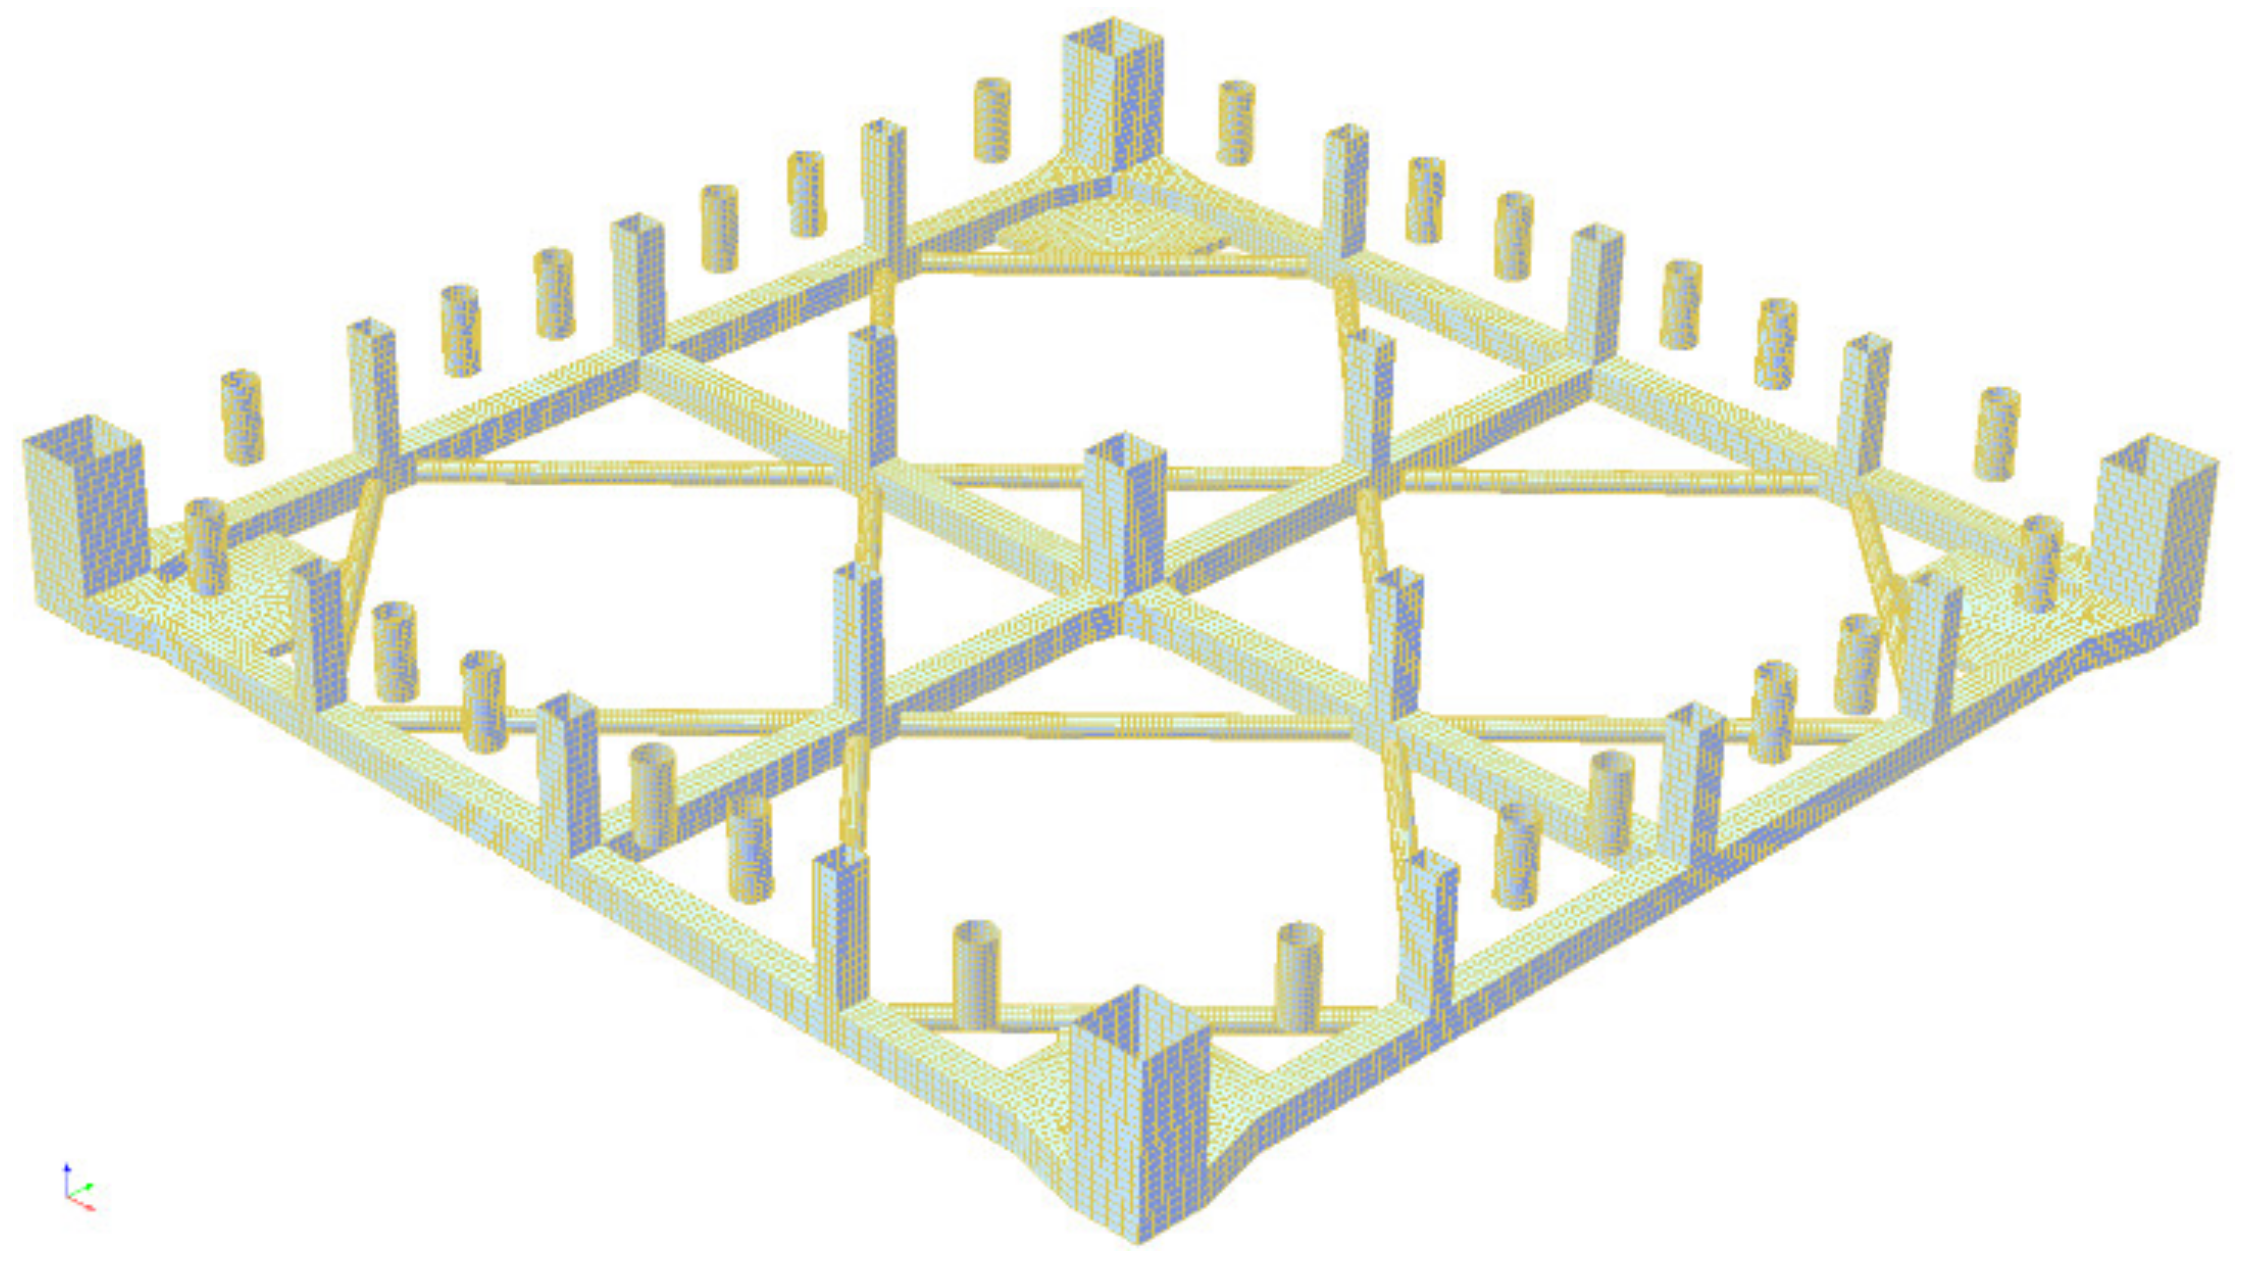
2.3. Large Semi-Submersible
3. Experimental Setup
3.1. Single HPA
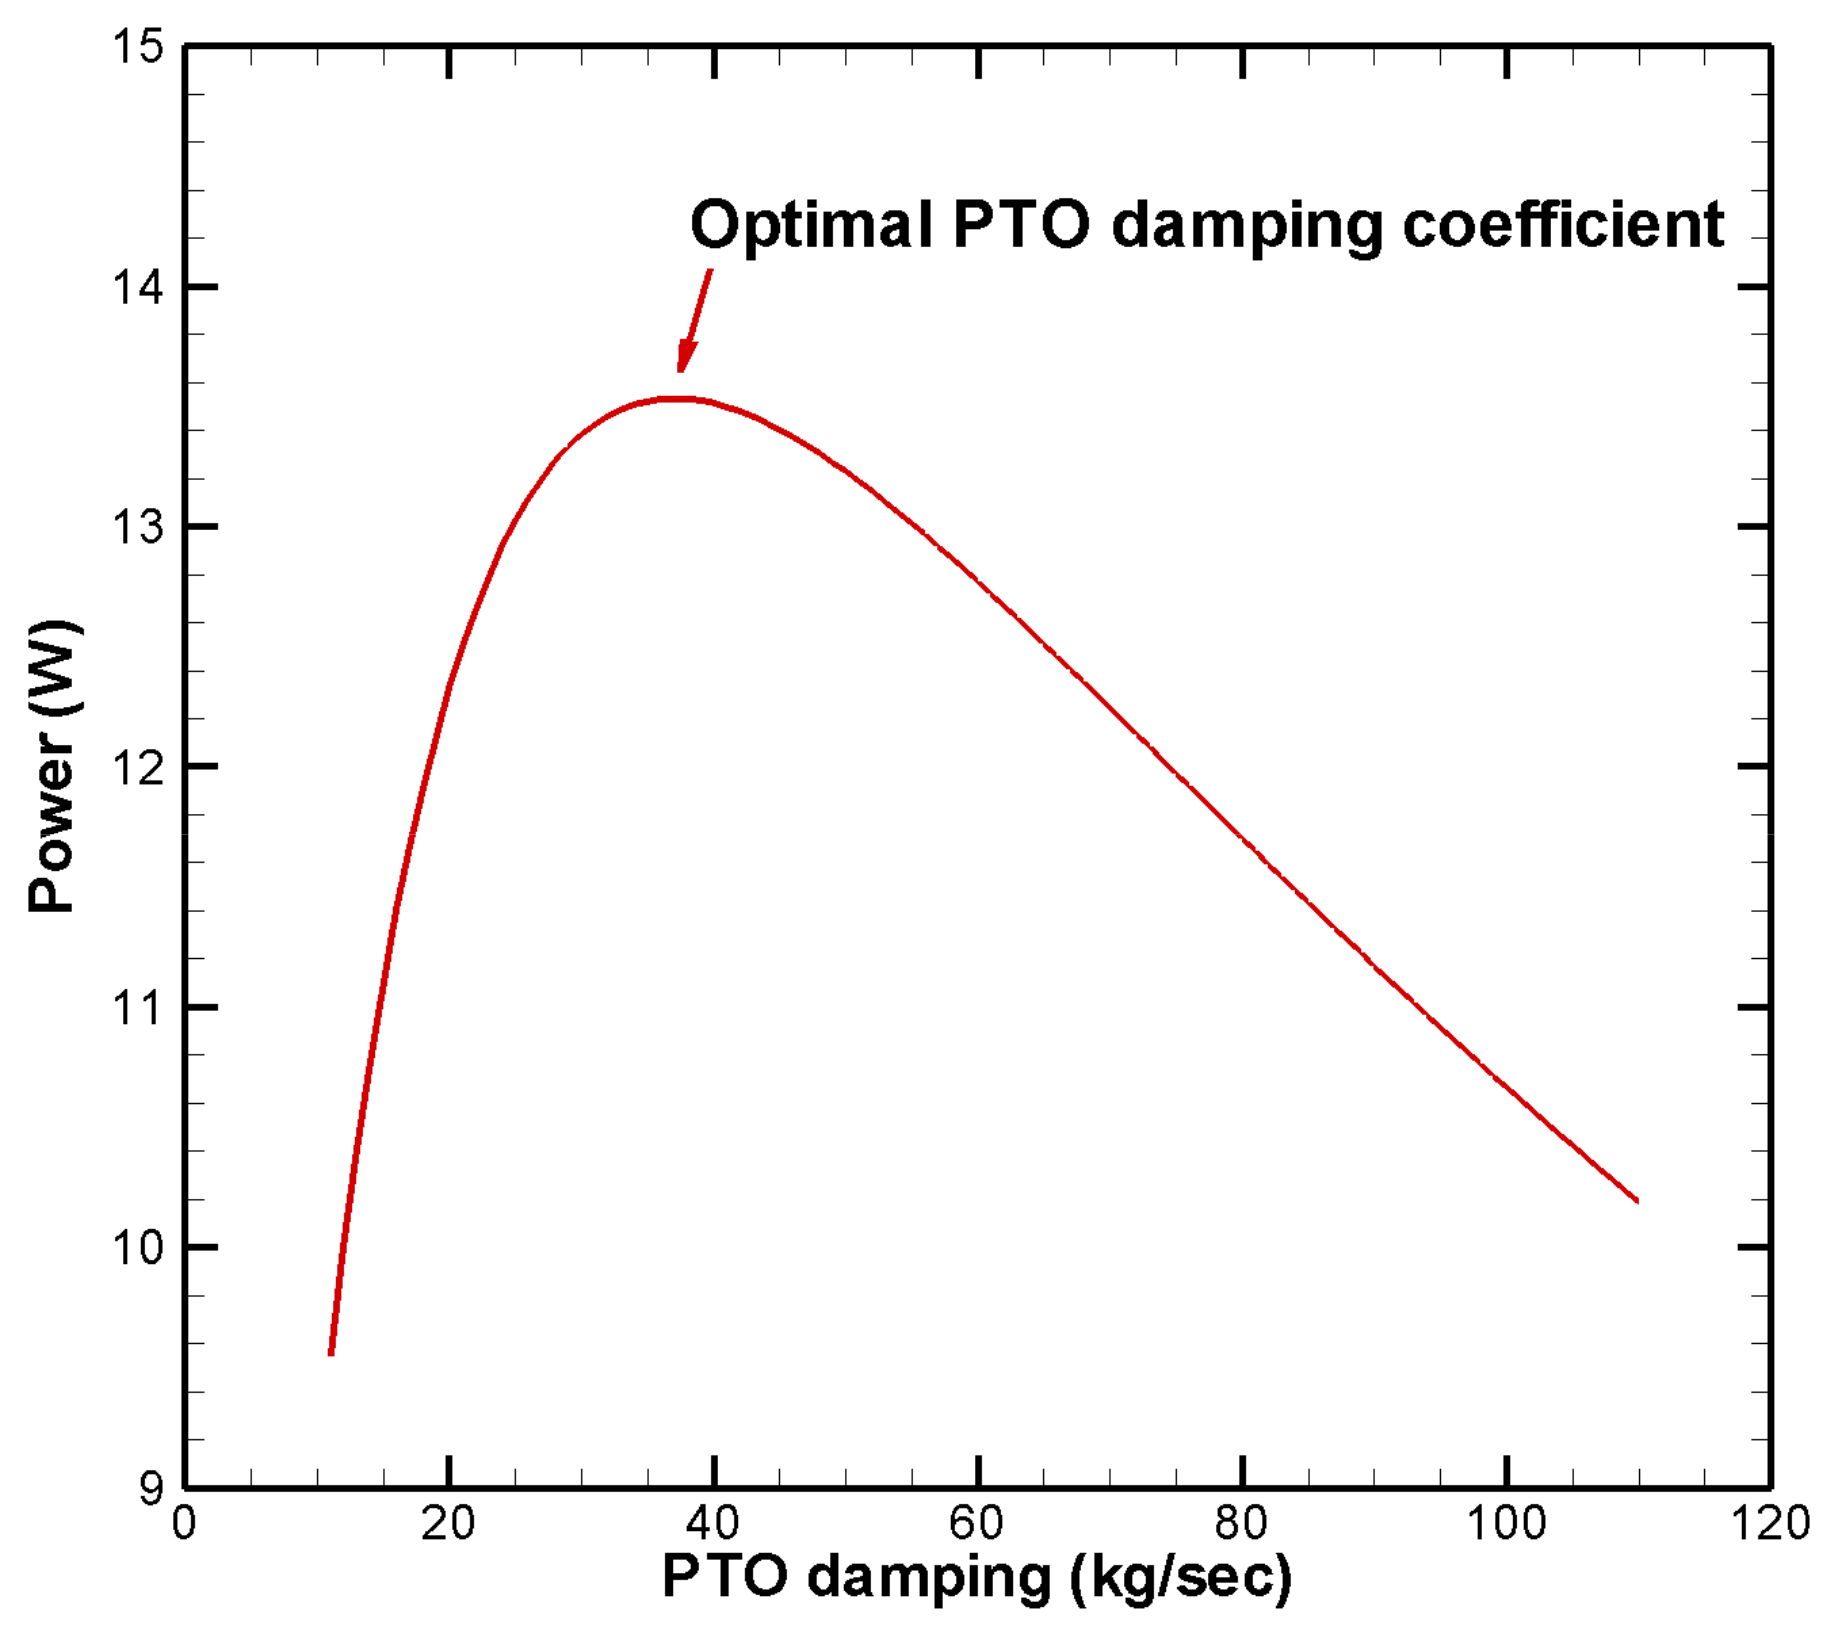
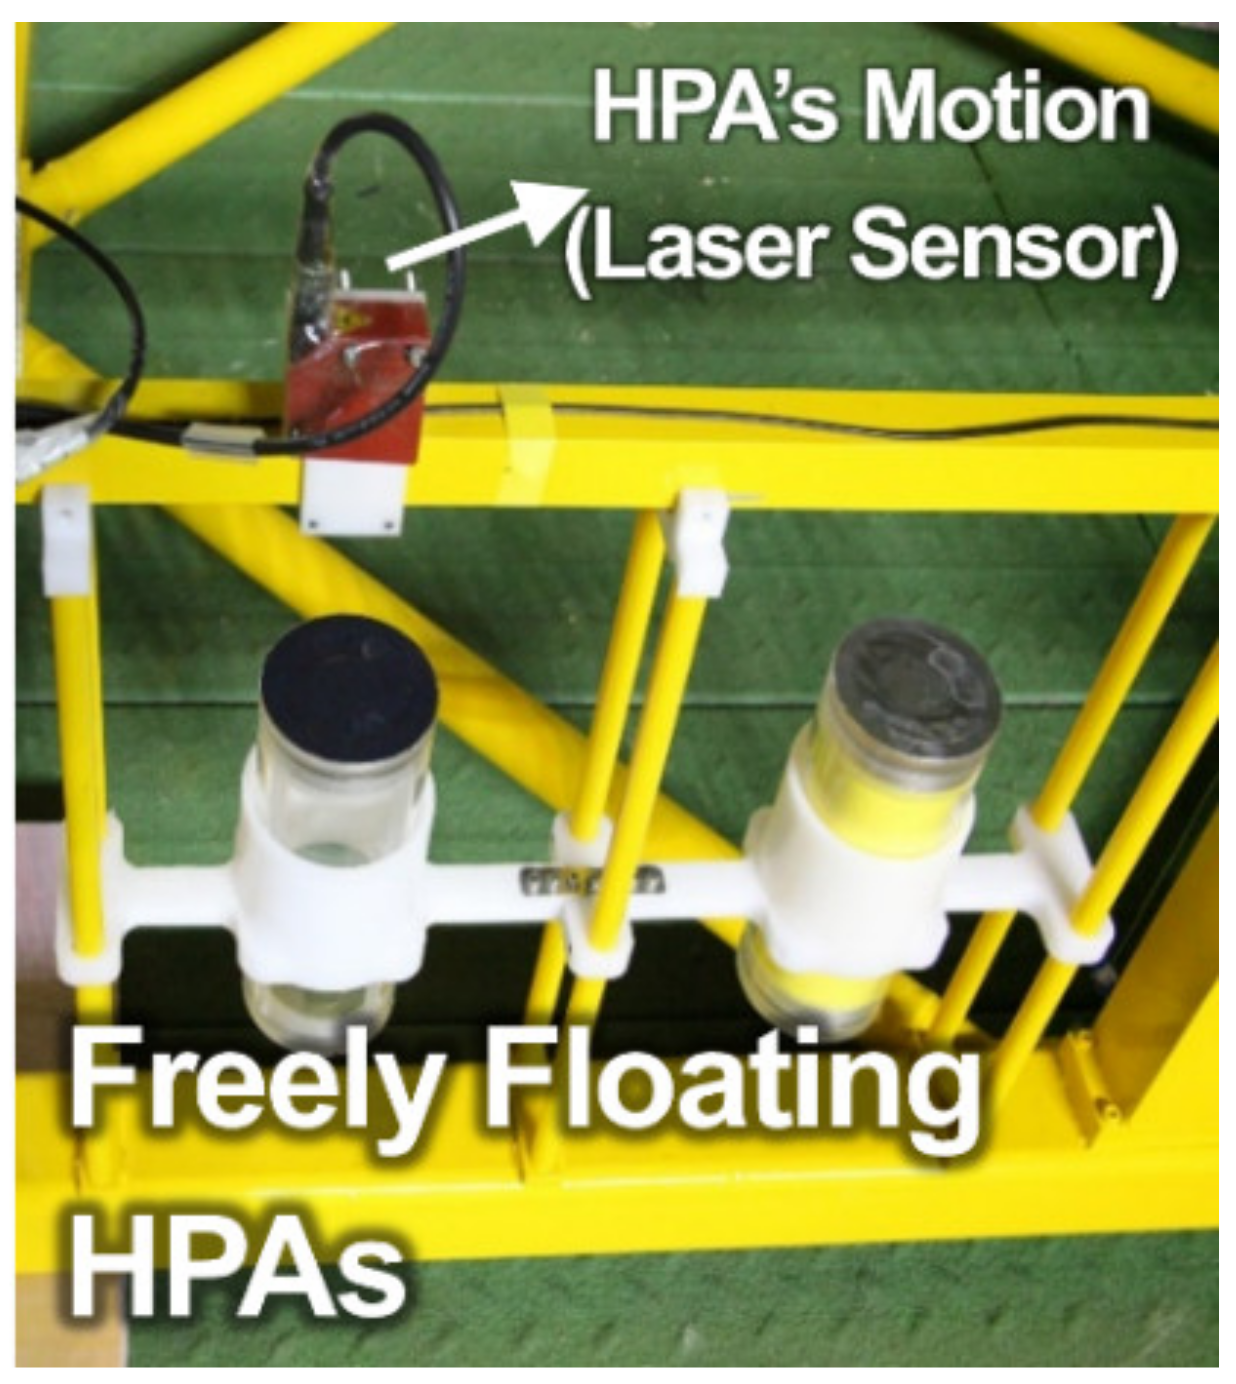
3.2. Multiple HPAs Connected to a Large Semi-Submersible
4. Results & Discussion
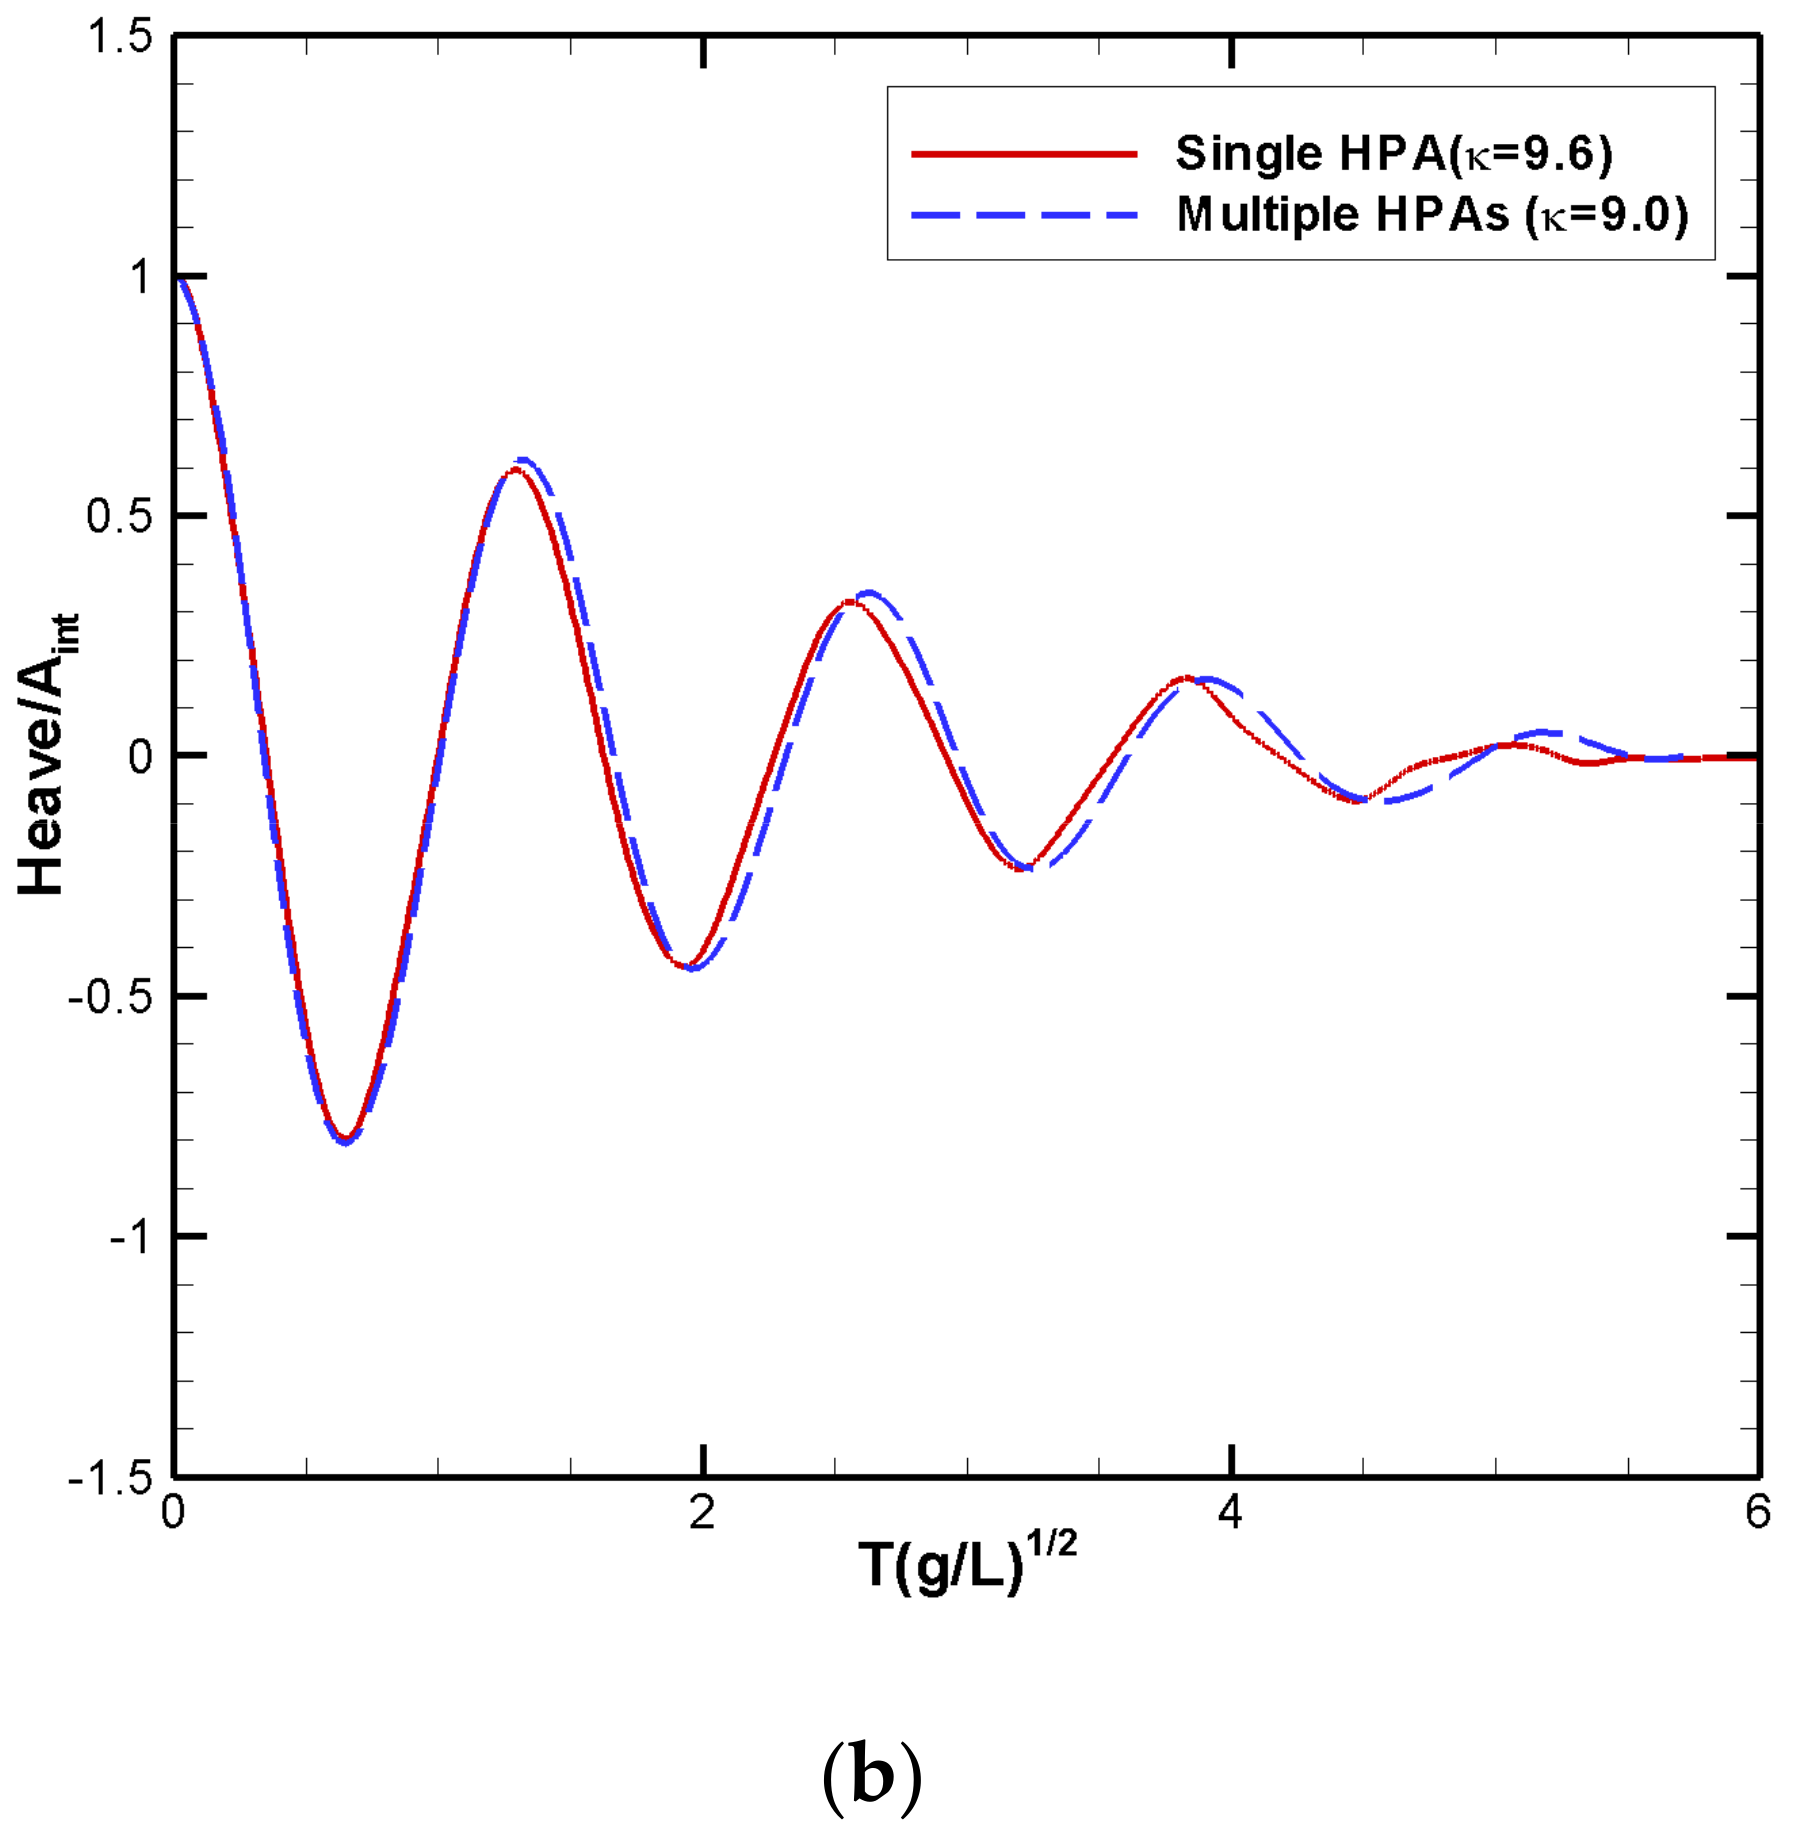
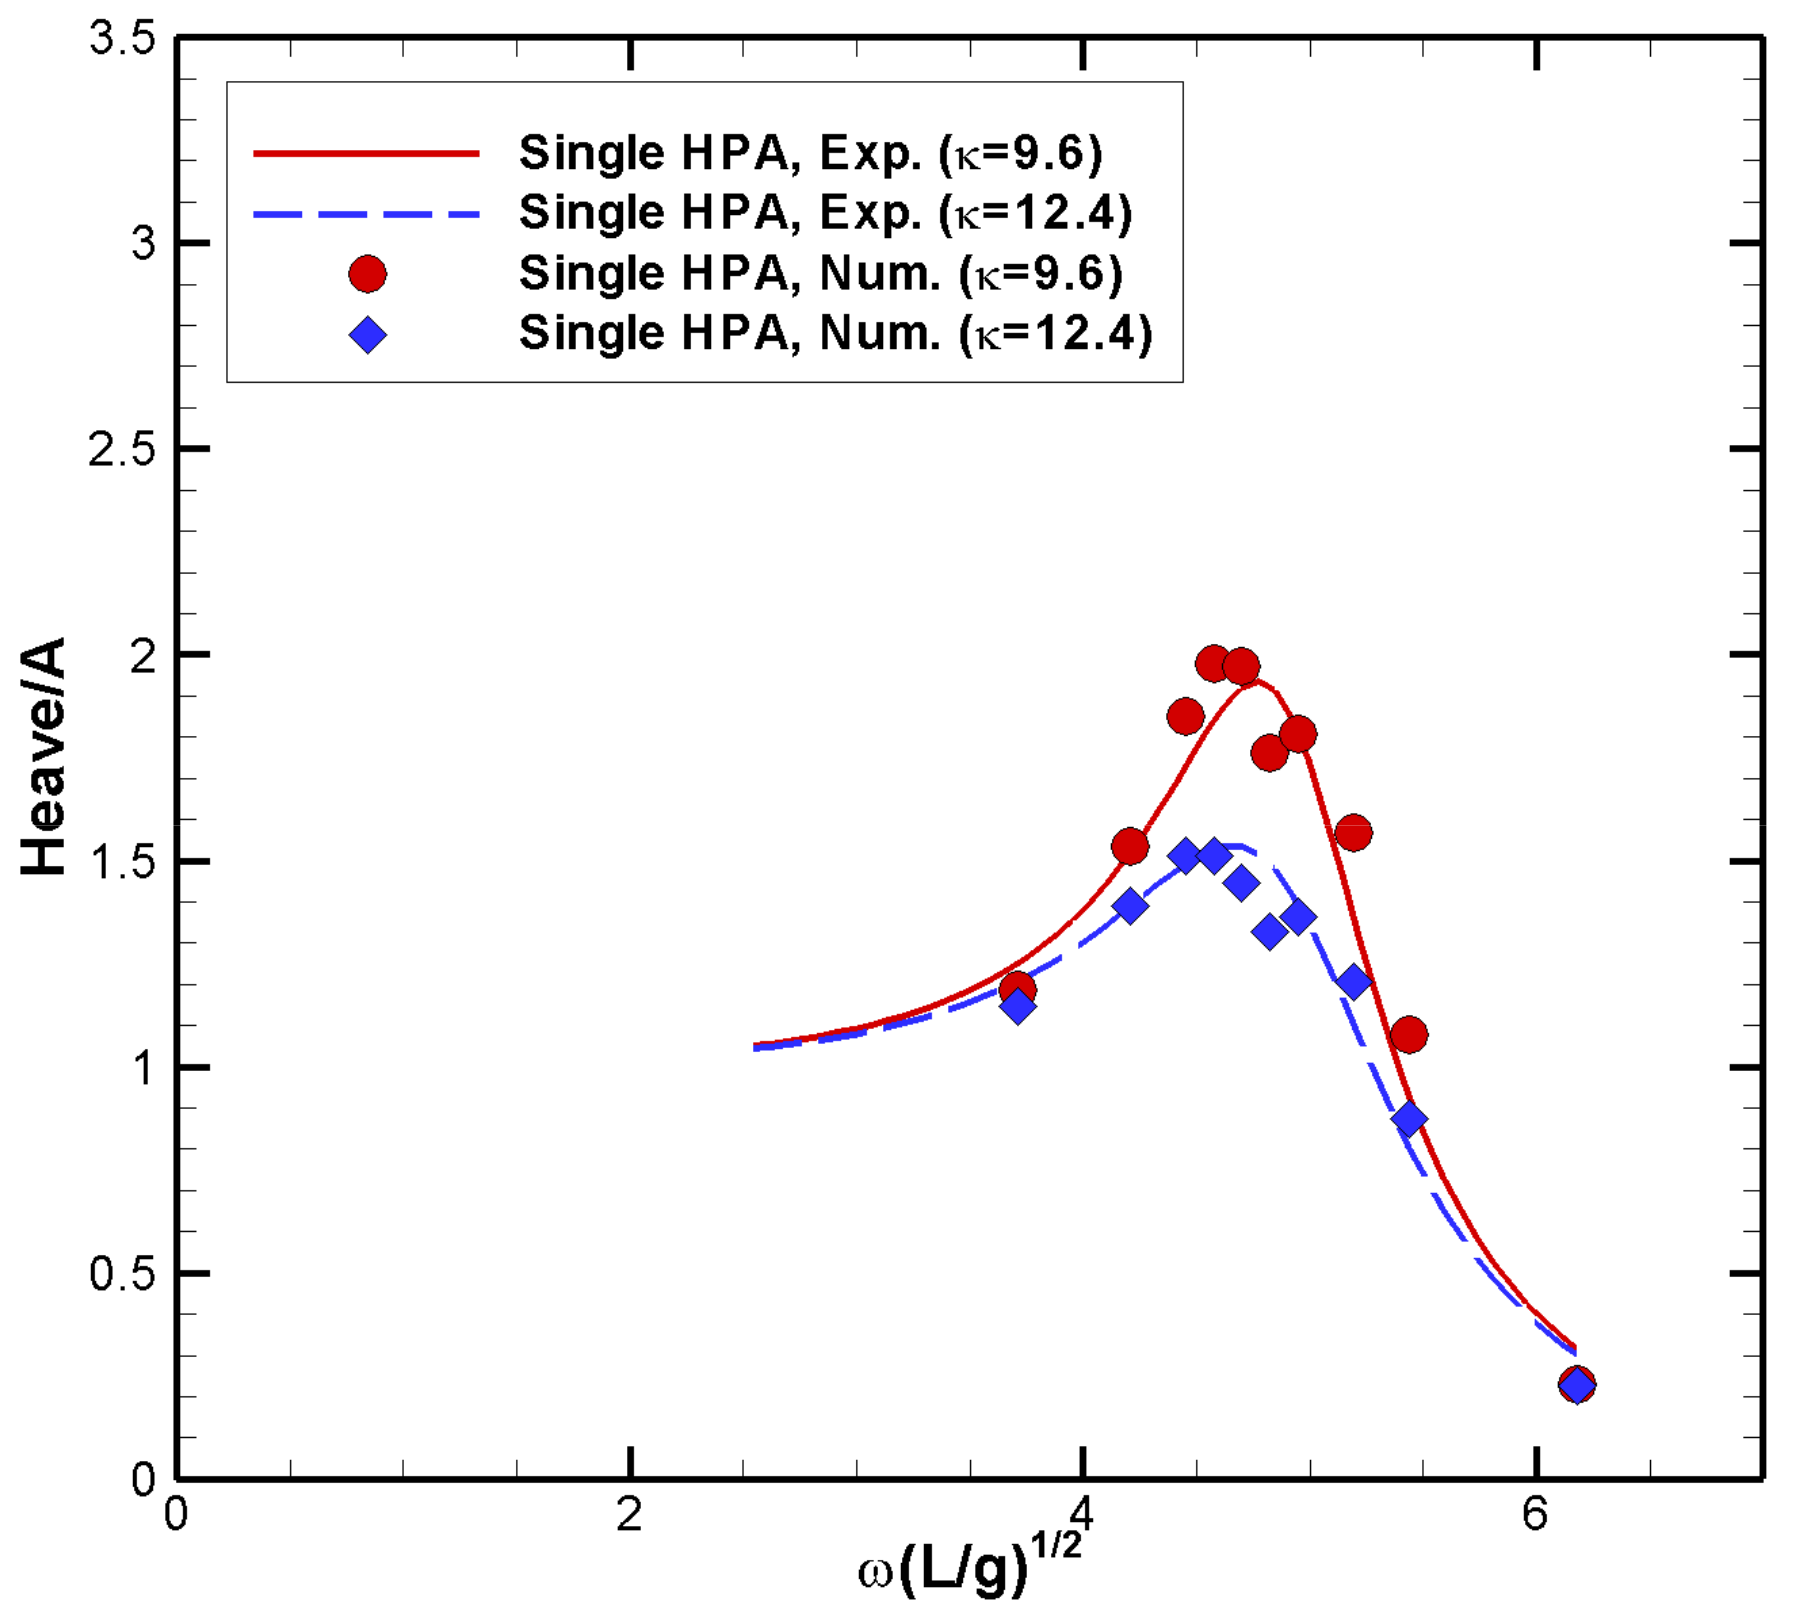
4.1. Motion Responses of Single Heaving Point Absorber
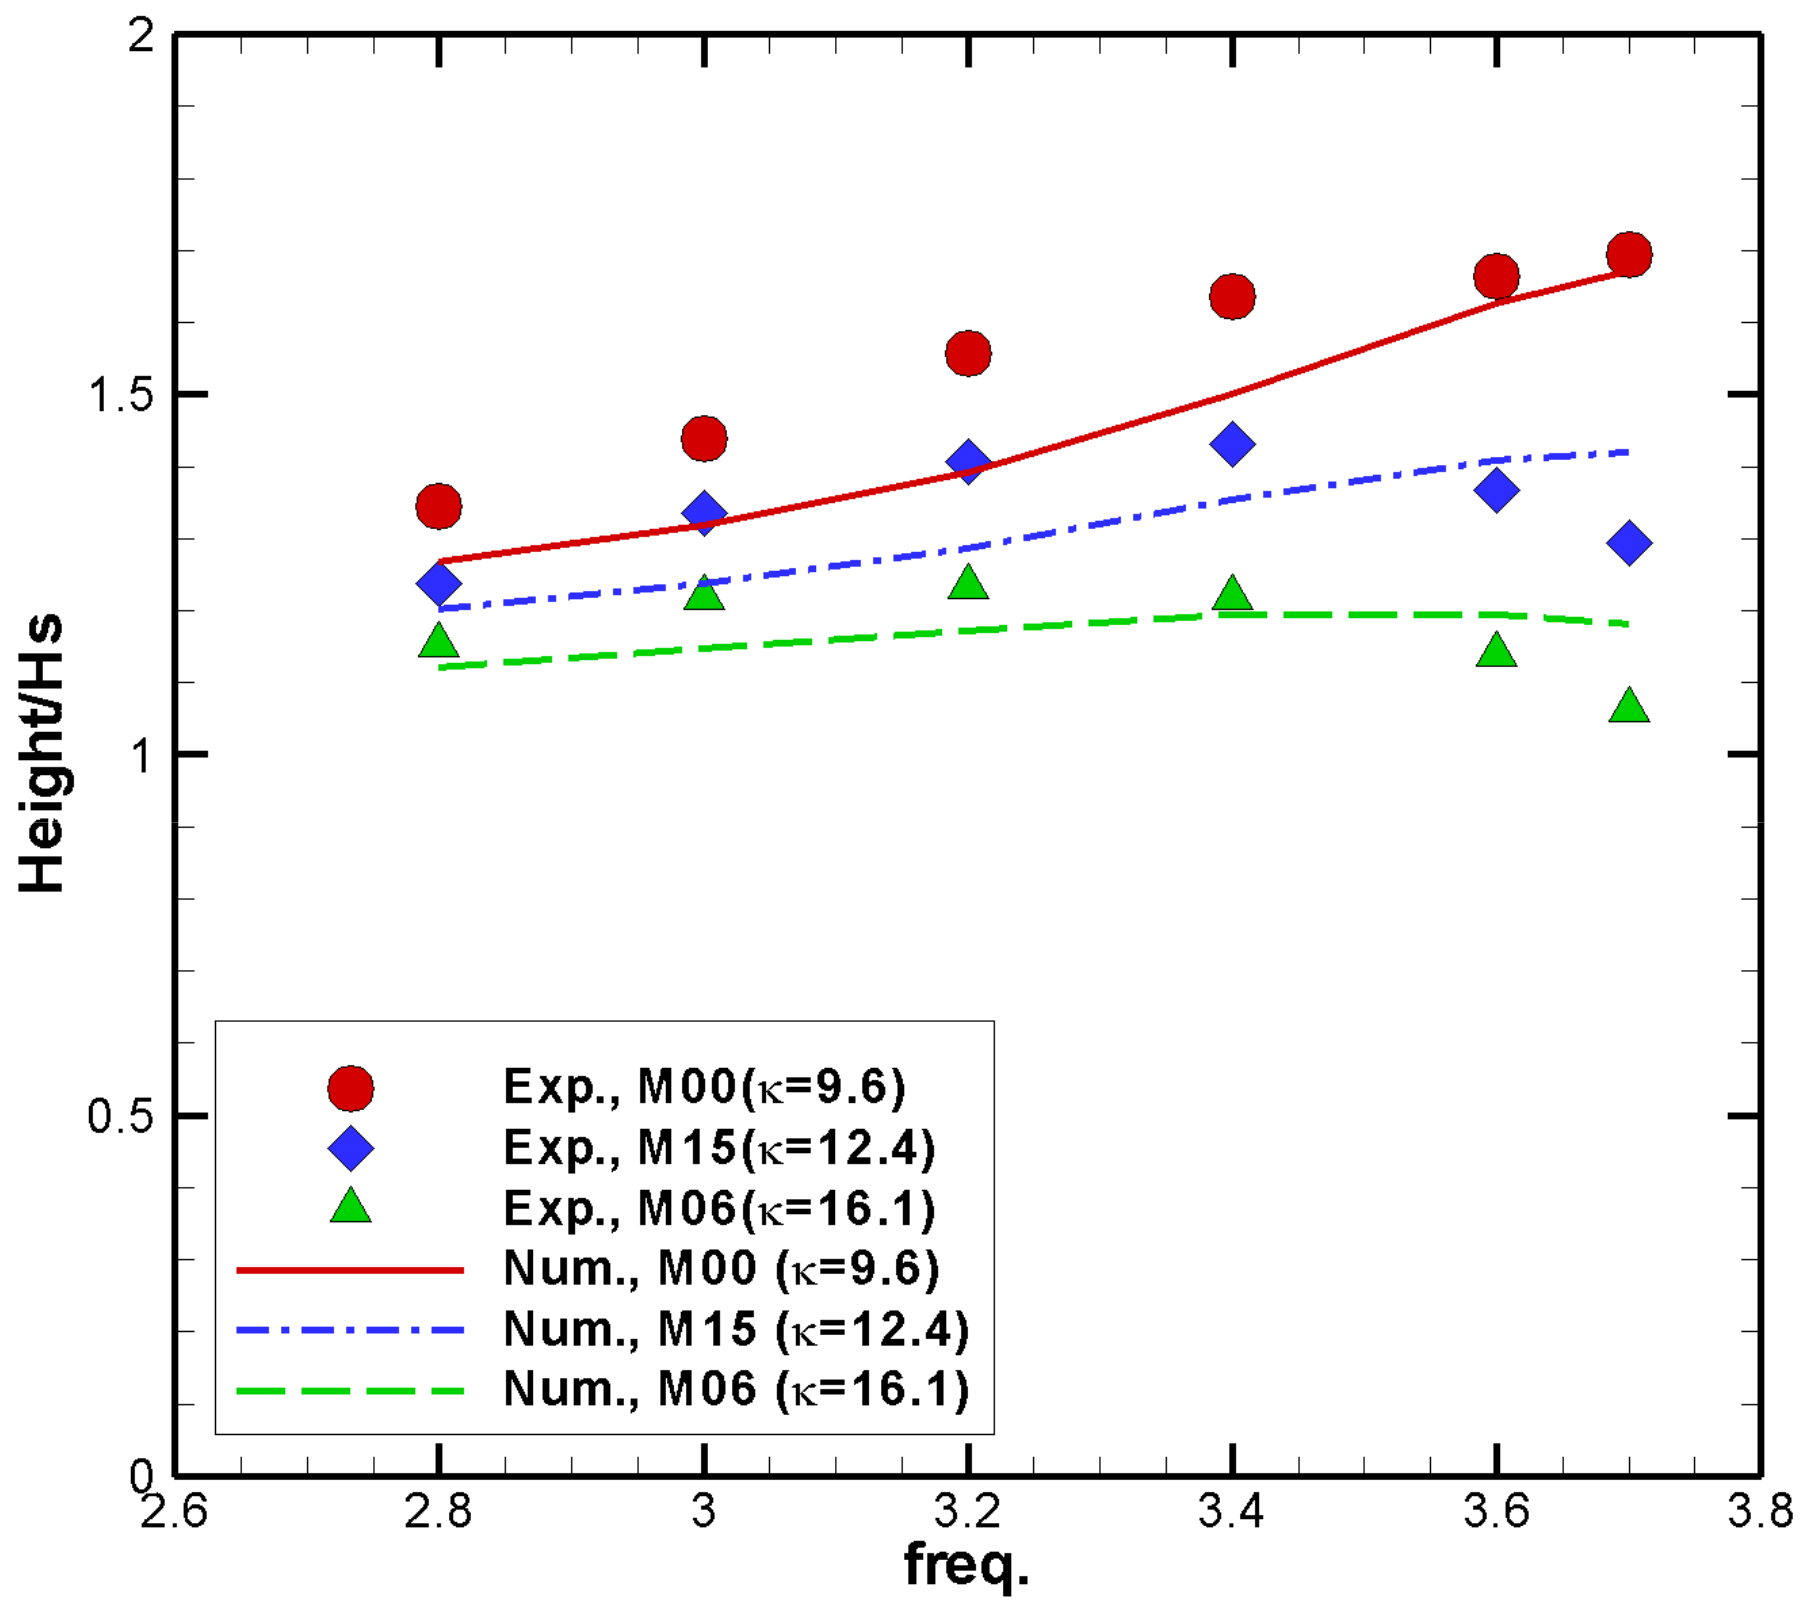
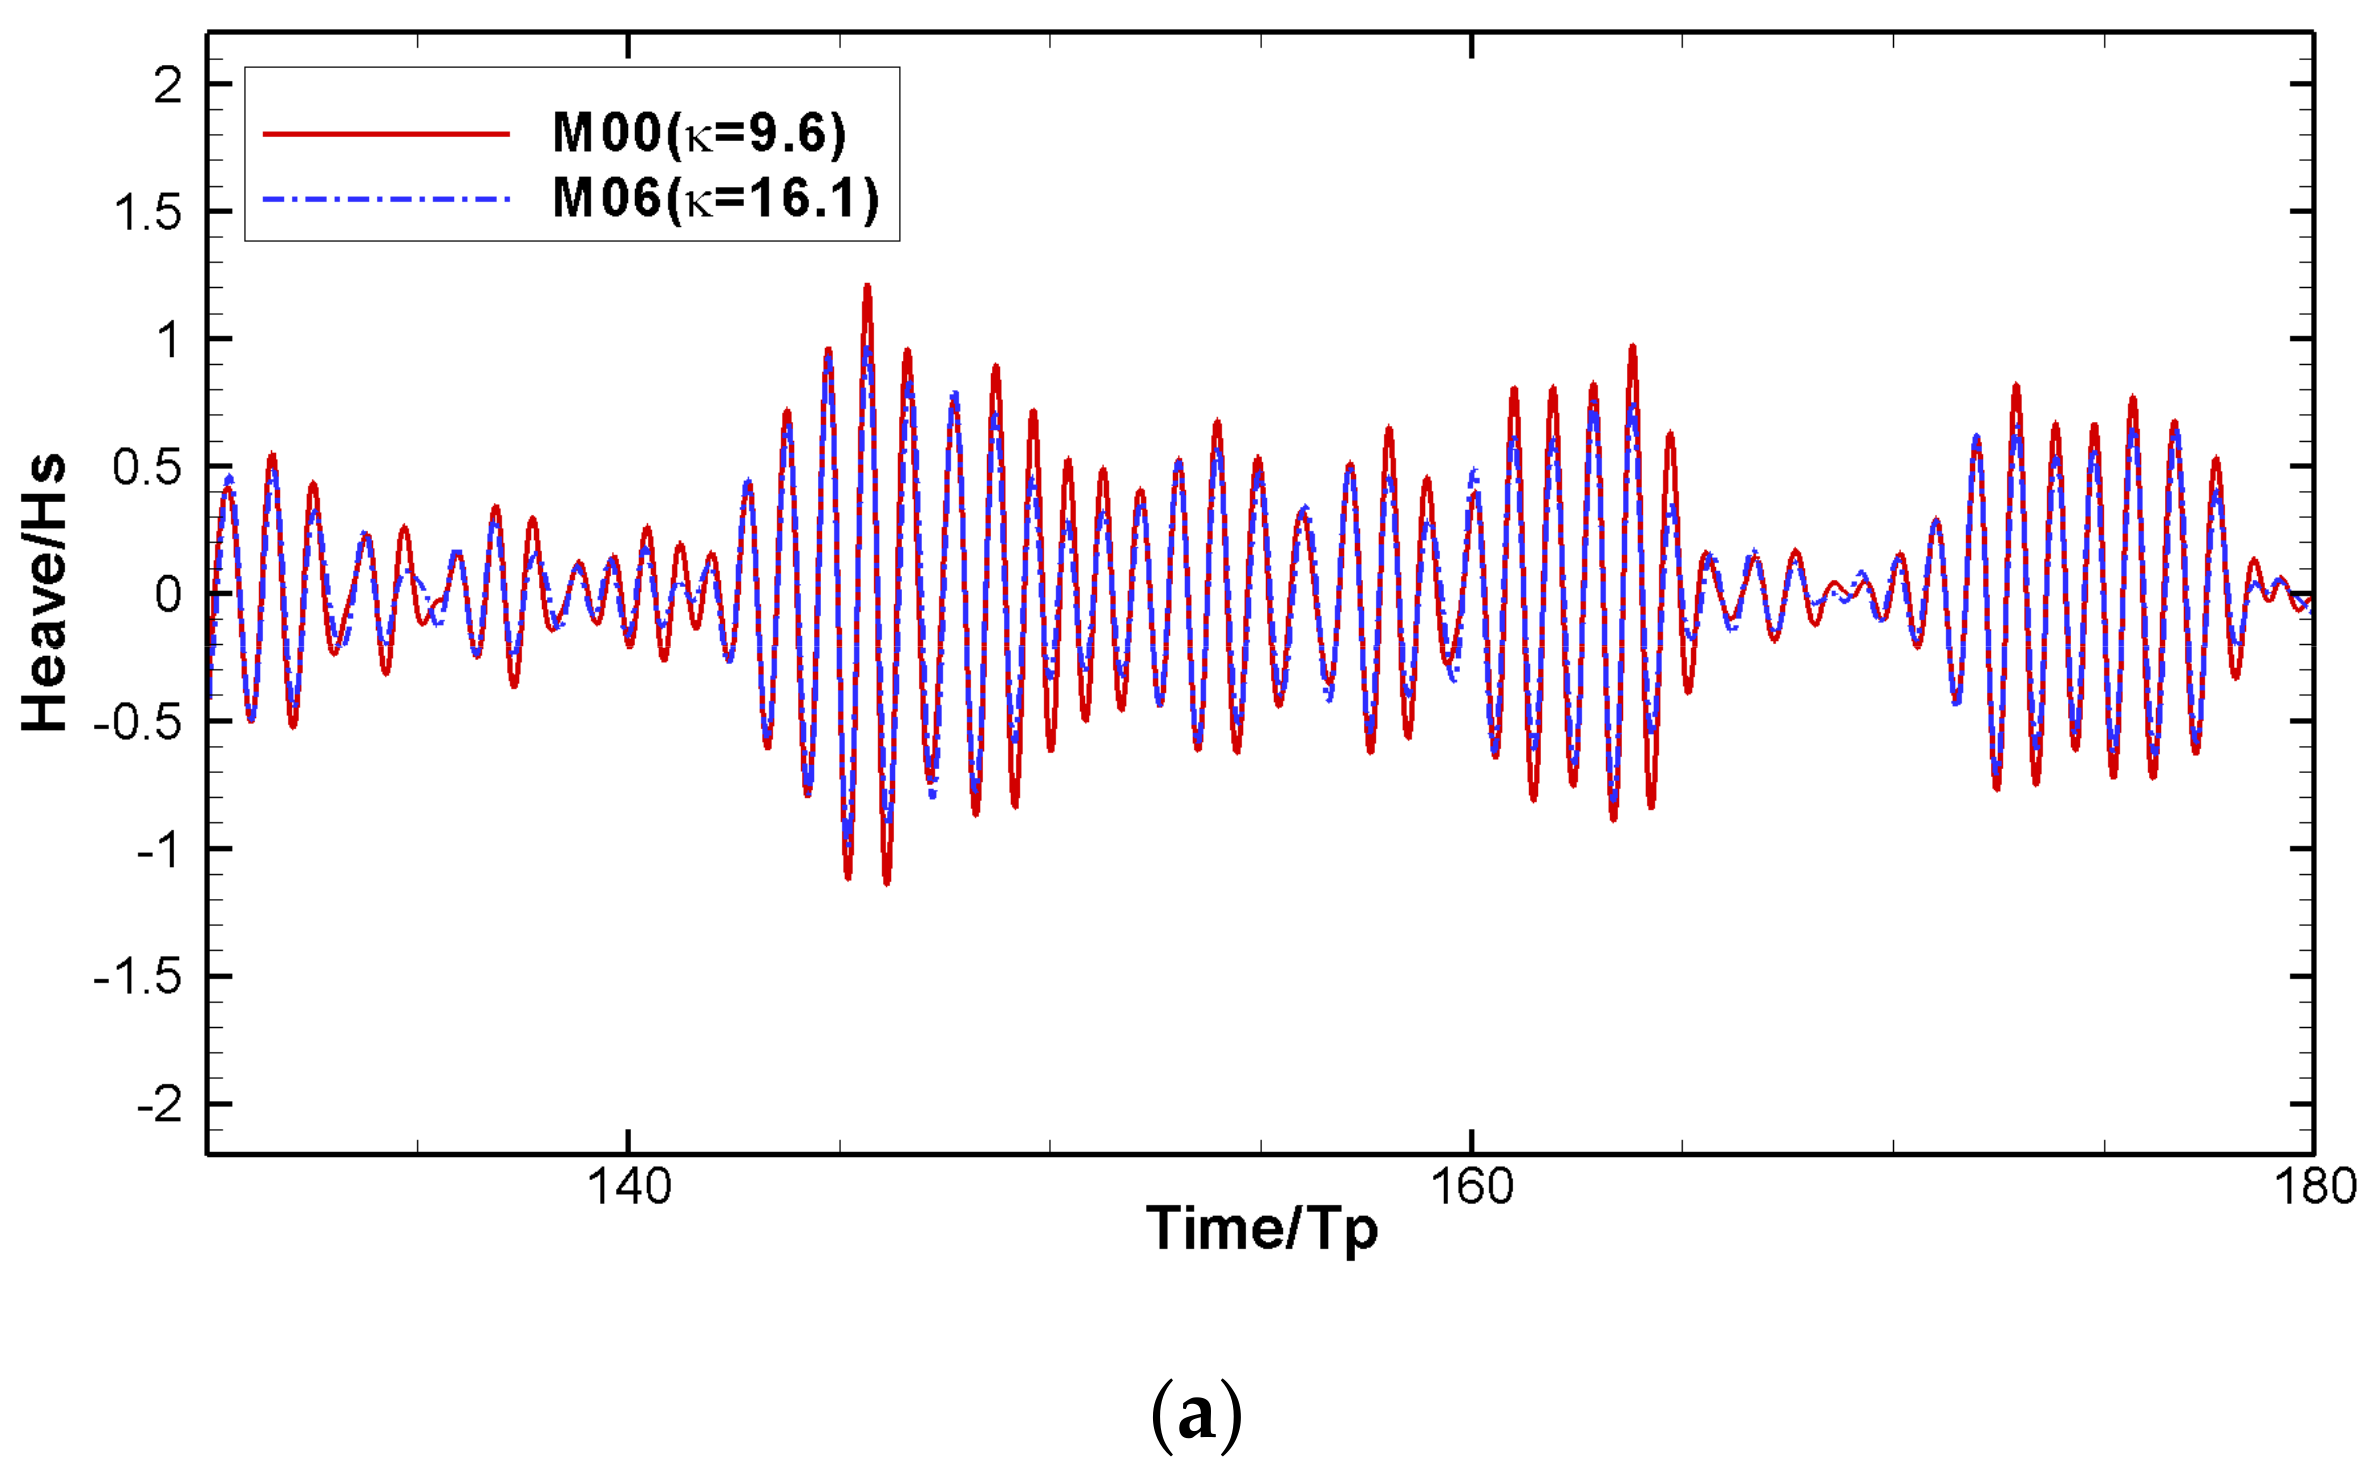
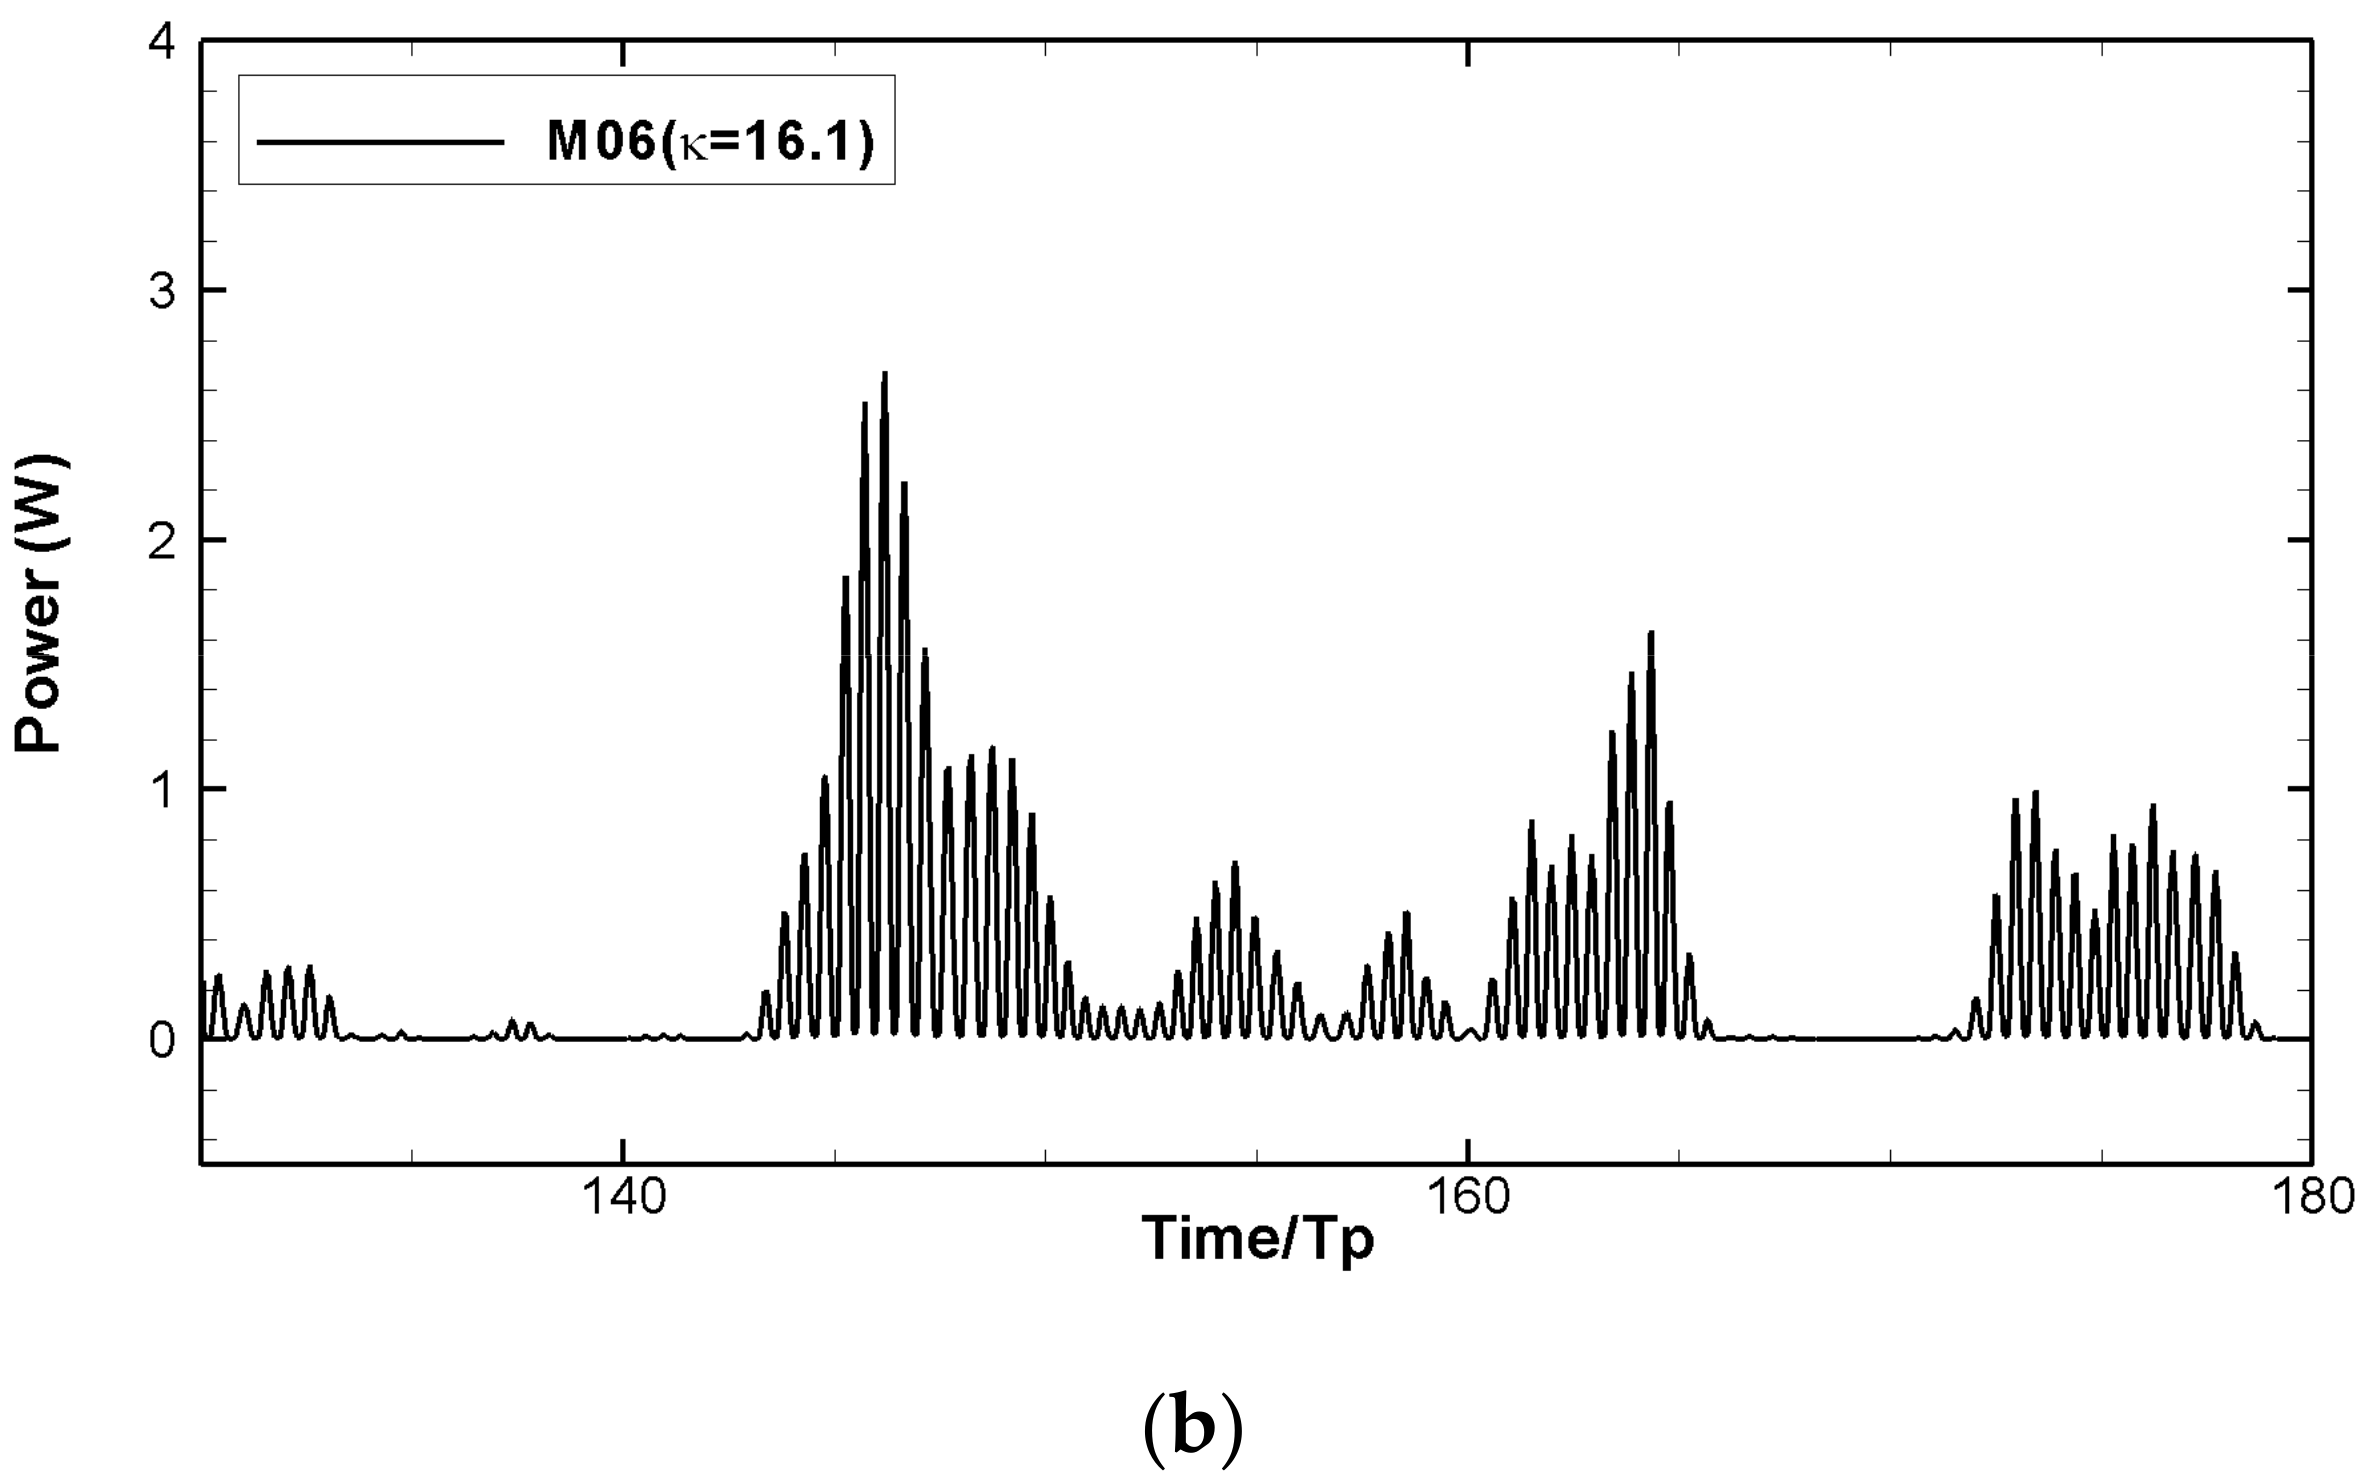
4.2. Motion Responses of Multiple Heaving Point Absorber Connected to Large Semi-Submersible
5. Conclusions
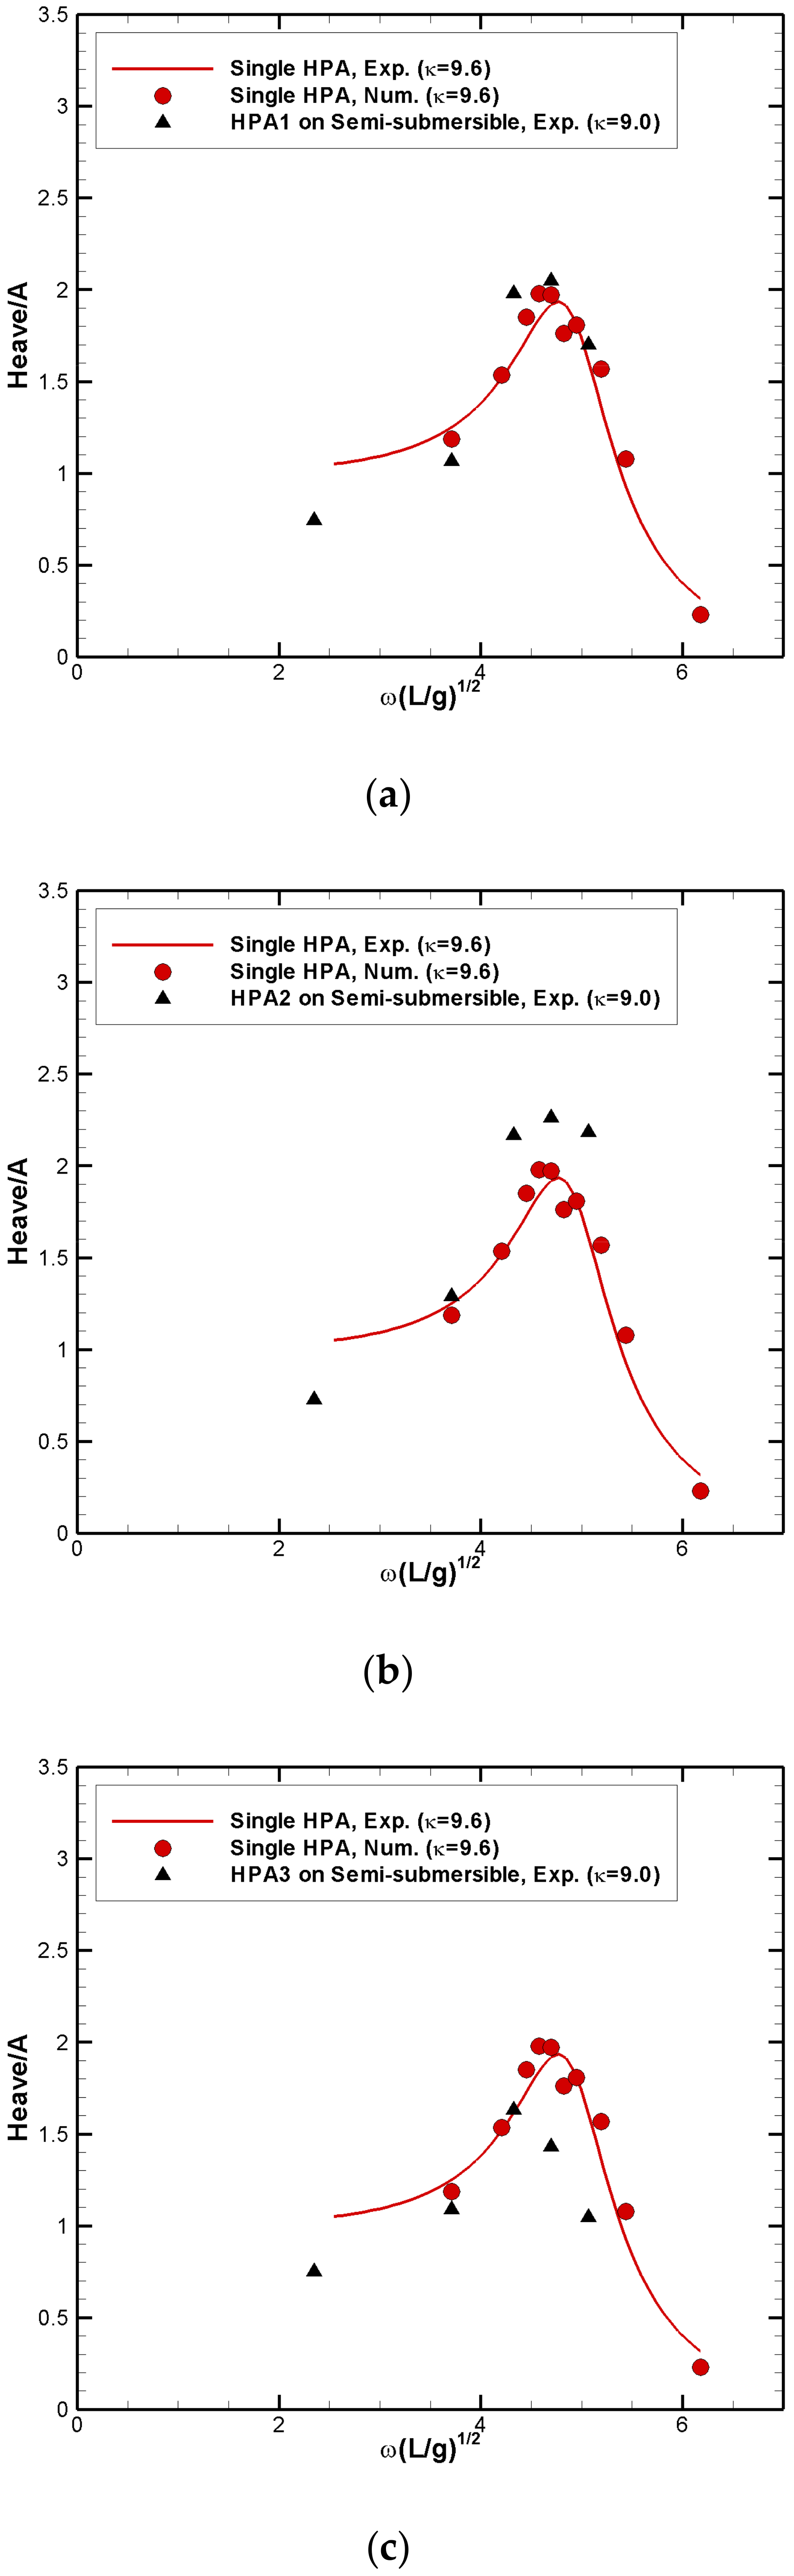
- The motion of a single HPA moving along a wall-mounted guide can be predicted using a potential flow analysis based on eigenvalue analysis.
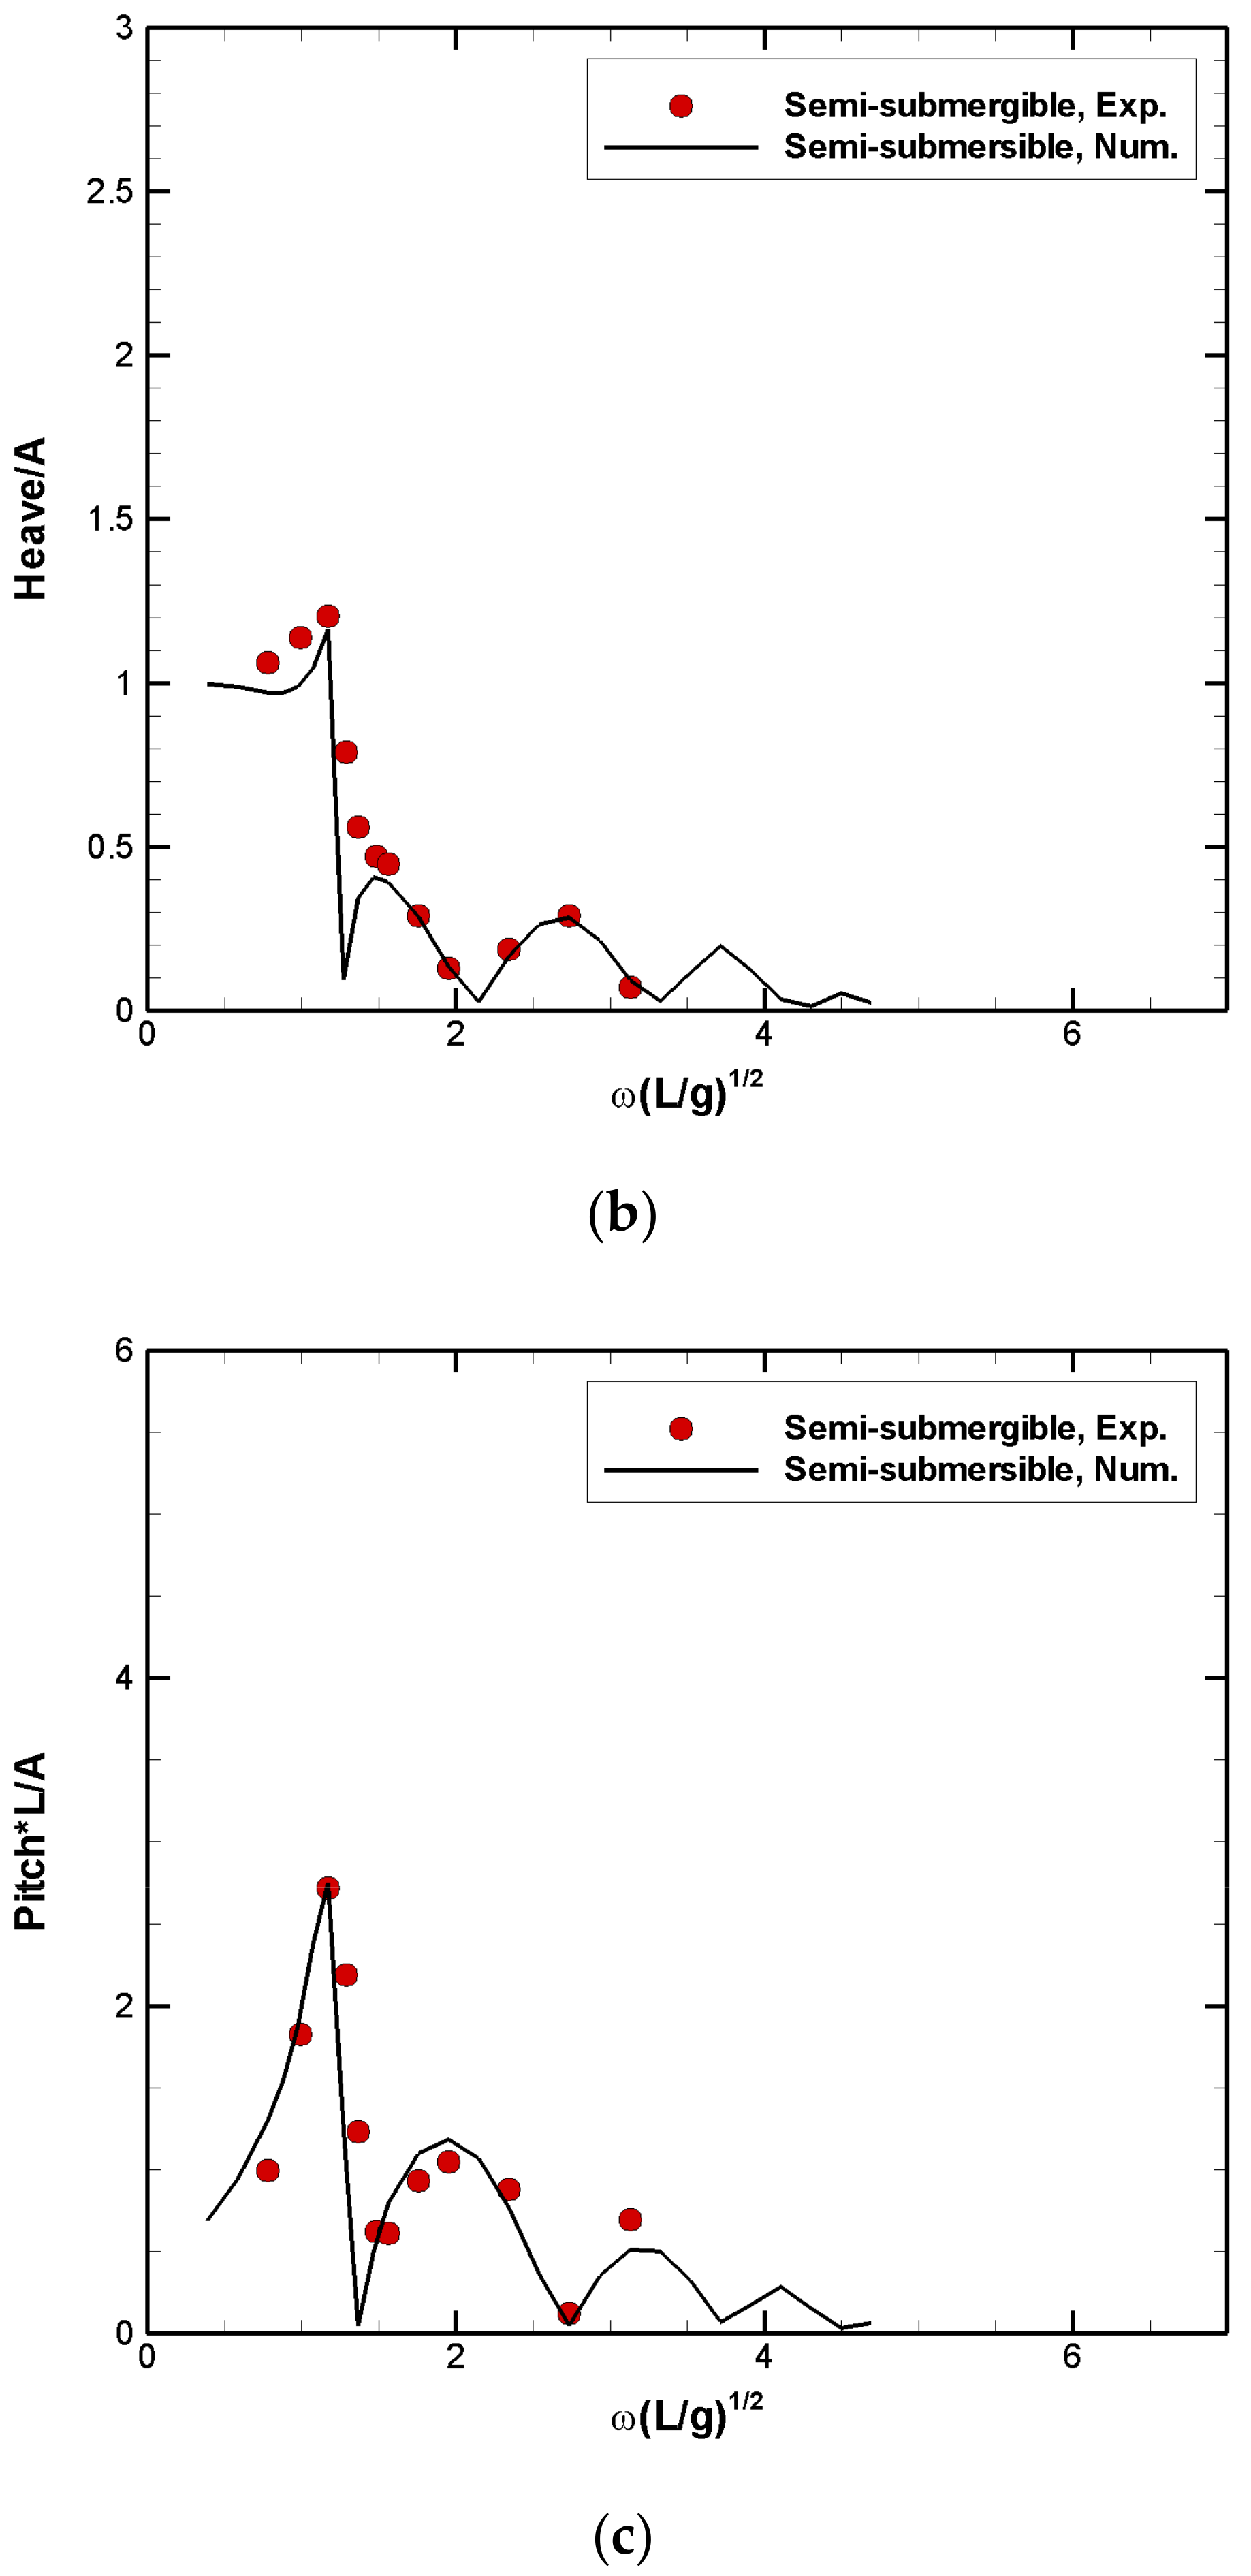
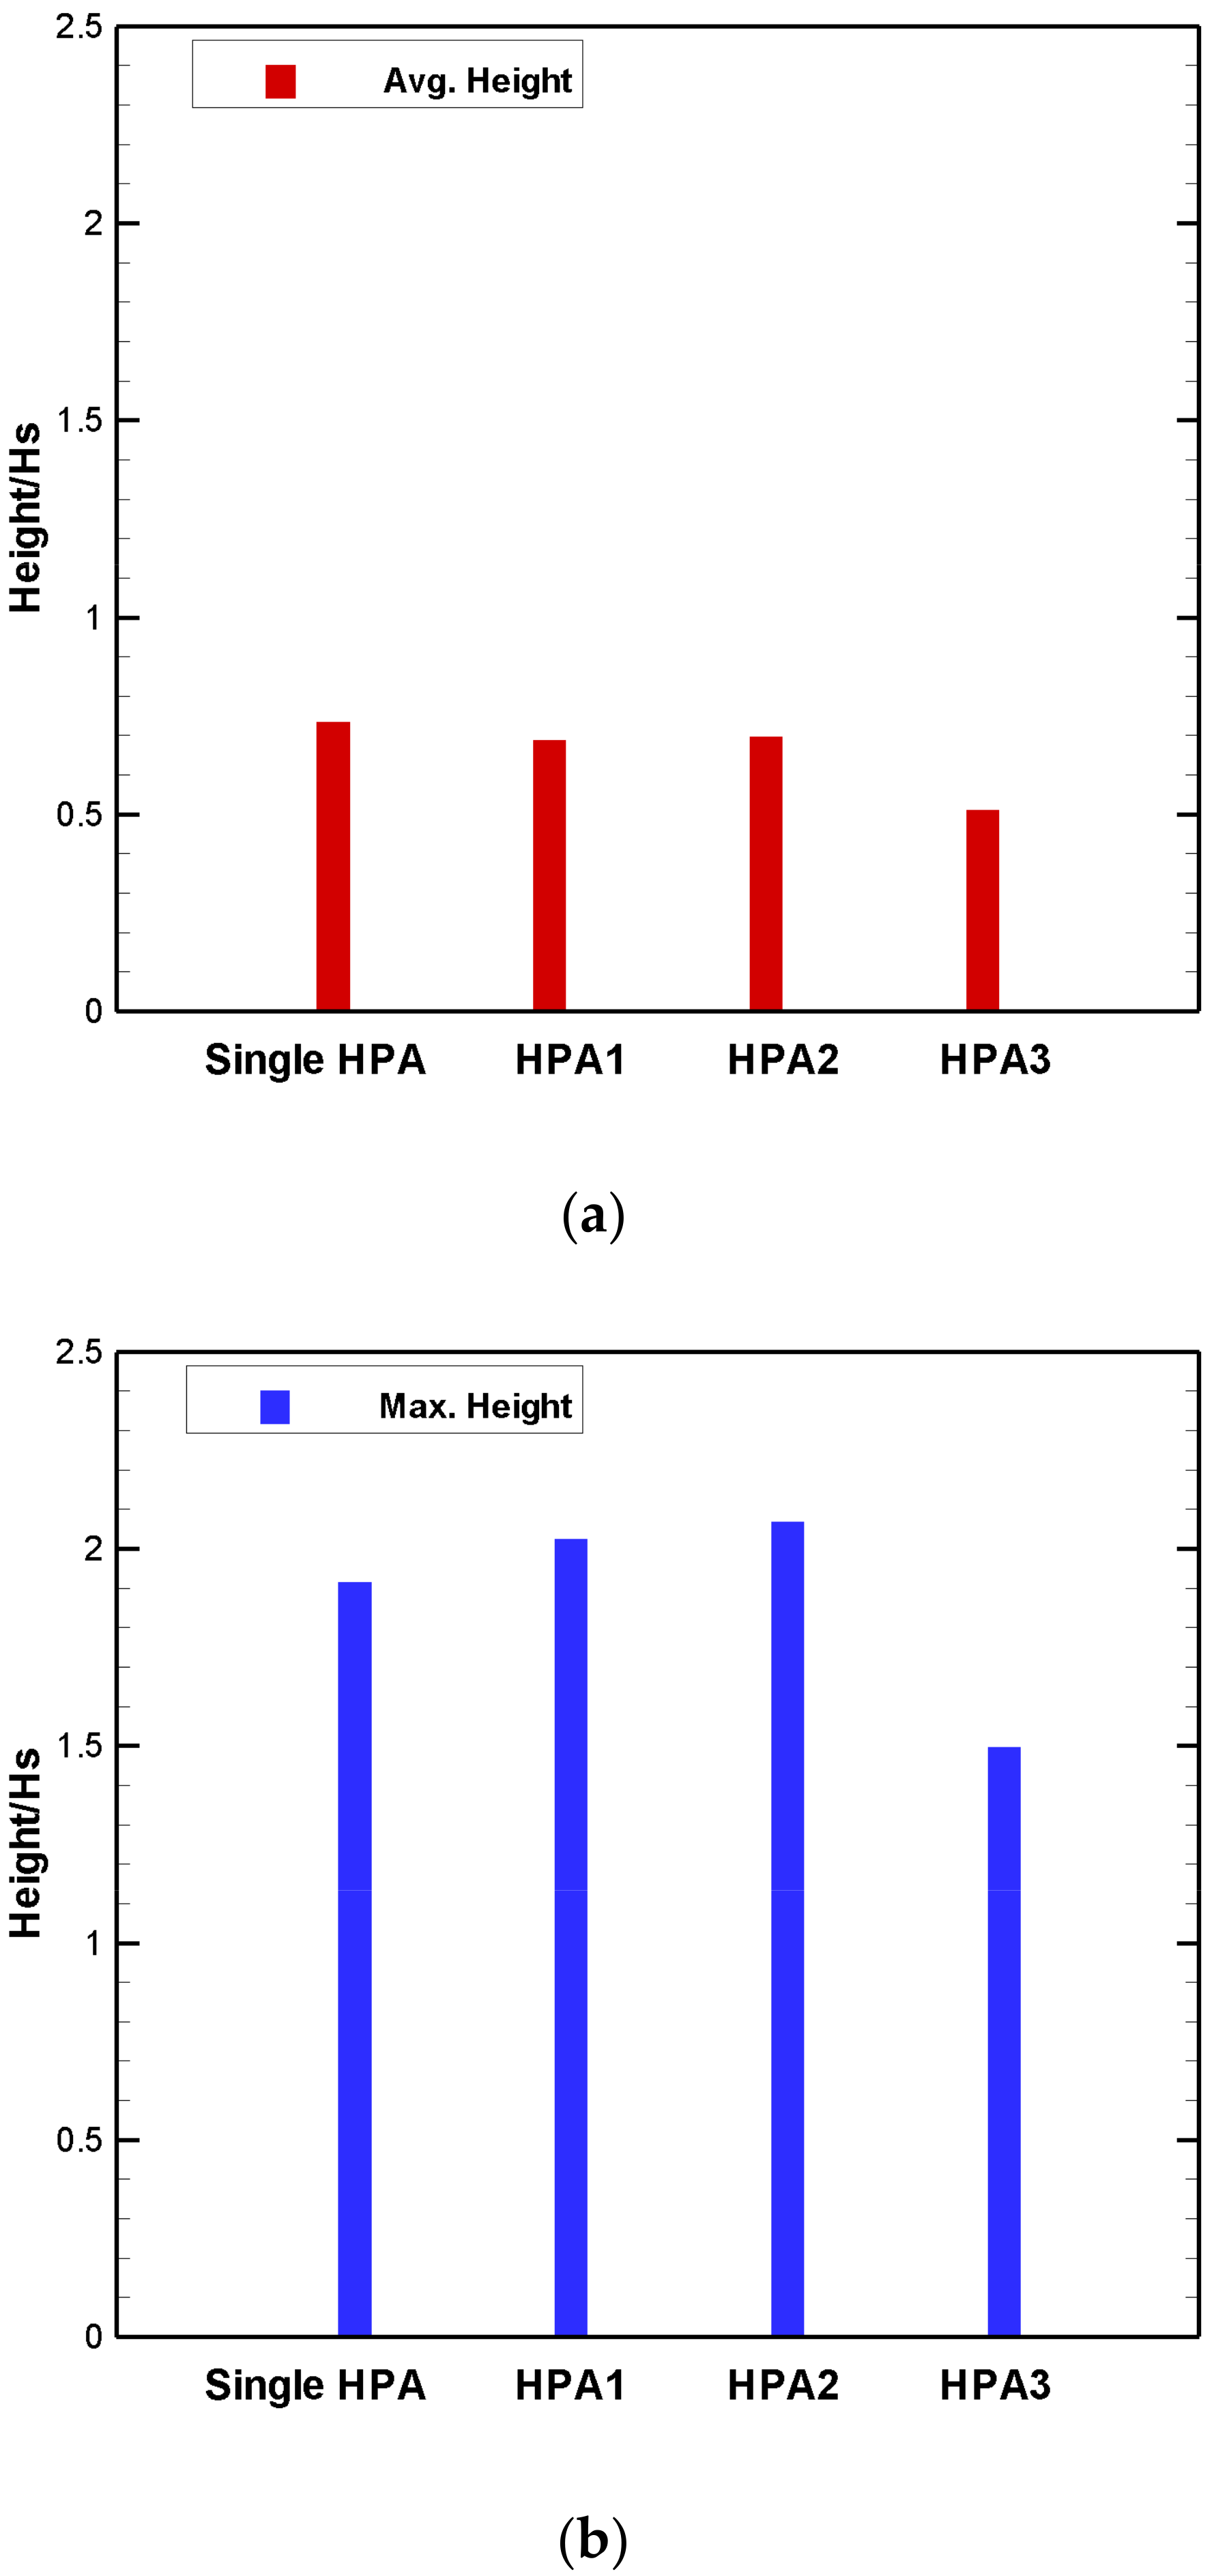
- The motion responses of HPAs connected to the large semi-submersible on the weather side tend to be similar to that of the single HPA among regular waves, and the motion response of HPA on the lee side is less than that of the single HPA.
- The motion responses of HPAs connected to the large semi-submersible among irregular waves tend to be similar to those of regular waves, but if the wave period moves away from the resonance period of HPA, the motion responses of HPAs on the weather side and lee side become similar.
Author Contributions
Funding
Conflicts of Interest
References
- Perez-Collazo, C.; Greaves, D.; Iglesias, G. A review of combined wave and offshore wind energy. Renew. Sustain. Energy Rev. 2015, 42, 141–153. [Google Scholar] [CrossRef] [Green Version]
- Kim, H.C.; Kim, K.H.; Kim, M.H.; Hong, K. Global Performance of a KRISO Semisubmersible Multiunit Floating Offshore Wind Turbine: Numerical Simulation vs. Model Test. Int. J. Offshore Polar Eng. 2017, 27, 70–81. [Google Scholar] [CrossRef]
- Bae, Y.H.; Kim, M.H. Influence of failed blade-pitch-control system to FOWT by aero-elastic-control-floater-mooring coupled dynamic analysis. Ocean. Sys. Eng. 2013, 3, 295–307. [Google Scholar] [CrossRef]
- Bae, Y.H.; Kim, M.H. Coupled dynamic analysis of multiple wind turbines on a large single floater. Ocean. Eng. 2014, 92, 175–187. [Google Scholar] [CrossRef]
- Lee, S.; Kim, K.H.; Lee, K.; Park, S.; Hong, K. Large-eddy simulation of offshore wind plants and fatigue load mitigation via pitch control strategies. J. Renew. Sustain. Energy 2017, 10, 033304. [Google Scholar] [CrossRef]
- Kim, K.H.; Lee, K.; Sohn, J.M.; Park, S.; Choi, J.S.; Hong, S. Conceptual Design of 10MW Class Floating Wave-Offshore Wind Hybrid Power Generation System. In Proceedings of the Twenty-Fifth International Ocean and Polar Engineering Conference, Kona, HI, USA, 21–26 June 2015. [Google Scholar]
- Koh, H.J.; Cho, I.H. Heave motion response of a circular cylinder with the dual damping plates. Ocean. Eng. 2016, 125, 95–102. [Google Scholar] [CrossRef]
- Sow, C.L.; Koto, J.; Abyn, H. Semi-submersible heave response study using diffraction potential theory with viscous damping correction. J. Ocean. Mech. Aerosp. 2014, 5, 23–29. [Google Scholar]
- Linton, C.M.; Evans, D.V. The interaction of waves with arrays of vertical circular cylinders. J. Fluid Mech. 1990, 215, 549–569. [Google Scholar] [CrossRef]
- Evans, D.; Porter, R. Near-trapping of waves by circular arrays of vertical cylinders. Appl. Ocean. Res. 1997, 19, 83–99. [Google Scholar] [CrossRef]
- Malenica, S.; Eatock Taylor, R.; Huang, J.B. Second-order wave diffraction by an array of vertical cylinders. J. Fluid Mech. 1990, 390, 349–373. [Google Scholar] [CrossRef]
- McIver, P. Wave interaction with arrays of structures. Appl. Ocean. Res. 2002, 24, 121–126. [Google Scholar] [CrossRef]
- Siddorn, P.; Taylor, R.E. Diffraction and independent radiation by an array of floating cylinders. Ocean. Eng. 2008, 35, 1289–1303. [Google Scholar] [CrossRef]
- Meylan, M.H.; Eatock Taylor, R. Time-dependent water-wave scattering by arrays of cylinders and the approximation of near trapping. J. Fluid Mech. 2009, 631, 103–125. [Google Scholar] [CrossRef]
- Li, Y.; Yu, Y.-H. A synthesis of numerical methods for modeling wave energy converter-point absorbers. Renew. Sustain. Energy Rev. 2012, 16, 4352–4364. [Google Scholar] [CrossRef]
- Wolgamot, H.A.; Meylan, M.H.; Reid, C.D. Multiply heaving bodies in the time-domain: Symmetry and complex resonances. J. Fluids Struc. 2017, 69, 232–251. [Google Scholar] [CrossRef]
- Ropero-Giralda, P.; Crespo, A.J.; Tagliafierro, B.; Altomare, C.; Domínguez, J.M.; Gómez-Gesteira, M.; Viccione, G. Efficiency and survivability analysis of a point-absorber wave energy converter using DualSPHysics. Renew. Erg. 2020, 162, 1763–1776. [Google Scholar] [CrossRef]
- Haraguchi, R.; Asai, T. Enhanced power absorption of a point absorber wave energy converter using a tuned inertial mass. Energy 2020, 202, 117740. [Google Scholar] [CrossRef]


| Item | Unit | Real | Model |
|---|---|---|---|
| Weight | kg | 64,400 | 62.8 |
| Diameter | M | 4 | 0.4 |
| Draft | M | 5 | 0.5 |
| Heave natural period | rad/sec | 1.26 | 3.8 |
| Case | Resistance (Ω) | PTO Damping Coefficient (kg/s) | Total Damping Coefficient (kg/s) | |
|---|---|---|---|---|
| M00 | 0 | 0 | 60.15 | 9.6 |
| M15 | 15 | 17.17 | 77.32 | 12.4 |
| M06 | 6 | 40.73 | 100.88 | 16.1 |
| Part | Item | Unit | Prototype | Model |
|---|---|---|---|---|
| Platform | Displacement | ton | 27,266 | 0.218128 |
| Draft (Design) | m | 15 | 0.3 | |
| Column Span (center to center) | m | 150 | 3 | |
| Column freeboard | m | 12 | 0.24 | |
| Center of Gravity (CoG) above Keel | m | 15.34 | 0.3068 | |
| Roll Radius Gyration: Rxx | m | 62.24 | 1.2448 | |
| Pitch Radius Gyration: Ryy | m | 62.3 | 1.246 | |
| Yaw Radius Gyration: Rzz | m | 84 | 1.68 | |
| GM (F.S Correction) | m | 104.35 | 2.087 | |
| Heave Natural Period | s | 20.27 | 2.8661 | |
| Surge/Sway Natural Period | s | 152.13 | 21.5149 | |
| Roll/Pitch Natural Period | s | 20.33 | 2.8756 | |
| HPA | Buoy Weight | kg | 88,000 | 0.704 |
| Buoy Diameter | m | 4 | 0.08 | |
| Buoy Draft | m | 5 | 0.1 |
| Mode | Surge (sec) | Sway (sec) | Heave (sec) | Roll (sec) | Pitch (sec) | Yaw (sec) |
|---|---|---|---|---|---|---|
| Exp. | 153.05 | 148.63 | 19.54 | 19.70 | 20.13 | 166.29 |
| Num. | 152.13 | 152.13 | 20.27 | 20.33 | 20.33 | 162.93 |
| Error | 0.6% | −2.3% | −3.7% | −3.2% | −1.0% | 2.0% |
| Mooring Line Properties | Unit | Prototype | Model |
|---|---|---|---|
| One-line Wet Weight | kg | 213,000 | 1.704 |
| Line Length | m | 500 | 10 |
| Clump Wet Weight | kg | 11,000 | 0.088 |
| Total Number of Clumps | EA | 6 | 6 |
| Condition | Hs (m) | Tp (s) | Vc (m/s) | Wave Spectrum |
|---|---|---|---|---|
| Operational condition | 3.00 | 6.67 | 0.14 | JONSWAP (γ = 2.2) |
| 1-y return period | 5.74 | 10.81 | 0.14 | JONSWAP (γ = 2.2) |
| 10-y return period | 7.67 | 12.40 | 0.14 | JONSWAP (γ = 2.2) |
| Case | 1 | 2 | 3 | 4 | 5 | 6 | 7 | 8 | 9 | 10 |
|---|---|---|---|---|---|---|---|---|---|---|
| Frequency (rad/s) | 3.0 | 3.4 | 3.6 | 3.7 | 3.8 | 3.9 | 4.0 | 4.2 | 4.4 | 5.0 |
| Mechanical Power (Cal.) (W) | 0.51 | 0.52 | 0.52 | 0.52 | 0.49 | 0.45 | 0.38 | 0.23 | 0.11 | 0.01 |
| Electrical Power (Exp.) (W) | 0.36 | 0.45 | 0.50 | 0.41 | 0.38 | 0.24 | 0.22 | 0.09 | 0.03 | 0.00 |
| Efficiency | 0.70 | 0.87 | 0.96 | 0.79 | 0.78 | 0.53 | 0.58 | 0.39 | 0.27 | 0.00 |
| Case | ||
|---|---|---|
| 1 | 0.112 | 2.8 |
| 2 | 0.098 | 3.0 |
| 3 | 0.087 | 3.2 |
| 4 | 0.077 | 3.4 |
| 5 | 0.068 | 3.6 |
| 6 | 0.065 | 3.7 |
Publisher’s Note: MDPI stays neutral with regard to jurisdictional claims in published maps and institutional affiliations. |
© 2021 by the authors. Licensee MDPI, Basel, Switzerland. This article is an open access article distributed under the terms and conditions of the Creative Commons Attribution (CC BY) license (https://creativecommons.org/licenses/by/4.0/).
Share and Cite
Kim, K.-H.; Park, S.; Kim, J.-R.; Cho, I.-H.; Hong, K. Numerical and Experimental Analyses on Motion Responses on Heaving Point Absorbers Connected to Large Semi-Submersibles. Processes 2021, 9, 1363. https://0-doi-org.brum.beds.ac.uk/10.3390/pr9081363
Kim K-H, Park S, Kim J-R, Cho I-H, Hong K. Numerical and Experimental Analyses on Motion Responses on Heaving Point Absorbers Connected to Large Semi-Submersibles. Processes. 2021; 9(8):1363. https://0-doi-org.brum.beds.ac.uk/10.3390/pr9081363
Chicago/Turabian StyleKim, Kyong-Hwan, Sewan Park, Jeong-Rok Kim, Il-Hyoung Cho, and Keyyong Hong. 2021. "Numerical and Experimental Analyses on Motion Responses on Heaving Point Absorbers Connected to Large Semi-Submersibles" Processes 9, no. 8: 1363. https://0-doi-org.brum.beds.ac.uk/10.3390/pr9081363