
Integration of the Process for Production of Ethyl Acetate by an Enhanced Extraction Process


Department of Chemical Engineering and Process Design, Silesian University of Technology, M. Strzody 7, 44-100 Gliwice, Poland
*
Author to whom correspondence should be addressed.
Processes 2021, 9(8), 1425; https://0-doi-org.brum.beds.ac.uk/10.3390/pr9081425
Submission received: 6 July 2021
/
Revised: 2 August 2021
/
Accepted: 12 August 2021
/
Published: 17 August 2021
(This article belongs to the Section Manufacturing Processes and Systems)
Abstract
:The paper presents a study on the performance of a conventional plant-producing ethyl acetate from ethanol and acetic acid. Process models were compiled in the simulator Chemcad 7. The impact of key parameters on the performance of individual installation nodes was examined by sensitivity analysis. Three installation approaches are presented and compared: two classic with different heat duties and an improved one. An improved technological solution, with a closed circulation of the extractant as well as the azeotrope subcooling for better extraction is demonstrated. The energy and mass balance of the installation were developed. The proposed enhancement of a technology with significantly reduced consumption of the fresh extractant also offers a deep recovery of the raw materials, i.e., ethyl acetate and ethanol from wastewater. We assumed that the same energy consumption relative to the classic strategy consumption of ethanol was reduced from 0.531 to 0.524 t/tproduct (−1.2%), fresh process water from 2.18 to 1.42 t/tproduct (−34.9%), and wastewater 2.36 to 1.61 t/tproduct (−31.8%). By this, the wastewater total organic loading (TOL), as well as chemical oxygen demand were nine times reduced. The major advantage is achieved through subcooling of azeotrope, which improves extraction efficiency, making the organic phase enriched with ethyl acetate. Therefore, the performance of the product separation node and the whole system are improved.
1. Introduction
Solvents, such as ethyl acetate, are the substances used in many industrial processes, including the chemical industry. Due to their wide range of application, world demand for solvents is constantly growing [1,2,3]. Increasingly stringent regulations on emissions of harmful pollutants from production processes make the importance of so called “green chemistry” (non-toxic chemicals to the environment and living organisms) well recognized [4]. There is, therefore, an urgent need for commonly used solvents to have a lower health and environmental impact. Ethyl acetate is characterized by low toxicity and, importantly, it is biodegradable. These advantageous features caused a significant increase in the market demand for this product of “green chemistry”. On the other hand, a sustainable development and good engineering practice are the drivers towards a lowered consumption of energy and utilities, as well as a reduced wastes production—an economy of the closed cycle. A technology improvement presented herein responds to all these environmental and economy requirements.
In order to minimize the losses of raw materials and the consumption of auxiliary media, it is necessary to optimize the technology. This will both improve the economy of the process and minimize the environmental impact by reducing pollutant emissions. Our improved variant of the classic ethyl acetate plant includes additional subcooling of azeotrope, which improves extraction efficiency, making the organic phase enriched with ethyl acetate. This increases the efficiency of the other installation units, and reduces the heat duty of the plant and the emission of pollutants. A closed circulation of the extractant was also applied, which contributes to reducing the amount of wastewater.
1.1. Synthesis Methods
Ethyl acetate (EA) in the chemical industry is obtained mainly by the classic Fischer esterification reaction, where the substrates are ethanol (ET) and acetic acid (AA), and water (W) is a by-product of the reaction [5].
Esters, including ethyl acetate, can also be synthesized in a number of other reactions using compounds such as acid anhydrides, acid chlorides, amides, nitriles, unsaturated hydrocarbons, ethers, aldehydes, ketones, alcohols and other esters (transesterification reaction) [6]. However, due to the relatively high price of raw materials and the possibility of undesired by-products forming by these pathways of alternative synthesis, the classic Fischer esterification is found to be the most commonly used reaction for the EA synthesis. The Fischer reaction of esterification of alcohols with carboxylic acids is carried out at elevated temperatures, in the presence of catalysts. Both homogenous and heterogeneous catalysts are employed [7]. The former are usually inorganic acids such as sulfuric and phosphoric acid, and hydrochloric acid, while the latter include acidic ion exchange resins. In the presence of the mentioned catalysts, the ethyl acetate synthesis is carried out under the temperature ranging between 70–90 °C. The temperature of the reaction mixture is controlled at a level assuring efficient removal of the vapors of the lighter key product in the esterification reaction [8].
The reaction of liquid phase esterification is reversible and insignificantly exothermic. The value of the equilibrium constant of the reaction depends primarily on the structure of alcohol and acid. In the reaction of acetic acid with ethyl alcohol, the equilibrium constant may vary in the range of 4–4.5, which corresponds to a conversion of 66–68% at a stoichiometric ratio of substrates [8].
Ionic liquids can also be used as a catalyst for the reaction. In the esterification process, it is possible to carry out the reaction already at room temperature, while obtaining high yields. Another advantage of using this type of catalyst is the fact that the reaction product is eliminated from the reaction medium as a separate phase [9], thus shifting the reaction equilibrium towards the product. The homogeneous catalyst, which is an ionic liquid, can therefore be reused by returning it to the process after purification [10,11]. Due to their corrosiveness, ionic liquids are rarely used on an industrial scale to produce ethyl acetate.
The process can also take place in the steam phase. The catalysts are then oxides of metals such as ZrO2, TiO2, Al2O3, Fe2O3, and the reaction is carried out at a temperature that allows the evaporation of the reactants [12,13]. In the case of ethyl acetate, the conversion rate of the reactants can be as high as 100%; however, depending on the catalyst used, by-products may be formed [12,13].
An alternative method is the Tishchenko reaction, in which acetaldehyde disproportionates in the presence of base to the alcohol and the acid that then esterify in situ [14]. The most common catalyst of this reaction are aluminum alkoxides. In this reaction, the obtainable yield of ethyl acetate by adding aluminum ethoxide to acetaldehyde at −20 °C is 61% [15]. However, this method is less popular than the classical Fischer esterification due to the availability and price of the raw material [16].
There are also other methods of synthesis, such as ethanol dehydrogenation and synthesis from ethylene and acetic acid. These methods require difficult process conditions (T > 200 °C, p > 20 bar), which significantly increases the investment costs of the plant. Selectivity of the ethyl acetate synthesis from ethylene and acetic acid is almost 100% [17], but the efficiency of this process is not so high. Depending on the catalyst used, the maximum achieved conversion degree of this process ranges between 40% [18] and 50% [5]. On the other hand, many by-products are formed in the ethanol dehydrogenation reaction such as other esters, alcohols, aldehydes and ketones. The reaction mixture contains components with boiling points similar to ethyl acetate, including components which can form azeotropes [19]. This is a particular problem when high purity ethyl acetate is desired [20].
Considering the advantages and disadvantages of individual methods, a classic Fischer esterification reaction was selected in the modeled installation.
1.2. Purification Method
Distillation is one of the most common methods of separating components of liquid mixtures. However, it is not always possible to separate a liquid mixture by simple distillation. Separation of the EA–ET–W mixture is one of such cases [21]. Ethyl acetate cannot be separated from water and ethanol by simple distillation, because a ternary azeotrope consisting of: 83.1% ethyl acetate, 8.7% ethanol and 8.2% water, is formed [22]. Therefore, the separation of reaction products is far more complex, in this particular case.
The classic method of purifying the reaction mixture is a three-stage distillation in combination with a water extraction process. There are also other methods used to purify the reaction mixture such as extractive distillation and membrane methods.
Extractive distillation is a partial vaporization process in the presence of a non-volatile separating agent with a high boiling point, which is generally called solvent or entrainer, and which is added to the azeotropic mixture to alter the relative volatility of the key component with no additional formation of azeotropes [23]. The principle driving extractive distillation is based on the introduction of a selective solvent that interacts differently with each of the components of the original mixture and which generally shows a strong affinity with one of the key components [23]. The extraction agent after extractive distillation is purified in the recovery column and recycled to the process. Thanks to this it can work in a closed circuit, which reduces the amount of generated waste [24]. Typical examples of effective agents used in extractive distillation in the purification of ethyl acetate are: dimethyl sulfoxide, glycerin and diethyl glycol, 1-naphthol, hydroquinone and N,N-dimethylformamide [25]. Due to the complex nature of the reaction mixture, in order to obtain a pure product, the extraction distillation has to be combined with another method, e.g., a membrane method [22].
Membrane processes belong to a large group of techniques for separating the components of liquid and gas mixtures. The membrane technique used to separate azeotropic mixtures is called pervaporation [26].
Pervaporation membranes can be used to selectively separate water and ethyl acetate to break down any azeotrope present. The energy consumption in this case is lower than in the case of classical extraction with water [27].
Complete dehydration with membranes does not require a lot of energy, but leaves a waste stream of 17 wt% ethyl acetate on the permeate side [28]. This waste stream requires additional treatment. Therefore, the pervaporation process is combined with the distillation process.
Both membrane methods and extractive distillation to produce a high purity product require a combination with another method. This multiplies the disadvantages of the selected methods. Therefore, the classic method of separating the reaction mixture by distillation was chosen.
The purification process in classical technology can be divided into three stages:
- (1)
- First is the process of rectifying the reaction mixture, i.e., stripping acetic acid by a rectification column and distilling the ethyl acetate–ethanol–water (EA–ET–W) ternary azeotrope. In order to generate an azeotrope by the distillation of reaction products, and to avoid accumulating water in the reactor, an azeotropic agent should be fed to the column. By esterification of the acetic acid with ethanol, some excess water is released (approximately 17%) [29] which is more than contained in the azeotrope mixture (approximately 7.8%). Therefore, the azeotropic agent is the organic phase in the extraction process, recycled to the column. This fraction is richer in ethyl acetate than the azeotrope (>93%) [8], so it binds the excess water.
- (2)
- After azeotropic distillation, there is an extraction process. To obtain enriched phase of ethyl acetate from the distillation product, it is necessary to wash it with water and extract ethanol. The ethanol content of the organic mixture affects the solubility of water in this phase. The higher is the content of alcohol, the greater the water content in the organic phase. By extracting ethanol, water is also removed from the organic phase [8].
- (3)
- The final stage is the process of product rectification. Enriched phase of ethyl acetate is fed to the rectification column, where, by distilling the triple azeotrope, a pure ethyl acetate is obtained as the bottom product [8].
2. Methodology
In this study, the conventional process of ethyl acetate synthesis was considered [21]. Raw materials in this technology are acetic acid and anhydrous ethanol.
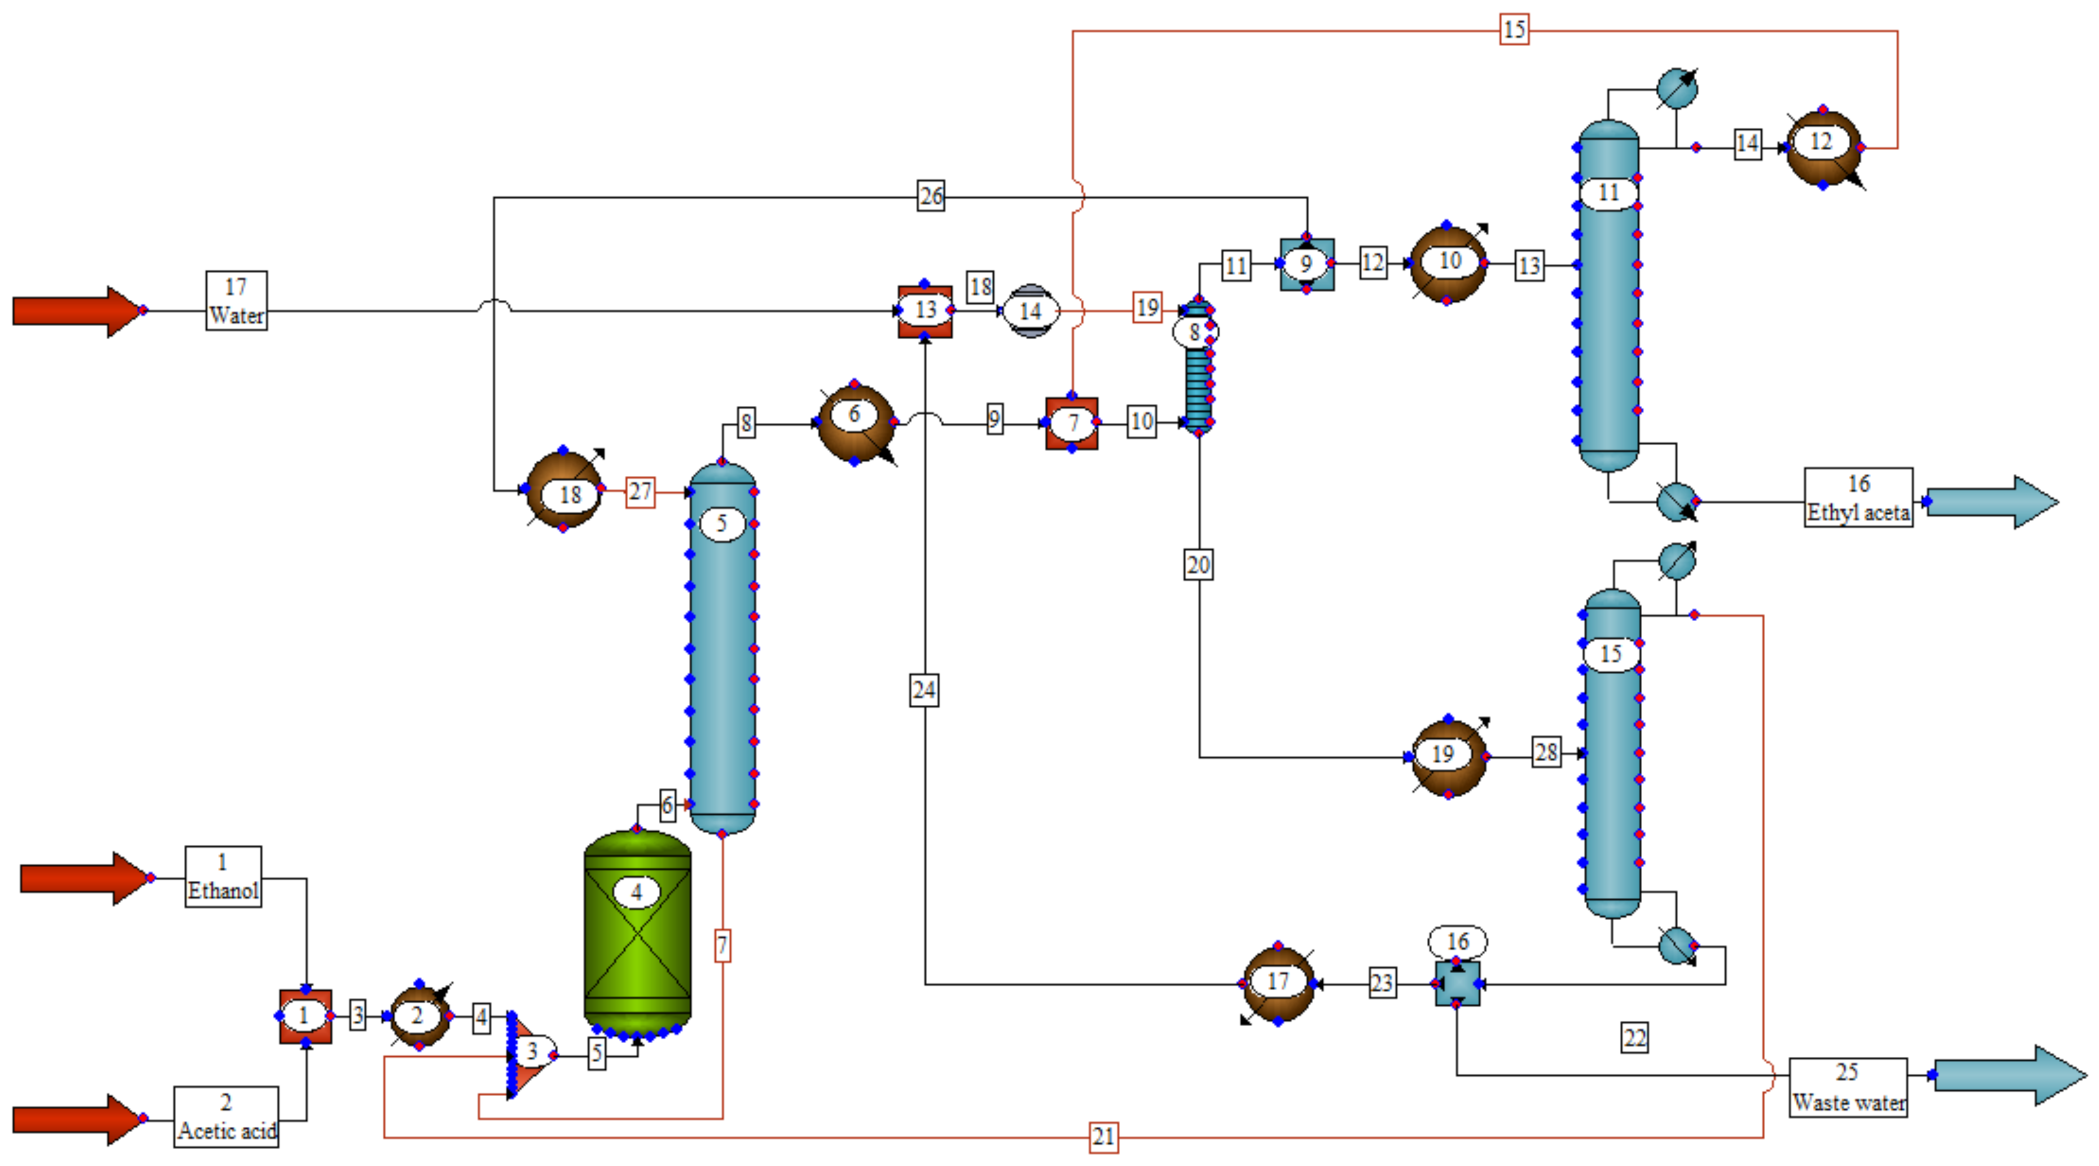
The main goal of this paper is to optimize the process conditions of synthesis and purification of ethyl acetate. A study was carried out based on a model built with the use of flowsheeting software Chemcad 7. The shame of the modeled installation is shown in Figure 1.
Acetic acid and ethanol are mixed (MIX 1, Figure 1), heated up (HTXR 2, Figure 1) and directed to the reactor. The esterification reaction takes place in the reactor–evaporator (KREA 4, Figure 1) at a temperature of about 90 °C, under atmospheric pressure. The vapors from the reactor (Stream 6, Figure 1) are directed to the column (SCDS 5, Figure 1), in which unreacted acetic acid is separated from the product by azeotropic distillation—the first stage of EA purification. The bottom product (Stream 7, Figure 1) is recycled to the reactor–evaporator. The distillate (Stream 9, Figure 1) is a triple EA–ET– W azeotrope. The azeotrope is washed with water (EXTR 8, Figure 1) to extract ethanol—the second stage of EA purification. In case of the improved approach, the extractor feed is cooled down to enhance extraction—advantageous shift of extraction equilibrium (HTXR 6, Figure 1).
The organic phase from the extraction process is partly recycled (Stream 26, Figure 1) to the azeotropic column (SCDS 5, Figure 1) as reflux, while the remainder (Stream 12, Figure 1) is directed to the product rectification column (SCDS 11, Figure 1)—final product distillation. In this column, pure ethyl acetate is obtained as the bottom product (Stream 16, Figure 1), and the subcooled distillate (triple azeotrope) is recycled to the extraction process (EXTR 8, Figure 1).
The aqueous phase after extraction (Stream 20, Figure 1), containing ethanol and ethyl acetate is directed to the wastewater column (SCDS 15, Figure 1), where ethyl acetate and ethanol are recovered. The distillate (Stream 21, Figure 1) is recycled to the reactor and the bottom product (Stream 22, Figure 1) is recycled as a washing water to the extraction process, partially refreshed with a fresh portion of water (Stream 17, Figure 1).
The impact of key parameters on the performance of individual installation nodes was examined by sensitivity analysis. On the basis of the analysis, the optimal conditions for the process were selected.
For comparison purposes, three installation approaches are presented:
Strategy 1 (S1): The improved technology of ethyl acetate synthesis differs from a classic approach by the following:
- -
- a closed circuit of the extractant, demineralized water, reducing the consumption of the fresh extractant, but also a deep recovery of raw materials, i.e., ethyl acetate and ethanol from wastewater, significantly reducing the TOL;
- -
- cooling the azeotrope before extraction (Streams 8 and 14, Figure 1) from 70 °C down to 30 °C (HTXR 6, 12, Figure 1), shifting a phase equilibrium towards higher concentrations of EA in the organic phase, resulting in a reduced reflux on the azeotropic column as well as the reduced flowrate of the water phase directed to the wastewater treatment plant.
Strategy 2 (S2): The classic approach with product (Stream 16, Figure 1) and wastewater quality (Stream 25, Figure 1) maintained at a level comparable to case 1, resulting in the increased heat duties applied by the reactor (KREA 4, Figure 1) as well as rectification columns (SCDS 11, 15, Figure 1).
Strategy 3 (S3): The classic approach with the product and wastewater quality, resulting from the heat duties by rectification columns (SCDS 11, 15, Figure 1) equivalent to case 1, and the increased recycle of the azeotrope (Stream 27, Figure 1). The heat duty of the reactor (KREA 4, Figure 1) is increased to maintain the conversion rate.
2.1. Thermodynamic Model
Numerous data sets regarding liquid–liquid and liquid–vapor equilibria for the ethyl acetate–ethanol–acetic acid–water systems, are reported in the literature [30,31,32,33,34,35]. This quaternary system exhibits non-ideal behavior with formation of azeotropes and with the possibility of formation of two liquid phases. Calvar studied the liquid–vapor equilibria for a system at atmospheric pressure [30]. He received a very good approximation of the experimental data, using the UNIQUAC thermodynamic model. Arce, in his work [31] studied the liquid–liquid equilibria. He also acheived the best fit using the UNIQUAC model. Therefore, for the modeling of either liquid–vapor or liquid–liquid equilibria, the UNIQUAC model is used in the modelling exercise.
2.2. Kinetics of Esterification Reaction
The kinetics of the esterification reaction is also a subject of numerous studies [36,37,38,39]. Atalay [36] determined the activation energies and coefficients of the classic Arrhenius equation in the reaction of acetic acid esterification with ethanol, where sulfuric acid (VI) was used as a homogenous catalyst. He also studied the effect of catalyst concentration, temperature and the ratio of substrate concentrations on the reaction kinetics.
According to Atalay, the best fit of the experimental data is offered by the reaction rate described with the following equation:
where:
rA = k1CK0.5CA0.5 − k2CWCE,
k1 = 2.145exp(−13,494/(RT)) [1/min]
k2 = 0.0545 exp(−9314/(RT)) [1/min]
3. Results
3.1. Optimization of the Reaction System
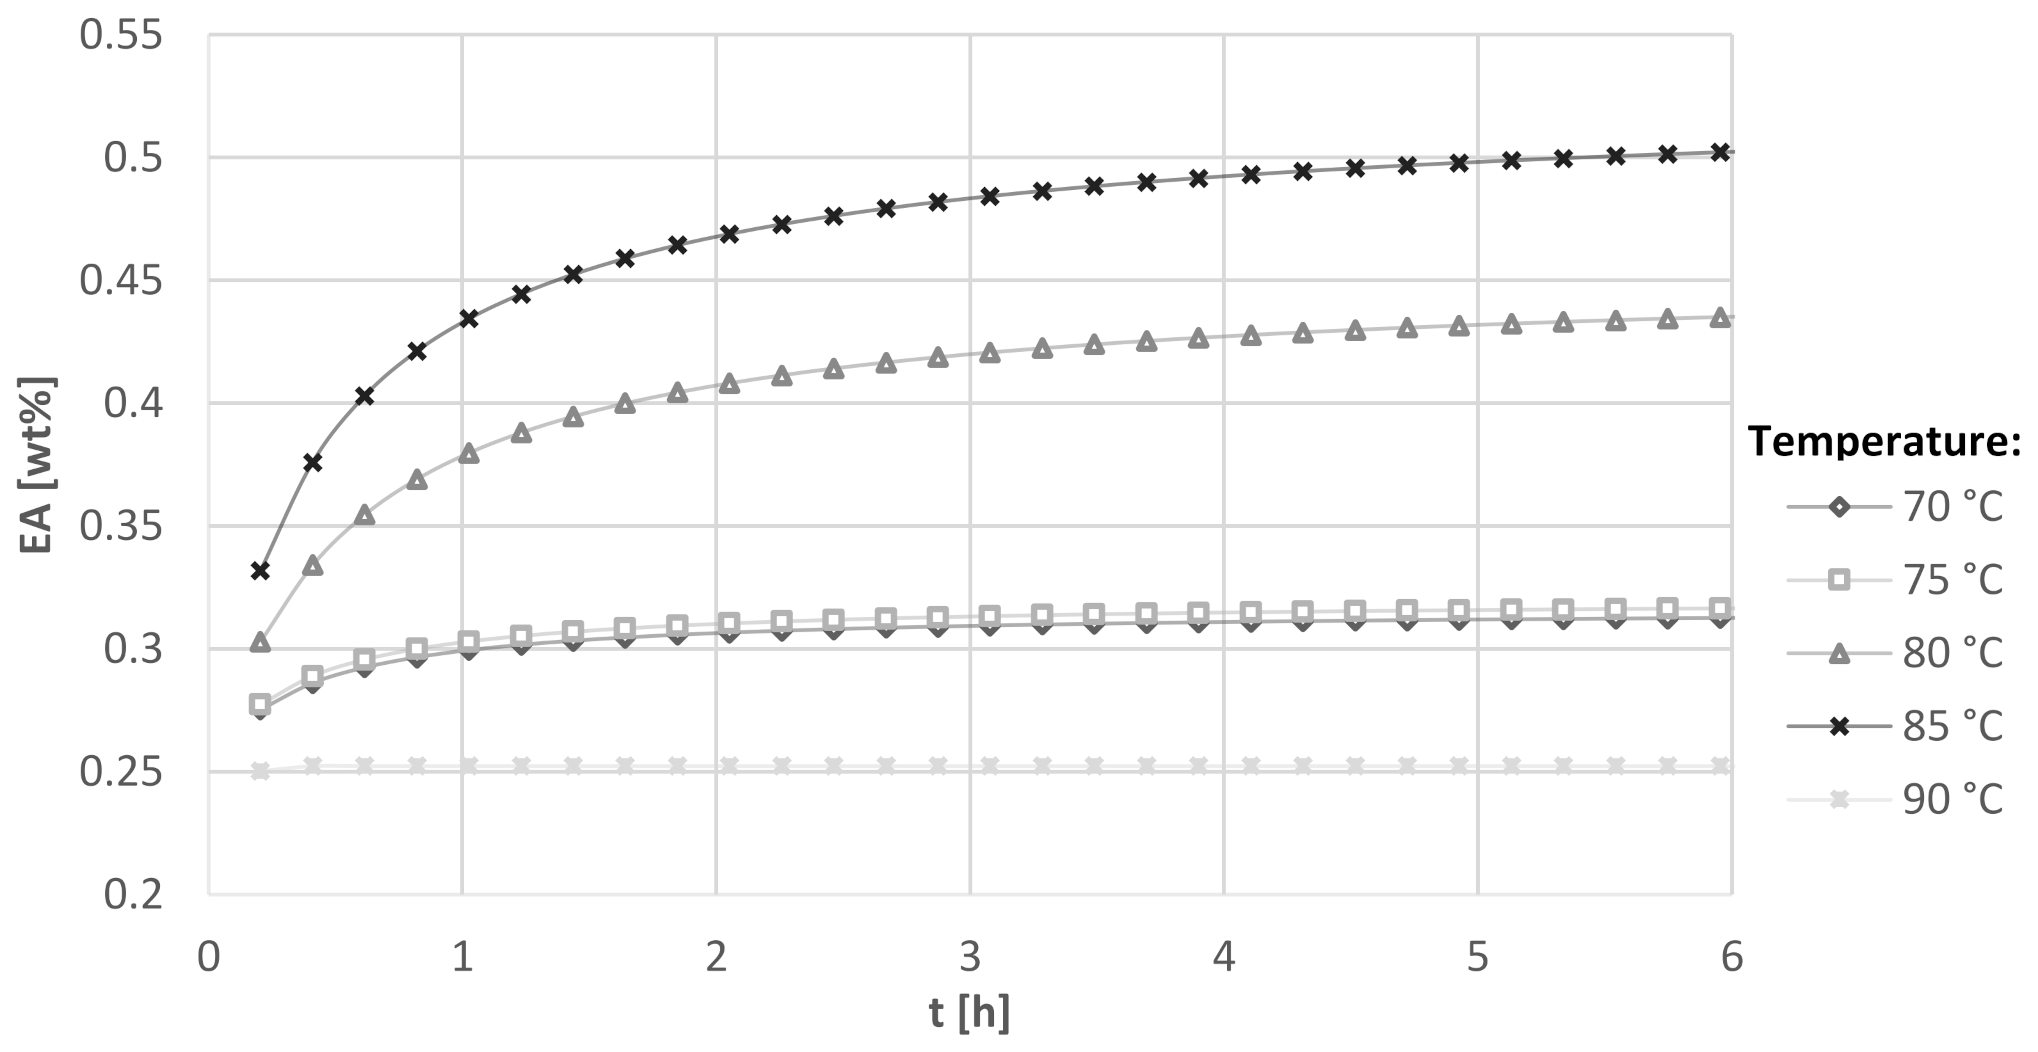
The continuous stirred tank reactor CSTR was used to model the reaction system (KREA 4, Figure 1). The key parameters affecting the degree of conversion are the temperature and the residence time of the reaction mixture in the reactor. The influence of these parameters on the composition of the post-reaction mixture was examined using the sensitivity analysis tool. The analysis assumed a constant composition of the reactor input stream. The results of the analysis are shown in Figure 2.
The results obtained by simulation prove that the temperature increase in the reactor positively affects the EA content in the output stream, but only up to a certain point. The highest degree of reagent conversion was obtained at 85 °C. Above 85 °C, the EA content drops significantly. This is due to the increased and excessive evaporation of ethanol from the reaction system, which shifts the equilibrium of the reaction towards the substrates. Apparently, the optimum residence time at elevated temperatures should be kept in the range of 3–4 h.
3.2. Optimization of Azeotropic Distillation
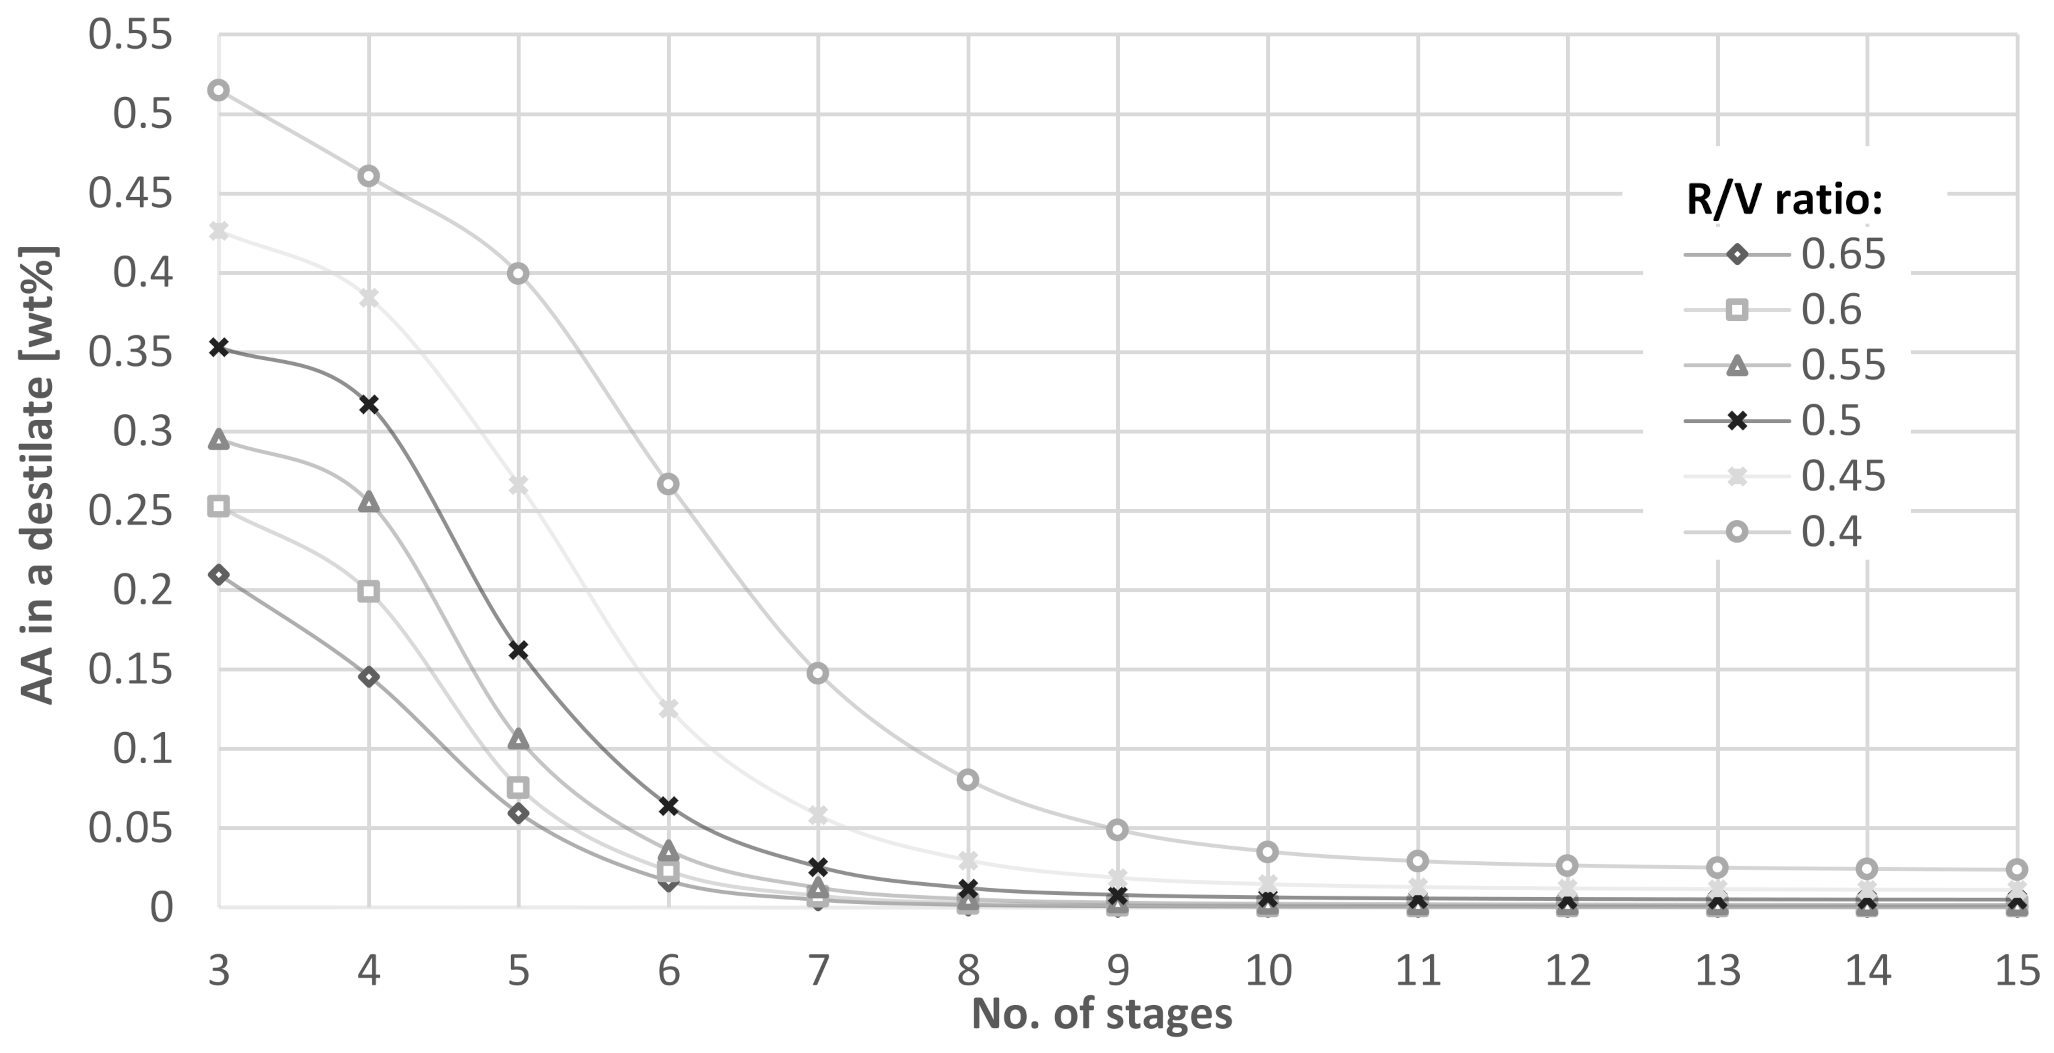
The azeotropic column (SCDS 5, Figure 1) is used to strip acetic acid from the reactor vapors and for distillation of the EA–ET–W triple azeotrope. The reactor vapors are fed to the last stage of the column, while the reflux (Stream 27, Figure 1)—a distillate washed with water—is fed onto the first stage. The obtained distillate is an azeotrope—with a mass composition of 83.1% ethyl acetate, 8.7% ethanol, 8.2% water—which is directed to the water extraction process. The bottom product from the column (Stream 7, Figure 1) containing the stripped acetic acid is recycled to the reaction node.
Azeotropic distillation is limited by the amount of acetic acid in the distillate. The product of appropriate quality should not contain more than 0.005 wt%. To assure the required contents of AA in the distillate, both reflux ratio (R/V) and the number of stages were adjusted. The results are shown in Figure 3.
The acetic acid content strongly depends on the amount of the reflux applied to the column. The required acidity (<0.005 wt% of acetic acid) can be obtained with an R/V ratio greater than 0.5 and with a minimum number of 14 theoretical stages.
3.3. Optimization of the Extraction System
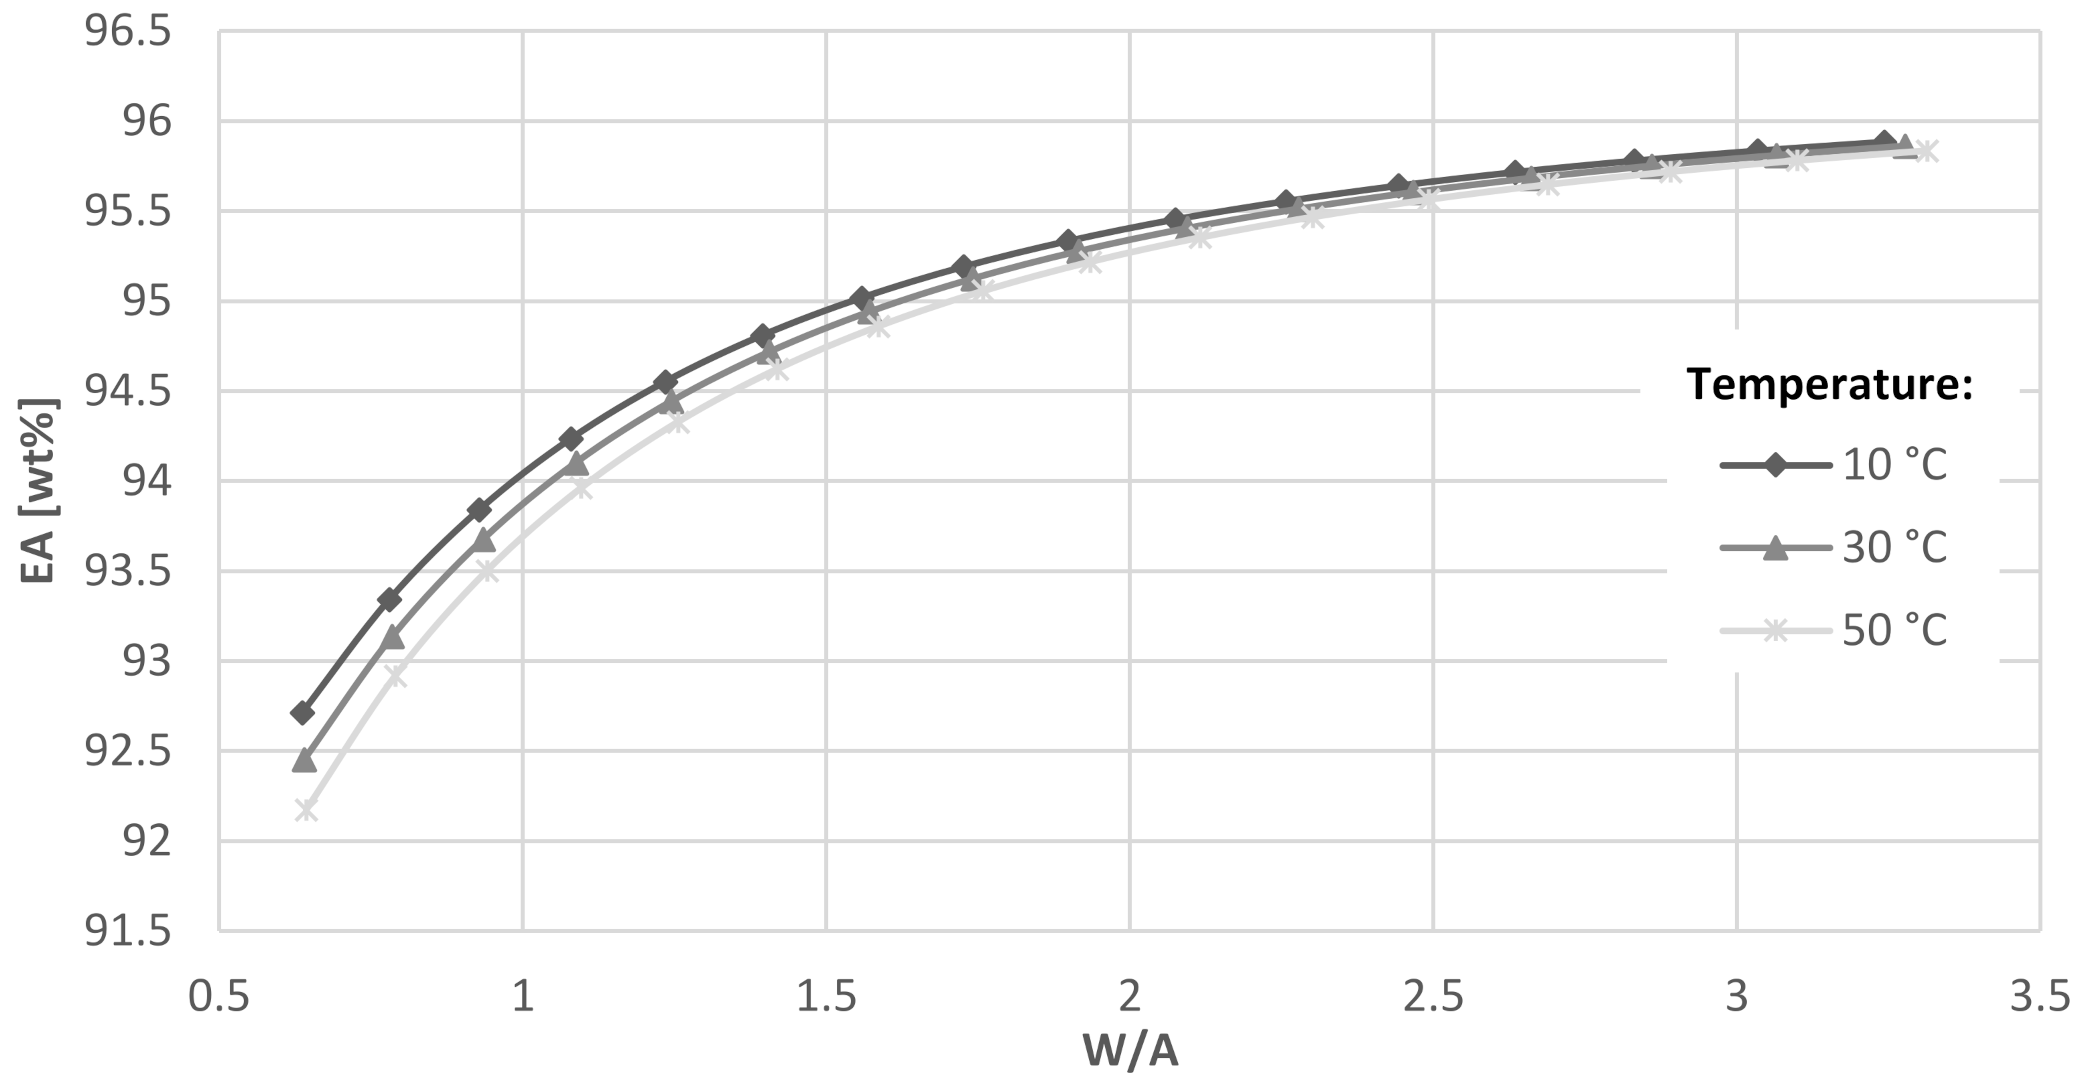
The extraction node (EXTR 8, Figure 1) is found to be one of the most important installation nodes with regard to the overall process performance. Analysis was focused on the temperature of the azeotrope stream as well as the mass ratio of water:azeotrope (W/A), both affecting the composition of the organic phase (richer in ethyl acetate) and losses of the EA with wastewater. The results are shown in Figure 4.
It was observed that lowering the temperature has a positive effect on the content of ethyl acetate in the organic phase. A temperature drop of every 10 °C increases the weight fraction of ethyl acetate in the organic phase by about 0.15%. Lowering the temperature from 50 °C to 20 °C increases the EA content by approximately 0.45%. This relatively small change has a significant impact on the amount of reflux recycled to the azeotropic column as well as on the amount of azeotrope recycled from the product distillation column. It is therefore profitable to deeply cool down the azeotrope before extraction. Yet, due to the fact that the process is limited by the cooling water temperature, the azeotrope can be cooled down to 20–30 °C.
The content of ethyl acetate in the organic phase increases with an increased amount of water during rinsing. However, by increasing the water flowrate, the ethyl acetate losses are bigger. The losses of EA also increase with the temperature. Furthermore, the increased flowrate of the rinsing water causes an excessive amount of wastewater to be produced, and by this, the cost of raw material recovery by wastewater distillation increases. Analyzing the modelling results, it can be concluded that the optimum mass ratio of water to azeotrope is in the range between 1 and 2.
3.4. Optimization of Product Distillation
Organic-phase, enriched ethyl acetate is fed to the rectification column (SCDS 11, Figure 1). The purification of ethyl acetate involves distilling off the triple azeotrope consisting of water, ethanol and ethyl acetate. The distillate is recycled to the extraction process. The bottom product is ethyl acetate with required purity greater than 99.9%.
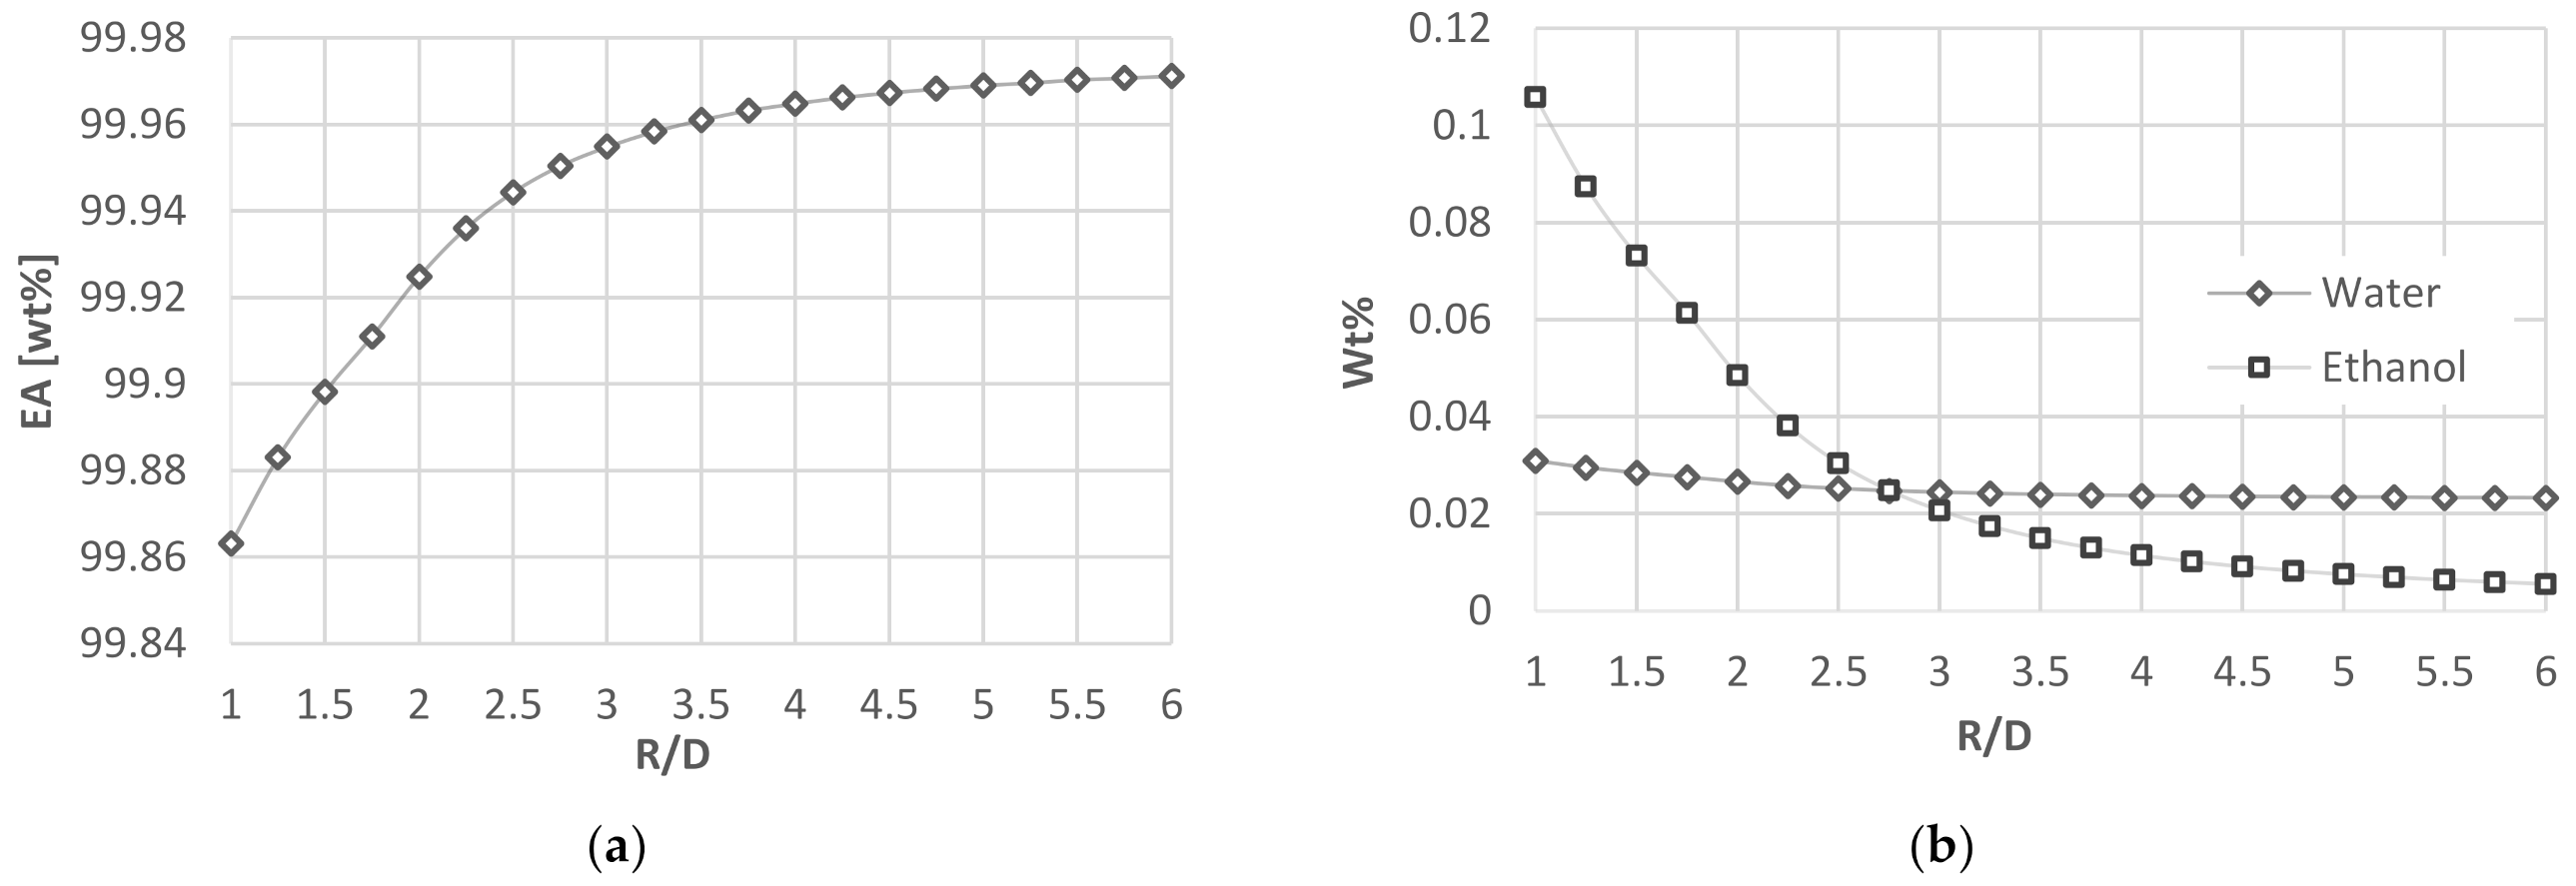
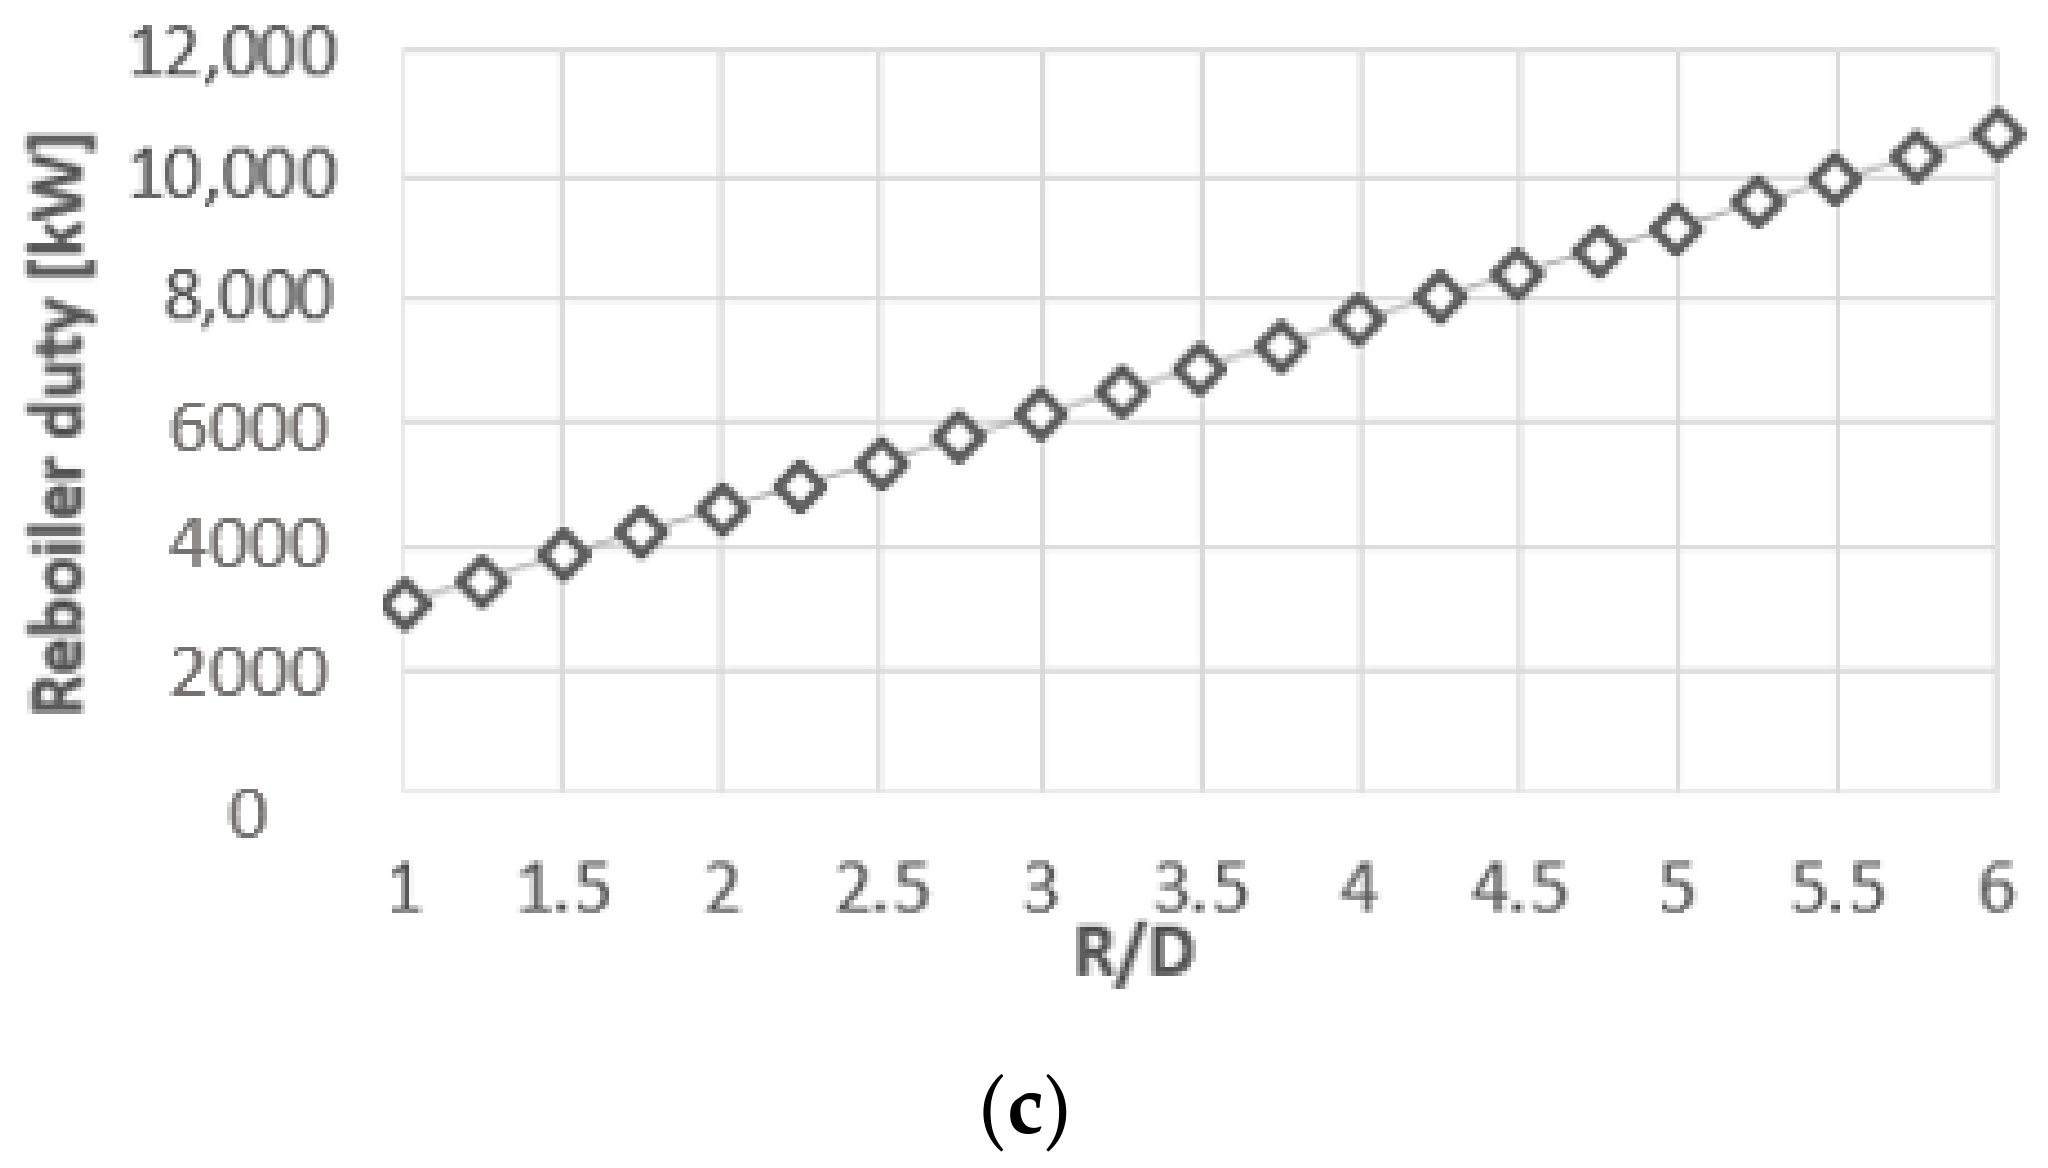
First, the effect of the reflux ratio (R/D) on the composition of the bottom product as well as reboiler duty were examined at a set, rigid product rate. The results are presented in Figure 5. Next, at a set reflux ratio, the influence of the feed stage location and the number of stages on the product quality as well as evaporator/reboiler heat duty were analyzed (Figure 6).
The amount of reflux has an obvious key impact on the product quality. By increasing the reflux, the purity of the product increases significantly. The required EA content in the product (99.9 wt%) can be obtained for minimum R/D equal to 1.5. The limit parameter in this case is also the water content, which should be less than 0.03 wt% and an ethanol content that should be less than 0.04 wt%. These parameters are met for R/D greater than 2.25. The optimum R/D ratio is in the range 3–3.5. A higher reflux does provide an insignificant increase in the product yield, while heat duties on both the evaporator and the condenser increase proportionally.
The product quality is also influenced by both the EA feed location and the number of column stages. As presented in Figure 6, the number of stages has a significant impact on the product purity. However, the feed location is also crucial. The best results were obtained when the feed was located between the 6th and 4th column stage. The introduction to the higher or lower stages of the column resulted in a deterioration of the product quality.
3.5. Optimization of Wastewater Distillation
From an ecological and economic point of view, the quality and the quantity of the sewage produced is also of great interest. The aqueous phase after extraction contains a large share of ethanol and ethyl acetate (over 15 wt%). Therefore, it is directed to a sewage column, where the organics are separated from the water. Sewage processing is meant to reduce the loss of raw materials, fresh water consumption and improve wastewater quality.
A mixture of ethyl acetate, ethanol and a small amount of water is collected as a distillate in the column. This stream is recycled to the reactor. Water is obtained as the bottom product, which is partly recycled to the extraction process. Only a small amount of cleaned wastewater is released as sewage.
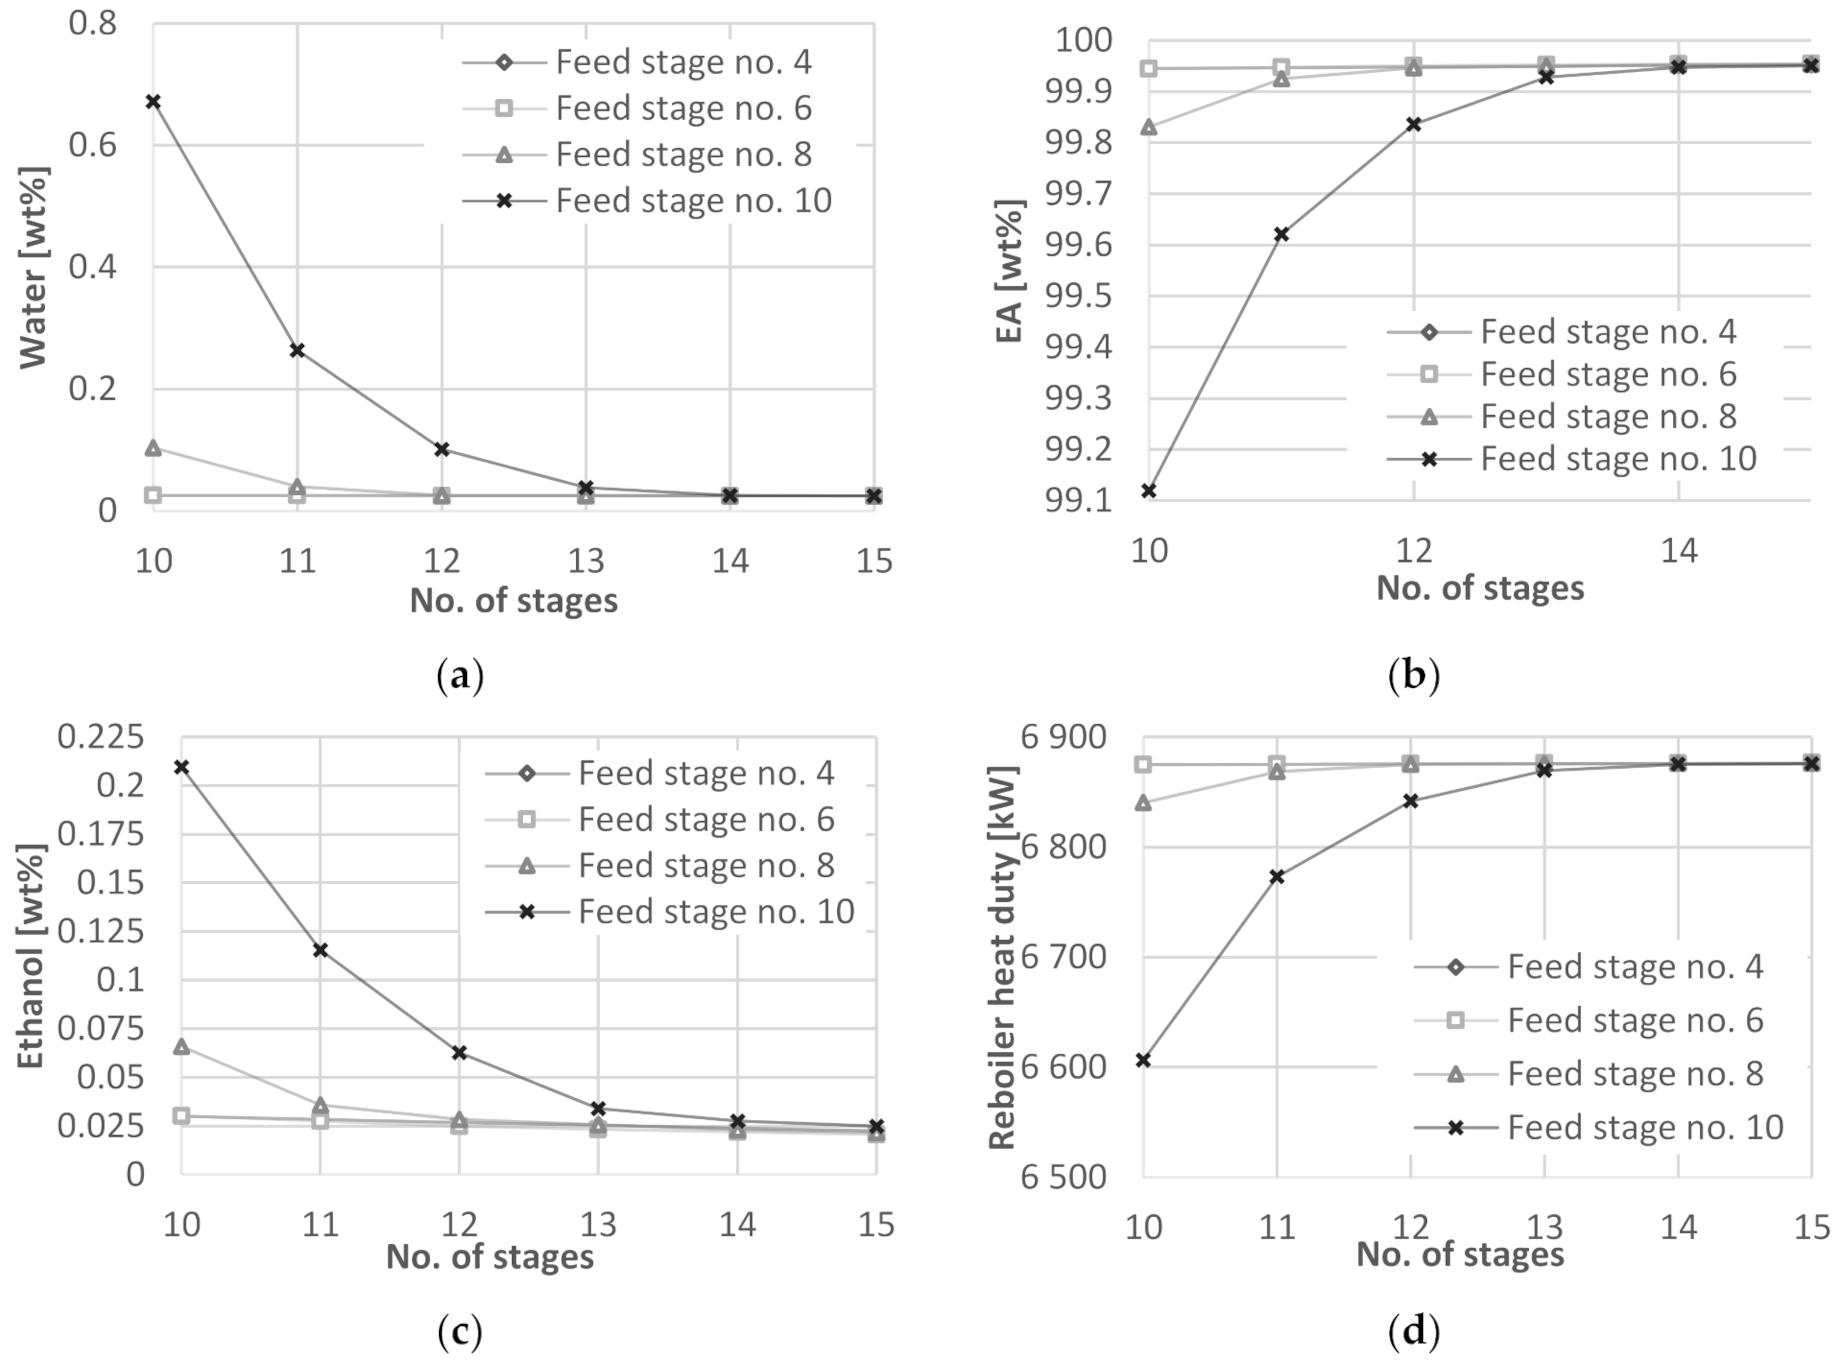
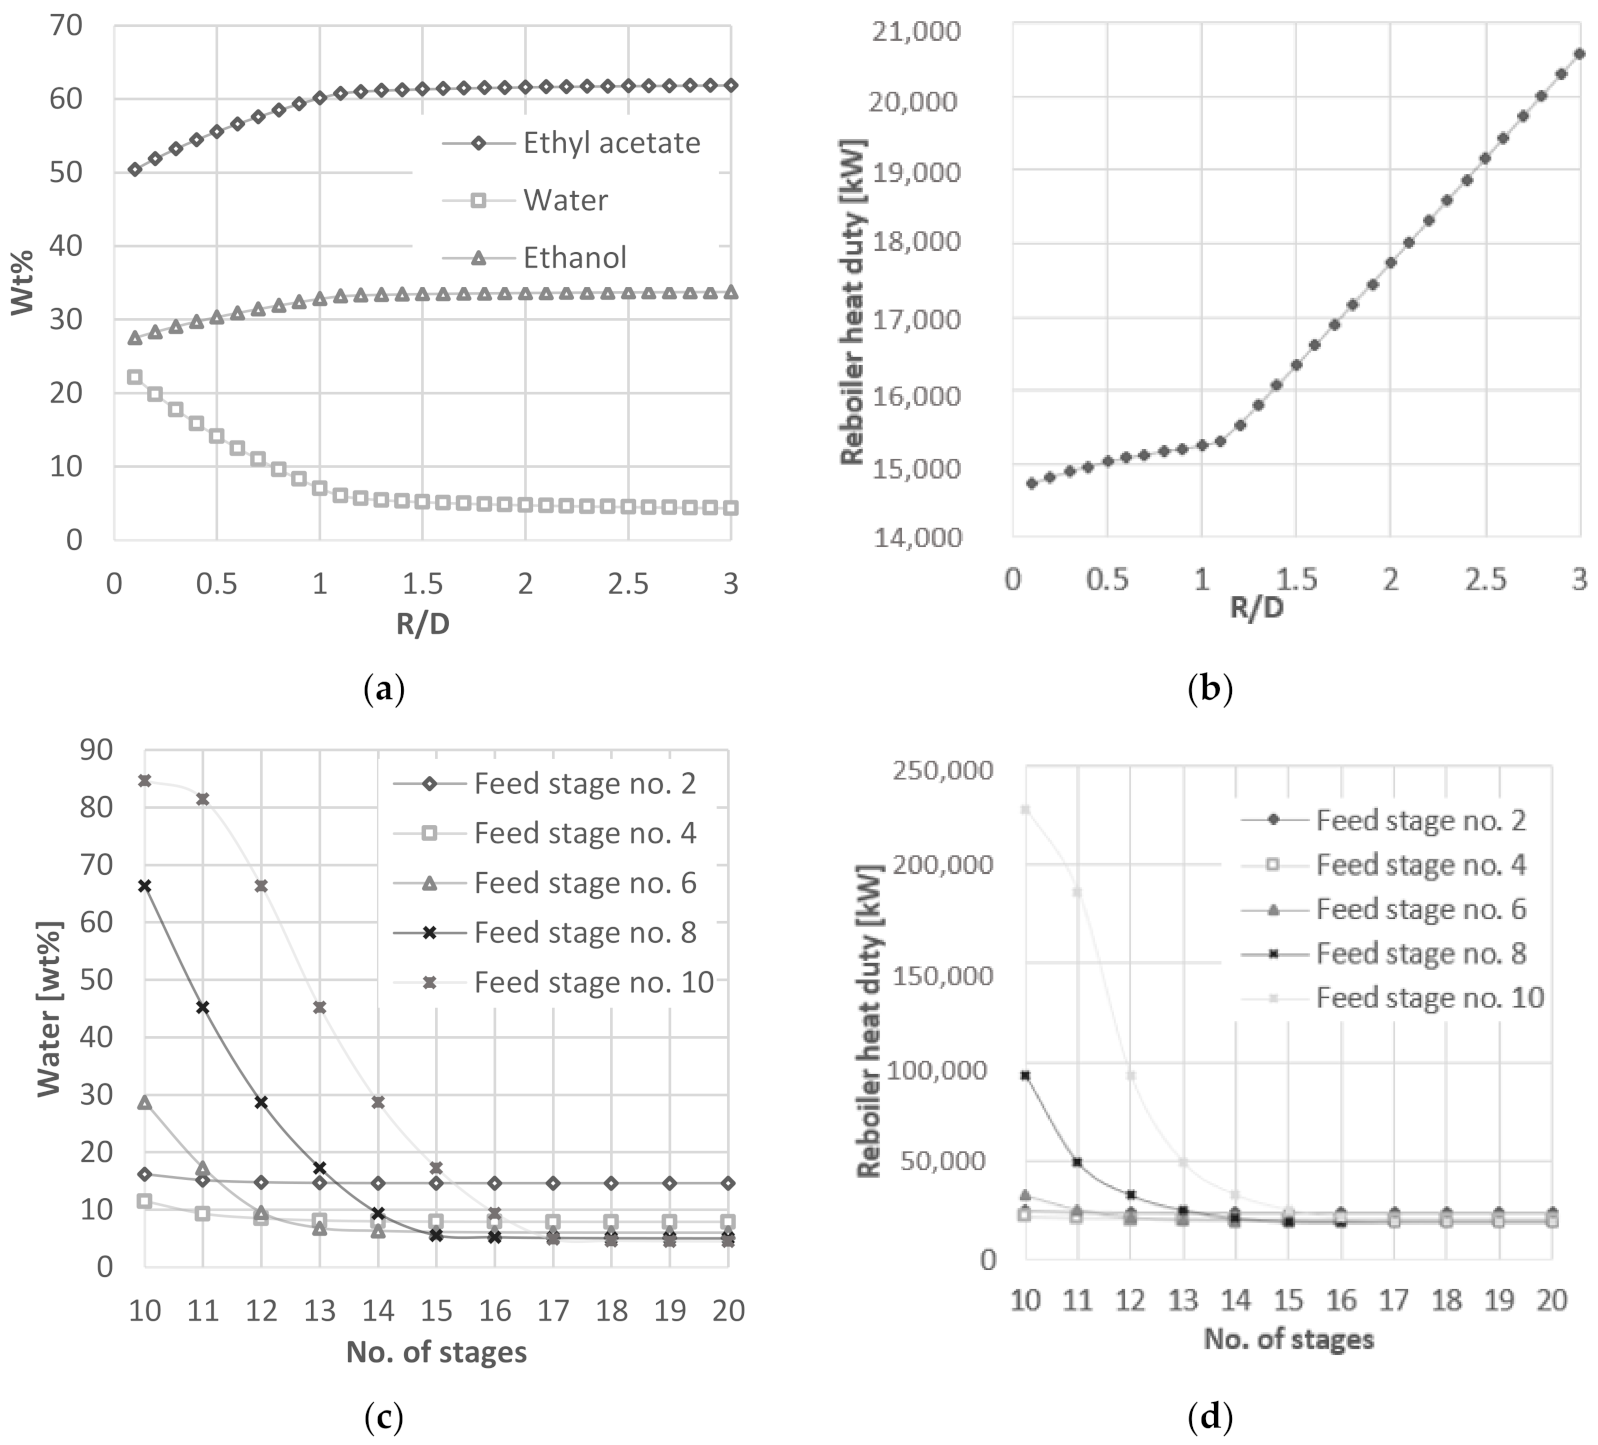
By modeling the wastewater distillation column (SCDS 15, Figure 1), the effect of reflux ratio on the distillate composition and the bottom product, wastewater was examined. It was assumed that the bottom product must contain less than 0.01% of its weight in organic compounds. The influence of the reflux ratio on heat duty of the reboiler was also analyzed. The results are shown in Figure 7a,b.
The distillate from the column is recycled to the reactor (Stream 21, Figure 1), so its composition affects the reaction equilibrium. The more water we returned with the stream, the more reflux we need on the azeotropic column. It is therefore important to keep the water concentration as low as possible. Due to the fact that the three-component EA–ET–W system creates the azeotrope with the lowest boiling point, we are not able to remove water completely.
The amount of reflux is crucial to the composition of the distillate. By increasing the amount of reflux, the content of EA and ethanol in the distillate increases, and the water content decreases. With an increase in reflux (R/D) in the range from 0.1–1.5, you can see a very large decrease in the water content in the distillate. With an R/D ratio greater than 1.5, no major changes can be seen.
The effect of the feed location and the number of stages on the composition of distillate and the bottom product as well as reboiler heat duty were examined at a set reflux ratio 1.5 (Figure 7c,d).
The number of stages and the feed location affect the composition of the distillate and the heat duty of the evaporator. Analyzing the graphs in Figure 7c,d, it was found that the column must have reached at least seven stages in the stripping section and seven in the reinforcing section.
3.6. Mass and Heat Balance of the Different Process Aproaches
A specification of apparatus operating parameters for every analyzed case is provided in Table 1. The results of simulation, i.e., specification of the process streams for all the three different cases are presented in Appendix A, Table A1, Table A2 and Table A3.
4. Discussion
Based on the mass and heat balances of the installation, the consumption of raw materials and energy for three different strategies were calculated. The results are shown in Table 2.
The sensitivity study carried out by separate nodes as well as modelling of the three listed complete process strategies led to the following observations. The influence of subcooling the azeotrope (Stream 7, Figure 1) down to 30 °C results in an increased requirement for cold by the condenser (HTXR 6, Figure 1). However, the advantage is a higher contents of EA in the organic phase, after extraction (Stream 11, Figure 1), which is the result of an enhanced removal of ethanol and water from azeotrope. The latter results in a lower reflux requirement in the azeotropic column (SCDS 5, Figure 1), which then leads to a lowered heat duty of the reactor evaporator.
The increased concentration of EA in the organic phase after extraction (Stream 11, Figure 1) also results in a lowered heat duty by the product distillation column (SCDS 11, Figure 1) as the amount of water and ethanol to be removed has been lowered.
Subcooling also lowers the contents of EA in the water phase, and as a consequence lower heat duty by wastewater distillation (SCDS 15, Figure 1).
The lowered heat duty by these nodes results in a lower consumption of cooling water, compensating with excess its higher requirement for stream eight subcooling by HTXR 6 (Figure 1). Thus the overall consumption of cooling energy is lower by kW/tproduct.
Thus shifting the phase equilibria by extraction leads to a process integration. The product quality as well as the loss of EA with wastewater can be maintained without stream 8 subcooling, only if the consumption of utilities is increased.
If the consumption of utilities was kept low—comparable to the proposed strategy, then the product quality would be degraded from 99.9% down to 98.0% EA contents. Consumption of fresh water would be increased from 1.42 to 2.18 t/tproduct. Due to this, a wastewater amount would increase from 1.61 to 2.36 t/tproduct and the organic contents would rise from 0.04% up to 0.21%. This would lead to an increased consumption of raw ethanol, from 0.524 to 0.531 t/tproduct as it is excessively lost with wastewater.
5. Conclusions
The improved strategy (S1), based on shifting the extraction equilibria, leads to the process integration which offers a significant improvement of economic indicators when compared to the classic approach (S2). Both the consumption of steam and cooling water are reduced by over 10% each, while the requirements on either the product quality or environmental protection are fulfilled. Comparing the enhanced strategy (S1) with the classical approach, assuming the same energy consumption (S3):
- ethanol consumption was reduced from 0.531 to 0.524 t/tproduct (−1.2%);
- the amount of process water was reduced from 2.18 to 1.42 t/tproduct (−34.9%);
- the product quality was improved from 98.0% to 99.9%;
- wastewater production was reduced from 2.36 to 1.61 t/tproduct (−31.8%) and the TOC/COD was reduced almost nine times.
Author Contributions
Conceptualization, W.P. and R.K.; methodology, W.P.; formal analysis, R.K.; investigation, W.P.; resources, W.P.; data curation, R.K.; writing—original draft preparation, W.P.; writing—review and editing, W.P. and R.K.; visualization, W.P.; supervision, R.K. Both authors have read and agreed to the published version of the manuscript.
Funding
This research received no external funding.
Institutional Review Board Statement
Not applicable.
Informed Consent Statement
Not applicable.
Data Availability Statement
Data is contained within the article.
Conflicts of Interest
The authors declare no conflict of interest.
Appendix A

Table A1.
Mass balance of the improved installation to produce EA, strategy 1 (S1).
| Stream No. | Molar Flow kmol/h | Mass Flow kg/h | Temp. °C | Pres. Bar | Component Mass % | |||
|---|---|---|---|---|---|---|---|---|
| Ethanol | Water | Ethyl Acetate | Acetic Acid | |||||
| 1 | 141.3 | 6511 | 15 | 1 | 100.00 | 0.00 | 0.00 | 0.00 |
| 2 | 141.1 | 8472 | 15 | 1 | 0.00 | 0.00 | 0.00 | 100.00 |
| 3 | 282.4 | 14,983 | 15 | 1 | 43.46 | 0.00 | 0.00 | 56.54 |
| 4 | 282.4 | 14,983 | 70 | 1 | 43.46 | 0.00 | 0.00 | 56.54 |
| 5 | 1223.3 | 47,670 | 77 | 1 | 28.65 | 22.96 | 25.67 | 22.72 |
| 6 | 1223.3 | 47,670 | 90 | 1 | 15.02 | 28.29 | 51.74 | 4.96 |
| 7 | 611.2 | 13,504 | 88 | 1 | 5.60 | 73.38 | 3.57 | 17.45 |
| 8 | 1354.8 | 90,166 | 71 | 1 | 8.00 | 6.45 | 85.54 | 0.01 |
| 9 | 1354.8 | 90,166 | 30 | 1 | 8.00 | 6.45 | 85.54 | 0.01 |
| 10 | 1520.4 | 100,880 | 30 | 1 | 7.48 | 6.67 | 85.84 | 0.01 |
| 11 | 1049.7 | 79,150 | 21 | 1 | 1.45 | 3.99 | 94.55 | 0.01 |
| 12 | 307.0 | 23,151 | 21 | 1 | 1.45 | 3.99 | 94.55 | 0.01 |
| 13 | 307.0 | 23,151 | 71 | 1 | 1.45 | 3.99 | 94.55 | 0.01 |
| 14 | 165.6 | 10,715 | 70 | 1 | 3.09 | 8.57 | 88.34 | 0.00 |
| 15 | 165.6 | 10,715 | 30 | 1 | 3.09 | 8.57 | 88.34 | 0.00 |
| 16 | 141.4 | 12,436 | 77 | 1 | 0.04 | 0.04 | 99.90 | 0.02 |
| 17 | 969.4 | 17,464 | 20 | 1 | 0.00 | 100.00 | 0.00 | 0.00 |
| 18 | 5600.9 | 100,920 | 20 | 1 | 0.02 | 99.97 | 0.00 | 0.01 |
| 19 | 5600.9 | 100,920 | 20 | 1 | 0.02 | 99.97 | 0.00 | 0.01 |
| 20 | 6071.6 | 122,650 | 24 | 1 | 5.23 | 85.17 | 9.59 | 0.01 |
| 21 | 329.8 | 19,187 | 71 | 1 | 33.32 | 5.41 | 61.28 | 0.00 |
| 22 | 5741.4 | 103,456 | 100 | 1 | 0.02 | 99.96 | 0.00 | 0.02 |
| 23 | 4631.5 | 83,456 | 100 | 1 | 0.02 | 99.96 | 0.00 | 0.02 |
| 24 | 4631.5 | 83,456 | 20 | 1 | 0.02 | 99.96 | 0.00 | 0.02 |
| 25 | 1109.9 | 20,000 | 100 | 1 | 0.02 | 99.96 | 0.00 | 0.02 |
| 26 | 742.7 | 56,000 | 21 | 1 | 1.45 | 3.99 | 94.55 | 0.01 |
| 27 | 742.7 | 56,000 | 70 | 1 | 1.45 | 3.99 | 94.55 | 0.01 |
| 28 | 6071.2 | 122,643 | 70 | 1 | 5.23 | 85.17 | 9.59 | 0.01 |
Table A2.
Mass balance of the typical installation to produce EA, strategy 2 (S2).
| Stream No. | Molar Flow kmol/h | Mass Flow kg/h | Temp. °C | Pres. Bar | Component Mass % | |||
|---|---|---|---|---|---|---|---|---|
| Ethanol | Water | Ethyl Acetate | Acetic Acid | |||||
| 1 | 141.3 | 6511 | 15 | 1 | 100.00 | 0.00 | 0.00 | 0.00 |
| 2 | 141.1 | 8472 | 15 | 1 | 0.00 | 0.00 | 0.00 | 100.00 |
| 3 | 282.4 | 14,983 | 15 | 1 | 43.46 | 0.00 | 0.00 | 56.54 |
| 4 | 282.4 | 14,983 | 70 | 1 | 43.46 | 0.00 | 0.00 | 56.54 |
| 5 | 1352.7 | 53,292 | 77 | 1 | 27.49 | 22.86 | 29.02 | 20.64 |
| 6 | 1352.7 | 53,292 | 90 | 1 | 15.29 | 27.62 | 52.34 | 4.74 |
| 7 | 676.0 | 14,912 | 88 | 1 | 5.86 | 73.55 | 3.67 | 16.93 |
| 8 | 1493.9 | 98,380 | 70 | 1 | 8.53 | 6.68 | 84.78 | 0.01 |
| 9 | 1493.9 | 98,380 | 70 | 1 | 8.53 | 6.68 | 84.78 | 0.01 |
| 10 | 1724.2 | 113,256 | 70 | 1 | 7.86 | 6.93 | 85.21 | 0.01 |
| 11 | 1189.1 | 87,314 | 27 | 1 | 1.86 | 4.70 | 93.43 | 0.01 |
| 12 | 372.0 | 27,314 | 27 | 1 | 1.86 | 4.70 | 93.43 | 0.01 |
| 13 | 372.0 | 27,314 | 71 | 1 | 1.86 | 4.70 | 93.43 | 0.01 |
| 14 | 230.4 | 14,880 | 70 | 1 | 3.40 | 8.57 | 88.03 | 0.00 |
| 15 | 230.4 | 14,880 | 70 | 1 | 3.40 | 8.57 | 88.03 | 0.00 |
| 16 | 141.5 | 12,434 | 77 | 1 | 0.02 | 0.07 | 99.90 | 0.01 |
| 17 | 970.2 | 17,478 | 20 | 1 | 0.00 | 100.00 | 0.00 | 0.00 |
| 18 | 6286.9 | 113,276 | 20 | 1 | 0.01 | 99.98 | 0.00 | 0.01 |
| 19 | 6286.9 | 113,276 | 20 | 1 | 0.01 | 99.98 | 0.00 | 0.01 |
| 20 | 6821.3 | 139,203 | 41 | 1 | 5.24 | 84.04 | 10.72 | 0.01 |
| 21 | 394.6 | 23,405 | 71 | 1 | 31.06 | 5.19 | 63.75 | 0.00 |
| 22 | 6426.7 | 115,797 | 100 | 1 | 0.02 | 99.97 | 0.00 | 0.01 |
| 23 | 5316.7 | 95,797 | 100 | 1 | 0.02 | 99.97 | 0.00 | 0.01 |
| 24 | 5316.7 | 95,797 | 20 | 1 | 0.02 | 99.97 | 0.00 | 0.01 |
| 25 | 1110.0 | 20,000 | 100 | 1 | 0.02 | 99.97 | 0.00 | 0.01 |
| 26 | 817.1 | 60,000 | 27 | 1 | 1.86 | 4.70 | 93.43 | 0.01 |
| 27 | 817.1 | 60,000 | 70 | 1 | 1.86 | 4.70 | 93.43 | 0.01 |
| 28 | 6821.3 | 139,203 | 70 | 1 | 5.24 | 84.04 | 10.72 | 0.01 |
Table A3.
Mass balance of the typical installation to produce EA, strategy 3 (S3).
| Stream No. | Molar Flow kmol/h | Mass Flow kg/h | Temp. °C | Pres. Bar | Component Mass % | |||
|---|---|---|---|---|---|---|---|---|
| Ethanol | Water | Ethyl Acetate | Acetic Acid | |||||
| 1 | 143.2 | 6595 | 15 | 1 | 100.00 | 0.00 | 0.00 | 0.00 |
| 2 | 141.1 | 8472 | 15 | 1 | 0.00 | 0.00 | 0.00 | 100.00 |
| 3 | 284.2 | 15,068 | 15 | 1 | 43.77 | 0.00 | 0.00 | 56.23 |
| 4 | 284.2 | 15,068 | 70 | 1 | 43.77 | 0.00 | 0.00 | 56.23 |
| 5 | 1296.7 | 51,047 | 77 | 1 | 25.04 | 23.01 | 27.46 | 24.49 |
| 6 | 1296.7 | 51,047 | 90 | 1 | 12.31 | 27.99 | 51.82 | 7.89 |
| 7 | 694.0 | 16,516 | 88 | 1 | 5.72 | 65.19 | 4.71 | 24.38 |
| 8 | 1424.1 | 94,531 | 71 | 1 | 6.84 | 6.81 | 86.35 | 0.00 |
| 9 | 1424.1 | 94,531 | 70 | 1 | 6.84 | 6.81 | 86.35 | 0.00 |
| 10 | 1590.0 | 105,218 | 70 | 1 | 6.53 | 6.99 | 86.48 | 0.00 |
| 11 | 1141.4 | 83,373 | 27 | 1 | 1.88 | 4.86 | 93.26 | 0.00 |
| 12 | 320.0 | 23,373 | 27 | 1 | 1.88 | 4.86 | 93.26 | 0.00 |
| 13 | 320.0 | 23,373 | 71 | 1 | 1.88 | 4.86 | 93.26 | 0.00 |
| 14 | 165.9 | 10,687 | 70 | 1 | 3.80 | 8.57 | 87.64 | 0.00 |
| 15 | 165.9 | 10,687 | 70 | 1 | 3.80 | 8.57 | 87.64 | 0.00 |
| 16 | 154.1 | 12,686 | 73 | 1 | 0.26 | 1.74 | 98.00 | 0.00 |
| 17 | 1533.0 | 27,618 | 20 | 1 | 0.00 | 100.00 | 0.00 | 0.00 |
| 18 | 5834.7 | 105,212 | 20 | 1 | 0.15 | 99.84 | 0.00 | 0.00 |
| 19 | 5834.7 | 105,212 | 20 | 1 | 0.15 | 99.84 | 0.00 | 0.00 |
| 20 | 6283.1 | 127,055 | 41 | 1 | 4.30 | 85.27 | 10.42 | 0.00 |
| 21 | 318.4 | 19,460 | 71 | 1 | 26.94 | 5.02 | 68.03 | 0.00 |
| 22 | 5964.8 | 107,594 | 99 | 1 | 0.21 | 99.79 | 0.00 | 0.00 |
| 23 | 4301.6 | 77,594 | 99 | 1 | 0.21 | 99.79 | 0.00 | 0.00 |
| 24 | 4301.6 | 77,594 | 20 | 1 | 0.21 | 99.79 | 0.00 | 0.00 |
| 25 | 1663.1 | 30,000 | 99 | 1 | 0.21 | 99.79 | 0.00 | 0.00 |
| 26 | 821.4 | 60,000 | 27 | 1 | 1.88 | 4.86 | 93.26 | 0.00 |
| 27 | 821.4 | 60,000 | 70 | 1 | 1.88 | 4.86 | 93.26 | 0.00 |
| 28 | 6283.1 | 127,055 | 70 | 1 | 4.30 | 85.27 | 10.42 | 0.00 |
References
- Kerton, F.M.; Marriott, R. Alternative Solvents for Green Chemistry, 2nd ed.; RSC Publishing: Cambridge, UK, 2013. [Google Scholar] [CrossRef]
- López-Porfiri, P.; Gorgojo, P.; Gonzalez-Miquel, M. Green Solvent Selection Guide for Biobased Organic Acid Recovery. ACS Sustain. Chem. Eng. 2020, 8, 8958–8969. [Google Scholar] [CrossRef]
- Technavio. Global Green and Bio Solvents Market 2016–2020. Ind. Biotechnol. 2016, 12, 4. [Google Scholar]
- Directive 2010/75/EU of the European Parliament and of the Council. Available online: https://eur-lex.europa.eu/legal-content/EN/TXT/?uri=celex%3A32010L0075 (accessed on 20 July 2021).
- Inoue, K.; Iwasaki, M.; Matsui, K. Process for Producing Ethyl Acetate. U.S. Patent US5241106A, 19 October 1992. [Google Scholar]
- Dalena, F.; Basile, A.; Rossi, C. Bioenergy Systems for the Future: Prospects for Biofuels and Biohydrogen; Woodhead Publishing: Sawston, UK, 2017. [Google Scholar]
- Lilja, J.; Murzin, D.Y.; Salmi, T.; Aumo, J.; Mäki-Arvela, P.; Sundell, M. Esterification of different acids over heterogeneous and homogeneous catalysts and correlation with the Taft equation. J. Mol. Catal. A Chem. 2002, 182–183, 555–563. [Google Scholar] [CrossRef]
- Yadav, G.D.; Mehta, P.H. Heterogeneous Catalysis in Esterification Reactions: Preparation of Phenethyl Acetate and Cyclohexyl Acetate by Using a Variety of Solid Acidic Catalysts. Ind. Eng. Chem. Res. 1994, 33, 2198–2208. [Google Scholar] [CrossRef]
- Bai, Y.; Zeng, S.; Bai, L.; Gao, H.; Zhou, Z.; Zhang, X. Highly Efficient Dehydration of Ethyl Acetate using Strong Hy-drophilic Ionic Liquids. Ind. Eng. Chem. Res. 2020, 59, 16751–16761. [Google Scholar] [CrossRef]
- Oleksik, J.; Krasodomski, W. Zastosowanie cieczy jonowych i katalizatorów stałych w syntezie biokomponentów pali-wowych. Naft. Gaz 2015, 4, 256–265. [Google Scholar]
- He, R.; Zou, Y.; Dong, Y.; Muhammad, Y.; Subhan, S.; Tong, Z. Kinetic study and process simulation of esterification of acetic acid and ethanol catalyzed by [HSO3-bmim][HSO4]. Chem. Eng. Res. Des. 2018, 137, 235–245. [Google Scholar] [CrossRef]
- Wu, K.; Chen, Y.W. An efficient two-phase reaction of ethyl acetate production in modified ZSM-5 zeolites. Appl. Catal. 2003, 257, 33–42. [Google Scholar] [CrossRef]
- Park, J.R.; Kwak, B.K.; Park, D.S. Effect of acid type in WO X clusters on the esterification of ethanol with acetic acid. Korean J. Chem. Eng. 2012, 29, 1695–1699. [Google Scholar] [CrossRef]
- Wang, D.; Han, Z. Production Method of Ethyl Acetate by Means of Condensation of Acetaldehyde. CN. Patent CN1245794A, 21 August 1998. [Google Scholar]
- Seki, T.; Nakajo, T.; Onaka, M. The Tishchenko Reaction: A Classic and Practical Tool for Ester Synthesis. Chem. Lett. 2006, 35, 8. [Google Scholar] [CrossRef]
- A Feasibility Study Analysing Various Process Routes of the Production of Ethyl Acetate. Available online: https://ukdiss.com/examples/production-ethyl-acetate-routes.php?vref=1 (accessed on 20 July 2021).
- Crane Robert, A.; Brown Stephen, H. Ethyl Acetate Synthesis from Ethylene and Acetic Acid Using Solid Acid Catalysts. U.S. Patent US5973193, 26 October 1999. [Google Scholar]
- Gregory, R.; Smith, D.J.H.; Westlake, D.J. The production of ethyl acetate from ethylene and acetic acid using clay catalysts. Clay Miner. 1983, 18, 431–435. [Google Scholar] [CrossRef]
- Inui, K.; Kurabayashi, T.; Sato, S. Direct synthesis of ethyl acetate from ethanol over Cu-Zn-Zr-Al-O catalyst. Appl. Catal. A Gen. 2002, 237, 53–61. [Google Scholar] [CrossRef]
- Colley, S.W.; Fawcett, C.R.; Rathmell, C.; Tuck, M.W.M. Process for the Preparation of Ethyl. Acetate. Patent EP1117631B1, 25 July 2001. [Google Scholar]
- Kirk-Othmer. Esterification. In Kirk-Othmer Encyclopedia of Chemical Technology; John Wiley & Sons: Lansing, MI, USA, 2007; Volume 9, pp. 1–37. [Google Scholar]
- Toth, A.J. Comprehensive evaluation and comparison of advanced separation methods on the separation of ethyl ace-tate-ethanol-water highly non-ideal mixture. Sep. Purif. Technol. 2019, 224, 490–508. [Google Scholar] [CrossRef]
- Gil, I.D.; Gómez, J.M.; Rodríguez, G. Control of an extractive distillation process to dehydrate ethanol using glycerol as entrainer. Comput. Chem. Eng. 2012, 39, 129–142. [Google Scholar] [CrossRef]
- Zhigang, L.; Chengyue, L.; Biaohua, C. Extractive Distillation: A Review. Sep. Purif. Rev. 2003, 32, 121–213. [Google Scholar]
- Berg, L.; Ratanapupech, P. Separation of Ethyl Acetate from Ethanol and Water by Extractive Distillation. U.S. Patent US4379028, 30 March 1982. [Google Scholar]
- Zhang, X.H.; Liu, Q.L.; Xiong, Y.; Zhu, A.M.; Chen, Y.; Zhang, Q.G. Pervaporation dehydration of ethyl ace-tate/ethanol/water azeotrope using chitosan/poly (vinyl pyrrolidone) blend membranes. J. Membr. Sci. 2009, 327, 274–280. [Google Scholar] [CrossRef]
- Liu, Y.; Hu, T.; Zhao, J.; Lu, L.; Muhammad, Y.; Lan, P.; He, R.; Zou, Y.; Tong, Z. Synthesis and application of PDMS/OP-POSS membrane for the pervaporative recovery of n-butyl acetate and ethyl acetate from aqueous media. J. Membr. Sci. 2019, 591, 117324. [Google Scholar] [CrossRef]
- Penkova, A.; Polotskaya, G.; Toikka, A. Pervaporation composite membranes for ethyl acetate production. Chem. Eng. Process. Process. Intensif. 2015, 87, 81–87. [Google Scholar] [CrossRef]
- Horan, K.A.; Murphy, C.D.; Stephens, R.M.; Warner, R.J.; Windhorst, K.A. Process Improvement for Continuous Ethyl Acetate Production. U.S. Patent US6768021B2, 22 December 1999. [Google Scholar]
- Calvar, N.; Gonz’alez, B.; Dominguez, A. Esterification of acetic acid with ethanol: Reaction kinetics and operation in a packed bed reactive distillation column. Chem. Eng. Process. 2007, 46, 1317–1323. [Google Scholar] [CrossRef]
- Arce, A.; Alonso, L.; Vidal, I. Liquid-Liquid Equilibria of the Systems Ethyl Acetate + Ethanol + Water, Butyl Acetate + Ethanol + Water, and Ethyl Acetate + Butyl Acetate + Water. J. Chem. Eng. Jpn. 1999, 32, 440–444. [Google Scholar] [CrossRef]
- Griswold, J.; Chu, P.L.; Winsauer, W.O. Phase Equilibria in Ethyl Alcohol–Ethyl Acetate–Water System. Ind. Eng. Chem. 1949, 41, 2352–2358. [Google Scholar] [CrossRef]
- Trofimova, M.; Sadaev, A.; Samarov, A.; Golikova, A.; Tsvetov, N.; Toikka, M.; Toikka, A. Liquid-liquid equilibrium of acetic acid—Ethanol—Ethyl Acetate—Water quaternary system: Data review and new results at 323.15 K and 333.15 K. Fluid Phase Equilibria 2020, 503, 112321. [Google Scholar] [CrossRef]
- Kang, Y.W.; Lee, Y.Y.; Lee, W.K. Vapor-Liquid Equilibria with Chemical Reaction Equilibrium—Systems Containing Acetic Acid, Ethyl Alcohol, Water, and Ethyl Acetate. J. Chem. Eng. Jpn. 1992, 25, 649–655. [Google Scholar] [CrossRef] [Green Version]
- Trofimova, M.; Toikka, M.; Toikka, A. Solubility, liquid–liquid equilibrium and critical states for the quaternary system acetic acid–ethanol–ethyl acetate–water at 293.15 K. Fluid Phase Equilibria 2012, 313, 46–51. [Google Scholar] [CrossRef]
- Atalay, F.S. Kinetics of the Esterification Reaction Between Ethanol and Acetic Acid. Dev. Chem. Eng. Miner. Process. 2008, 2, 181–184. [Google Scholar] [CrossRef]
- Gursahani, K.I.; Alcalá, R.; Cortright, R.D.; Dumesic, J.A. Reaction kinetics measurements and analysis of reaction pathways for conversions of acetic acid, ethanol, and ethyl acetate over silica-supported Pt. Appl. Catal. 2001, 222, 369–392. [Google Scholar] [CrossRef]
- Bell, R.P.; Dowding, A.L.; Noble, J.A. The kinetics of ester hydrolysis in concentrated aqueous acids. J. Chem. Soc. 1955, 3106–3110. [Google Scholar] [CrossRef]
- Ahmed Zeki, N.S.; Al-Hassani Haider, M.H.; Al-Jendeel, A. Kinetic Study of Esterification Reaction. Al-Khwarizmi Eng. J. 2010, 6, 33–42. [Google Scholar]
Figure 1.
The scheme of the installation modeled in the Chemcad 7. (Stream numbers in rectangular frames, equipment in rounded frames.)
Figure 1.
The scheme of the installation modeled in the Chemcad 7. (Stream numbers in rectangular frames, equipment in rounded frames.)

Figure 2.
Influence of temperature and residence time on the conversion in the reactor.

Figure 3.
The influence of R/V ratio and the number of stages on the acetic acid content in distillate of the azeotropic column.
Figure 3.
The influence of R/V ratio and the number of stages on the acetic acid content in distillate of the azeotropic column.

Figure 4.
The influence of temperature and water/azeotrope ratio on the EA content in the organic phase.
Figure 4.
The influence of temperature and water/azeotrope ratio on the EA content in the organic phase.

Figure 5.
The effect of R/D ratio on (a) the EA content in the product; (b) the water and ethanol content in the product; (c) reboiler duty.
Figure 5.
The effect of R/D ratio on (a) the EA content in the product; (b) the water and ethanol content in the product; (c) reboiler duty.


Figure 6.
The impact of feed location and the number of stages on: (a) water content in the product; (b) EA content in the product; (c) ethanol content in the product; (d) evaporator power.
Figure 6.
The impact of feed location and the number of stages on: (a) water content in the product; (b) EA content in the product; (c) ethanol content in the product; (d) evaporator power.

Figure 7.
The influence of R/D ratio on: (a) the content of EA, water and ethanol in the distillate of the wastewater column; (b) reboiler duty. The influence of column feeding place and the number of stages on: (c) water content in distillate; (d) reboiler duty.
Figure 7.
The influence of R/D ratio on: (a) the content of EA, water and ethanol in the distillate of the wastewater column; (b) reboiler duty. The influence of column feeding place and the number of stages on: (c) water content in distillate; (d) reboiler duty.

Table 1.
A list of apparatus operating parameters for the improved approach and for the classic approach of the installation to produce EA (* R/V—reflux/vapor ratio).
Table 1.
A list of apparatus operating parameters for the improved approach and for the classic approach of the installation to produce EA (* R/V—reflux/vapor ratio).
| Rectification Columns | ||||||||||||
|---|---|---|---|---|---|---|---|---|---|---|---|---|
| Heat duty [kW] | R/D | No. of Stages | Feed Stage No. | |||||||||
| S1 | S2 | S3 | S1 | S2 | S3 | S1 | S2 | S3 | S1 | S2 | S3 | |
| Rectification column SCDS 5 | - | - | - | 0.62 * | 0.61 * | 0.64 * | 8 | 8 | 8 | 8 | 8 | 8 |
| Rectification column SCDS 11 | −6593 | −9180.3 | −6611.6 | 3 | 3 | 3 | 35 | 35 | 35 | 15 | 15 | 15 |
| 6629.8 | 9219.2 | 6629.8 | ||||||||||
| Rectification column SCDS 15 | −10,186.5 | −12,127.2 | 10,186.5 | 2 | 2 | 2 | 18 | 18 | 18 | 9 | 9 | 9 |
| 13,768.6 | 16,136.6 | 13,768.6 | ||||||||||
| Reactors | ||||||||||||
| Heat Duty [kW] | Process Temperature [°C] | Volume of Apparatus [m3] | ||||||||||
| S1 | S2 | S3 | S1 | S2 | S3 | S1 | S2 | S3 | ||||
| Reactor evaporator KREA 4 | 12,171.2 | 13,586.2 | 12,747.5 | 85–90 | 85–90 | 85–90 | 300 | 300 | 300 | |||
| Extractors | ||||||||||||
| Process Temperature [°C] | W/A | |||||||||||
| S1 | S2 | S3 | S1 | S2 | S3 | |||||||
| Extractor EXTR 8 | 30 | 70 | 70 | 1 | 1 | 1 | ||||||
| Heat Exchangers | ||||||||||||
| Heat Duty [kW] | ||||||||||||
| S1 | S2 | S3 | ||||||||||
| Heat exchanger HTXR 2 | 535.6 | 535.6 | 535.6 | |||||||||
| Heat exchanger HTXR 6 | −15,658.6 | −14,855.8 | −14,014.1 | |||||||||
| Heat exchanger HTXR 10 | 673.4 | 713.5 | 609 | |||||||||
| Heat exchanger HTXR 12 | −267.4 | 0 | 0 | |||||||||
| Heat exchanger HTXR 17 | −7726.1 | −8869.3 | −8108.6 | |||||||||
| Heat exchanger HTXR 18 | 6088 | 4332.9 | 3947.5 | |||||||||
| Heat exchanger HTXR 19 | 1595 | 1541.1 | 1562 | |||||||||
Table 2.
Comparison of process indicators for the improved and typical process strategy.
| Improved Strategy S1 | Classic Strategy S2 (Heat Duty > S1) | Classic Strategy S3 (Heat Duty = S1) | |
|---|---|---|---|
| Raw Materials | |||
| Ethanol t/tproduct | 0.524 | 0.524 | 0.531 |
| Acetic acid t/tproduct | 0.681 | 0.681 | 0.681 |
| Process water t/tproduct | 1.42 | 1.42 | 2.18 |
| Product | |||
| Product quality % | 99.9 | 99.9 | 98.0 |
| Energy | |||
| Total heating kW/tproduct | 3333.9 | 3704.7 | 3704.7 |
| Total cooling kW/tproduct | 3251.1 | 3621.9 | 3621.9 |
| Wastewater | |||
| Wastewater t/tproduct | 1.61 | 1.61 | 2.36 |
| TOC mg/L | 131.7 | 131.7 | 1099.7 |
| COD mgO2/L | 470.9 | 470.9 | 4388.4 |
Publisher’s Note: MDPI stays neutral with regard to jurisdictional claims in published maps and institutional affiliations. |
© 2021 by the authors. Licensee MDPI, Basel, Switzerland. This article is an open access article distributed under the terms and conditions of the Creative Commons Attribution (CC BY) license (https://creativecommons.org/licenses/by/4.0/).
Share and Cite
MDPI and ACS Style
Piotrowski, W.; Kubica, R. Integration of the Process for Production of Ethyl Acetate by an Enhanced Extraction Process. Processes 2021, 9, 1425. https://0-doi-org.brum.beds.ac.uk/10.3390/pr9081425
AMA Style
Piotrowski W, Kubica R. Integration of the Process for Production of Ethyl Acetate by an Enhanced Extraction Process. Processes. 2021; 9(8):1425. https://0-doi-org.brum.beds.ac.uk/10.3390/pr9081425
Chicago/Turabian StylePiotrowski, Wojciech, and Robert Kubica. 2021. "Integration of the Process for Production of Ethyl Acetate by an Enhanced Extraction Process" Processes 9, no. 8: 1425. https://0-doi-org.brum.beds.ac.uk/10.3390/pr9081425
Note that from the first issue of 2016, this journal uses article numbers instead of page numbers. See further details here.