Article

Study of Biocrudes Obtained via Hydrothermal Liquefaction (HTL) of Wild Alga Consortium under Different Conditions

by
Caroline Barrère-Mangote
1,2,*,
Anne Roubaud
3,*,
Brice Bouyssiere
4,*,
Julien Maillard
2,5,
Jasmine Hertzog
2,5,
Johann Le Maître
1,2,5,
Marie Hubert-Roux
2,5,
Jean-Francois Sassi
6,
Carlos Afonso
2,5,* and
Pierre Giusti
1,2
1
TOTAL Refining and Chemicals, Total Research and Technologies Gonfreville, BP 27, 76700 Harfleur, France
2
International Joint Laboratory–iC2MC: Complex Matrices Molecular Characterization, TRTG, BP 27, 76700 Harfleur, France
3
CEA LITEN, Université Grenoble Alpes, 38 000 Grenoble, France
4
Universite de Pau et des Pays de l’Adour, E2S UPPA, CNRS, Institut des Sciences Analytiques et de Physico-chimie pour l’Environnement et les Materiaux (IPREM), UMR5254, Hélioparc, 64053 Pau, France
5
Normandie Université, COBRA, UMR 6014 et FR 3038, Université de Rouen, INSA de Rouen-Normandie, CNRS, IRCOF, 76821 Mont-Saint-Aignan, France
6
CEA Tech en Région Sud, CEA Cadarache, 13108 St Paul Lez Durance, France
*
Authors to whom correspondence should be addressed.
Submission received: 1 July 2021 / Revised: 12 August 2021 / Accepted: 18 August 2021 / Published: 25 August 2021
(This article belongs to the Special Issue Extraction, Exploitation and Application of Algae Biomass)

Abstract

:
Microalga-based fuels are promising solutions for replacing fossil fuels. This feedstock presents several advantages such as fast growth in a harsh environment and an ability to trap gases emitted from industries, thus reducing global warming effects. An efficient way to convert harvested microalgae into biofuels is hydrothermal liquefaction (HTL), which yields an intermediate product called biocrude. In this study, the elemental and molecular compositions of 15 different HTL biocrudes were determined by means of different techniques. Wild algae were cultivated in an industrial environment with plant emissions as a carbon source in fresh or seawater. It was notably observed that the culture medium had an influence on the biochemical composition and mineral matter content of algae. Thus, seawater algae were characterized by larger amounts of carbohydrates and mineral matter than freshwater ones, which also affected the oil yields and the light and heavy fractions of biocrudes.

1. Introduction

The awareness of global warming over the past decade has led to several research projects dedicated to reducing greenhouse gases. Many studies have focused on the development of fuels based on renewable resources such as biomass. In this context, microalgae are interesting candidates due to their fast growth rate, cultivation on nonarable lands, and potential high lipid content. Due to their characteristics, they have been envisioned to help in the direct mitigation of CO2 produced by human activities. Several studies have reported the possibility of using emissions from coal power plants or cement production as a carbon source for microalga cultivation at a lab scale [1,2]. Hydrothermal liquefaction (HTL) is considered an efficient process for microalga conversion, as evidenced by numerous published reviews [3,4,5,6,7]. HTL consists of a thermochemical conversion of wet microalgae, avoiding any energy-consuming drying step of the biomass that produces a high-energy content biocrude, such as some gas, liquid, and solid byproducts. Barreiro et al. comprehensively described the different reaction pathways occurring during the HTL process for proteins, lipids, and polysaccharides mainly found in microalgae [7]. The obtained biocrude is composed of hydrocarbons with a high content of nitrogen and oxygen compared to fossil crude oil [3,4,5,6,7].
Considering microalgae as an industrial feedstock and their conversion into a biofuel, several challenges need to be addressed. First, the energy consumption to obtain the biocrude should be minimized through the optimization of microalga cultivation and harvesting systems. Couto et al. and González-Gálvez et al. reported the use of an open pond to cultivate wild microalga consortia with wastewater as a nutriment source [8,9]. Ishizaki et al. recently showed a lower energy consumption for HTL biocrude from a wastewater/microalga scenario compared to classic crude oil production [10]. Flocculation as a harvesting strategy and recycling of the HTL aqueous phase as nutriment were also reported as optimization pathways [11].
The second challenge involves the maximization of biocrude yield and quality. Indeed, biocrude yield depends on the biochemical composition of the used biomass. Lu et al. recently reported a study on the HTL yield of different model compounds [12]. They evidenced that biocrude contained >80 wt.% lipids, ~20% protein, and ~5% cellulose. The authors reported that biocrude was mainly composed of acid and ester for lipid feedstock, nitrogenated compounds for protein feedstock, and a mix of alcohol, phenol, hydrocarbon, and ketone for cellulose feedstocks. Recently, Liu et al. reported the conversion of high-ash natural microalgae cultivated using emissions from a municipal solid waste combustion plant as carbon source [13]. They showed that ash content inhibits the conversion of microalgae. On the contrary, Xu et al. reported a positive impact of different types of ash on biocrude yield and composition, when carrying out the co-HTL of microalgae with sewage sludge [14]. As for biocrude yield, the quality is a key aspect for refinement with large amounts of nitrogen, oxygen, and metals, necessitating improved coprocessing in a classical refinery because of probable catalytic deactivation, coking, and NOx emission. Different authors reported upgrading studies via a catalytic route [15,16,17,18,19,20]. Zhou and Hu showed in their review that upgrading HTL biocrude seems more efficient than using catalytic HTL [21]. A recent study by Chen et al. reported that nitrogen could be partially extracted using water for microalga biocrude [22]. However, different studies have evidenced that denitrogenation remains a challenge for biocrude from microalgae with limited efficiency and high H2 consumption. Many authors also reported high contents of iron, sodium, and silicon in biocrude, thus limiting their co-refinement potential in a classical refinery due to their high catalyst-poisoning effects. Jarvis et al. reported a high deactivation effect during an upgrading study of biocrude due to iron porphyrins [18]. Jiang et al. recently studied the fate of iron during HTL using the hemin porphyrinic structure as a model molecule of microalga hemoprotein [23]. They observed 52 porphyrinic structures in the obtained biocrude. This group recently explored different solvents to recover biocrude in an attempt to reduce metal content [24]. They observed that solvent has an important impact on biocrude yield and sodium content, especially if the solvent comes into contact with water. However, this strategy remains insufficient for reducing iron content to an acceptable value for refineries, probably because porphyrins are fully organic soluble molecules.
In this study, we aimed to evaluate the quality of different biocrudes obtained in a realistic industrial pathway at the pilot scale. Microalgae were cultivated in industrial environment with plant emissions as a carbon source, which were converted to biocrude with a continuous HTL pilot. The composition of the obtained biocrude was studied using different analytical techniques (thermal gravimetric analysis, elemental analysis, and high-resolution mass spectrometry), considering the key factors previously reported (yield and nitrogen and metal contents). Biocrude qualities were then discussed and compared as a function of the biochemical composition of microalgae.

2. Materials and Methods

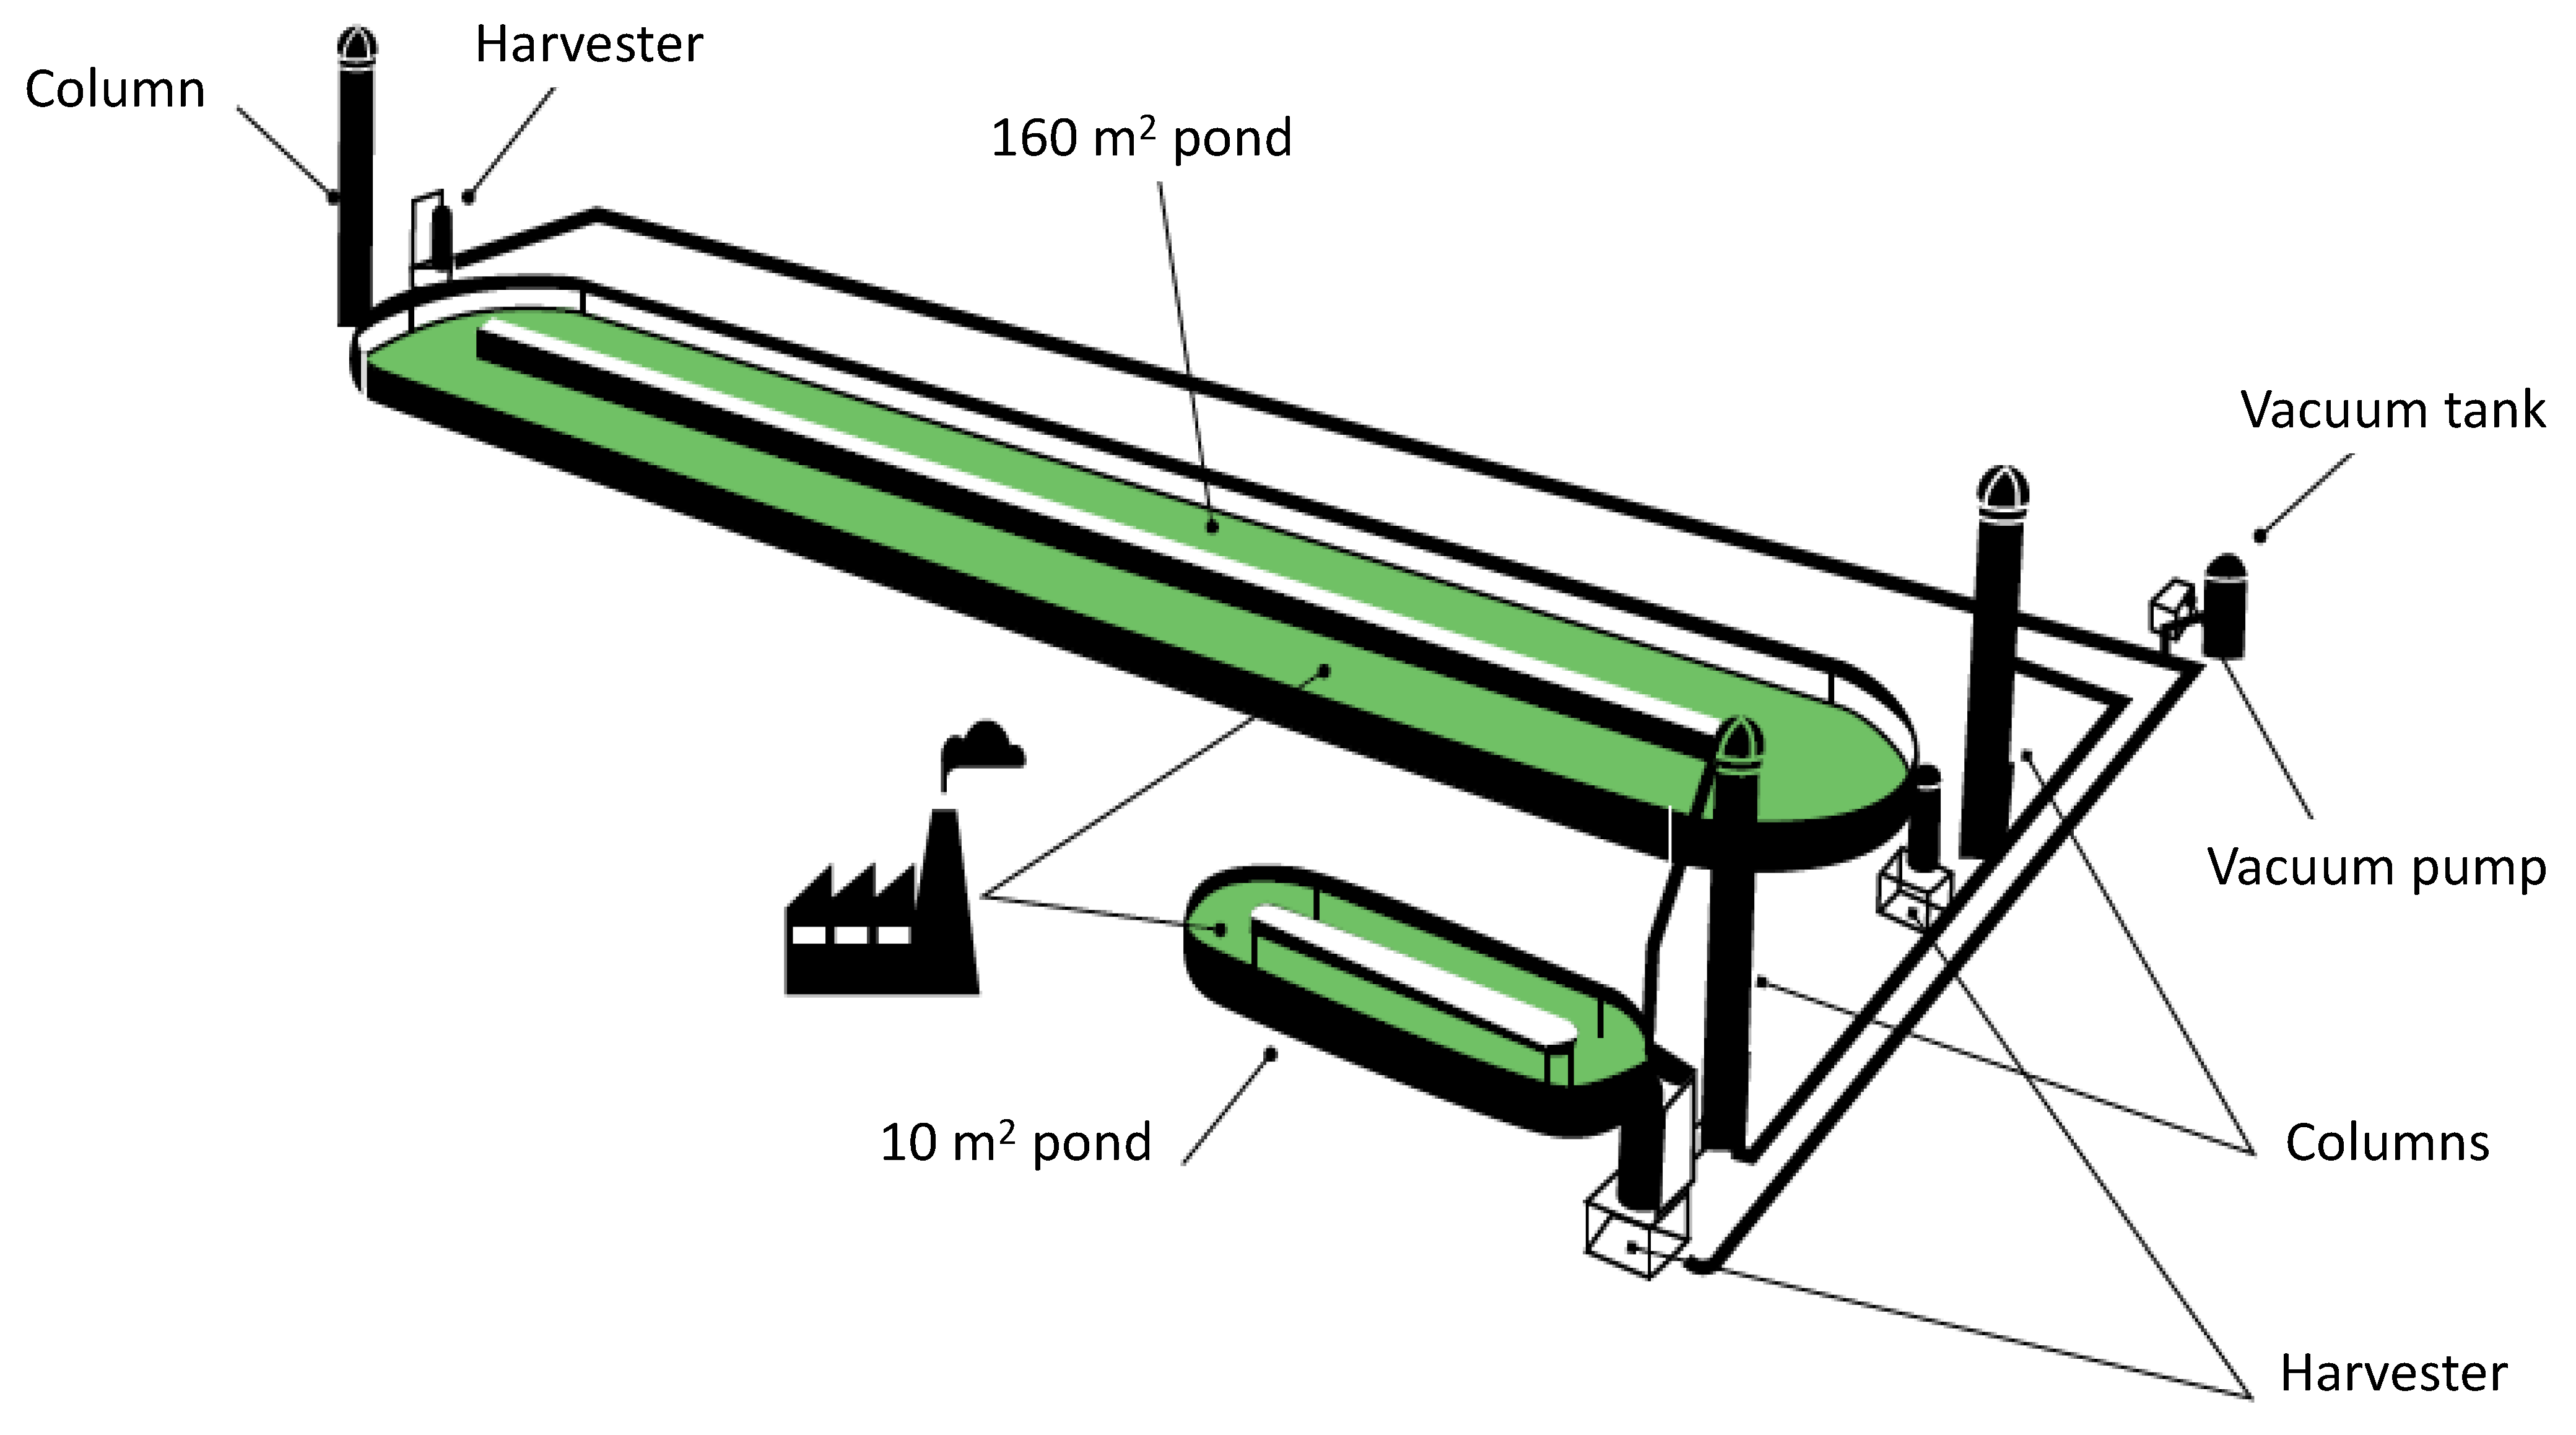
2.1. Alga Cultivation

Raceway open ponds, shown in Figure 1, were directly fed with plant emissions, without any purification, using a vacuum airlift column developed by Coldep.
These columns dissolved plant emissions in pond water and allowed water circulation and microalga harvesting with a very low energy consumption. Three pilot ponds (160 m2 and 2 × 10 m2) were installed at three different industrial plants (a furnace from Kem One, an incinerator from Solamat Merex, and a furnace from Arcelor Mital) in Fos-sur-Mer and exposed to realistic conditions such as dust from coal. For research studies and comparison, two reference cultivation pilot ponds (160 m2 and 10 m2), fed with pure CO2, were installed at the Ifremer (French Research Institute for Exploitation of the Sea) research station in Palavas-les-Flots. For 2 years, different types of culture (seawater and freshwater) have been tested. Due to the open and industrial environment of the project, the culture involved a wild microalga consortia, adapted to seasonality and environment. The converted alga batches had a large distribution in terms of dry matter, mineral matter content, and biochemical composition (see Table 1), because of the seasonal variations and the different cultivation sites and cultivation media (seawater and freshwater). Due to problems arising during the first batch, C1, another initial reference batch was made; thus, the C1 batch was not used for the remainder of the study.

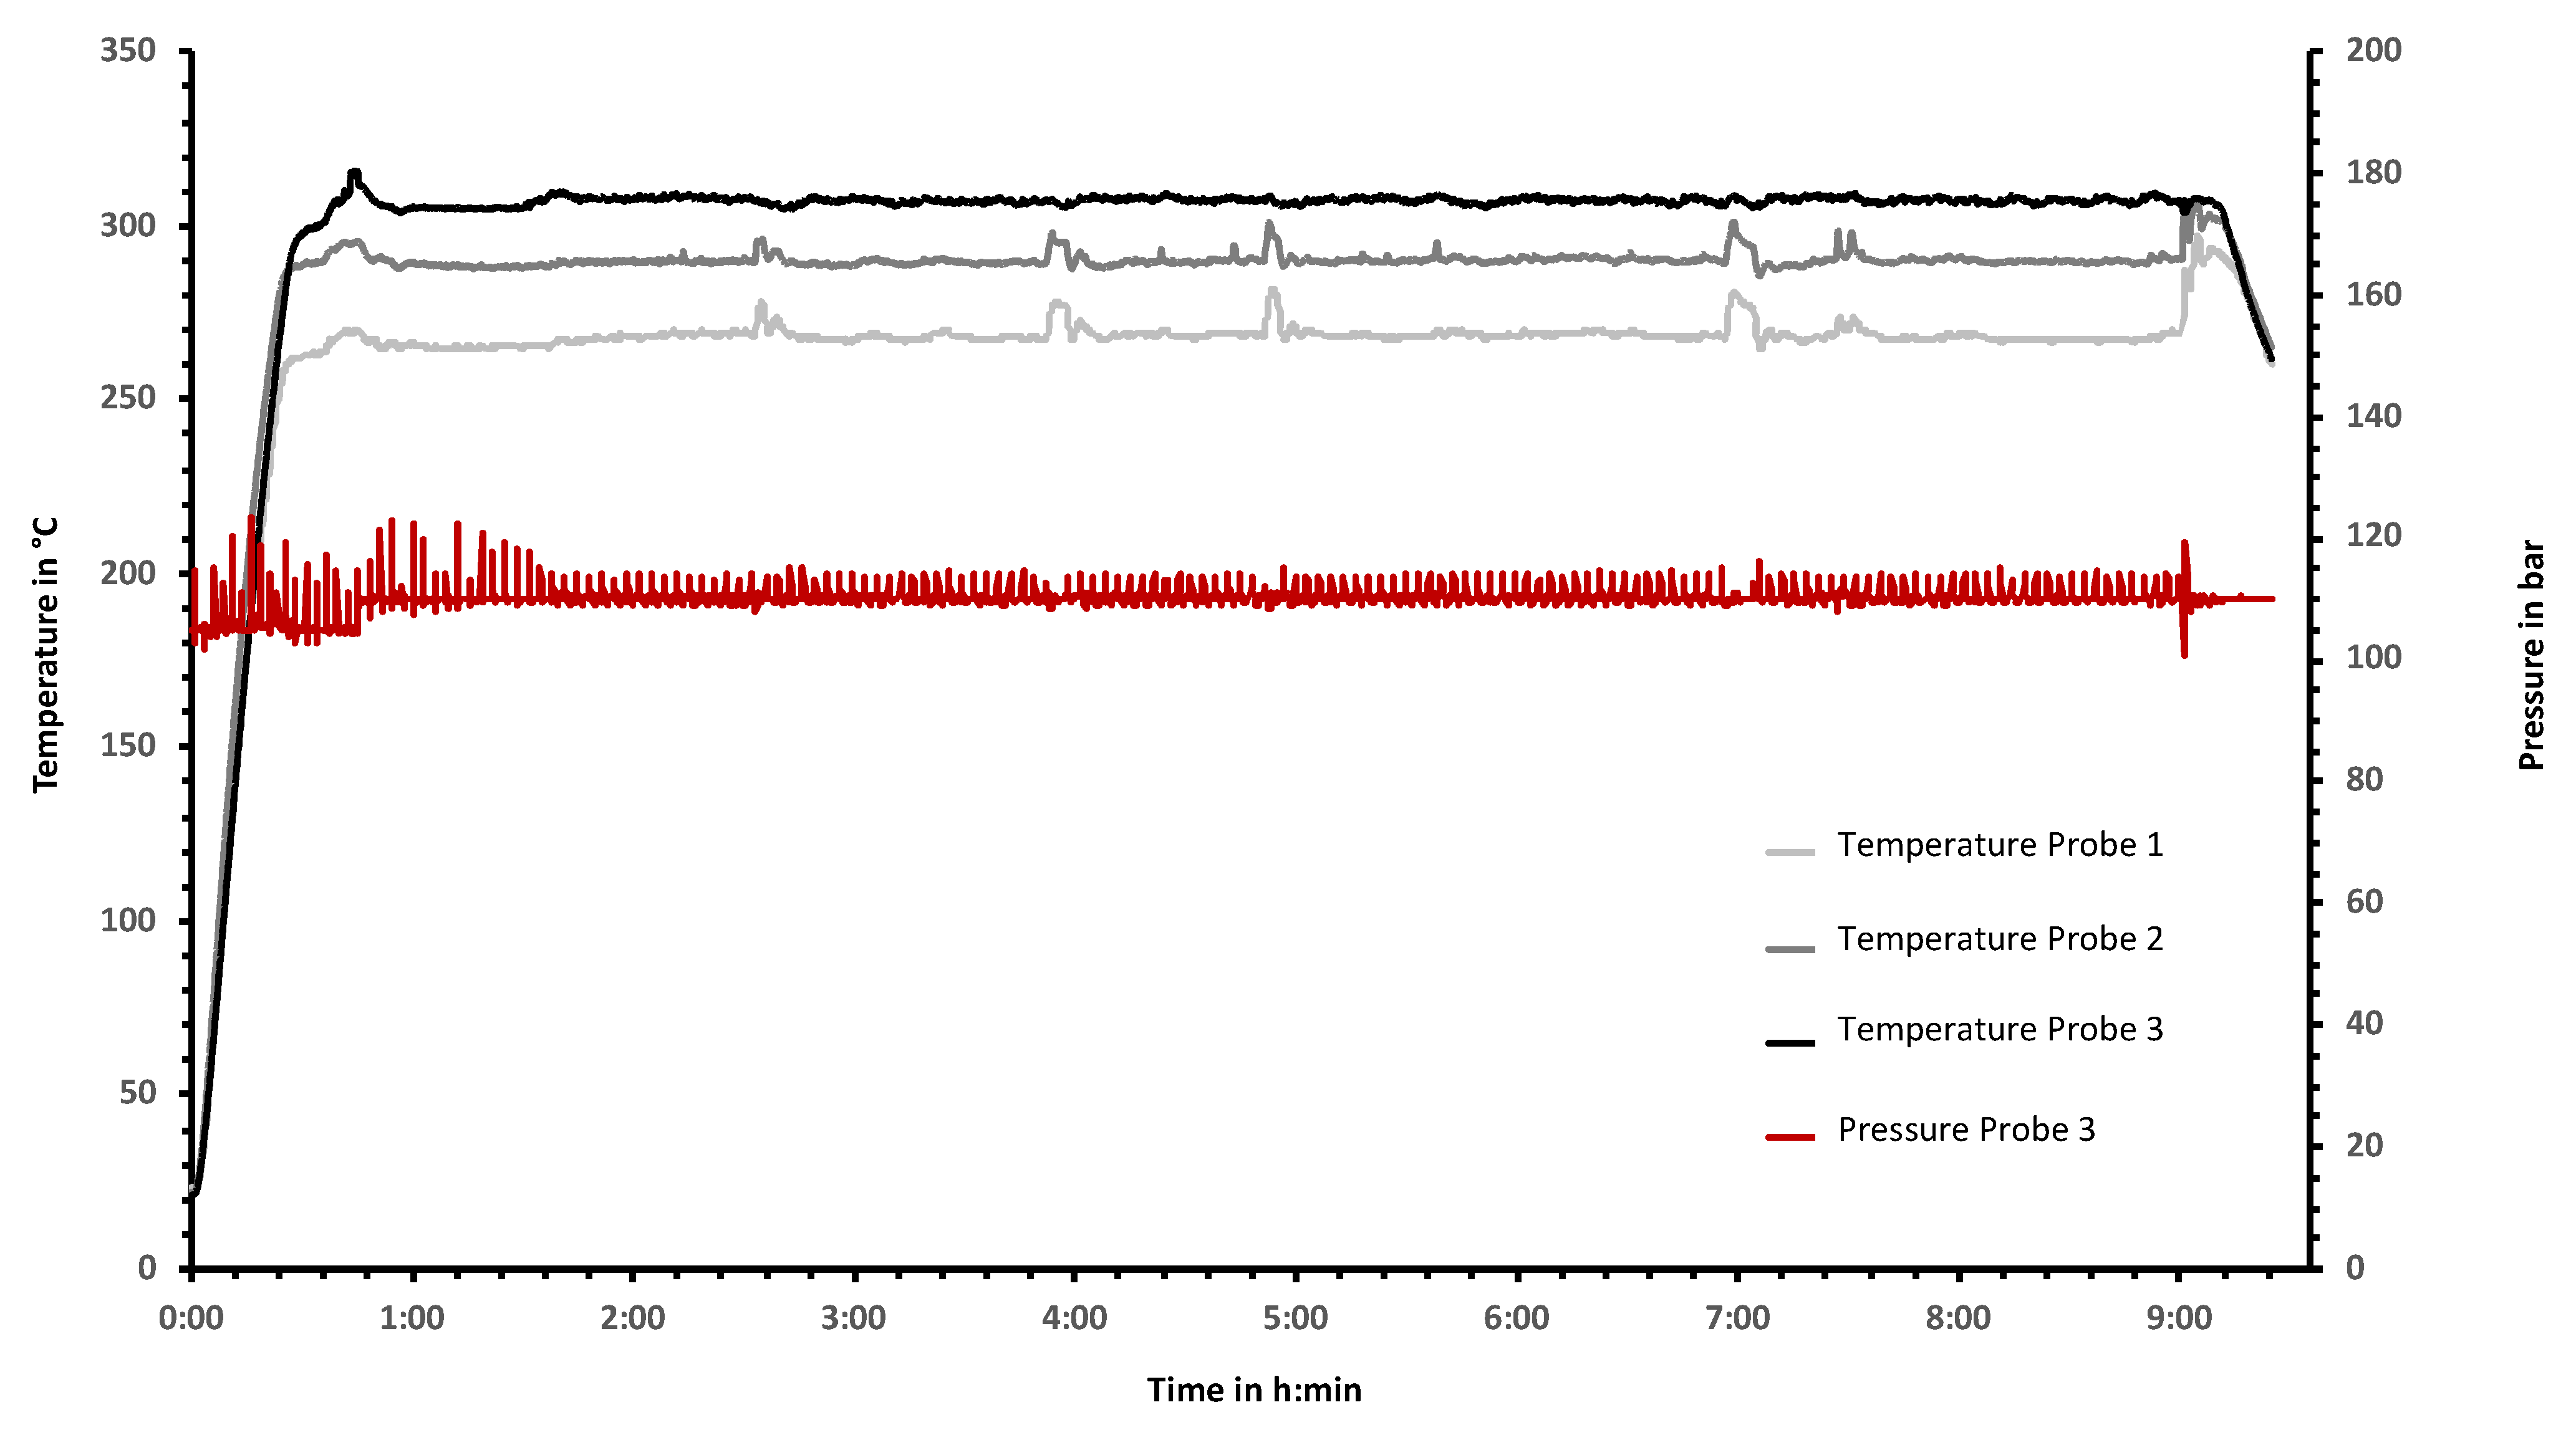
2.2. Biocrude Production

During this study, 12 distinct alga batches were implemented to produce 15 biocrude samples. HTL conversion of the different harvested alga batches was performed on a continuous setup designed and installed at CEA LITEN (innovation laboratory for new energy technologies and nanomaterials of the French Atomic Energy and Alternative Energies Commission). The pilot-scale HTL reactor was specially built by Top Industrie (Vaux-le-Pénil, France) (Figure 2). It can work with a maximum flow rate of 2.5 L·h−1 of wet biomass at a maximum temperature of 350 °C and a pressure up to 200 bar. The pressure was set above the vapor pressure of the working temperature in order to maintain the injected mixture in a liquid phase. The microalga paste was injected into the stirred heated reactor through a dual-syringe pump with a flow rate of 1.5 to 2 L·h−1 so that the estimated residence time was on the order of 15 min. Pressure was set at 120 bar and temperature was set to 300 °C. Examples of the temperature (three different temperature probes) and pressure profiles during a continuous run are given below (batch C7).
For HTL conversion, the alga batches had to be sufficiently concentrated in organic matter to recover some oil at the end but not too concentrated so as to limit viscosity of the alga paste for pumping; details are given Table 2.
Cooling down was performed from 350–300 °C to approximately 80 °C before pressure reduction and regulation using the second syringe pump. Separation of the biocrude from the aqueous phase was done continuously via filtration in the collecting tank before analyses. The gas was composed of more than 90 vol.% CO2 with small amounts of CH4, CO, and C2 species. The weight percentage of the gas produced was below 10%. The weight of biocrudes was measured at the end of the run before treatment. The raw biocrude was still rich in water. Yields were calculated after determination and removal of water, and the results are expressed relative to the initial mass of alga organic matter.

2.3. Biocrude Preparation

As previously reported by López Barreiro et al., the different fractions produced during HTL need to be separated [7]. Most authors used dichloromethane to separate the biocrude (organic solvent soluble) into aqueous and solid phases, as this allowed for maximizing biocrude yield [15,17,20,25]. In this work, following Pedersen et al., water was eliminated by distillation after an initial separation by filtration [19]. The remaining sample was washed with boiling toluene, a common solvent used in the petroleum industry, in a Soxhlet apparatus, to obtain a bio-oil fraction (toluene soluble) and a solid fraction (toluene insoluble); the results are given in Table 2. Jiang and Savage reported a study on the impact of solvent on bio-oil yield and metal content. They concluded that this parameter has a great influence on the alkali and iron content (known as a catalyst poison) and bio-oil yield. In our case, toluene is not a good solvent for highly polar nitrogenated species; thus, we posited that this solvent would not maximize the bio-oil content. However, we hypothesized that co-refining remains the more realistic way of producing biofuel with biocrude. In this context, the miscibility of the bio-oil fraction with fossil crude oil should be an advantage; thus, we chose a good solvent for fossil crude oil (i.e., toluene) for bio-oil recovery.

2.4. Analytical Techniques

2.4.1. Total Organic Carbon (COT) Content in Aqueous Phase

The carbon content in the aqueous phase after HTL conversion was determined using a COTmeter Shimadzu COT-L VCSH. Total carbon content was determined by oxidation in air for conversion into CO2, quantified by an IR detector. Inorganic carbon was obtained by degassing CO2 using H3PO4 acid. Results are given as g C/L. CT denotes the total carbon in g/L. A comparison with the initial carbon content in the alga solution gave an indication of the percentage of C converted.

2.4.2. Thermogravimetry Analysis (TGA)

TGA experiments were carried out using a TG209F1 thermobalance from Netzsch. Between 10 and 20 mg of sample was weighed in an alumina crucible. The bio-oil samples were heated from ambient temperature to 600 °C at 10 °C/min in a nitrogen atmosphere (20 mL·min−1), followed by 10 min of isotherm. The solid sample (toluene insoluble) was heated from ambient temperature to 950 °C at 10 °C/min in a nitrogen atmosphere (20 mL·min−1). After a return to ambient temperature, a second heating to 950 °C was carried out at 10 °C/min in an oxidizing atmosphere (air, 20 mL·min−1).

2.4.3. Elemental Analysis

The measurements of carbon, hydrogen, nitrogen, and sulfur were obtained using Thermo FLASH Smart in a flash combustion oven, with carrier gas, where the temperature was regulated to 900 °C. The sample and an optimal quantity of oxygen were injected. At this temperature, both organic and inorganic substances were converted into elemental gases (CO2, H2O, NO, and SO2). These gases were separated in a chromatographic column and finally detected by a thermal conductivity detector.
Inductively coupled plasma atomic emission spectroscopy (ICP-AES) was used to quantify trace elements using an ICAP spectrometer (ThermoFisher Scientific, Waltham, MA, USA). The samples were burnt and then heated in a muffle furnace at 525 °C to remove residual carbon. The residue was fused with a dilithium tetraborate and lithium fluoride flux. The fused mixture was placed for 15 min in a furnace at 925 °C. Then, this mixture was introduced to a solution of tartaric acid and hydrochloric acid. The final solution was completed with water. The solutions obtained were analyzed, and external calibrations were realized for each element to be measured. The solutions were introduced into the spectrometer by means of a peristaltic pump, with the speed set to 50 rpm. The sample was then sent to a nebulization chamber with argon gas in order to arrive in the plasma chamber in the form of a spray. The plasma power was fixed at 1150 W. Constant argon flow rates were set to 0.5 L·min−1.
The analytical procedure for laser desorption Fourier transformed ion cyclotron resonance mass spectrometry (LDI FTICR MS) experiments of bio-oils is reported in the Supplementary Materials.

3. Results and Discussion

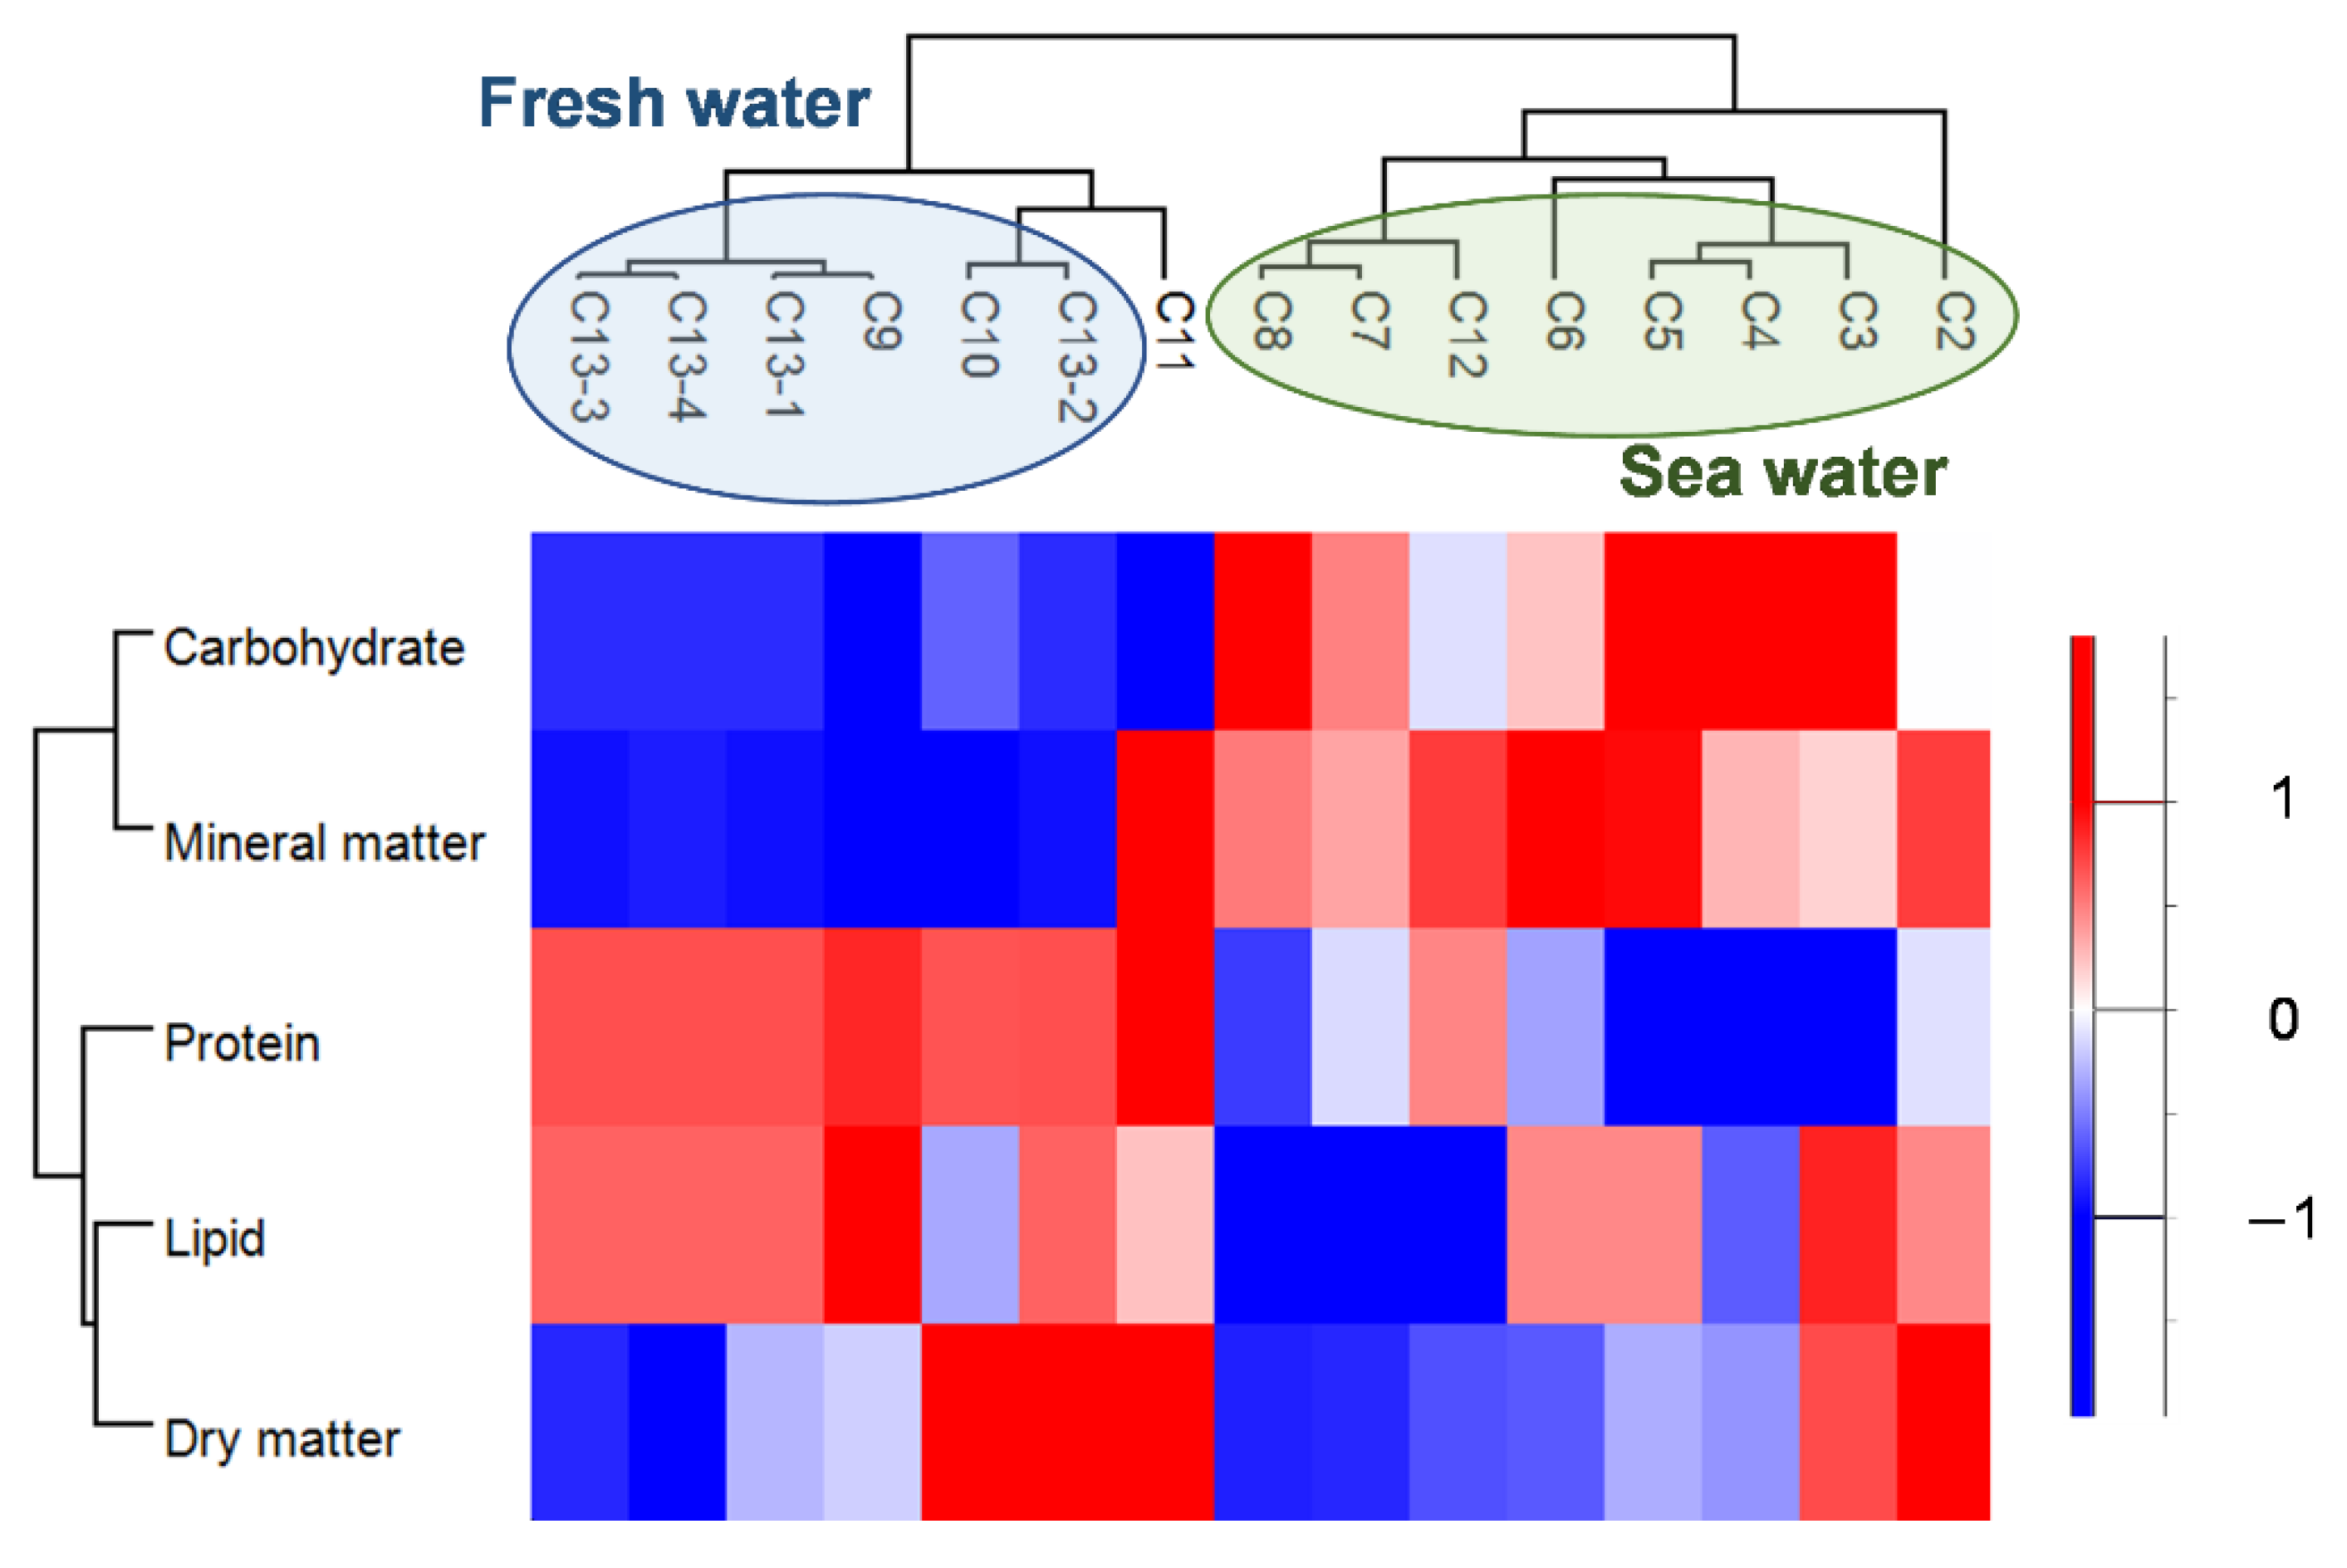
3.1. Biomass Composition

The harvested batch of biomass was highly variable in terms of dry matter and biochemical composition. These variations were observed throughout the project as a function of the season, weather, and site (Table 3 and Figure S1, Supplementary Materials). All batches of algae converted by HTL presented similar variations, and their compositions are given in Table 3.
A hierarchical cluster analysis was performed on the data from Table 3. The resultant heatmap is given in Figure 3, which shows that alga batches coming from fresh water presented a lower carbohydrate and mineral matter content and a higher lipid and protein content than alga batches from seawater. However, there is no clear evidence of an algal composition difference induced by the plant emissions (sample C3, C4, and C11) compared to pure CO2 (samples C2, C5, C6, C7, C8, and C12).

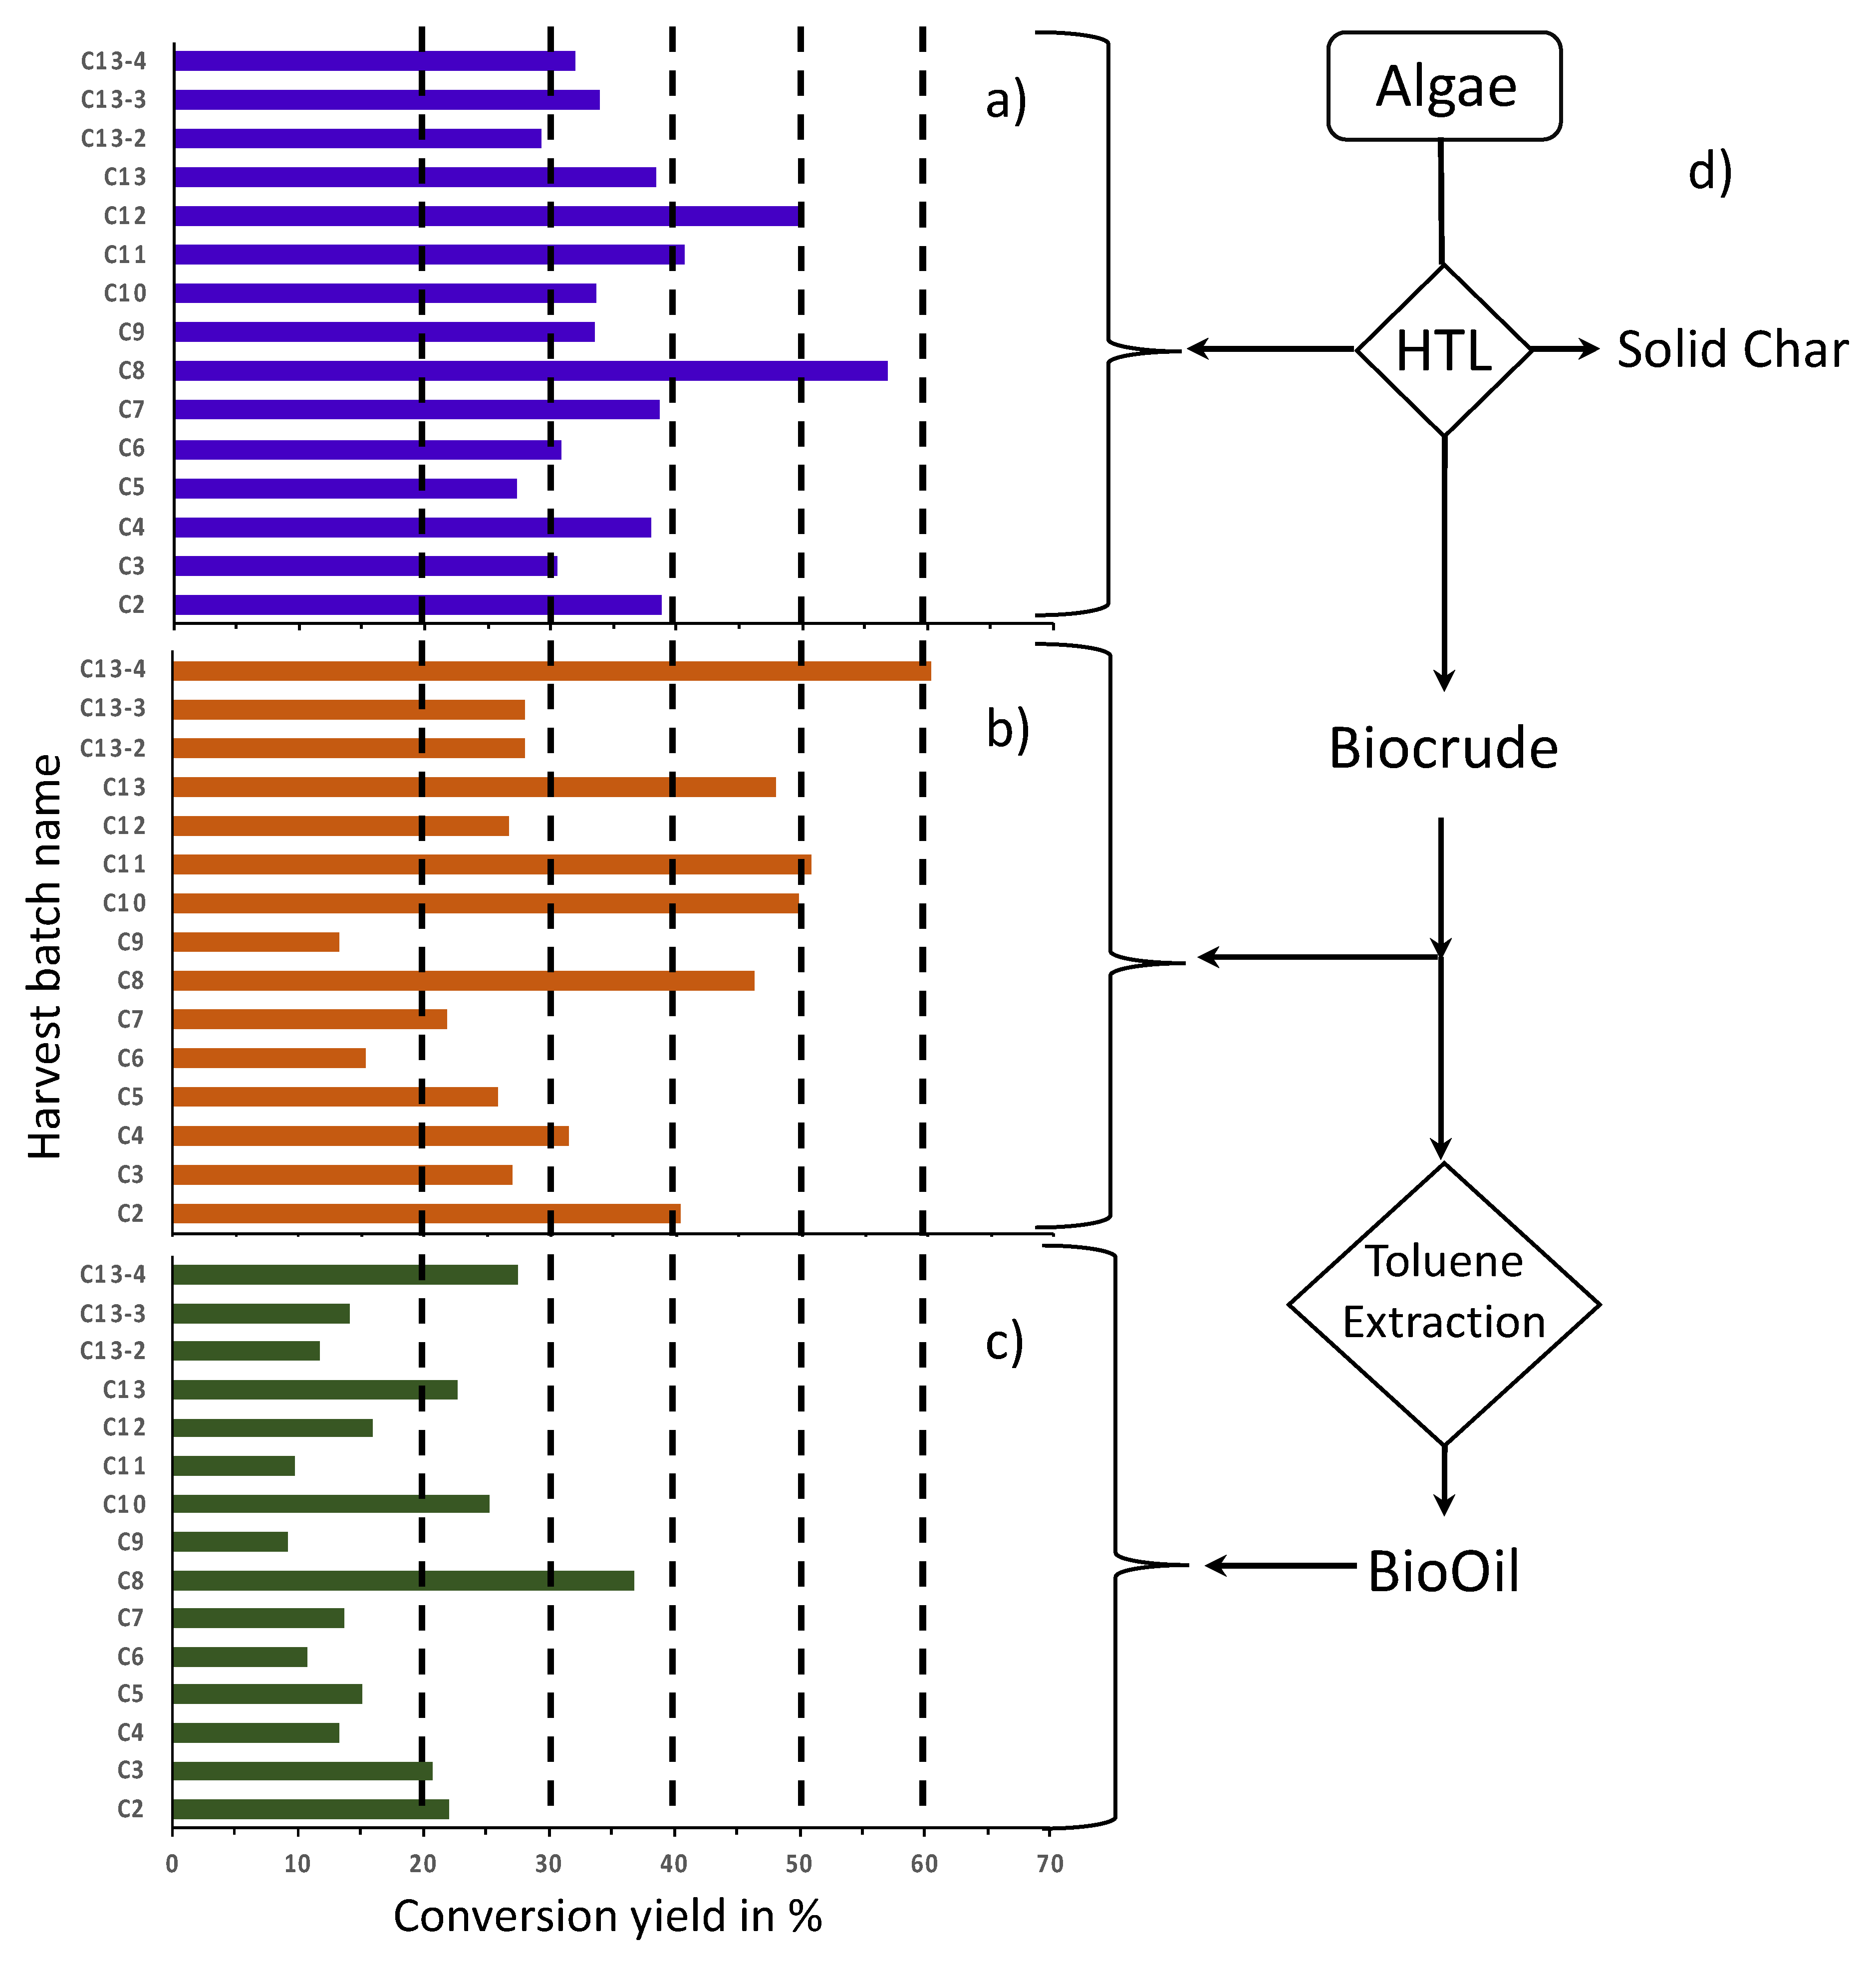
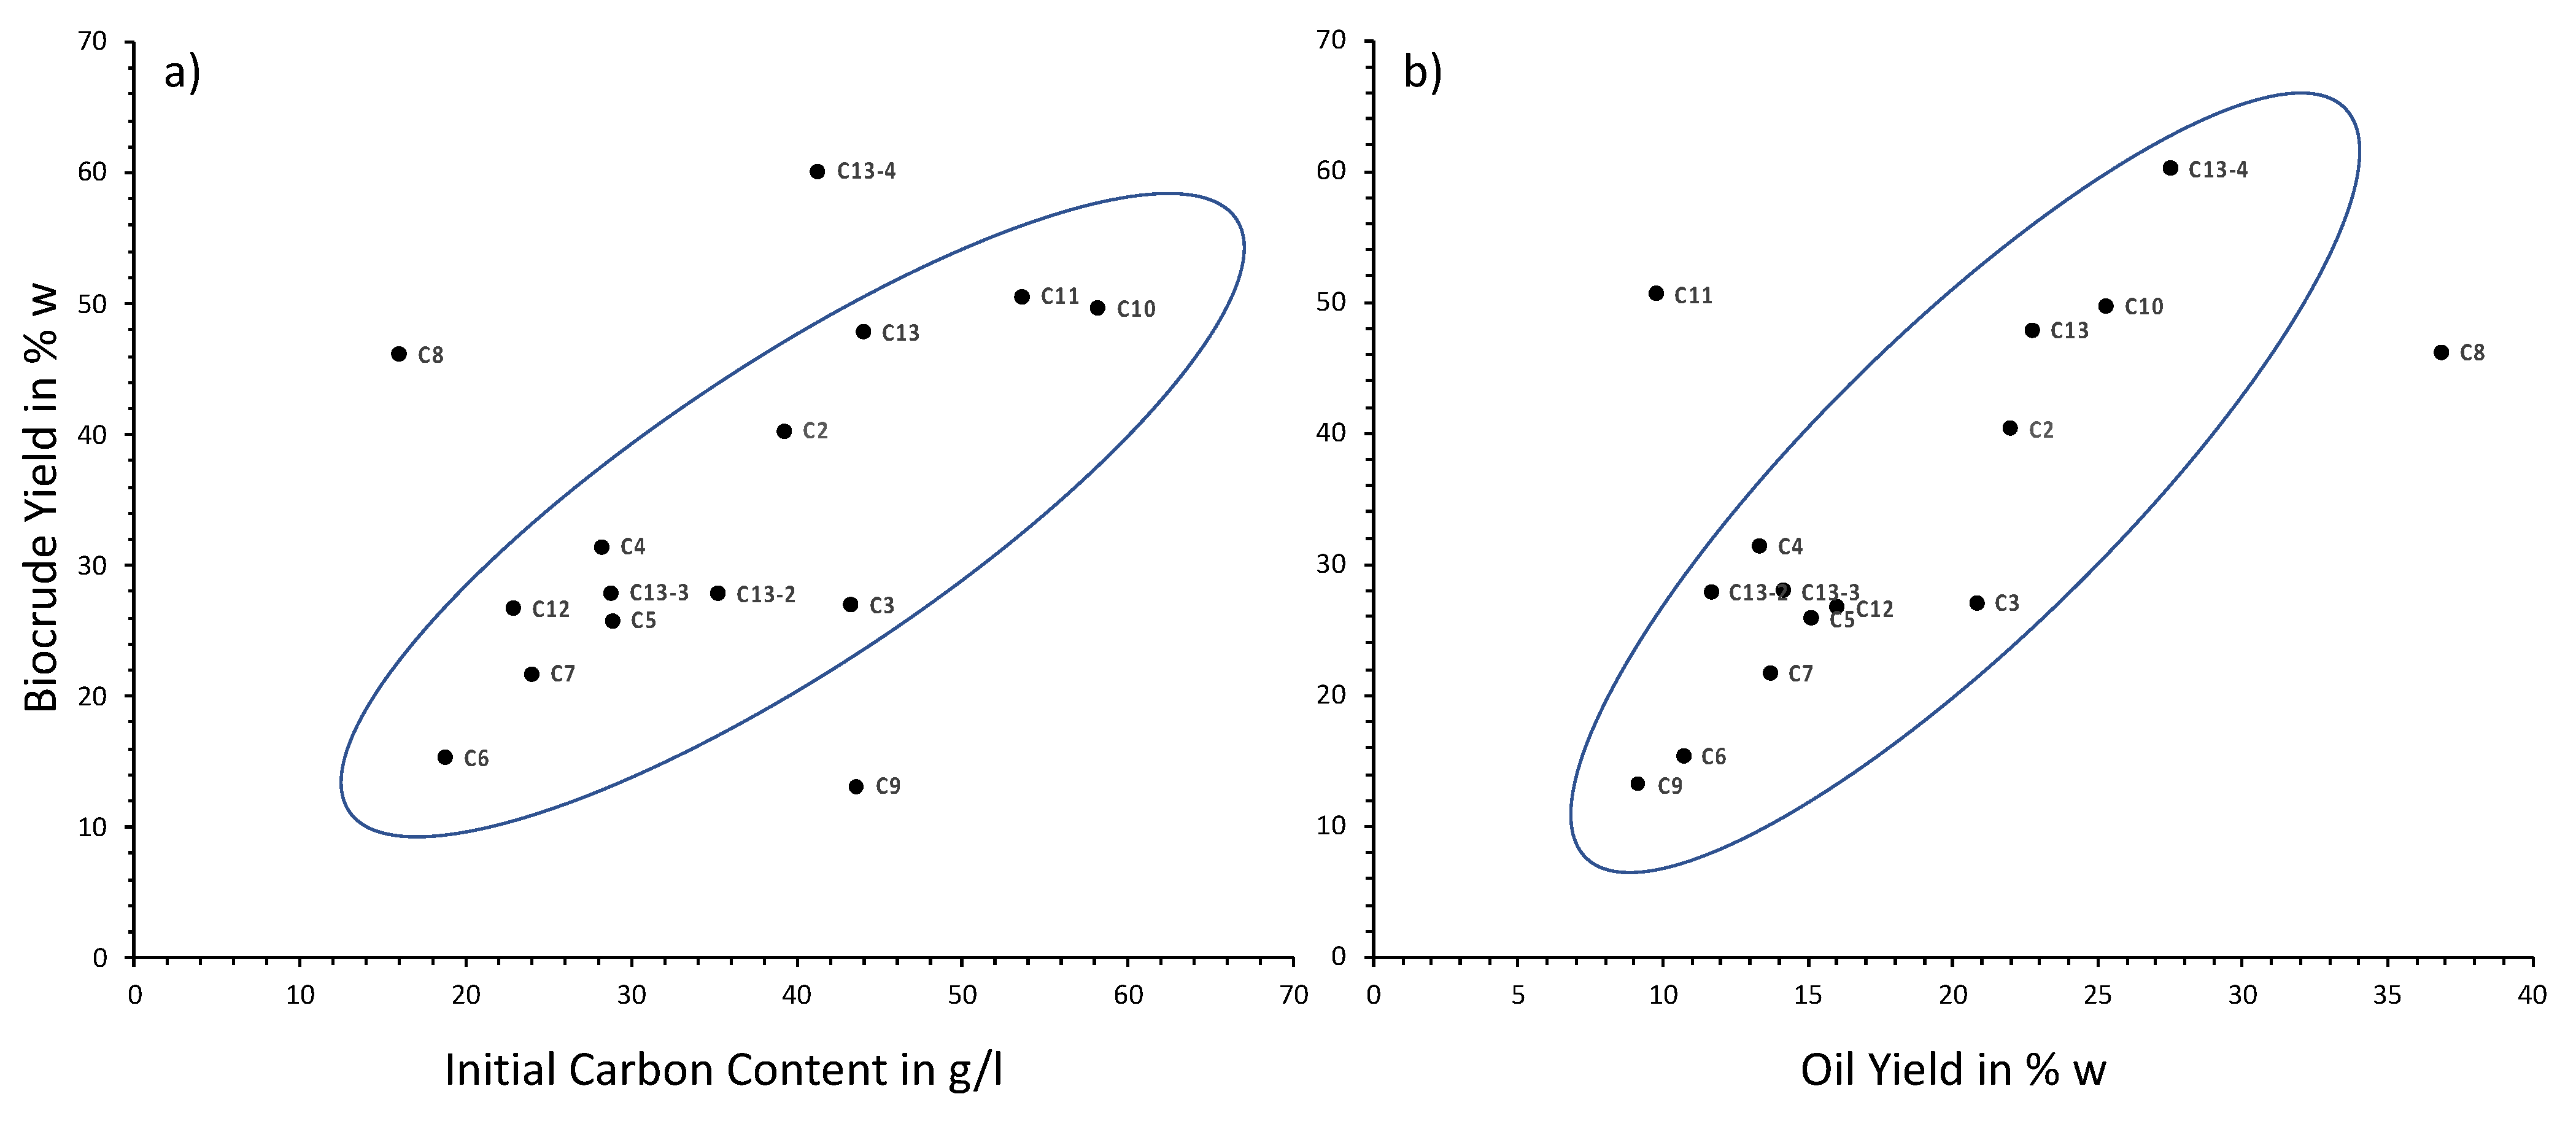
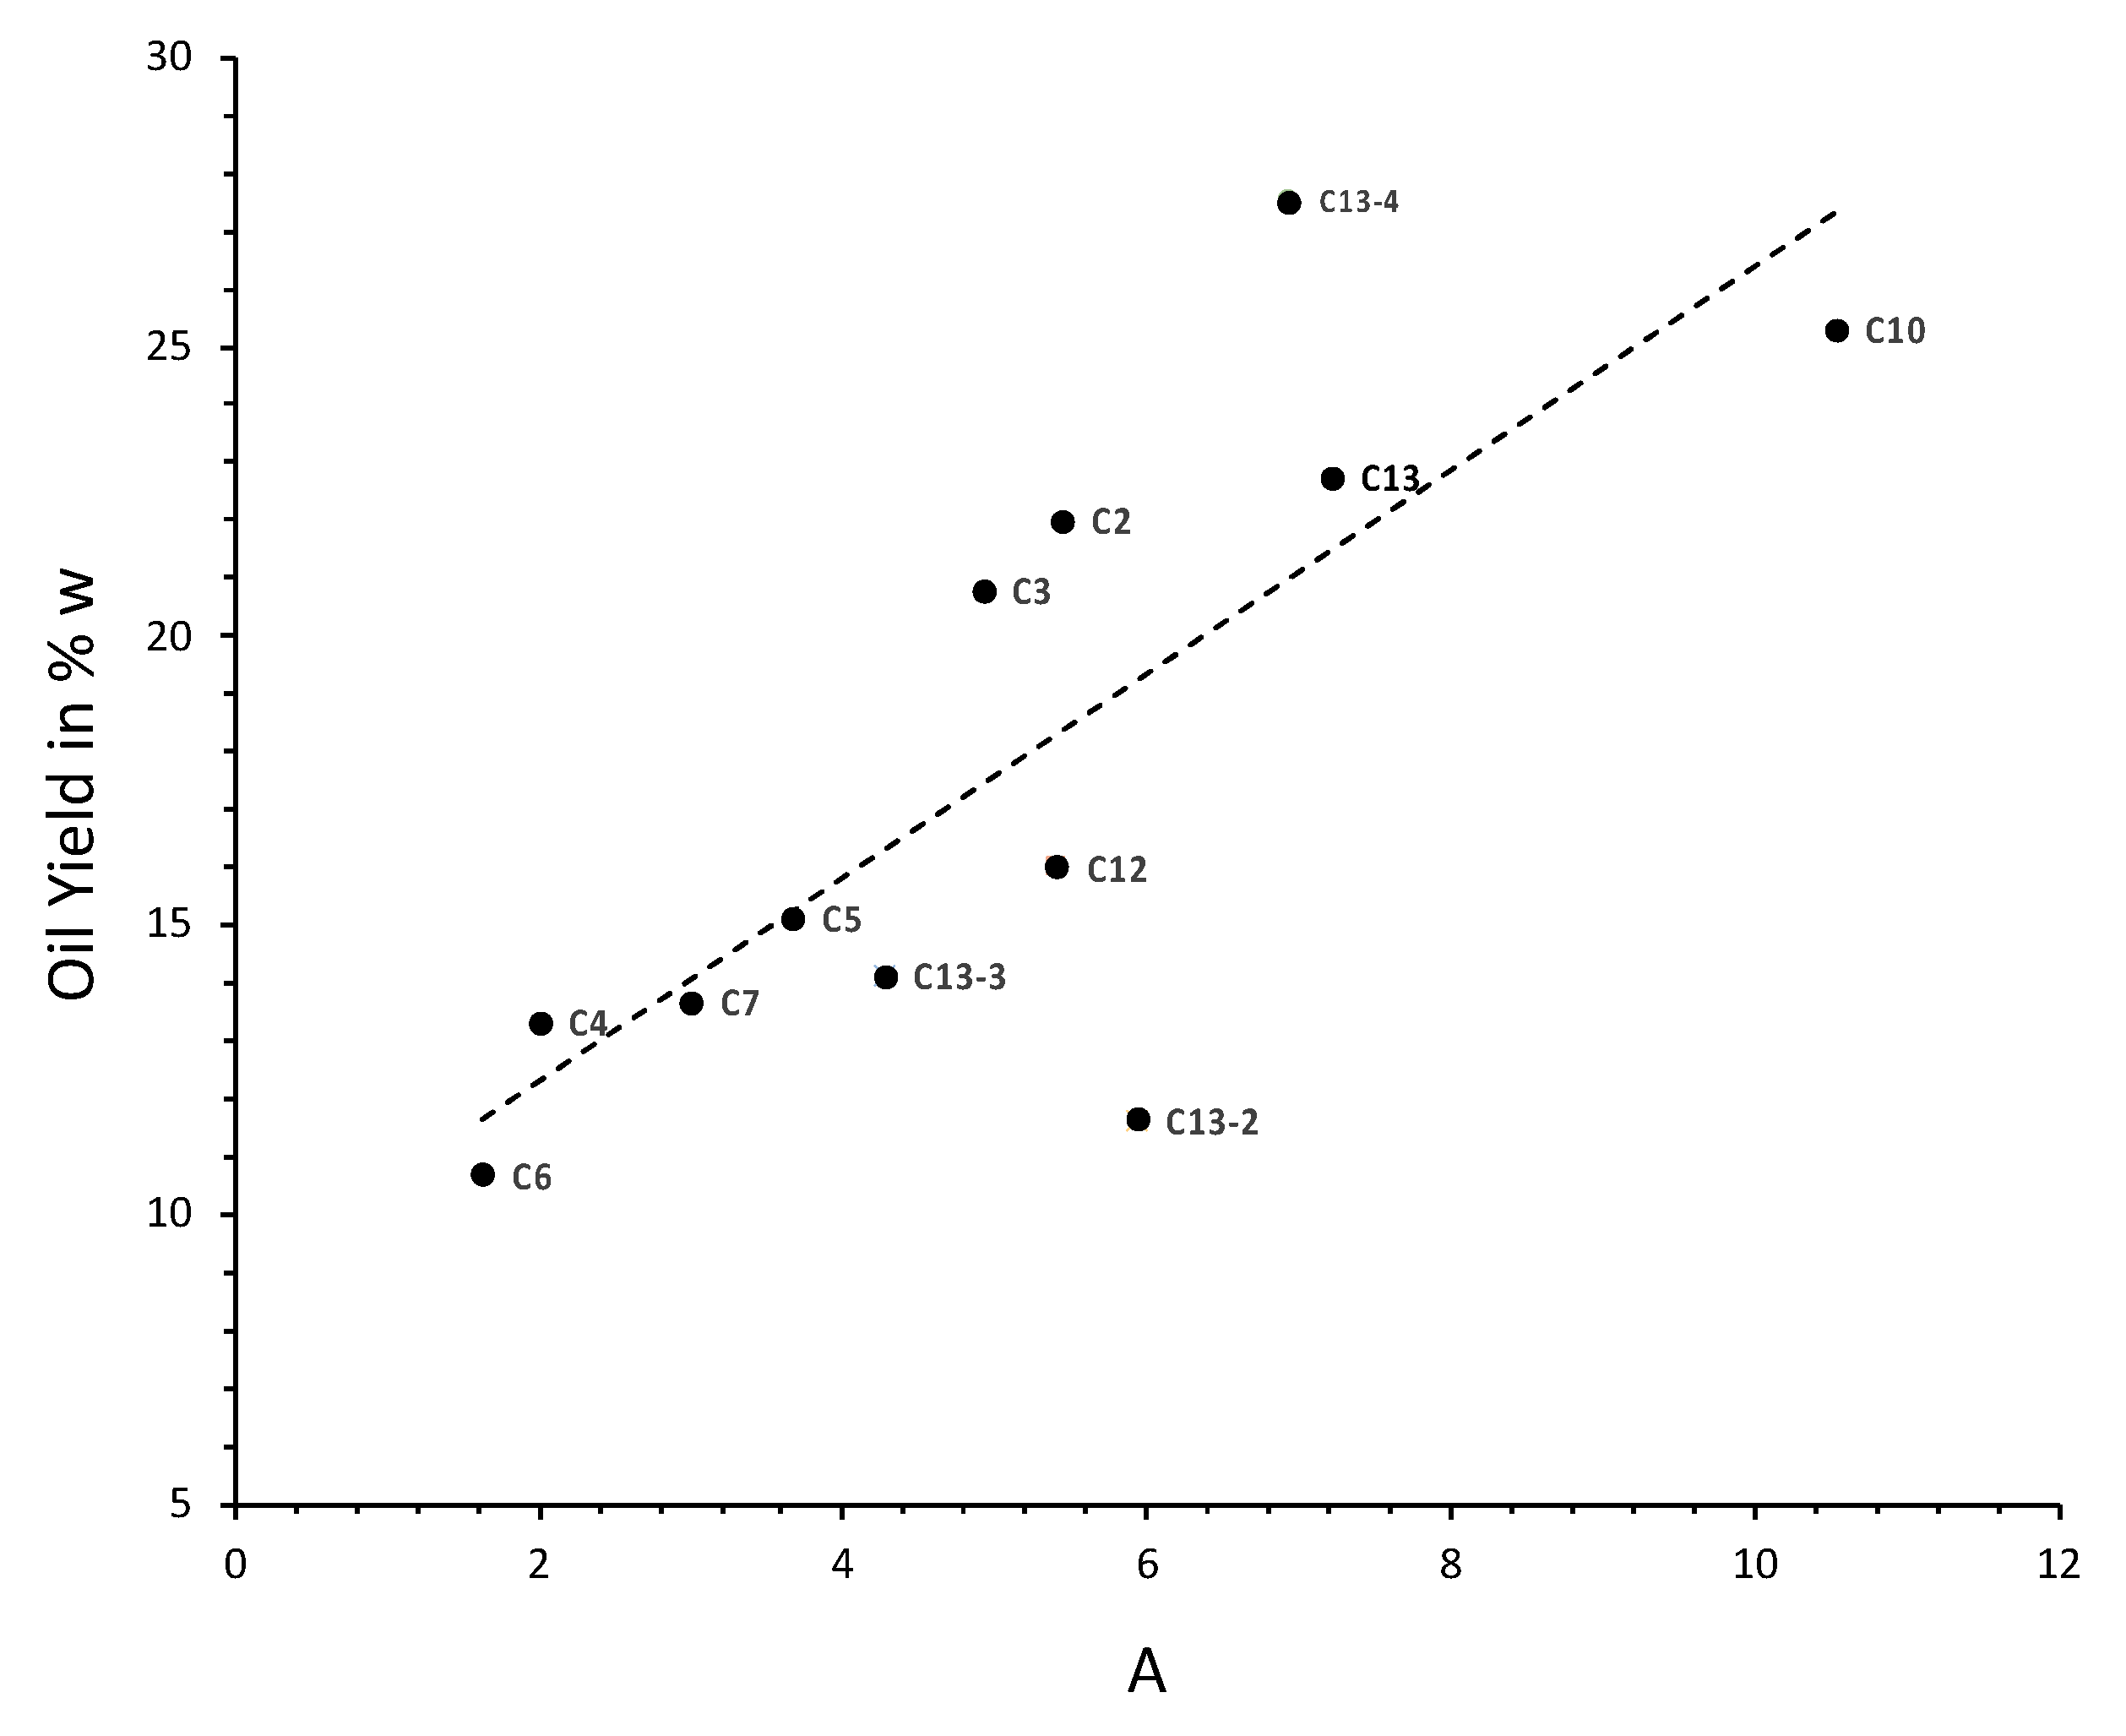
3.2. Yields of Products Coming out of HTL

The main product of HTL was a biocrude composed of an oil and a solid char fraction, with organics still in the aqueous phase (Figure 4d). The percentage of carbon remaining in the aqueous phase is an indication of the conversion efficiency (Figure 4a), which can be highly variable. The objective of the conversion is to maximize the organic carbon extraction and its transformation into valuable products. The conversion yields of the biomass organic matter into biocrudes were highly variable for all experiments, as shown in Figure 4b,c. This is also reflected in the percentage of carbon remaining in the aqueous phase (Figure 4a).
Figure 5a shows that the biocrude yields were seemingly influenced by the initial carbon content. This carbon content was related to the initial concentration of organic matter in the alga paste. It should be noted that the first alga batch, C1, was too low in carbon content and, as such, no biocrudes could be recovered. The oil yields were also seemingly correlated with the biocrude yields as a function of the oil/char ratio (Figure 5b).
As shown above, all the results in terms of yield could be plotted together. This representation revealed no differences as a function of the cultivation site (Fos/Palavas) or the type of water (sea/fresh). The variation in conversion yields was primarily indicated by the organic matter content. The influence of process parameters such as residence time in the reactor (i.e., flow rate), salt content, and biochemical composition of the biomass could be revealed. However, when only looking at process parameters such as the flow rate (residence time), no correlation could be found.
An explanation could stem from the biochemical composition. Thus, the biochemical composition and dry matter of the initial mixture were plotted along with the flow rate (Figure 6), showing a clear tendency. This plot revealed that proteins or lipids alone were favorable for oil production, whereas sugar would reduce the oil yields. Sugars are known to promote the formation of solid matter, whereas lipids are typically recovered in the oil. However, there seemed to be an antagonistic behavior between lipids and proteins. A higher flow rate resulted in a shorter residence time, thereby limiting the condensation reaction and leading to char formation; however, a low content of organic matter was not favorable.

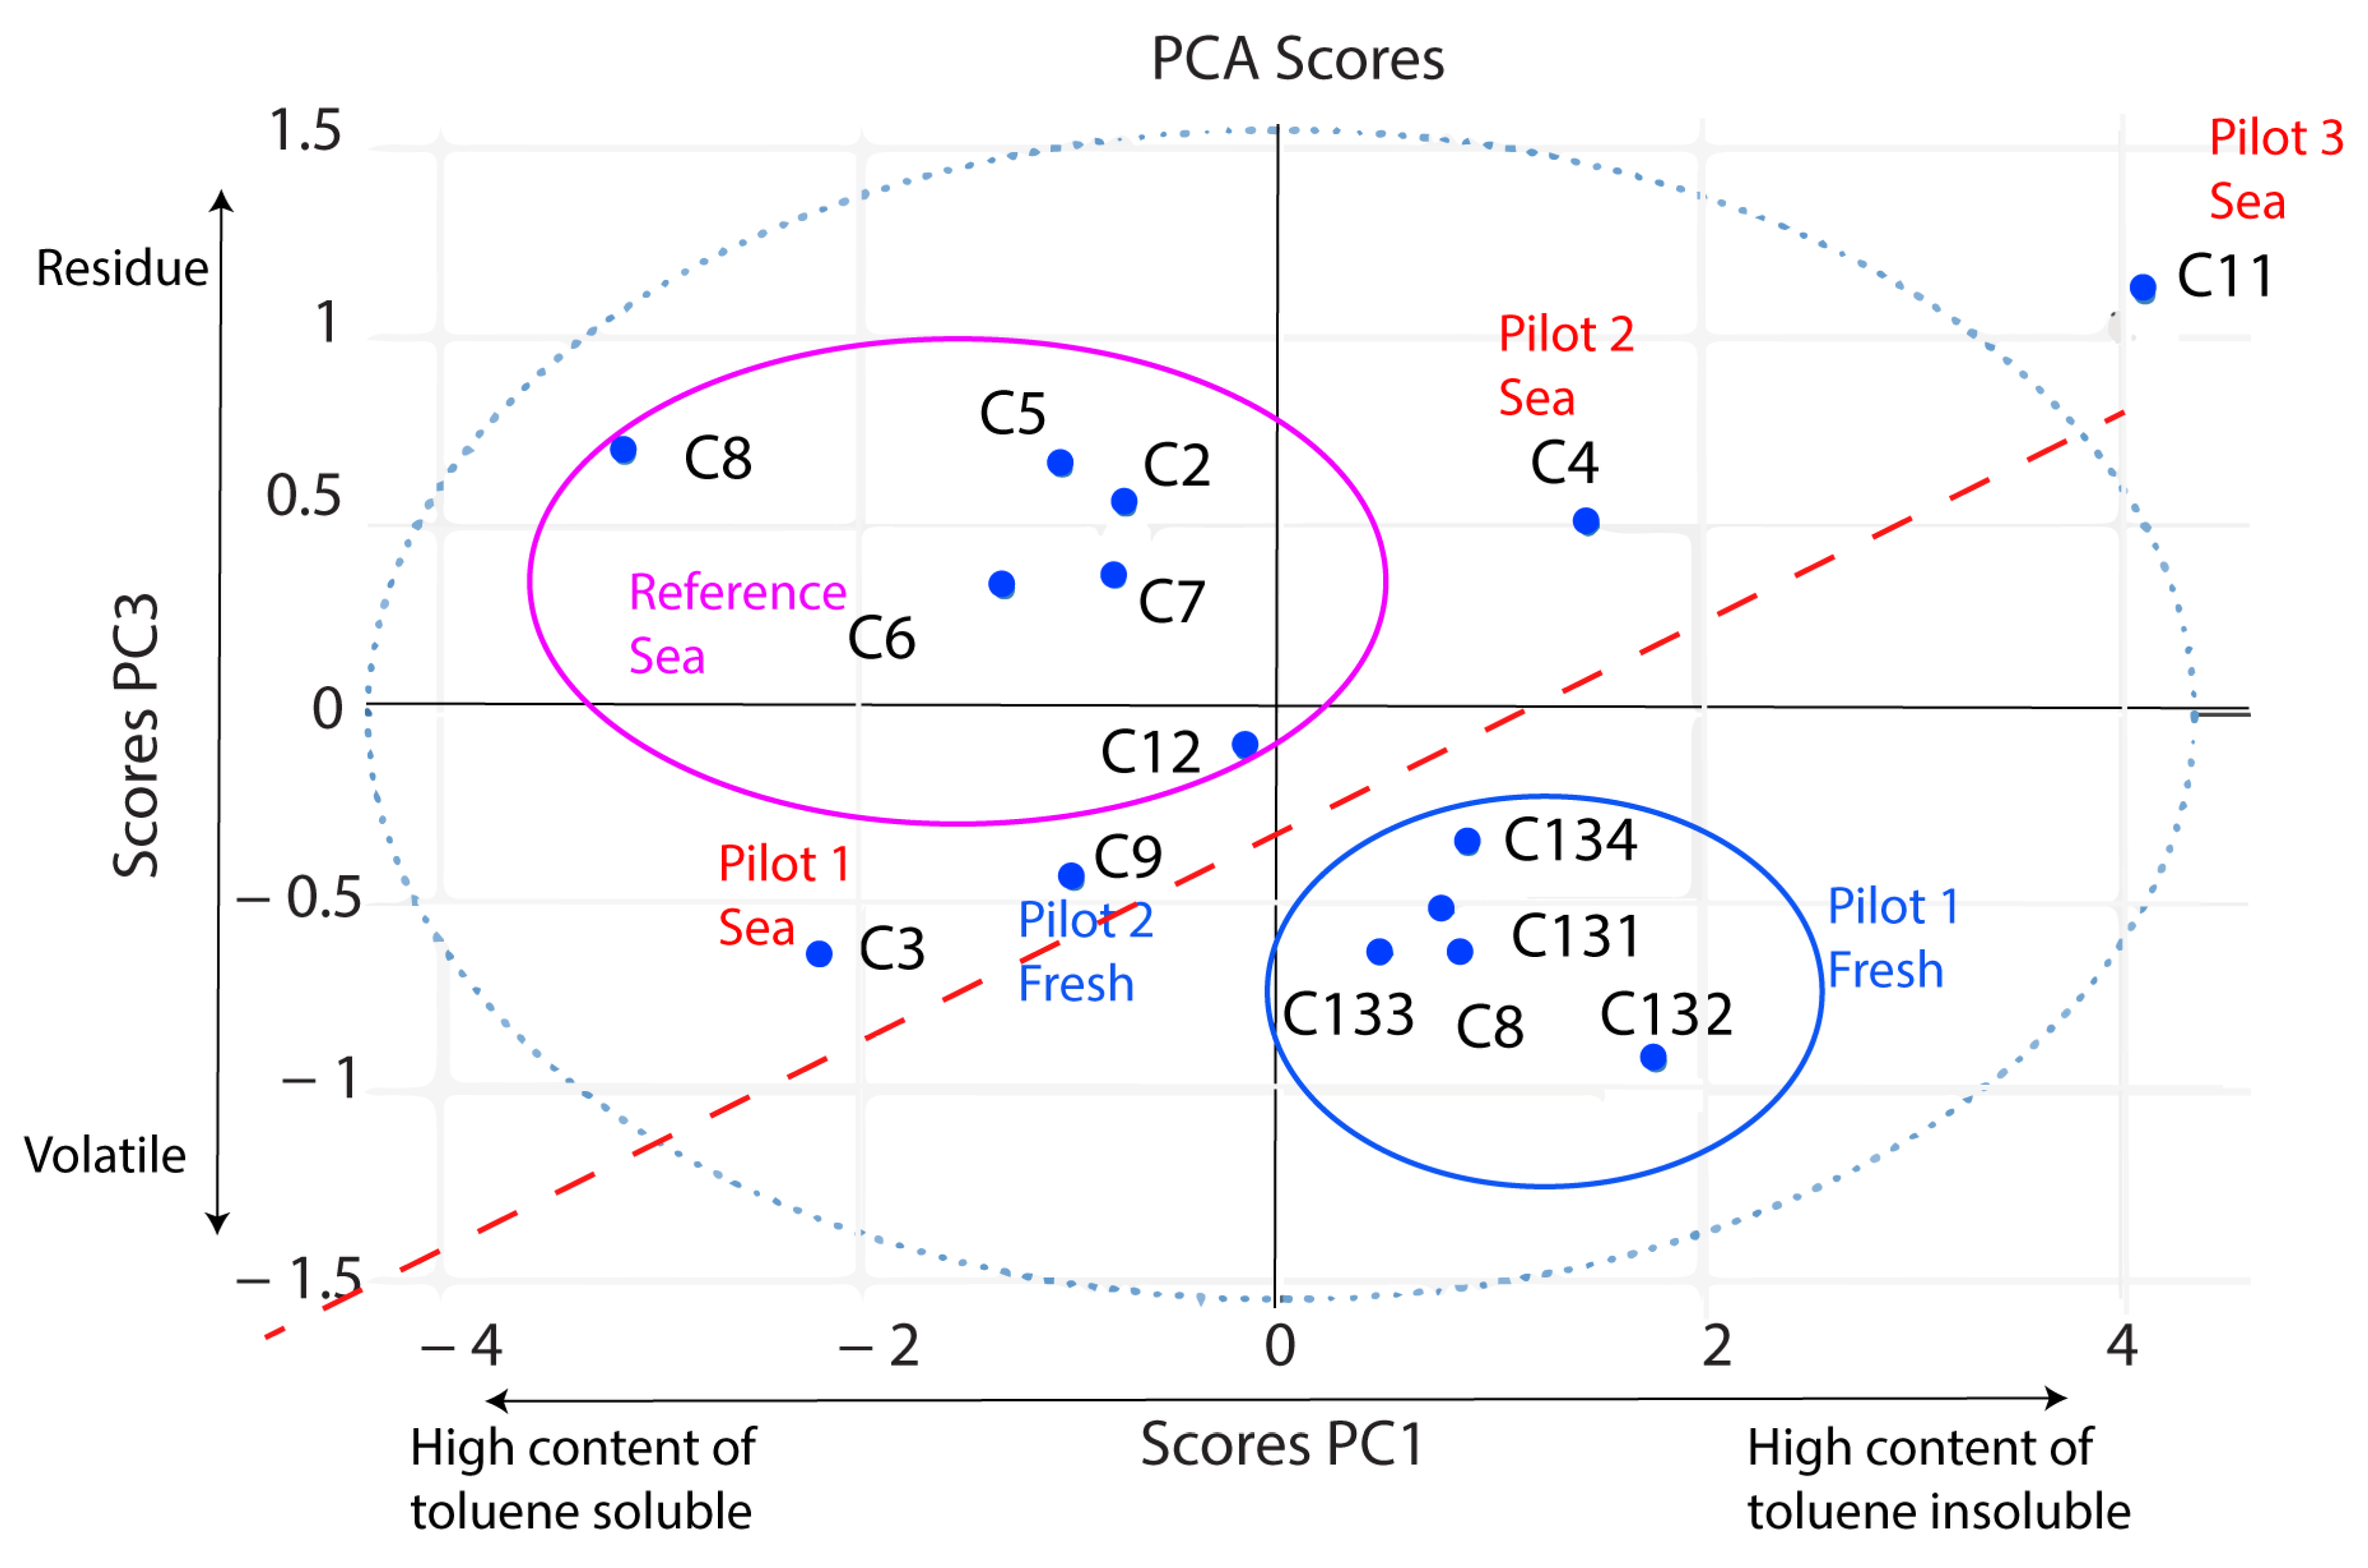
3.3. Biocrude Composition

The bio-oil (toluene soluble) and solid fractions were analyzed by TGA. The used temperature programs allowed for distinguishing light (150–540 °C) and heavy fractions (<540 °C) of bio-oil samples. For the solid sample, the analysis allowed for distinguishing the light polar fraction (100–950 °C) that evaporated under N2, the coke fraction that burned under oxygen, and the inorganic fraction that remained at the end of the analysis. These results, combined with the bio-oil yield, gave the composition of each biocrude (Table 4).
Principal component analysis (PCA) was performed on the data gathered in Table 4 for the 15 samples (Figure 7). PC1 explained 63.1% of the sample variance, which mainly depended on the solubility in toluene of the biocrude, whereby the toluene-soluble fraction contributed negatively and the toluene-insoluble fraction contributed positively. PC2 explained 25.2% of the sample variance, which mainly depended on the inorganic fraction that contributed negatively and the organic fraction that contributed positively (mainly coke fraction) (Figure 8). PC3 explained 8% of the sample variance, which depended mainly on the volatility, whereby light fractions contributed negatively and residue, coke, and inorganics contributed positively.
The most interesting representation was the PC 1/PC 3 biplot, which allowed sample clustering. In this plot, the expected composition of a good-quality biocrude should be in the lower left quadrant with a maximum content of light fraction soluble in toluene.
As shown in Table 4 and Figure 7, the composition of the different biocrudes was diverse. For example, the expected bio-oil light fraction ranged from 30% to 65%. Figure 7 highlights some clustering of samples according to water type (fresh or seawater) and cultivation area. In general, biocrude from freshwater algae was preferentially plotted under the diagonal red dotted line, while biocrude from marine algae was typically above the line. A possible explanation could be that algae from seawater have a very high inorganic fraction in dry matter, contributing to the solid or insoluble fraction of the biocrudes, while also reducing the soluble fraction. Both parameters (water type and cultivation area) probably induced differences in the biochemical composition of alga batches (Table 1), thus having an impact on the biocrude composition, as previously reported by other authors [3,7]. The very close compositions of biocrudes C13-1 and C13-4, coming from the same alga batch, seem to confirm this assumption. A comparison of Figure 7 as a function of alga batch biochemical composition shows that a high protein content frequently corresponded to a high toluene-insoluble content. This observation is in accordance with the results of Lu et al. [12], whereby yields higher in protein than carbohydrate resulted in biocrudes mainly composed of nitrogenated molecules, which could be very polar and insoluble in toluene.

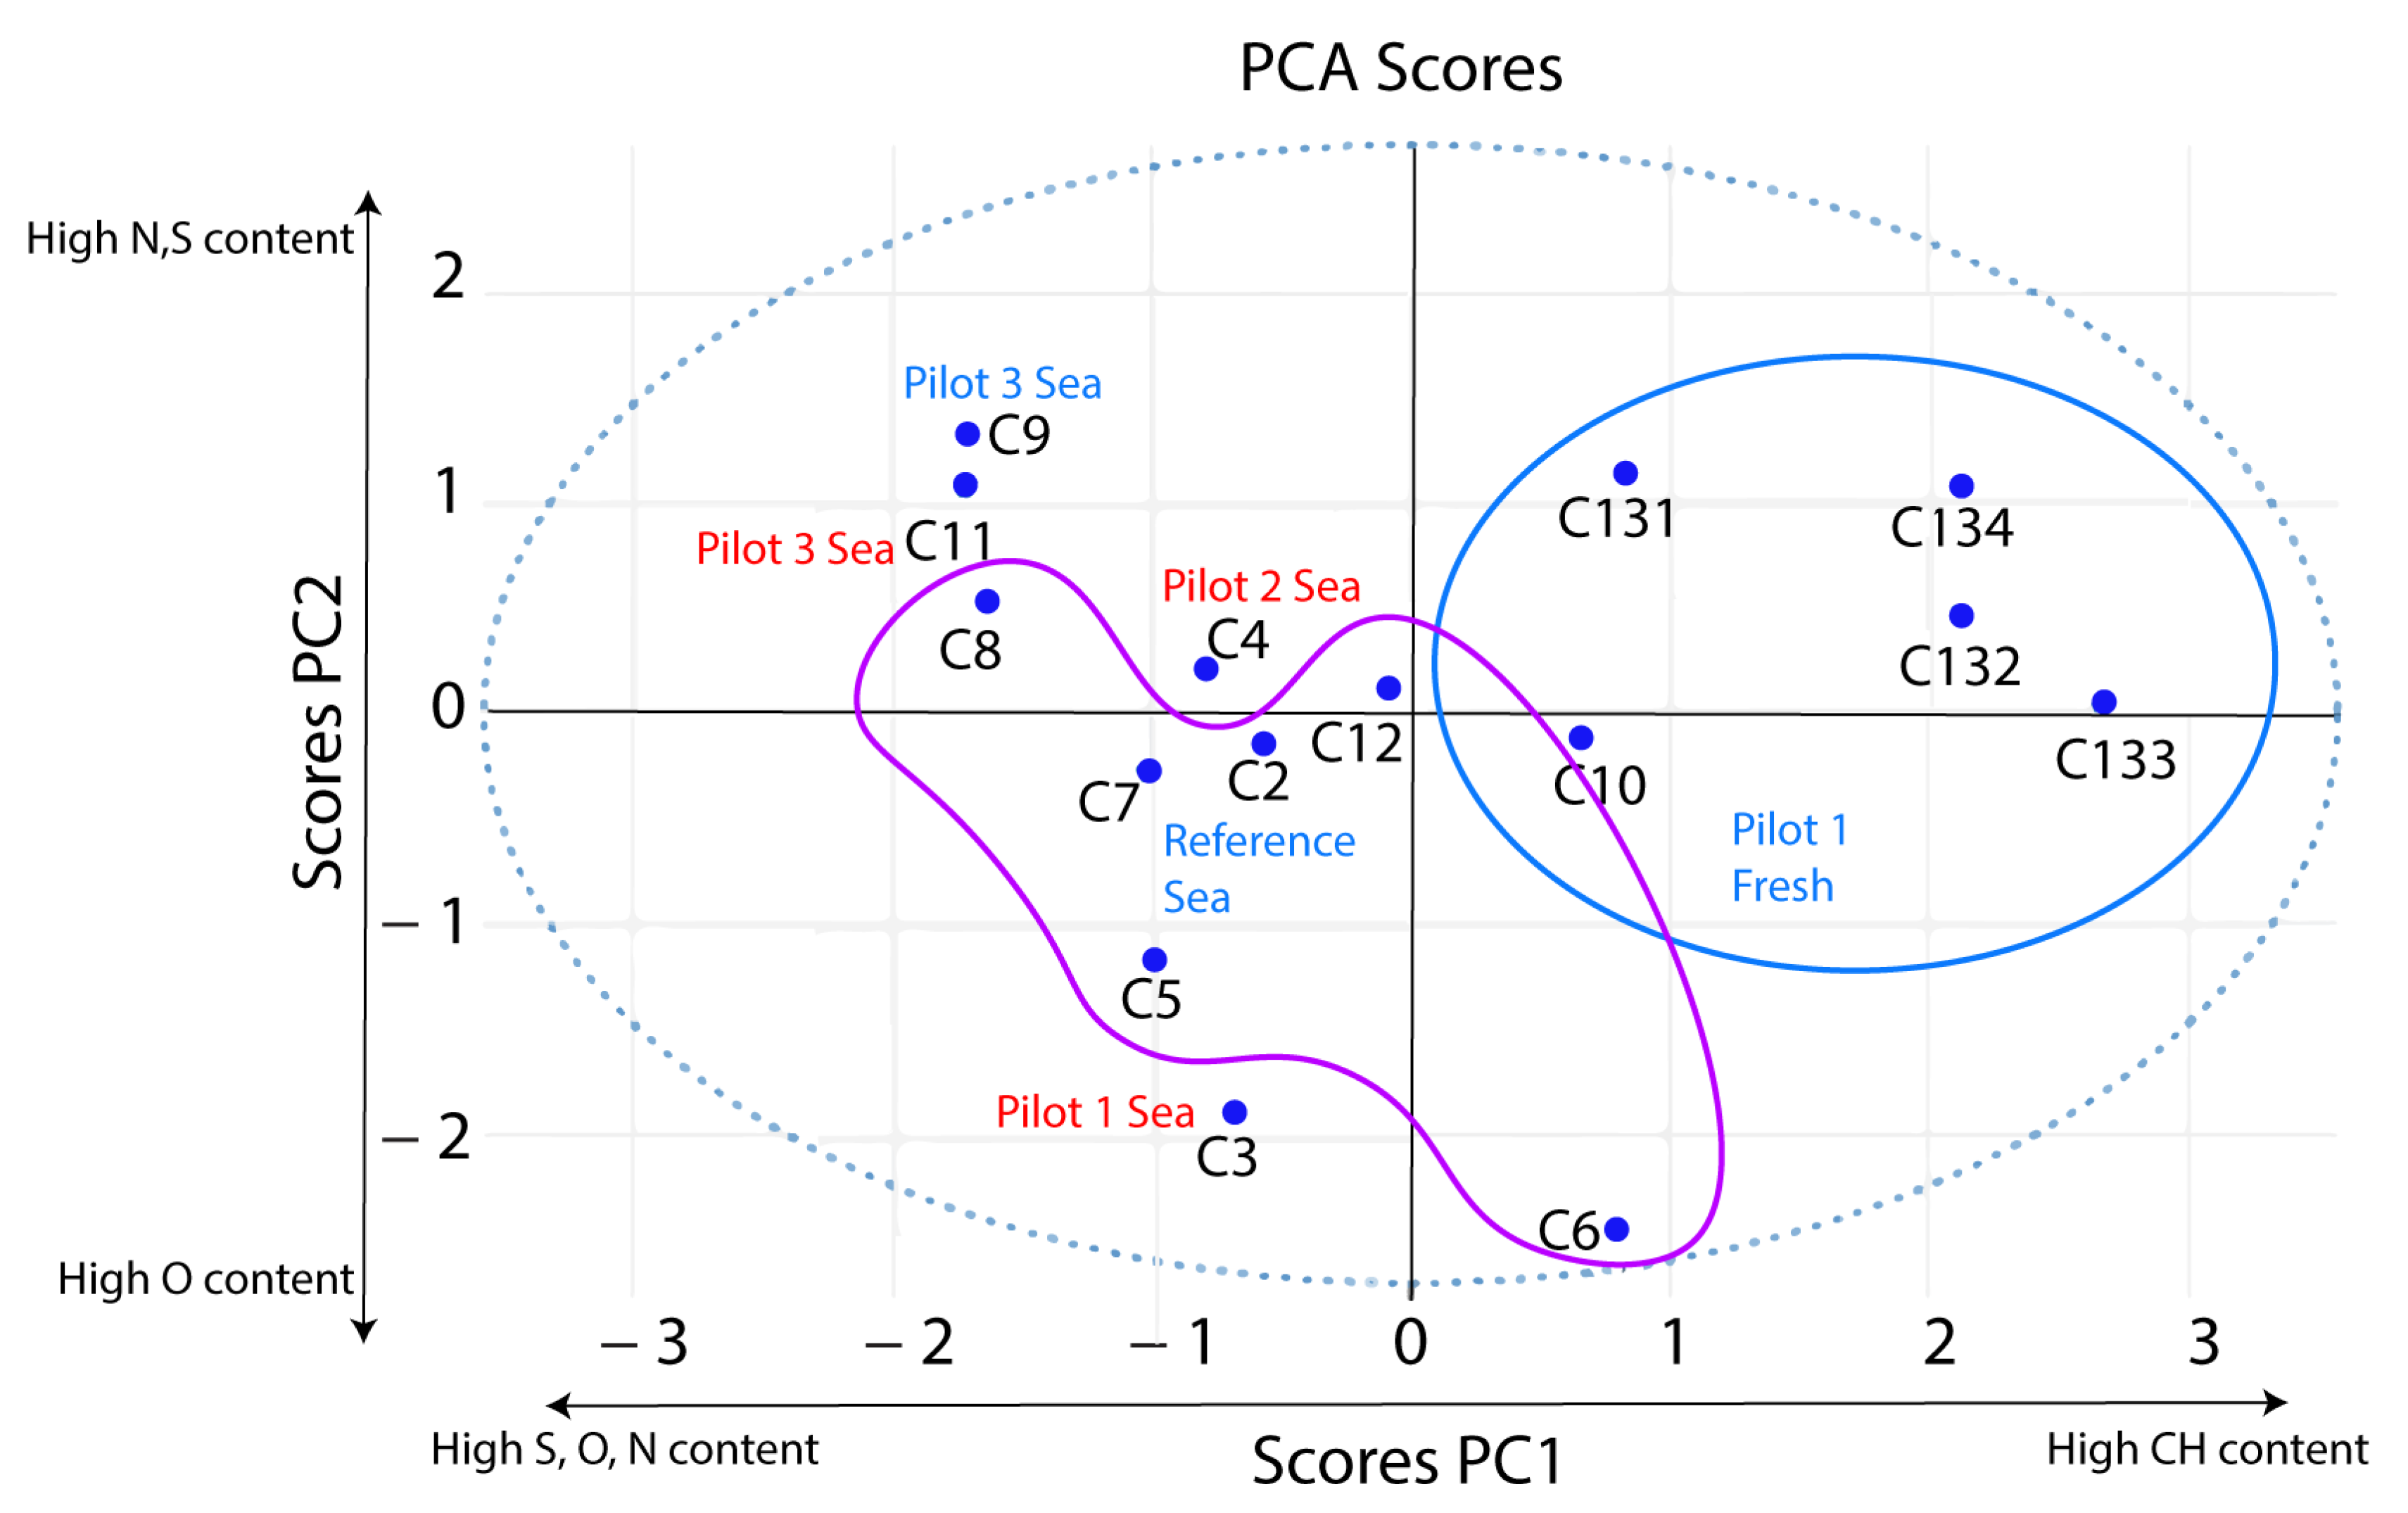
3.4. Bio-Oil Major Elements

Following the comparison of samples according to their composition, we focused on the bio-oil quality. The principal elemental composition of the bio-oil samples (i.e., the C, H, N, O, and S contents) is reported in Table 5.
For the 15 bio-oils analyzed, we obtained N/C ratios ranging from 0.01 to 0.06 and O/C ratios ranging from 0.05 to 0.16; these results are comparable to those obtained by other authors. Tian et al. reported the elemental composition results for various microalgae (from 1994 to 2011) in their review [3]; N/C values ranged from 0.05 to 0.1 and O/C ratios ranges from 0.1 to 0.3. The results are also comparable to those obtained by Eboibi et al. [20] and Faeth et al. [26].
As mentioned previously, PCA of the bio-oil C, H, N, S, and O contents (presented in Table 4 and Figure 8) seemingly clustered samples according to water type (fresh vs. sea). PC1 explained 42.7% of the sample variance, which mainly depended on C and H content that contributed positively and S, O, and, to a lesser extent, N that contributed negatively. PC2 explained 24.5% of sample variance, which mainly depended on N and S content that contributed positively.
As previously evidenced for biocrude composition and as already reported by other authors, the biochemical composition of alga batches and the protein content seemed to have an influence on N content and PC2. We could note that the bio-oil corresponding to alga batches having the greatest protein content (>39%) were on or above the red dotted line in Figure 7. In order to explore this difference at a molecular level, bio-oils C8 and C13-2 coming from sea and freshwater alga batches, respectively, were analyzed by electrospray Fourier transform ion cyclotron resonance mass spectrometry (ESI FT-ICR-MS). Initial results (see Figure S2, Supplementary Materials) evidenced a notable difference in the detected nitrogenated species (N1 and N2). Indeed, aliphatic N compounds were only detected in bio-oil from seawater, while bio-oil from freshwater only featured highly aromatic species. This can be explained by the higher protein content of the C13 batch compared to the C8 one.

3.5. Bio-Oil Minor Elements

The results of ICP-AES analysis of bio-oils for trace element quantitation are reported in Table 6.
Table 6 presents the data obtained by ICP-AES. As shown by other authors, alkaline (Na), alkaline earth (Ca, Mg), phosphorus (P), silica (Si), and metals (Fe, Cu, Ni, Co, Al) were found in bio-oils in various concentrations [20,27]. The PCA biplot obtained from the data given in Table 4 and Table 5 is given in Figure 9. PC1 explained 66.5% of the sample variance, which mainly depended on the Fe, P, and Si contents that contributed positively and the Mg and Ca contents that contributed negatively. PC2 explained 22.7% of the sample variance, which mainly depended on the Mg, Fe, and Ca contents that contributed positively and the P and Si contents that contributed negatively.
As shown previously, a clustering of samples appeared according to the water type, except for the C11 sample. Moreover, we could note that, in our case, water was eliminated from biocrude by distillation, probably leading to the concentration of water-soluble trace elements in the biocrudes and partly in bio-oils. This point is of particular importance because all these elements are undesirable in biofuel and could cause corrosion or catalyst-poisoning issues in a refinery. From this perspective, it was interesting to evaluate if these elements could be eliminated by water extraction. To this end, C4 bio-oil was diluted in toluene by a factor of 2 (v/v) and extracted using the same volume of deionized water. Due to its high heteroatom content, the C4 bio-oil led to a stable emulsion that was difficult to break. After decantation, the “water-washed” bio-oil was analyzed by ICP-AES. The results, given in Table 5, show that most of the elemental content was at least partially eliminated by liquid extraction with water. These results are coherent with those of Jiang and Savage [24], who studied the impact of different solvents for biocrude recovery on metal content. They found that contact with water allowed for diminishing the metal content, with the exception of iron, which yielded unsatisfactory results. We observed the same tendency, whereby iron and sodium contents remained significantly high after C4 washing (1187 and 73.9 mg·kg−1, respectively). Jarvis et al. previously reported a similar level of iron in HTL biocrudes obtained with Tetraselmis sp. and cyanobacteria [18]. An ultra-high-resolution mass spectrometric characterization of the samples was used for the identification of iron porphyrinic structures. Nickel and vanadium porphyrins are well-known impurities of fossil crude oil samples, as a catalyst poison and coke precursor, respectively. Indeed, Jarvis et al.’s upgrading study showed the same effect of iron porphyrins in biocrude [18]. Large molecules of iron were detected by gel permeation chromatography coupled to elemental detection (GPC-ICP-MS) and identified as iron porphyrins by FT-ICR-MS, most notably in sample C13.1. An example of the GPC-ICP-MS and DBE/C# map of N4Fe1 iron porphyrin compounds [18,28] is shown in Figure S3 (Supplementary Materials).

4. Conclusions

This work compared the quality of 15 different biocrudes produced by continuous HTL with alga batches obtained in realistic industrial conditions (open pond installed in an industrial area and fed with plant emissions). We observed highly variable yields of biocrudes and bio-oil for the different batches of algae. A too low organic matter content was unfavorable for biocrude production. Oil yields were mainly positively influenced by lipid or protein content and negatively influenced by the sugar fraction, along with a sufficient dry matter content and not too long a residence time. The composition of the biocrude sample correlated with different parameters. It seemingly depended on the alga biochemical composition and water type, as proposed by other authors. The protein content of algae seemingly decreased the desirable light bio-oil fraction, while it increased the nitrogen content of this fraction. Due to the well-known difficulty in removing nitrogen from biocrude, we can conclude that protein content has a negative impact on biocrude quality.
Alkaline, phosphorus, silica, and metals (particularly iron) were detected in all biocrude samples. Cultivation area (industrial environment vs. reference) seemed to have an influence on the trace element content. As previously observed by Jarvis and Savage, we evidenced that iron was present as porphyrinic molecular structures according to FT-ICR-MS. Preliminary speciation analysis by GPC-ICP-MS evidenced that iron porphyrins were present in HMW aggregates. Further speciation studies could help to understand the composition of these aggregates to support upgrading development studies.

Supplementary Materials

The following are available online at https://0-www-mdpi-com.brum.beds.ac.uk/article/10.3390/pr9091494/s1, Figure S1. Variation of the biochemical composition of alga batches throughout the project. Figure S2. FT-ICR-MS analysis of two different bio-oils, C8 and C13-2, coming from sea and freshwater, respectively. N1 and N2 classes are represented in DBE vs. C number. Figure S3. GPC-ICP-MS and DBE/C# map for N4Fe1 class detected in LDI+, in the C13-1 bio-oil sample.

Author Contributions

Conceptualization, A.R., J.-F.S., and C.B.-M.; methodology, A.R., J.-F.S., and C.B.-M.; software, J.H., and C.B.-M.; validation, P.G., C.A., and B.B.; investigation, A.R. and C.B.-M.; resources, A.R., J.-F.S., P.G., C.A., B.B., and M.H.-R.; data curation, J.M., J.H., and J.L.M.; writing—original draft preparation, C.B.-M.; writing—review and editing, B.B.; visualization, J.M., J.H., and C.B.-M.; supervision, C.B.-M.; project administration, A.R. and C.B.-M.; funding acquisition, A.R., J.-F.S., P.G., C.A., and B.B. All authors have read and agreed to the published version of the manuscript.

Funding

This work has been partially supported by University of Rouen Normandy, INSA Rouen Normandy, the Centre National de la Recherche Scientifique (CNRS), European Regional Development Fund (ERDF), Labex SynOrg (ANR-11-LABX-0029), Carnot Insitut I2C, the graduate school for research Xl-Chem (ANR-18-EURE-0020 XL CHEM), by Region Normandie and ADEME for VASCO2 project funding. J.M. thanks the European Research Council for funding via the ERC PrimChem project (grant agreement No. 636829) and access to a CNRS FTICR research infrastructure (FR3624).

Data Availability Statement

Not applicable.

Acknowledgments

The authors would like to thank all the VASCO2 project partners, Marseille Fos Port Authority, Coldep, Heliopur, Ifremer, CEA, Arcelor Mittal, KemOne, Solamat Merex, Aix-Marseille Metropolis, and Inovertis, for the microalga cultivation and very helpful discussions.

Conflicts of Interest

The authors declare no conflict of interest.

References

  1. Talec, A.; Philistin, M.; Ferey, F.; Walenta, G.; Irisson, J.-O.; Bernard, O.; Sciandra, A. Effect of Gaseous Cement Industry Effluents on Four Species of Microalgae. Bioresour. Technol. 2013, 143, 353–359. [Google Scholar] [CrossRef] [Green Version]
  2. Duarte, J.H.; de Morais, E.G.; Radmann, E.M.; Costa, J.A.V. Biological CO2 Mitigation from Coal Power Plant by Chlorella Fusca and Spirulina sp. Bioresour. Technol. 2017, 234, 472–475. [Google Scholar] [CrossRef]
  3. Tian, C.; Li, B.; Liu, Z.; Zhang, Y.; Lu, H. Hydrothermal Liquefaction for Algal Biorefinery: A Critical Review. Renew. Sustain. Energy Rev. 2014, 38, 933–950. [Google Scholar] [CrossRef]
  4. Guo, Y.; Yeh, T.; Song, W.; Xu, D.; Wang, S. A Review of Bio-Oil Production from Hydrothermal Liquefaction of Algae. Renew. Sustain. Energy Rev. 2015, 48, 776–790. [Google Scholar] [CrossRef]
  5. Changi, S.M.; Faeth, J.L.; Mo, N.; Savage, P.E. Hydrothermal Reactions of Biomolecules Relevant for Microalgae Liquefaction. Ind. Eng. Chem. Res. 2015, 54, 11733–11758. [Google Scholar] [CrossRef]
  6. Chaudry, S.; Bahri, P.A.; Moheimani, N.R. Pathways of Processing of Wet Microalgae for Liquid Fuel Production: A Critical Review. Renew. Sustain. Energy Rev. 2015, 52, 1240–1250. [Google Scholar] [CrossRef]
  7. Barreiro, D.L.; Prins, W.; Ronsse, F.; Brilman, W. Hydrothermal Liquefaction (HTL) of Microalgae for Biofuel Production: State of the Art Review and Future Prospects. Biomass Bioenergy 2013, 53, 113–127. [Google Scholar] [CrossRef]
  8. Couto, E.; Calijuri, M.L.; Assemany, P. Biomass Production in High Rate Ponds and Hydrothermal Liquefaction: Wastewater Treatment and Bioenergy Integration. Sci. Total Environ. 2020, 724, 138104. [Google Scholar] [CrossRef]
  9. González-Gálvez, O.D.; Bravo, I.N.; Cuevas-García, R.; Velásquez-Orta, S.B.; Harvey, A.P.; Cedeño Caero, L.; Ledesma, M.T.O. Bio-Oil Production by Catalytic Solvent Liquefaction from a Wild Microalgae Consortium. Biomass Conv. Bioref. 2020. [Google Scholar] [CrossRef]
  10. Ishizaki, R.; Noguchi, R.; Putra, A.S.; Ichikawa, S.; Ahamed, T.; Watanabe, M.M. Reduction in Energy Requirement and CO2 Emission for Microalgae Oil Production Using Wastewater. Energies 2020, 13, 1641. [Google Scholar] [CrossRef] [Green Version]
  11. Das, P.; Thaher, M.I.; Khan, S.; AbdulQuadir, M.; Chaudhary, A.K.; Alghasal, G.; Al-Jabri, H. Comparison of Biocrude Oil Production from Self-Settling and Non-Settling Microalgae Biomass Produced in the Qatari Desert Environment. Int. J. Environ. Sci. Technol. 2019, 16, 7443–7454. [Google Scholar] [CrossRef] [Green Version]
  12. Lu, J.; Liu, Z.; Zhang, Y.; Savage, P.E. Synergistic and Antagonistic Interactions during Hydrothermal Liquefaction of Soybean Oil, Soy Protein, Cellulose, Xylose, and Lignin. ACS Sustain. Chem. Eng. 2018, 6, 14501–14509. [Google Scholar] [CrossRef]
  13. Liu, H.; Chen, Y.; Yang, H.; Gentili, F.G.; Söderlind, U.; Wang, X.; Zhang, W.; Chen, H. Conversion of High-Ash Microalgae through Hydrothermal Liquefaction. Sustain. Energy Fuels 2020, 4, 2782–2791. [Google Scholar] [CrossRef]
  14. Xu, D.; Wang, Y.; Lin, G.; Guo, S.; Wang, S.; Wu, Z. Co-Hydrothermal Liquefaction of Microalgae and Sewage Sludge in Subcritical Water: Ash Effects on Bio-Oil Production. Renew. Energy 2019, 138, 1143–1151. [Google Scholar] [CrossRef]
  15. Torri, C.; Fabbri, D.; Garcia-Alba, L.; Brilman, D.W.F. Upgrading of Oils Derived from Hydrothermal Treatment of Microalgae by Catalytic Cracking over H-ZSM-5: A Comparative Py–GC–MS Study. J. Anal. Appl. Pyrolysis 2013, 101, 28–34. [Google Scholar] [CrossRef]
  16. Li, Z.; Savage, P.E. Feedstocks for Fuels and Chemicals from Algae: Treatment of Crude Bio-Oil over HZSM-5. Algal Res. 2013, 2, 154–163. [Google Scholar] [CrossRef]
  17. Patel, B.; Arcelus-Arrillaga, P.; Izadpanah, A.; Hellgardt, K. Catalytic Hydrotreatment of Algal Biocrude from Fast Hydrothermal Liquefaction. Renew. Energy 2017, 101, 1094–1101. [Google Scholar] [CrossRef]
  18. Jarvis, J.M.; Sudasinghe, N.M.; Albrecht, K.O.; Schmidt, A.J.; Hallen, R.T.; Anderson, D.B.; Billing, J.M.; Schaub, T.M. Impact of Iron Porphyrin Complexes When Hydroprocessing Algal HTL Biocrude. Fuel 2016, 182, 411–418. [Google Scholar] [CrossRef] [Green Version]
  19. Pedersen, T.H.; Jensen, C.U.; Sandström, L.; Rosendahl, L.A. Full Characterization of Compounds Obtained from Fractional Distillation and Upgrading of a HTL Biocrude. Appl. Energy 2017, 202, 408–419. [Google Scholar] [CrossRef] [Green Version]
  20. Eboibi, B.E.-O.; Lewis, D.M.; Ashman, P.J.; Chinnasamy, S. Hydrothermal Liquefaction of Microalgae for Biocrude Production: Improving the Biocrude Properties with Vacuum Distillation. Bioresour. Technol. 2014, 174, 212–221. [Google Scholar] [CrossRef] [PubMed]
  21. Zhou, Y.; Hu, C. Catalytic Thermochemical Conversion of Algae and Upgrading of Algal Oil for the Production of High-Grade Liquid Fuel: A Review. Catalysts 2020, 10, 145. [Google Scholar] [CrossRef] [Green Version]
  22. Chen, W.-T.; Tang, L.; Qian, W.; Scheppe, K.; Nair, K.; Wu, Z.; Gai, C.; Zhang, P.; Zhang, Y. Extract Nitrogen-Containing Compounds in Biocrude Oil Converted from Wet Biowaste via Hydrothermal Liquefaction. ACS Sustain. Chem. Eng. 2016, 4, 2182–2190. [Google Scholar] [CrossRef]
  23. Jiang, J.; Serago, J.J.; Torres, K.; Rapp, E.; Savage, P.E. Fate of Iron during Hydrothermal Liquefaction of Hemin. J. Supercrit. Fluids 2020, 157, 104705. [Google Scholar] [CrossRef]
  24. Jiang, J.; Savage, P.E. Using Solvents To Reduce the Metal Content in Crude Bio-Oil from Hydrothermal Liquefaction of Microalgae. Ind. Eng. Chem. Res. 2019, 58, 22488–22496. [Google Scholar] [CrossRef]
  25. He, Z.; Xu, D.; Liu, L.; Wang, Y.; Wang, S.; Guo, Y.; Jing, Z. Product Characterization of Multi-Temperature Steps of Hydrothermal Liquefaction of Chlorella Microalgae. Algal Res. 2018, 33, 8–15. [Google Scholar] [CrossRef]
  26. Faeth, J.L.; Savage, P.E.; Jarvis, J.M.; McKenna, A.M.; Savage, P.E. Characterization of Products from Fast and Isothermal Hydrothermal Liquefaction of Microalgae. AIChE J. 2016, 62, 815–828. [Google Scholar] [CrossRef]
  27. Jena, U.; Das, K.C.; Kastner, J.R. Effect of Operating Conditions of Thermochemical Liquefaction on Biocrude Production from Spirulina Platensis. Bioresour. Technol. 2011, 102, 6221–6229. [Google Scholar] [CrossRef]
  28. Ramirez-Pradilla, J.S.; Blanco-Tirado, C.; Hubert-Roux, M.; Giusti, P.; Afonso, C.; Combariza, M.Y. Comprehensive Petroporphyrin Identification in Crude Oils Using Highly Selective Electron Transfer Reactions in MALDI-FTICR-MS. Energy Fuels 2019, 33, 3899–3907. [Google Scholar] [CrossRef]
Figure 1. Raceway open pond culture of VAlorization and Storage of CO2 (VASCO2) project. The columns, developed by Coldep, allowed water circulation, CO2 dissolution, and microalga harvesting.
Processes 09 01494 g001
Figure 2. Examples of temperature and pressure profiles during an HTL conversion (batch C7).
Processes 09 01494 g002
Figure 3. Hierarchical clustered heatmap representing the z-scores for each class of compounds obtained for the 15 alga samples.
Processes 09 01494 g003
Figure 4. Conversion yields: percentage of carbon in aqueous phase (a), percentage in weight of biocrude (b), and percentage in weight after toluene extraction for bio-oil (c), following the scheme of bio-oil production (d). Note that due to problems arising in the first batch, there is no C1 biocrude.
Processes 09 01494 g004
Figure 5. Biocrude yields as a function of initial carbon content (a) and oil yields (b).
Processes 09 01494 g005
Figure 6. Oil yields as a function of parameter A (A = abs((P − L)/S × dm × F), where P is the protein content of the organic matter, L is the lipid content of the organic matter, S is the sugar content of the organic matter, dm is the dry matter of the alga paste, and F is the flow rate during the experiment).
Processes 09 01494 g006
Figure 7. PC1/PC3 biplot of the 15 biocrudes (Table 3).
Processes 09 01494 g007
Figure 8. PCA biplot of the bio-oil C, H, N, S, and O contents presented in Table 4.
Processes 09 01494 g008
Figure 9. PCA biplot of the bio-oil elemental composition presented in Table 5 and Table 6.
Processes 09 01494 g009
Table 1. List of alga batches.
Harvest Batch NameWaterSite of Microalga CultivationPeriod of Harvesting
C1SeaReferenceWinter 2016
C2SeaReferenceSpring 2017
C3SeaPilot 1Spring 2017
C4SeaPilot 2Summer 2017
C5SeaReferenceSummer 2017
C6SeaReferenceSummer 2017
C7SeaReferenceSpring 2018
C8SeaReferenceSpring 2018
C9FreshPilot 2Summer 2018
C10FreshPilot 1Summer 2018
C11SeaPilot 3Summer 2018
C12SeaReferenceSpring 2018
C13FreshPilot 1Winter 2018
Table 2. Quantities and flow rates for each run.
Harvest Batch Name% Dissolved MatterProcessed Volume (mL)Flow Rate (mL/h)
C15%45002000
C213%40002000
C312%28692000
C48%34001500
C59%78001500
C68%80001500
C77%12,4001500
C87%85001500
C99%97101500
C1014%80561500
C1115%26051500
C128%80001500
C13-19%14,2651700
C13-27.4%83001700
C13-36%62551500
C13-48%99801700
Table 3. Composition of converted alga batches.
Harvest Batch Name% Dry Matter% Mineral Mater MS% Lipid% Protein% Carbohydrate
C15%68%25.712.661.7
C213%36%18.929.751.4
C312%29%19.910.170.0
C48%31%15.917.966.3
C59%38%18.97.174.0
C68%47%18.926.754.4
C77%31%13.029.457.7
C87%33%13.021.765.3
C99%12%20.941.637.5
C1014%-16.739.543.8
C1115%39%18.348.337.5
C127%36%13.037.150.0
C1314%16%19.339.641.1
C13-19%16%19.339.641.1
C13-27%16%19.339.641.1
C13-36%17%19.339.641.1
C13-48%16%19.339.641.1
Table 4. Biocrude composition obtained by TGA (* corresponds to biocrude from the same alga batch).
Bio-Oil (Toluene Soluble)Char (Toluene Insoluble)
Harvest Batch NameBio-Oil Light Fraction (%)Bio-Oil Heavy Fraction (%)Char Light Fraction (%)Coke (%)Inorganics (%)
C241.413.19.73.133.5
C365.511.59.65.77.4
C429.79.519.58.033.3
C544.014.510.24.029.2
C657.412.112.211.06.9
C749.213.616.29.310.6
C860.419.48.45.95.3
C957.911.918.49.91.4
C1043.17.821.78.118.7
C1116.23.124.916.538.5
C1248.711.219.510.18.9
C13-1 *40.47.016.95.130.6
C13-2 *36.94.822.66.728.6
C13-3 *43.07.516.74.827.6
C13-4 *38.07.717.75.430.7
* Biocrude from the same alga batch.
Table 5. C, H, O, N, and S composition of bio-oils.
Harvest Batch NameC (wt.%)H (wt.%)O (wt.%)N (wt.%)S (wt.%)H/C (mol.%/mol.%)N/C (mol.%/mol.%)O/C (mol.%/mol.%)
C273.59.09.74.40.31.460.050.10
C373.39.411.33.50.31.530.040.12
C473.89.39.73.71.21.500.040.10
C571.58.79.03.50.31.450.040.09
C674.99.510.62.50.21.510.030.11
C773.78.49.13.60.91.360.040.09
C874.18.49.54.01.31.350.050.10
C973.99.210.34.81.41.480.060.10
C1074.59.69.54.10.31.540.050.10
C10 gasoline84.78.95.2 *1.10.081.250.010.05
C10 diesel69.49.515.14.90.51.630.060.16
C1173.49.210.24.71.31.490.050.10
C1275.19.19.94.30.51.440.050.10
C13-175.010.09.44.80.51.590.050.09
C13-275.910.38.83.70.51.620.040.09
C13-377.99.98.83.10.51.510.030.08
C13-476.010.38.64.20.41.610.050.08
* Obtained by difference.
Table 6. Trace element content obtained according to ICP-AES.
Harvest Batch NameElement Concentration in mg·kg−1
AlCaCoCuFeKMgNaNiPSi
C214.5490741.82224.516881509.438216.2
C3312144.434.93594.5168224012.870.315.7
C45.832215.270.33116<420624826.566<5
Water-washed C41.4145.627.21187<42.173.910.41838.2
C523.8282959.1461<4165715214.287.631.3
C63.81045.778.8210<454926121.5111<5.0
C714.43593.736.4222<450142238.921842.5
C816.23692.618.2138<462113811.316920.2
C9<37.35.882.1170<44.921816.54014.4
C105.231710.2111537<440.443727.1409392
C113.4<5.013.917.1918<4<2.032815.8138847
C1211.4466<5.042.8154<449924011.4304116
C13-16.7<516.72002381<4<228651.1622618
C13-26.314.218.11811263<47.728658.7893543
C13-35.1<513.11211167<4<216931.6757413
C13-47.65.717.41751634<43.727545.4902579
Publisher’s Note: MDPI stays neutral with regard to jurisdictional claims in published maps and institutional affiliations.

