Article

Synthesis of Ti Powder from the Reduction of TiCl4 with Metal Hydrides in the H2 Atmosphere: Thermodynamic and Techno-Economic Analyses

by
Mohammad Rezaei Ardani
1,
Sheikh Abdul Rezan Sheikh Abdul Hamid
1,*,
Dominic C. Y. Foo
2,* and
Abdul Rahman Mohamed
3
1
School of Materials and Mineral Resources Engineering, Universiti Sains Malaysia, Nibong Tebal 14300, Penang, Malaysia
2
Department of Chemical and Environmental Engineering, Centre of Excellence for Green Technologies, University of Nottingham Malaysia, Semenyih 43500, Selangor, Malaysia
3
School of Chemical Engineering, Universiti Sains Malaysia, Nibong Tebal 14300, Penang, Malaysia
*
Authors to whom correspondence should be addressed.
Submission received: 30 June 2021 / Revised: 21 August 2021 / Accepted: 25 August 2021 / Published: 1 September 2021
(This article belongs to the Special Issue Redesign Processes in the Age of the Fourth Industrial Revolution)

Abstract

:
Titanium hydride (TiH2) is one of the basic materials for titanium (Ti) powder metallurgy. A novel method was proposed to produce TiH2 from the reduction of titanium tetrachloride (TiCl4) with magnesium hydride (MgH2) in the hydrogen (H2) atmosphere. The primary approach of this process is to produce TiH2 at a low-temperature range through an efficient and energy-saving process for further titanium powder production. In this study, the thermodynamic assessment and technoeconomic analysis of the process were investigated. The results show that the formation of TiH2 is feasible at low temperatures, and the molar ratio between TiCl4 and metal hydride as a reductant material has a critical role in its formation. Moreover, it was found that the yield of TiH2 is slightly higher when CaH2 is used as a reductant agent. The calculated equilibrium composition diagrams show that when the molar ratio between TiCl4 and metal hydrides is greater than the stoichiometric amount, the TiCl3 phase also forms. With a further increase in this ratio to greater than 4, no TiH2 was formed, and TiCl3 was the dominant product. Furthermore, the technoeconomic study revealed that the highest return on investment was achieved for the production scale of 5 t/batch of Ti powder production, with a payback time of 2.54 years. The analysis shows that the application of metal hydrides for TiH2 production from TiCl4 is technically feasible and economically viable.

1. Introduction

In the past decade, the rapid growth in aerospace, power generation, and biomedical industries has resulted in significant attention on the industry of titanium (Ti) and its alloys. Titanium can be used in severe conditions such as high temperature and pressure and a corrosive environment. Moreover, it has high specific strength, toughness, and biocompatibility in the human body, making it a unique choice for medical implants [1,2]. Unfortunately, the growth in the application of titanium and its alloys (compared to similar metals such as aluminum and high-alloy steels) has been affected by its production costs [3,4].
Since the invention of the Kroll process for the production of titanium, it has been the primary practical production method in the industry [5]. However, this method has several drawbacks, such as long production time, elevated production temperature, and significant energy consumption [6]. Another major obstacle in producing low-cost titanium products is that the Kroll process final output is titanium sponge. It was reported that the total cost of traditional titanium components includes about 38% for the Ti sponge production via the traditional Kroll process, 15% related to Ti sponge refining, and the remaining 47% for the machining step, which produced almost 75% of the Ti sponge scrap [7]. Therefore, it was suggested to use powder metallurgy techniques such as additive manufacturing to produce near-net-shape products. For this purpose, the Ti sponge should be converted to Ti powder through other methods such as the hydride-dehydride (HDH) process, which is also an expensive process for the production of titanium powder [8,9].
For the mentioned reasons, many studies were conducted to introduce new techniques for Ti powder production. The two main precursors for Ti production are TiCl4 and TiO2. It is noteworthy that TiCl4 can be synthesized through the carbochlorination of TiO2, which is a fundamental concept of the TiRO method to produce Ti metal [10], or the ADMA process to synthesize TiH2 powder [9]. Other potential methods are the Fray–Farthing–Chen Cambridge [11], Armstrong [12], Council for Scientific and Industrial Research Ti process [13], direct reduction of titanium slag process [14], and hydrogen-assisted magnesiothermic reduction (HAMR) [15]. Moreover, a molten salt method using TiS2 and TiO2 via the Ono and Suzuki process led the way to cheaper Ti metal powder production [16,17,18]. It was reported that the recently reported HAMR process could reduce energy consumption to about 62% of the Kroll process [11]. It should be noted that Ti has a high chemical affinity with oxygen, and it is more difficult to remove the oxygen from TiO2 compared to reducing chlorine from TiCl4. Furthermore, during the reduction of TiO2 to Ti, the synthesized byproducts of oxides are challenging to remove due to their high melting point. On the other hand, the chloride species formed as byproducts during the reduction of TiCl4 can be easily removed. Therefore, TiCl4 is more favorable as a precursor for continuous production.
One of the primary mineral sources for the production of Ti is ilmenite, which is a titanium-iron oxide with the main chemical phase of FeTiO3. Ilmenite minerals represent the most available Ti resources, with about 90% of world consumption of Ti mineral [19]. It was reported that the earth’s resources of ilmenite, rutile, and anatase are more than 2 billion tons. Traditionally, ilmenite is used to produce upgraded TiO2 [19]. However, previous studies [20,21] have shown that high-quality TiOxCyNz could be produced from ilmenite through low-temperature chlorination. In this method, FeTiO3 is reduced to TiOxCyNz under a mixture of H2–N2 gas and is subsequently purified via aeration leaching (Becher process) with ammonium chloride (NH4Cl) lixiviant to remove metallic iron. The obtained TiOxCyNz is then chlorinated at 400 °C to produce TiCl4 gas [22,23]. The author proposed directly reacting the obtained TiCl4 gas with metal hydrides such as MgH2 to produce TiH2 powder at low-temperature ranges under the hydrogen (H2) atmosphere [24,25,26]. The TiH2 powder can then transform into Ti powder through the dehydrogenation process in a vacuum. The primary benefit of producing TiH2 as an intermediate component is that the Ti powder can be produced with shallow oxygen content [27]. This phase is insoluble in water and diluted acid, which allows it to be separated from other products via acid leaching [28].
The feasibility of the proposed method was analyzed through chemical reactions involved in the production method and the obtained economic parameter. Technoeconomic analysis was also carried out using the SuperPro Designer software. The purpose of such analysis is to identify a production scale that has attractive economic performance. It is an important step in process development and commercialization. Data of laboratory-scale experimental may be used to perform process simulation study prior to pilot-scale testing. In the process industry, various technoeconomic works have been reported with the use of process simulation tools. For instance, Granjo et al. [29] made use of Aspen Plus and Monte Carlo simulation to evaluate different manufacturing methods of sodium methoxide. More recent works on technoeconomic analysis based on Aspen Plus simulation have been reported for supercritical CO2 extraction of Eucalyptus globulus bark [30], chitin nanomaterials production [31], and anaerobic digestion of sugarcane vinasses for biogas production [32]. Moreover, there were authors who reported the use of SuperPro Designer for technoeconomic analysis of various biochemical, pharmaceutical, and food processes. Some of the early works were reported by Petrides and coworkers [33] for pharmaceutical processes. Later works on SuperPro Designer were reported for debottlenecking studies, for pharmaceuticals [34,35], and for fine chemicals [36]. More recently, SuperPro Designer was used for technoeconomic analysis for various manufacturing processes of chemicals, biochemicals, and food. These include the production of cocoa butter [37], monoclonal antibody [38], biodiesel [39], nanomaterials [40], catechin [41], biomass pyrolysis products [42], and thorium extraction from monazite [43]. It is also worth noting that Monte Carlo simulations were also reported for use in some of the above works where SuperPro Designer was utilized (e.g., [38,40]). This allows for the identification of important parameters that affect the economic characteristics of the process.
The current study attempts to address the thermodynamic, operational, and economic evaluation of the TiCl4 reduction process with MgH2 under H2 atmosphere for the production of TiH2, which could be further dehydrogenated to Ti powder. The thermodynamic assessment was used to study the effect of temperature, partial pressure, and the molar ratio of the TiCl4 to reductant on the formation efficiency of TiH2. Economic analysis was investigated for several production scales in order to identify critical economic parameters such as production revenue and gross margin. Moreover, sensitivity analyses were performed to evaluate the effect of different operating parameters on the economic performances of the selected production scale.

2. Materials and Methods

The processing cycle in the present study, developed for the production of Ti powder from ilmenite, is shown in Figure 1. In the first step, the ilmenite is reduced under H2-N2 atmosphere to convert iron oxides present in the ilmenite to metallic iron. In the subsequent step, metallic iron is separated from the nitrided ilmenite through aeration leaching (Becher process). Following the filtration process, the leftover powder is TiOxCyNz which can be employed in the chlorination process. The product of the chlorination process is TiCl4 gas. The complete explanation of the reduction and chlorination process of ilmenite is discussed elsewhere [20,21,22]. The produced TiCl4 liquid is converted to gas above 150 °C and reacted with MgH2 to synthesize TiH2 powder via Equation (1). The TiH2 can be separated from reaction byproducts through acid leaching and washing with distilled water to remove the MgCl2. Next, the filtered TiH2 powder is dried for 12 h in an oven, and it can be converted to Ti powder via heating under Ar gas for dehydrogenation. Details of the latter process are listed elsewhere [44,45].
TiCl 4 g   +   2 MgH 2 = TiH 2 +   2 MgCl 2 +   H 2   g Δ G ° = 495.920 + 0.065 T   kJ / mol

2.1. Thermodynamic Calculation

Previous studies [46,47] have discussed the thermodynamic principles of iron removal from nitride ilmenite. This study investigated the thermodynamic equilibrium of TiH2 synthesis from TiCl4 using MgH2 as a reductant. This calculation was helpful for studying the possible species formation during the reaction. The HSC Chemistry v6.0.0 software (Outokumpu Research Oy, Tornio, Finland) was used for thermodynamic analysis and calculations. Thermochemical calculations are valuable tools for developing new chemical processes and mechanisms. This software provides powerful calculation methods to investigate different variables’ effects on the chemical system at equilibrium [48].

2.2. Synthesis Process

In previous studies [21,22], the preparation of TiCl4 gas from ilmenite was elaborated. In the current study, the TiH2 was synthesized from TiCl4 gas reacted with the MgH2 powder at 500 °C for 12 h at the lab scale. Our previous attempts to synthesize TiH2 at a temperature between 250 and 500 °C indicated that higher temperatures positively impacted the formation of TiH2 [24,25,26,27,28]. The reduction products were then washed with water and diluted HCl to separate TiH2 powder from the reaction byproducts. The X-ray diffraction (XRD) technique was employed for the study of phase evolution after the reduction process using Cu-Kα radiation (λ = 1.5404 Å, Bruker D8-advance, Billerica, MA, USA). The morphology and surface elemental analysis of the powder in each experimental step was studied with a field emission scanning electron microscopy equipped with electron dispersive X-ray spectroscopy (FESEM/EDX, Leo Supra 35VP, Oberkochen, Baden-Württemberg, Germany).

2.3. Economic Evaluation

In order to investigate the commercialization potential of the proposed method for the production of Ti metal powder, the technoeconomic assessment (TEA) was conducted using the SuperPro Designer software v8.5 [49]. The TEA calculates the production expenses, technology, and scaling-up issues of the product. The effect of individual economic parameters, i.e., costs of raw material, equipment costs, and energy consumption, on the capital cost investment of a pilot plant was evaluated. The economic performance was investigated for the three production scales, i.e., 1000 kg (1 t/batch), 5000 kg (5 t/batch), and 10,000 kg (10 t/batch) per batch of the final product (Ti powder).

3. Results

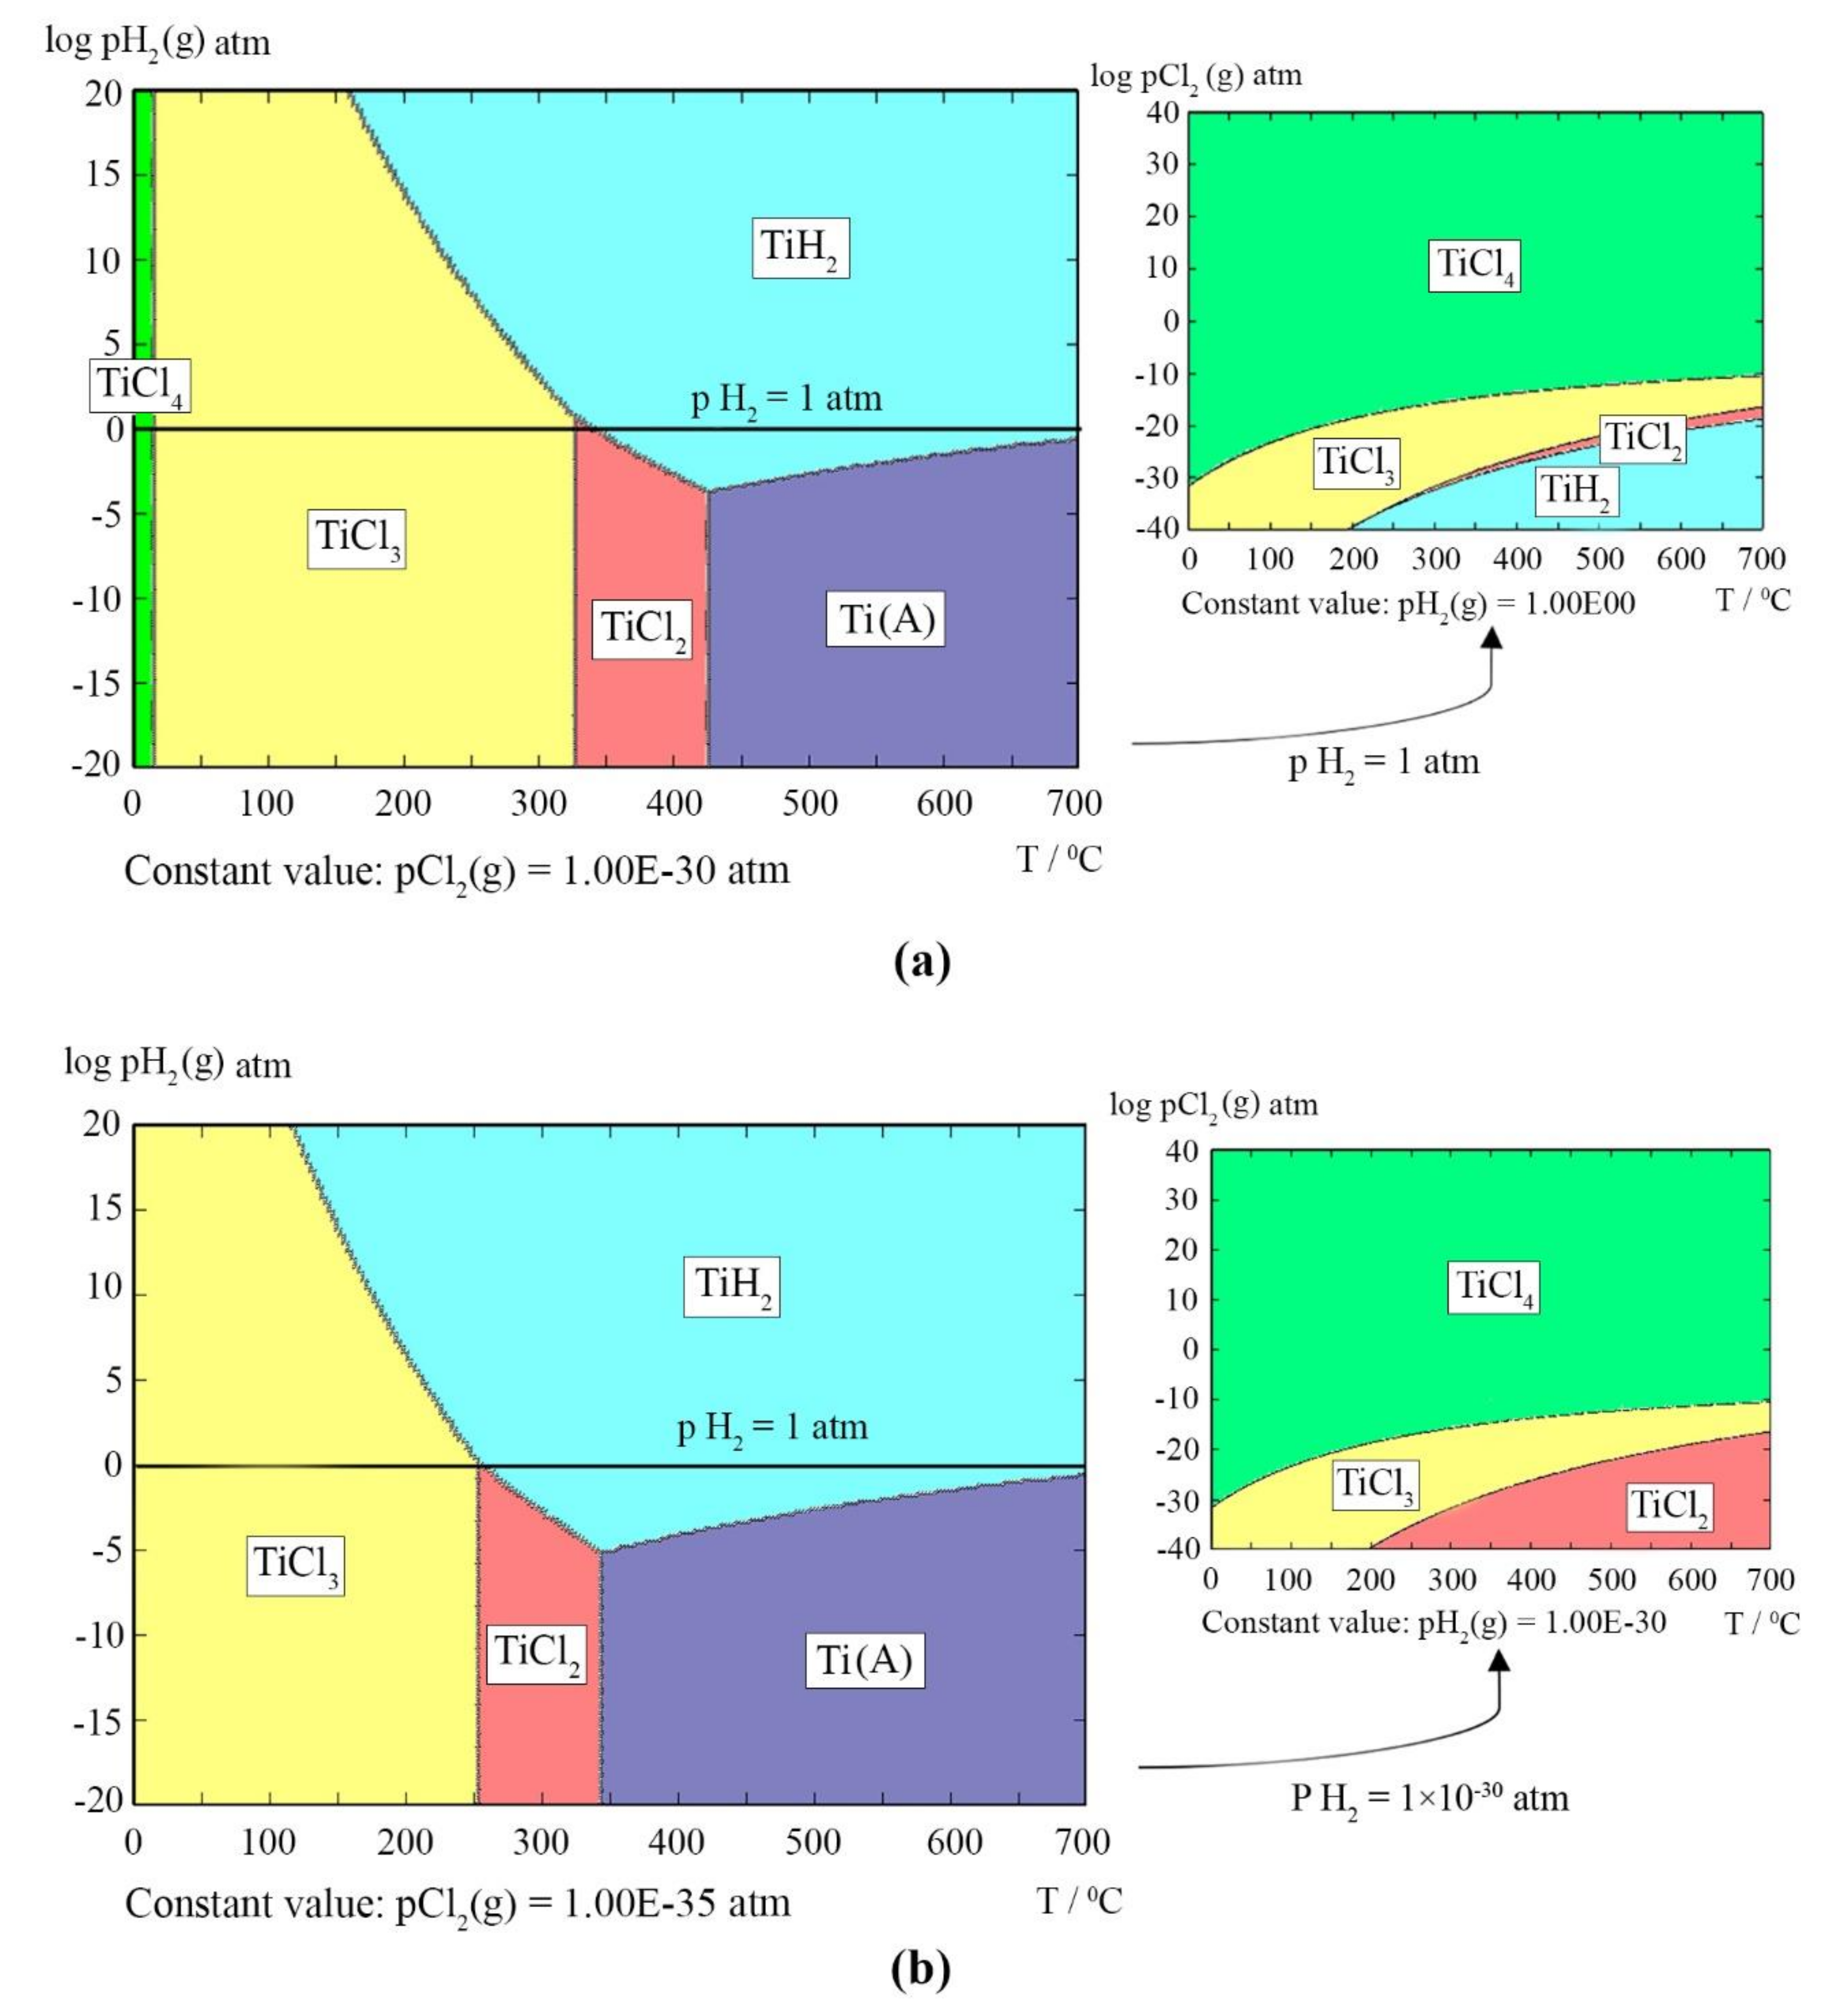
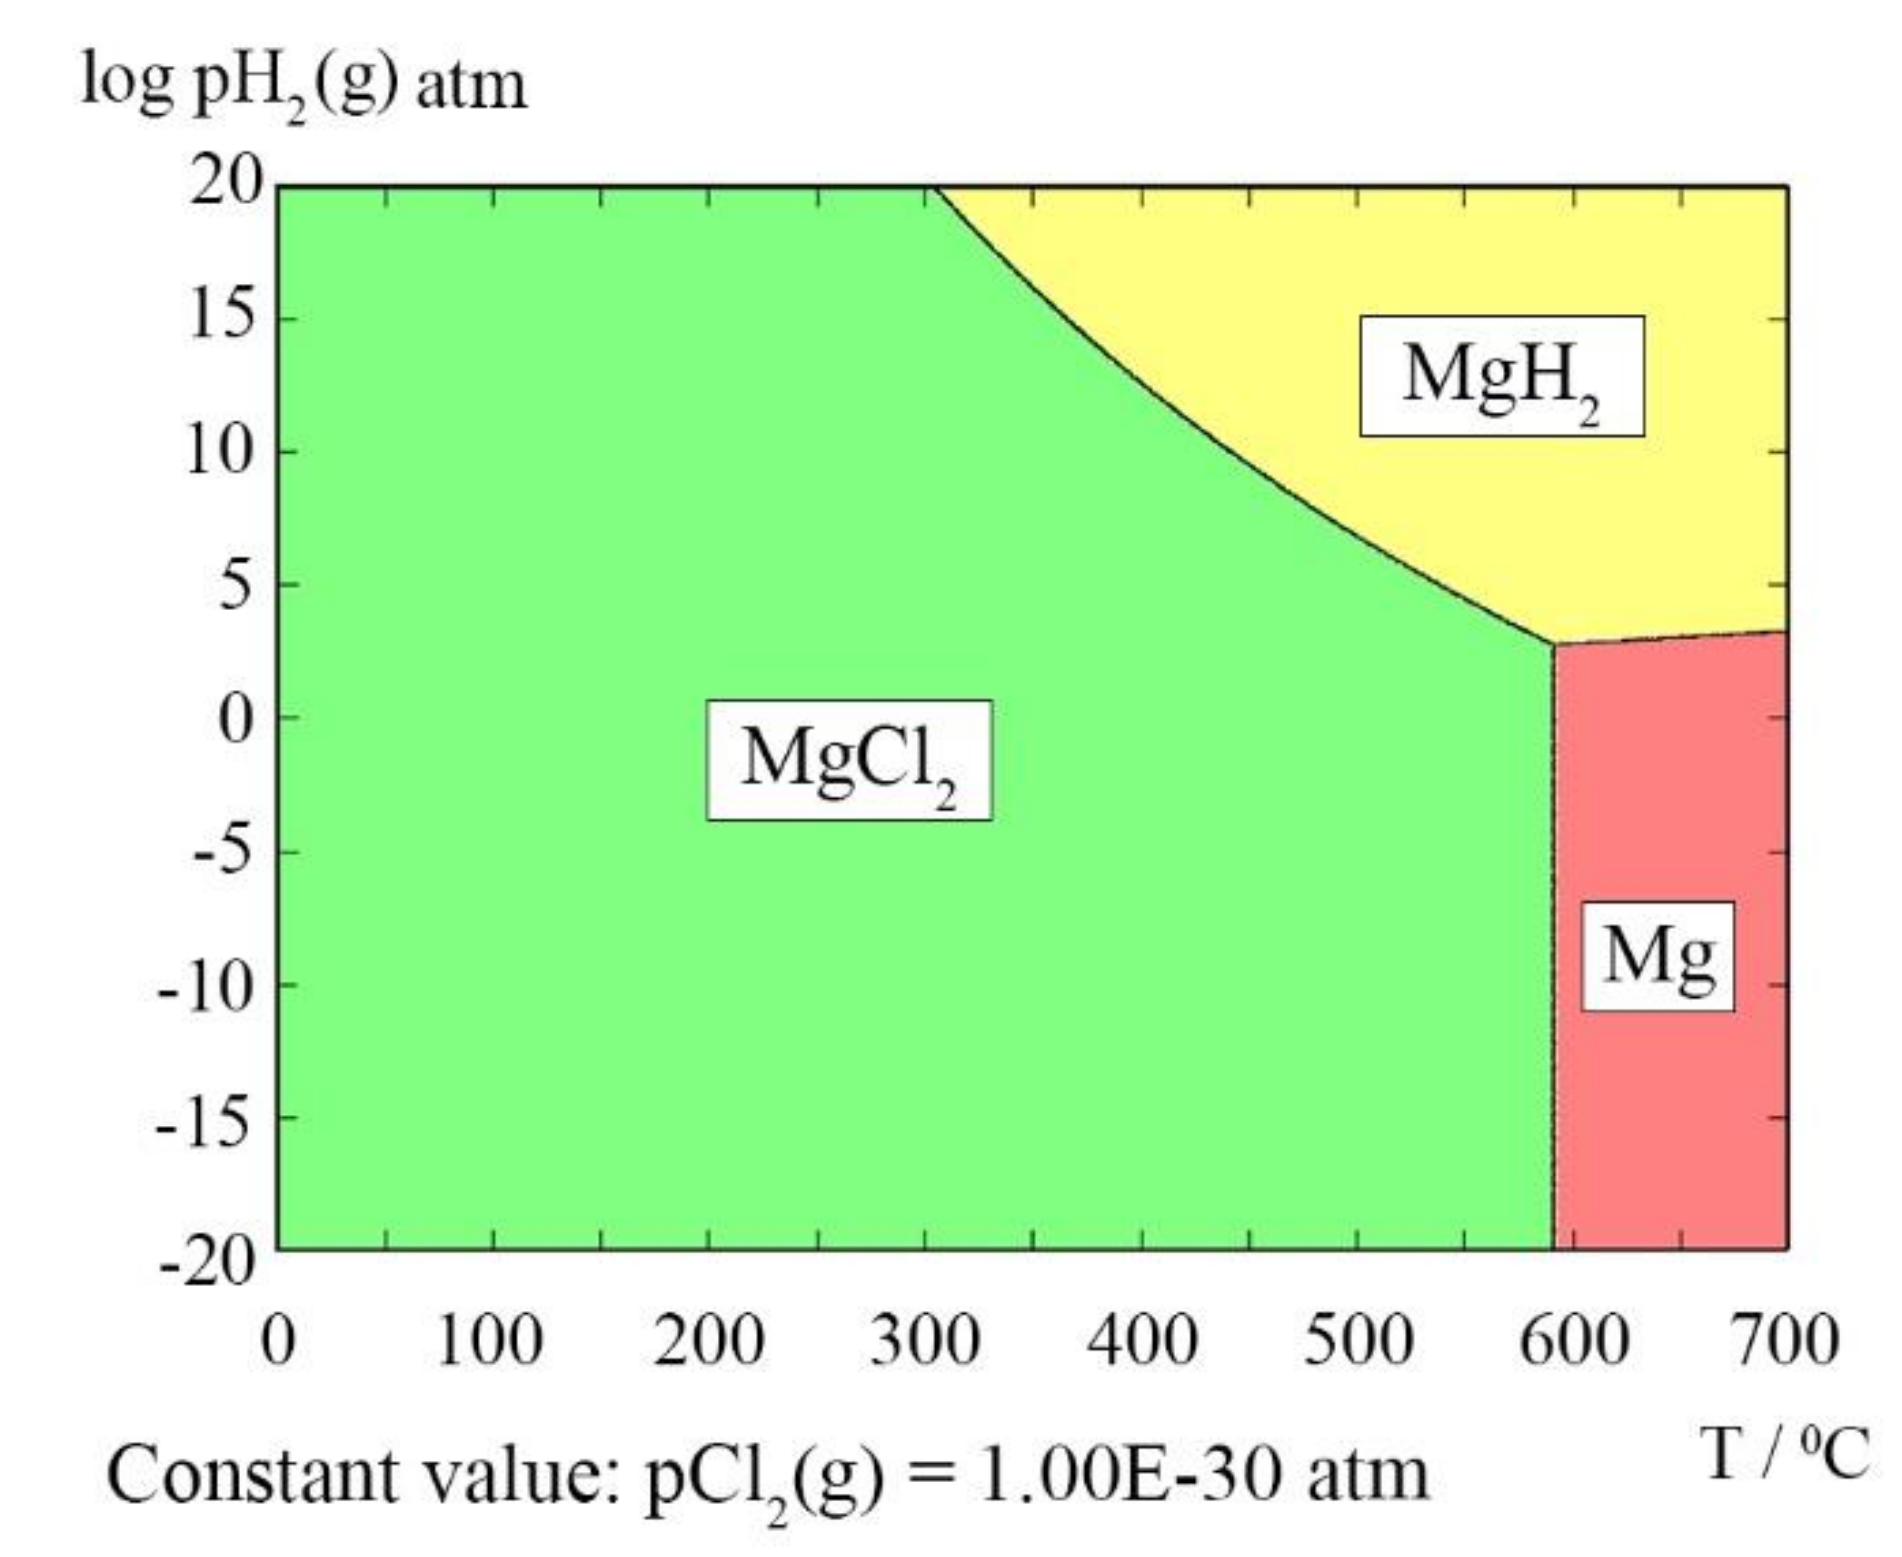
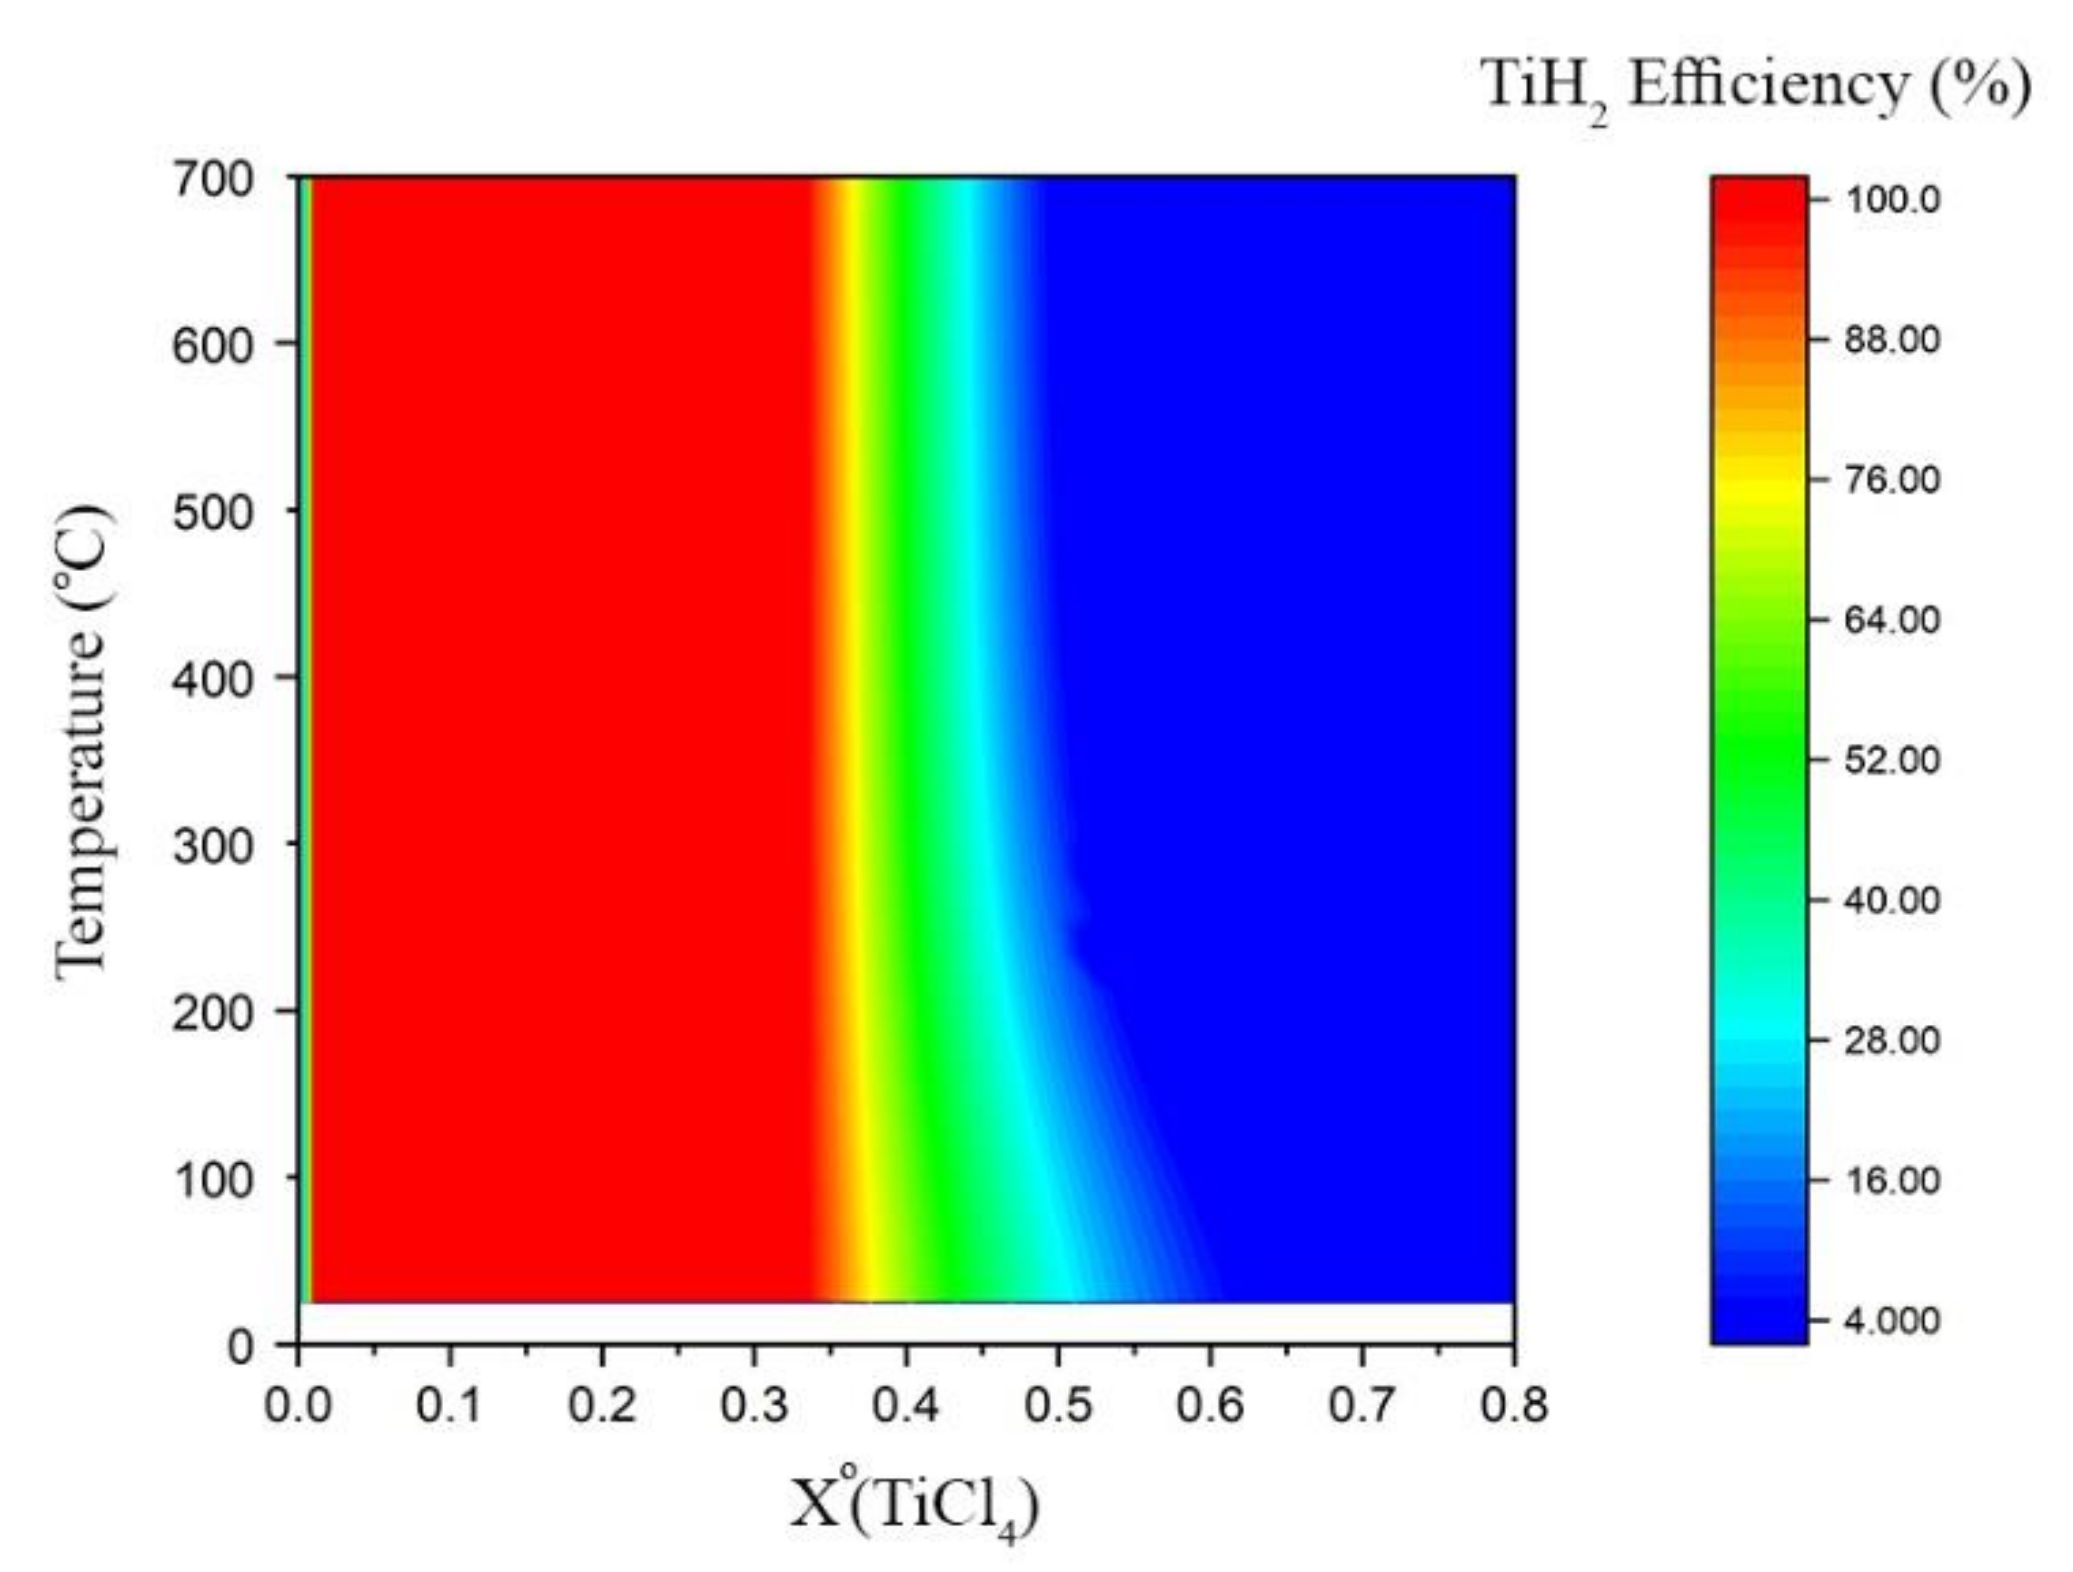
3.1. Thermodynamic Assessment

The standard change in Gibbs free energy of formation ( Δ G f ° ) of the chemical species that were used in this study is listed in Table 1. The thermodynamic data were extracted from Stull and Prophet (1971) [50] for the temperature range of 0–700 °C, except for MgH2, which was extracted from Brain (1997) [51] for the thermodynamic data up to 700 °C. The thermodynamics study on converting ilmenite to nitride ilmenite and subsequently TiCl4 was published elsewhere [52,53]. The chemical potential diagrams (stability diagrams) of the M-Cl-H (M: Ti and Mg) systems at different partial pressures in Table 1 are illustrated in Figure 2 and Figure 3. The phase stability diagrams demonstrated the stability boundaries of each phase in a ternary system as a function of temperature or in isothermal conditions. The stability diagrams were calculated based on the Gibbs free energy minimization. The partial pressure of gas species was calculated from the equilibrium constant and the activity of the gas species.
In Figure 2 and Figure 3, the effect of temperature, the partial pressure of H2 ( P H 2 ), and partial pressure of chlorine ( P C l 2 ) on the stability of associated phases are illustrated. Figure 2 illustrates the Ti-Cl-H diagrams with the change in the partial pressure of H2 gas. The values of the P C l 2 were changed, starting from 1 atm until the appearance of TiH2 phase at P H 2 = 1 atm below 500 °C. It was observed that for P C l 2 ≤ 1 × 10⁻³⁰ atm, the TiH2 phase was stable within the specified temperature range. It can be seen from Figure 2a that in the Ti-Cl-H system, the dominant solid phase at T ≤ 350 °C and P H 2 = 1 atm was TiCl3, and at the higher temperature range, the TiH2 phase was more stable. Moreover, Figure 2b shows that with additional decreasing in the P C l 2 to 10−35 atm, there was no presence of TiCl4, and the TiH2 stability area increased to T ≥ 250 °C. According to Figure 2a, the equilibrium interface between TiH2 and TiCl3 indicated that the stability area of TiH2 started at a temperature above about 150 °C and P H 2 = 20 atm, and with an increase in temperature, it was expanded to P H 2 of 1 atm at a temperature around 300 °C. This particular distinction between the two diagrams in Figure 2a,b represents the importance of the effect of P H 2 and P C l 2 on the stability diagrams. Hence, in the presence of H2 atmosphere, it should be possible to reduce the TiCl4 to TiH2.
In order to further highlight the effect of P H 2 on the phase stability, the Ti-Cl-H predominance diagram was plotted for a constant amount of P H 2 at 1 atm in Figure 2a and 1 × 10⁻³⁰ atm in Figure 2b. As is illustrated in Figure 2a to obtain the TiH2 predominance area at P H 2 = 1 atm, the P C l 2 in the system must be as low as 1×10⁻³⁰ atm for T = 350 °C and 1 × 10⁻³⁵ atm for T = 250 °C. However, it can be observed from Figure 2b that at constant P H 2 of 1 × 10⁻³⁰ atm, there was no presence of TiH2. This is the main reason that there was a need to run the reduction process in the presence of H2 gas instead of an inert atmosphere. Basically, in P H 2 ≥ 1 atm and very low amount of P C l 2 , TiH2 was a predominant phase. Previous work by Udayakumar et al. [54,55] in producing TiH2 in an inert atmosphere showed a low yield and validating this thermodynamics analysis.
It should be emphasized that depending on the partial pressure of Cl2, the system may enter the predominance area of TiCl3 and possibly TiCl2. This particular scenario indicates a possible thermochemical mechanism that TiH2 may produce from reactions between TiCl3 or TiCl2 and MgH2 rather than the reaction via Equation (1) at a fixed temperature and certain P H 2 and P C l 2 . In this regard, the possible reactions in the system could be followed as in Equations (2)–(5) for the TiCl4-MgH2 reaction system.
2 TiCl 4 g +   MgH 2 = 2 TiCl 3 +   MgCl 2 +   H 2   g Δ G ° = 415.140 + 0.197 T   kJ / mol
2 TiCl 3 + 3 MgH 2 = 2 TiH 2 + 3 MgCl 2 +   H 2   g   Δ G ° = 576.700 0.066 T   kJ / mol
2 TiCl 3 +   MgH 2 = 2 TiCl 2 +   MgCl 2 +   H 2   g Δ G ° = 178.690 0.084 T   kJ / mol
TiCl 2 +   MgH 2 =   TiH 2 + MgCl 2 Δ G ° = 198.980 + 0.005 T   kJ / mol
The predominance diagram for the Mg-Cl-H system at P C l 2 = 1 × 10⁻³⁰ atm is shown in Figure 3. The interface between MgH2 and MgCl2 indicated the stability of metal chlorides at P H 2 = 1 atm and almost the whole temperature range, except for Mg, which is more stable at a temperature above 600 °C, according to Figure 3. From the latter figure, MgH2 was a stable phase at a temperature above 350 °C and higher P H 2 . As a result, it is possible to conclude that reducing TiCl4 with metal hydrides is possible, and the stable phases were TiH2 and MgCl2, depending on the partial pressure of chlorine gas. On a side note, this thermodynamics approach does not consider the possibility of simultaneous formation of different species in the same system, as only one species, for example, TiCl3 or TiH2, is described as a feasible component at a particular condition. Given this, the Gibbs free-energy minimization method was carried out to evaluate the formation of various phases simultaneously.

Phase Composition Diagrams
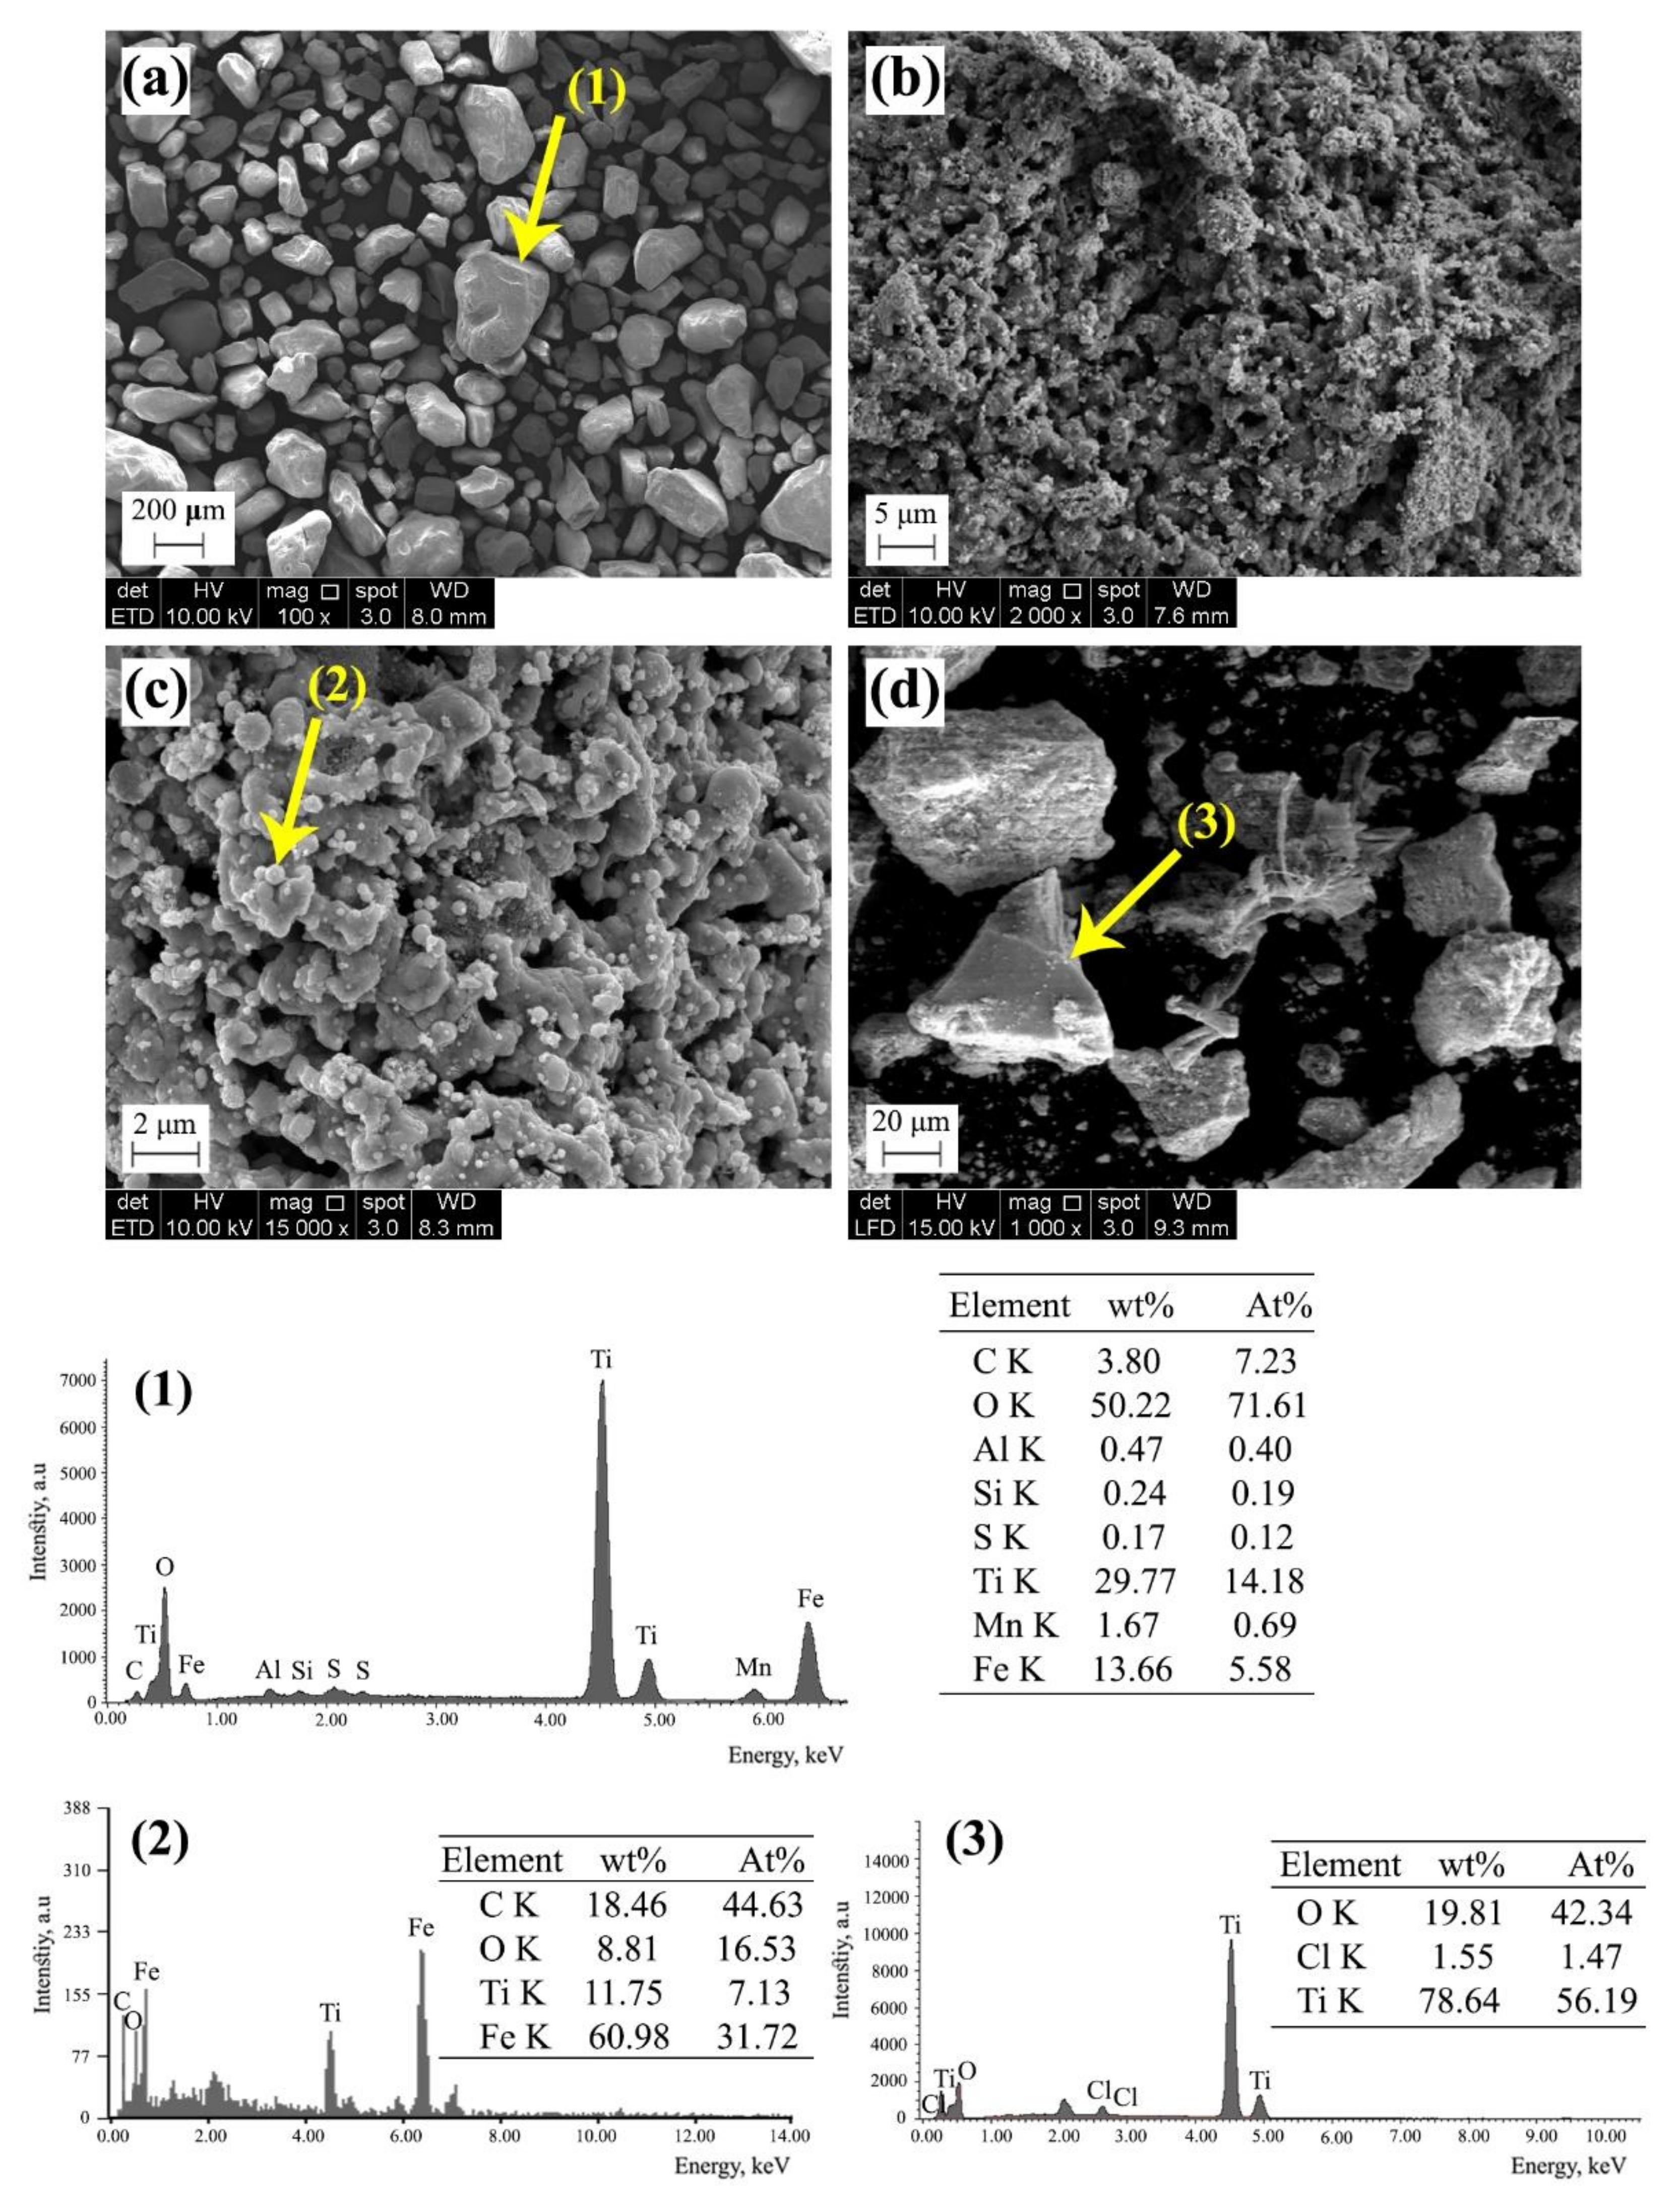
The objective of this section is to present the equilibrium composition diagrams as in Table 1. Therefore, calculations were carried out for stoichiometric and nonstoichiometric amounts of reactants for the temperature range of 0–700 °C as given in Equation (1). The phase determination of the system at equilibrium condition was calculated with the help of the equilibrium module of HSC Chemistry v6.0.0 (Tampere, Southern Finland, Finland), which is based on the minimization of the Gibbs free energy [56]. The relevant elements (Ti, Cl, Mg, and H) with an ideal behavior were used to determine the stable phases of the system under the investigated conditions. It should be noted that a constant amount of H2 equaling 2 mol was considered in all the calculations for the effect of excess H2 in the system since the reduction experiment suggested proceeding under H2 atmosphere. The molar ratio of TiCl4:MgH2 was 1:2 for stochiometric conditions according to Equation (1). In this condition, the final equilibrium phases after reactions were TiH2, MgCl2, and H2 in all temperature range according to Equation (1).
Furthermore, the nonstochiometric conditions with increasing the molar ratio of TiCl4:MgH2 in Equation (1) were investigated with an increase in the latter molar ratio to 2:2 and 3:2, as shown in Figure 4. The changes in the molar ratio of the reactants affected the final products available in the reaction. From Figure 4, TiH2 was formed at its highest amount of 0.6 mol below 100 °C. As the temperature raised to 700 °C, the TiH2 molar amount gradually dropped to 0.1 mol when the TiCl4 molar amount increased to 2 mol, as shown in Figure 4a. However, Figure 4b illustrates that with an additional increase in TiCl4 to 3 mol, TiH2 was not present above 100 °C.
Furthermore, by increasing the TiCl4:MgH2 molar ratio to 3:2, the TiCl3 phase formed, in addition to TiH2. At a TiCl4 amount of 2 mol, TiCl3 decreased continuously from about 1.2 to 0.1 mol, with temperatures shown in Figure 4a. However, by increasing the TiCl4:MgH2 molar ratio to 3:2, the change in the TiCl3 amount was different, as shown in Figure 4b. It can be observed that the TiCl3 amount dropped to about 2 mol at 100 °C, and there was no change up to 500 °C. Then, there was another decrease in the TiCl3 amount from 2 to 1.3 mol above 550 °C. In addition, the amount of MgCl2 as a final product in the system was constant in all the diagrams. According to Figure 4, it was clear that with increasing temperature, the molar amount of H2 gas gradually increased up to about 4 mol at a TiCl4 molar amount of 2 mol. It was also rapidly increased to about 4 mol when the TiCl4 molar amount was 3 mol, and it was constant above 150 °C. Moreover, it shows the formation of H2 gas in the system with an increase in a molar ratio of TiCl4:MgH2.
Another essential feature of diagrams in Figure 4 is the formation of the TiCl2 phase as a product with the reverse chemical behavior of TiCl3 and TiH2. While the molar amount of TiCl3 and TiH2 decreased, the molar amount of TiCl2 began to increase. Since TiH2, TiCl3, and TiCl2 were behaving comparably, there should be a reaction to consuming the first two phases to convert to a later one with increasing temperature. Moreover, at TiCl4 molar amount of 3 and temperature range above 600 °C, interesting changes occurred as new gas phases, namely TiCl3 (g), TiCl4 (g), and Ti2Cl6 (g), were formed, and the amount of TiCl2 started to increase. The main reason for these behaviors is the possibility of the reaction between excess TiCl4 and the produced TiH2 in the system as Equation (6), which has negative ΔG° below 700 °C. In addition, the produced TiCl3 can be reacted with TiH2 to produce TiCl2 as Equation (7). Moreover, the formation of TiCl3 (g), TiCl4 (g), and Ti2Cl6 (g) are due to the transformation of TiCl3 to the gas phase above 500 °C. Up to 500 °C, the TiCl3 is in the solid state, and with an increase in temperature, it is completely decomposed to the gaseous state. Subsequently, the amount of TiCl3 decreased above 500 °C. As a result, TiCl2 and TiCl4 (g) can be produced according to Equation (8). In addition, there is the possibility that TiCl3 (g) transforms to Ti2Cl6 (g) phase, whereas this reaction has negative ΔG° according to Equation (9).
TiH 2 + 3 TiCl 4 g = 4 TiCl 3 + H 2   g Δ G ° = 338.300 + 0.343 T   kJ / mol
TiH 2 + 2 TiCl 3 = 3 TiCl 2 + H 2   g Δ G ° = 20.490 0.091 T   kJ / mol
2 TiCl 3 g =   TiCl 2 + TiCl 4   g Δ G ° = 145.890 + 0.184 T   kJ / mol
2 TiCl 3 g =   Ti 2 Cl 6   g Δ G ° = 127.470 + 0.143 T   kJ / mol
To put it briefly, the formation of TiH2 is possible through a reaction between MgH2 or CaH2 and TiCl4; however, the ratio between TiCl4 and metal hydrides was critically important to have TiH2 following the completion of the reactions in the system.
The equilibrium molar amount and molar fraction of TiH2 ( X T i H 2 ° ) as a function of the molar fraction of TiCl4 ( X T i C l 4 ° ) and temperature for the TiCl4-MgH2 reaction system are provided in Figure 5. X P ° was defined as Equation (10).
X p ° = n i ° n p °
where n i ° is an output mole of component i in the system (i.e., TiCl4 or TiH2), and n p ° is the molar amount of all the products after the reduction process based on the equilibrium composition calculation data from HSC software for Equation (2)–(9). For the sake of simplification, the amount of MgH2 was set to 2 mol, similar to previous calculations for equilibrium compositions. It was evident from Figure 5a that TiH2 formation started at X T i C l 4 ° = 0.1, and its equilibrium amount increased slightly with the molar fraction of TiCl4 to reach its maximum of 1 mol when X T i C l 4 ° was almost 0.3. According to Figure 5b, for X T i C l 4 ° between 0.1 and 0.3, the molar fraction of TiH2 decreased with increasing temperature. In general, TiH2 can be produced when X T i C l 4 ° was between 0.1 and 0.5 for all temperature range, and its equilibrium amount reaches the highest amount at X T i C l 4 ° between almost 0.3 and 0.4 in all temperature range. With more TiCl4 addition at a constant amount of MgH2, the formation of TiH2 was impeded, while TiCl3 or TiCl2 phases began to produce, as discussed in Figure 4. Needless to say, all the calculations are based on thermodynamic data and minimization for the Δ G ° in the system.
Since TiCl4 can be reduced to TiH2, TiCl3, and TiCl2 via Equations (6)–(9) solely based on the molar ratio between TiCl4 and MgH2, it is of interest to know the optimum molar fraction of TiCl4 to MgH2, which can reach the highest yield of TiH2. If TiH2 production efficiency was defined as the molar amount of produced TiH2 as in Equations (2)–(9) divided by the stoichiometric molar amount of TiH2 from Equation (1), then Figure 6 could be plotted for the TiCl4-MgH2 reaction system. It can be observed from Figure 6 that the TiH2 efficiency reached the highest level of 100% for the amount of X T i C l 4 ° below 0.3 for all temperature ranges. In this condition, no TiCl3 or TiCl2 was produced, and TiCl4 was entirely transformed to TiH2. In addition, an excess amount of MgH2 could be retained in the system. Moreover, the calculated data showed that change in the temperature had no significant effect on the TiH2 formation efficiency, except a slight increase in TiH2 efficiency at a temperature below 250 °C and fraction between 0.4 <   X T i C l 4 ° < 0.5. It should be noted that these calculations were based on the equilibrium assumption, and the situation in the real system could be different.

3.2. Phase Analysis

The synthesis of TiH2 was performed using MgH2 powder as a reductant according to the process of Figure 1. The phase analysis of the final reduction products was employed to gauge the mechanism of the reaction according to Equations (1)–(9). Figure 7 represents the XRD diffraction patterns for raw ilmenite, reduced ilmenite before and after the Becher process, and the reduced powder with MgH2 at 500 °C for 12 h. The ICSD reference number of the studied phases are 98-003-5383 (FeTiO3), 98-001-7721 (Fe2TiO5), 98-008-9933 (TiOxCyNz), 98-008-7922 (Fe), 98-008-8801 (MgH2), 98-008-9526 (Mg), 98-001-1144 (TiCl3), 98-009-6474 (MgCl2·(H2O)4), 98-000-3817 (TiO2), and 98-006-5530 (TiH2). It is evident from Figure 7 that the raw ilmenite mainly consists of FeTiO3 and pseudobrookite (Fe2TiO5). All the ICSD# for phases detected were listed in Figure 7. Moreover, low-intensity peaks related to titanium dioxide (TiO2) were also observed. It is shown in Equation (11) that ilmenite can be converted to the TiN through the carbothermal reduction and nitridation (CTRN) process. Previous studies by Rezan et al. [57,58] reported that the actual phase from the carbothermal reduction and nitridation of ilmenite was TiOxCyNz rather than TiN. On the other hand, the Fe2TiO5 phase was transformed to FeTiO3 via the reaction of Equation (12).
8 C + 4 H 2 g + 2 FeTiO 3 +   N 2 g = 6 CO g + 2 Fe + 2 CH 4 g + 2 TiN   Δ G ° = 285.012 kJ / mol   at   1250   ° C
Fe 2 TiO 5 +   TiO 2 +   H 2 g = 2 FeTiO 3 +   H 2 O g Δ G ° = 241.470 + 0.271 T   kJ / mol
Figure 7 shows that the reduced powder after nitridation was a combination of the TiOxCyNz phase and metallic Fe as expected from Equation (11). This powder was later leached according to the Becher process [20], and the metallic Fe was removed entirely, as can be seen from the XRD data in Figure 7. The Fe particles can react with dissolved oxygen as Equation (13) to form iron oxide hydrate (Fe2O3·xH2O).
2 Fe + 3 / 2 O 2 + xH 2 O   =   Fe 2 O 3 · xH 2 O
Figure 7 it can be observed that in addition to the TiH2 phase, other phases such as TiCl3, MgH2, and Mg were detected. Moreover, MgCl2(H2O)4 was formed as a major byproduct of the reaction system. This phase was produced due to moisture adsorption on MgCl2. The formation of TiCl3 can be explained through Equation (14). It was reported that in the Ti-Cl-H system, TiCl4 has a high tendency to reduce to TiCl3 in the presence of H2 gas [59]. Simultaneously, TiCl3 can react with MgH2 powder to produce TiH2 by Equation (15). Therefore, the possible chemical pathway for the production of TiH2 from TiCl4 reaction with MgH2 could be from Equations (14) and (15). It should be noted that the presence of Mg in the XRD data results from the partial dehydrogenation of MgH2 powder. Overall, the XRD patterns confirmed the formation of TiH2 from the proposed method.
2 TiCl 4 g +   MgH 2 = 2 TiCl 3 +   MgCl 2 +   H 2   g Δ G ° = 419.390 + 0.213 T   kJ / mol
2 TiCl 3 + 3 MgH 2 = 2 TiH 2 + 3 MgCl 2 +   H 2   g   Δ G ° = 576.700 0.066 T   kJ / mol
Figure 8a–c illustrate the as-received ilmenite morphology together with the reduced ilmenite before and after the leaching process. Besides this, the morphology of the TiH2 powder after washing the reduction products with distilled water and diluted HCl is illustrated in Figure 8d. Figure 8a–c indicates the formation of spherical-shaped particles, which could be related to the formation of metallic iron, and it can be easily removed from the system through the Becher process. The EDX analysis data of Figure 8c clearly shows the high percentage of Fe content from nitrided ilmenite with a spherical Fe particle forming due to the interaction of carbon saturated molten iron. Figure 8d demonstrates the morphology of the final powder after the reaction between TiCl4 gas and MgH2 powder. It can be observed that irregularly shaped particles were formed during the reduction process. The EDX analysis data of these particles demonstrated the presence of about 78 wt% Ti with the balance oxygen. The presence of oxygen in the EDX analysis data should be the result of the oxidation of TiH2 surface, which was previously reported by Zhang et al. (2017) [60] that an oxide layer could be formed on the TiH2 surface. The phase analysis and morphology study of the final powders indicated the formation of the TiH2 powder with irregularly shaped particles from the reduction of TiCl4 gas with MgH2 powder.

3.3. Process Simulation and Economics Evaluation

In the previous section, the experimental results for the production of TiH2 powder via thermodynamic assessment (Section 3.1) and phase and morphology characterization (Section 3.2) are presented. The results show that TiH2 powder production from the proposed method was feasible technically. However, to examine the cost-effectiveness of the process, it is beneficial to investigate the economic behavior of the production process. Thus, in this section, the TEA was performed for the production of TiH2 powder from ilmenite and subsequently Ti metal powder from TiH2 as a final product. It is necessary to estimate the total production costs of the product before any financial investment is made for a pilot production [61].
Figure 9 shows the simulation flowsheet developed using SuperPro Designer [49] for Ti powder production from ilmenite ore. As shown, the ilmenite was grounded below 75 µm in procedure P-1 (Grinder GR-101), and it was mixed with coal in the procedure P-1/2. Next, the mixture was subjected to the CTRN process in reactor P-2 (vessel R-101) at 1250 °C for 5 h in the presence of H2 and N2 gases [62]. In the proposed method, plastic wastes such as polyethylene terephthalate (PET) can be used instead of coal since they are valuable carbon resources. It has been reported that PET stands as 8 wt% of the global solid waste [23]. In our previous studies [22,23], it was shown that the ilmenite could be reduced with PET via the CTRN process. Compared to the conventional method for the reduction of ilmenite, this is a sustainable method for recycling waste plastics from economic and environmental aspects.
As it was shown in Equation (11), the reduction products were the mixture of TiN and Fe particles. After completing the reduction step, Fe particles were separated from TiN through aeration leaching using the Becher process (procedure P-3) [63]. For this purpose, air and ammonium chloride (NH4Cl 3.2 M) were injected into the leaching vessel AFR-101 for aqueous iron oxidation. The Fe particles can react with dissolved oxygen following the reaction stoichiometry in Equation (13) to form an iron oxide hydrate (Fe2O3·xH2O). Later, the mixture was sent for filtration in the filter unit MF-101 (procedure P-4). The filtrate from the latter contains dissolved NH4Cl and aqueous Fe2O3·xH2O, which can be separated from each other through filtration (procedure P-4/MF-102). Although the leaching process (P-3) was performed at 90 °C for 7 h to ensure complete oxidation of Fe, there is the possibility that a small portion of Fe particles remains in the TiN filter cake [63]. Therefore, the filter cake was washed with hydrochloric acid (HCl; 1 M) in procedure P-5 to remove all remaining Fe particles. The latter can be transformed into iron chloride (FeCl2), following Equation (16). The FeCl2 residue is collected in tank P-5/1 (vessel V101), which can be sold as a byproduct for the sewage treatment industry or recycled back to Fe2O3 for the ironmaking industries [64,65].
A batch vessel reactor (P-6/R-102) is used to model the chlorination of TiN powder. The chlorination process was performed at 400 °C for 5 h, in the presence of Cl2 gas, which converts TiN to TiCl4 gas following Equation (17) [66]. It is worth noting that the product N2 gas can be collected and reused in procedure P-2. The TiCl4 gas can be reduced with MgH2 to form a solid mixture of TiH2 and MgCl2, following the reaction stoichiometry in Equation (1). This process was carried out in the reduction reactor P-7 (R-103), in which the MgH2 powder was used as a reductant agent in the reduction of TiCl4 to TiH2. This mixture is then subjected to water washing (P-8/WSH-101) for the removal of MgCl2, which is water soluble. The solution residue from water washing is then sent to the electrolysis (procedure P-8/1) for Mg metal production, which can later be reacted with H2 gas to produce MgH2 for the reduction process. On the other hand, the TiH2 powder is used as a raw material for a dehydrogenation reactor (P-9) for Ti powder production [23,24]. It should be noted that the H2 gas emission from procedures P-7 and P-9 can be collected and stored in vessel P-10/V-102 for further application in the ilmenite reduction process (P-2).
2 HCl g +   Fe   =   FeCl 2 aq +   H 2   g Δ G ° = 111.259 kJ / mol   at   90   ° C
TiN + 2 Cl 2 =   TiCl 4 + 1 / 2 N 2   g Δ G ° = 408.402 kJ / mol   at   90   ° C
The main benefit of the current method compared to the traditional Kroll process is that the final product is TiH2 or Ti metal powders rather than Ti sponge. Therefore, instead of machining the Ti sponge to produce final products that generate a large amount of scrap, the TiH2 or Ti metal powder can be directly used in powder metallurgy techniques to generate the final products with less scrap and reduce energy consumption related to the machining step, resulting in an enhanced environmental impact. Moreover, the reaction temperature in the reduction reactor P-7 (R-103) is 500 °C, which is much lower than 900–950 °C in similar processes, where the TiCl4 reduction is performed with molten Mg which requires a high temperature to melt Mg metal [9]. However, the current study proposes to employ MgH2 powder at a lower temperature with less energy consumption, which is more environmentally friendly. Another major difference is that the reaction byproducts from reactor P-7 (R-103) separated via hydrometallurgical technique in process P-8 instead of using vacuum distillation at elevated temperature of 1000–1050 °C in similar processes [67].
The production process simulation was performed for the annual operation time of 7920 h/year, plant construction duration of 6 months and project lifetime of 15 years. The processing time and unit for the respective procedures of the model are summarized in Table A1 and Table A2 in Appendix A. In addition, Table 2 summarizes the overall process parameters for different production scales. It can be observed that by increasing the production scale, the recipe batch time and recipe cycle time are increased, and the number of annual batches dropped. However, due to larger process throughput, the total amount of Ti product increases for the larger production capacity (e.g., 10 t/batch).

3.3.1. Raw Material and Installed Equipment Costs

The required amount of raw materials was estimated according to the stoichiometric amounts given in Equation (1) and Equations (11)–(14). Table 3 indicates the amount of required materials per batch with their unit price for economic evaluation for different production scales. It should be noted that both HCl and NH4Cl streams contain water in the mixture (see its mass % in Table 3). Furthermore, the required equipment details were summarized in Table A3 in Appendix A. Moreover, Table A4, Table A5 and Table A6 in Appendix B list the equipment unit price, annual required materials price, and utility consumption, respectively, for different production scales of the Ti powder plant. The annual materials cost can be calculated from each material unit price and the annual amount per batch by the number of batches per year in Table 2. Based on Table A4, Table A5 and Table A6, it can be concluded that raw materials have the highest impact on production costs, regardless of the production scale. It should be noted that the SuperPro Designer software v8.5 (Scotch Plains, New Jersey, USA) has a built-in model for the calculation of equipment costs [49], based on the costs model in Peters et al. [68].
Table 4 summarizes the purchase cost of major equipment according to the studied production scales of Ti powder, calculated using the built-in model [49]. It should be noted that the equipment capacity is directly related to the production throughput. As can be seen, the highest equipment cost was associated with the TiCl4 reduction furnace (R-103) and MgCl2 electrolysis cell (R-104) for the Ti production scale of 1 t/batch, and ilmenite reduction reactor (R-101) for Ti production scale of 5 t/batch and 10 t/batch.

3.3.2. Economic Analysis

Based on the economic model of Peters et al. [68], the built-in model of SuperPro Designer v8.5 (Scotch Plains, NJ, USA) [49] determines the production costs as a percentage of the capital cost and operating costs, as summarized in Table A7 in Appendix C. It is evident from Table A7 that the equipment purchase cost is the highest factor in the direct plant costs, while the construction was a significant factor in indirect plant cost. Table 5 summarizes the capital fixed costs for Ti production scales of 1, 5, and 10 t/batch. It is noteworthy that the total equipment purchase cost, process piping, installation, insulation, instrumentation, buildings, electrical, yard improvement, and auxiliary facilities are considered direct plant costs. On the other hand, engineering and construction were categorized as indirect plant costs. Other parameters such as start-up and validation, insurance, maintenance, a local tax, and the factory expenses were included in calculating the capital investment in the economic modeling by the SuperPro Designer [49]. It is evident from Table 5 that direct and indirect plant expenses increase with an increase in production scale.

3.3.3. Unit Production Cost of Ti Metal Powder

The economic evaluation results for the investigated production scales were given in Table 6. It was considered that the Ti metal powder price is 250 USD/kg. The two main economic factors, i.e., return of investment (ROI) and internal rate of return (IRR) values, were compared for all the production scales as reported in Table 6. In general, a positive ROI value indicates that the net returns are positive since the total returns are higher than the process costs. Moreover, a project is economically feasible with a higher IRR than the minimum acceptable returns for investors [61,68]. The results in Table 6 demonstrated that maximum ROI and IRR were 39.36% and 63.20%, respectively, which was obtained for production scale of 5 t/batch. However, the ROI and IRR decreased to 35.18% and 53.83% for 10 t/batch production scale, respectively. This is mainly due to a significant increase in the total capital investment for 10 t/batch, with a marginal increase in its revenue. This leads to lower ROI and IRR as compared to the 5 t/batch production scale. Overall, the unit production cost for Ti powder ranges between 224.19 and 246.58 USD/kg Ti from this study.
The Monte Carlo method was employed to quantify the uncertainty [69,70] for the sensitivity analysis, using Crystal Ball v11.1.2.4 add-in function in Microsoft Excel. This simulation determines which operational factors have the most significant impacts on the economic efficiency of the process. According to Table 6, the ROI (39.36%) and the unit production cost of the Ti powder ($226.69/kg) for the Ti powder production scale of 5 t/batch were investigated for the sensitivity analysis. The distribution of model variables was summarized in Table A8 in Appendix D. In general, triangular distribution was applied for the time, and normal distribution with 10% standard deviation was used for price fluctuations. The probability distribution of ROI and Ti unit production costs are illustrated in Figure 10. It is evident from Figure 10a that the change in ROI from 10 to 70% falls within the certainty of about 76.42%. Moreover, it was observed from Figure 10b that the change in Ti unit production cost amounts from $205 to $250 correlated with a certainty of occurrence of about 79.37%.
The sensitivity analysis diagrams generated by the Crystal Ball (Figure 11) reveals that the MgH2 purchase cost was the most significant input variable on the unit production costs and ROI, which is followed by the ilmenite purchase price. Overall, the MgH2 price has a negative impact on the economic analysis. Increasing the MgH2 price results in lower ROI and increased unit production cost.

4. Conclusions

Thermodynamic assessment of TiH2 synthesized from TiCl4 was investigated between MgH2 with TiCl4 in the presence of H2 atmosphere at a temperature range from 0 to 700 °C. The thermodynamic assessment revealed that the formation of TiH2 was feasible in the TiCl4-MgH2 reaction system. However, the molar fraction of TiCl4 has a critical role in the reduction process. With an increase in the molar fraction of TiCl4 above 0.4, the TiH2 formation was impeded, and the TiCl3 phase started to produce significantly. According to the various amounts of TiCl4:MgH2 molar ratio, different products were obtained. Experimental data confirmed the thermodynamic assessment on TiH2 formation from TiCl4:MgH2 were also extracted, and findings, and it was indicated that at the reaction temperature of 500 °C for 12 h, TiH2 powder was formed. Moreover, the TEA of Ti metal powder production was conducted for 1, 5, and 10 t/batch production scales. The modeling results indicated that the highest ROI of 39.36% with 2.54 years of payback time was achieved at 5 t/batch production scale. Moreover, sensitivity analysis showed that the MgH2 and ilmenite purchase prices had the highest negative impact on the ROI and unit production costs. The change in the raw materials by 10% resulted in the certainty of 76.42% for ROI changing between 10% and 70%. Similarly, the certainty for the unit product cost was achieved at about 79.37% for fluctuating between 205 and 250 $/kg. It has shown that the production of Ti powder via the TiH2 route from ilmenite at the low-temperature range was economically feasible.

Author Contributions

Conceptualization, S.A.R.S.A.H. and D.C.Y.F.; methodology, M.R.A., S.A.R.S.A.H. and D.C.Y.F.; software, D.C.Y.F. and M.R.A.; investigation, M.R.A.; data curation, M.R.A. and D.C.Y.F.; writing—original draft preparation, M.R.A.; writing—review and editing, S.A.R.S.A.H., D.C.Y.F., and A.R.M.; project administration, S.A.R.S.A.H. and A.R.M.; funding acquisition, S.A.R.S.A.H. All authors have read and agreed to the published version of the manuscript.

Funding

This research was funded by the following grants: Ministry of Higher Education Malaysia for Prototype Research Grant Scheme with Project Code: PRGS/2/2019/TK05/USM/02/1, MOHE Fundamental Research Grant Scheme (FRGS) grant no: 203/PBAHAN/6071364, and USM Research University Individual (RUI) grant no: 1001/PBAHAN/814273. Further support by USM research grant was entitled Geran Bridging # 304/PBAHAN/6316116 and Nippon Sheet Glass Research Grant (NSGRG) (No. 304/PBAHAN/650360/N120).

Acknowledgments

The authors wish to thank Universiti Sains Malaysia (USM) and Ministry of Higher Education (MOHE) of Malaysia for supporting this work.

Conflicts of Interest

The authors declare no conflict of interest.

Appendix A. Process Simulation Setting

Table A1. Scheduling summary for the simulation model of 1000 kg Ti/batch.
ProcedureOperationProcess Time a (h)Start Time (h)End Time (h)
P-1Grinding ilmenite below 75 µm1.2501.25
P-1/2Mixing ilmenite with coal1.251.252.50
P-2Ilmenite reduction with H2-N2 gases mixture at 1250 °C12.312.5014.81
P-3TiN with Fe aeration leaching at 90 °C to remove Fe particles9.0014.8123.81
P-4Filtration to separate TiN from Fe particles4.2523.8128.06
P-4/1Filtration to separate Fe2O3 from NH4Cl solution4.2523.8128.06
P-5Acid washing at room temperature to remove any excess Fe particles from TiN7.4328.0635.49
P-5/1FeCl2 Storage for sewage treatment industries7.3232.8540.17
P-6TiN chlorination process at 350 °C7.6432.8540.49
P-7TiCl4 Reduction process in H2 atmosphere at 500 °C14.0040.4954.49
P-8Water washing at room temperature to remove impurities from TiH21.2554.4955.74
P-8/1MgCl2 electrolysis to produce Mg metal3.5055.7459.24
P-9TiH2 dehydrogenation to Ti powder at 700 °C4.5055.7460.24
P-10H2 gas Storage3.5056.2459.24
a Processing time included the required time for charging and transferring out the materials.
Table A2. Specifications of simulation model.
ProcessDescription
Reduction reactor at P-2heating for 3 h at 1250 °C, extent of reaction 100%
Aeration leaching at P-3leaching at 90 °C for 7 h, extent of leaching 95%
Microfiltration at P-4filtration for 2 h with recovery yield of 90%
Microfiltration at P-4/1filtration for 4 h with recovery yield of 90%
Acid washing in P-5washing for 30 min and separation for 1 h with 100% recovery at room temperature
Chlorination reaction at P-6heating for 5 h at 350 °C, extent of chlorination 95%
Reduction reaction in P-7heating for 12 h at 500 °C, extent of reaction 95%
Acid washing and separation in P-8washing for 1 h with 100% recovery after filtration
Electrolysis in P-8/1reaction duration for 1 h at room temperature, extent of separation 100%
Dehydrogenation in P-9heating for 3 h at 700 °C, extent of reaction 100%
Table A3. Equipment types and size for Ti powder plant for different production scale of Ti powder.
NameTypeProduction Scale
1-t/Batch5-t/Batch10-t/Batch
R-101Stirred Reactor1.21 m31.52 m31.73 m3
AFR-101Air-Lift Fermentor124,952.11 L624,760.53 L1,249,521.06 L
GR-101Grinder3519.05 kg/h17,595.23 kg/h35,190.46 kg/h
MF-101Microfilter2.15 m210.74 m221.48 m2
MF-102Microfilter2.80 m214.00 m228.01 m2
SFR-101Shake FlaskRack2224.00 L11,120.00 L22,240.00 L
MX-101Mixer4632.32 kg/h23,161.60 kg/h46,323.21 kg/h
R-102Stirred Reactor277.62 L1388.08 L2776.15 L
V-101Horizontal Tank1946.24 L9731.18 L19,462.35 L
R-103Stirred Reactor2,312.99 L11,564.93 L23,129.86 L
WSH-101SWasher (Bulk Flow)5149.38 kg/h12,873.45 kg/h12,873.45 kg/h
R-104Stirred Reactor2361.94 L11,809.69 L23,619.38 L
R-105Stirred Reactor308.76 L1543.78 L3087.57 L
V-102Horizontal Tank3214.24 L16,071.20 L32,142.41 L

Appendix B. Process Costs

Table A4. Equipment unit cost and required number for different production scale of Ti powder.
Name1-t/Batch5-t/Batch10-t/Batch
Unit Cost ($)NumberUnit Cost ($)NumberUnit Cost ($)Number
R-101649,0001670,0004682,0007
AFR-101436,00011,106,00011,700,0001
GR-101105,0001174,0001260,0001
MF-10130,000148,000173,0001
MF-10230,000156,000185,0001
SFR-101010101
MX-101010101
R-102531,0001661,0001728,0001
V-10129,000169,0001101,0001
R-103710,0001844,0001984,0001
WSH-101010204
R-104712,0001848,0001989,0001
R-105538,0001671,0001738,0001
V-10260,0001134,0001229,0001
Table A5. Annual materials cost for different production scale of Ti powder.
Material1 t/Batch5 t/Batch10 t/Batch
Hydrogen (m3)5,103,99211,397,70511,624,751
Nitrogen (m3)309,694691,576705,352
Ammonium chloride (kg)7,054,07315,752,42316,066,216
Water (kg)000
Oxygen (kg)000
Ilmenite (kg)7,910,81517,665,61118,017,515
Hydrochloric acid (kg)121,323270,926276,323
Carbon (kg)625,6601,397,1601,424,992
Chlorine (kg)2,306,0885,149,7165,252,300
Magnesium hydride (kg)98,764,347220,550,276224,943,708
Total price ($)122,195,993272,875,393278,311,158
NOTE: Bulk material consumption amount includes material used such as: raw material, cleaning agent, and heat transfer agent (if utilities are included in the operating cost).
Table A6. Annual utilities cost for different production scale of Ti powder.
ParameterUnit Cost ($)1 t/Batch5 t/Batch10 t/Batch
AmountCost ($)AmountCost ($)AmountCost ($)
Std Power (Kwh)0.100249,99424,999558,26155,826569,38256,938
Steam (MT)4.200715430,04515,97567,09416,29368,431
Chilled Water (MT)0.400413816559241369694253770
Steam (High P) (MT)20.000101972244122450
TOTAL ($) 56,897 127,057 129,588

Appendix C. Percentage Coefficient for Capital Cost

Table A7. The percentage coefficient of direct plant cost factors.
NamePercentageNamePercentage
Piping35% EPC 1Auxiliary facilities40% EPC
Instrumentation40% EPCEngineering fee25% DC 2
Insulation3% EPCConstruction35% DC
Electrical facilities10% EPCContractor fee5% (DC + IC 3)
Building45% EPCContingency fee10% (DC + IC)
Yard improvement15% EPC
1 Equipment purchase cost, 2 direct plant cost, and 3 indirect plant cost.

Appendix D. Sensitivity Analysis Assumptions

Table A8. Input parameters used for sensitivity analysis.
VariableBase Case ValuesDistributionVariation and Range
Reduction process in P-714Triangular12.60–15.40
Dehydrogenation process in P-94.5Triangular4.05–4.95
R-102 stirred reactor cost661,000NormalS.D. = 0.1
R-103 stirred reactor cost844,000NormalS.D. = 0.1
R-104 stirred reactor cost848,000NormalS.D. = 0.1
Hydrogen price11,397,705NormalS.D. = 0.1
Ammonium chloride price15,752,423NormalS.D. = 0.1
Ilmenite price17,665,611NormalS.D. = 0.1
MgH2 price220,550,276NormalS.D. = 0.1
Chlorine price5,149,716NormalS.D. = 0.1
S.D.: Standard deviation.

References

  1. Ezugwu, E.; Bonney, J.; Yamane, Y. An overview of the machinability of aeroengine alloys. J. Mater. Process. Technol. 2003, 134, 233–253. [Google Scholar] [CrossRef]
  2. Boyer, R.R. Attributes, characteristics, and applications of titanium and its alloys. JOM 2010, 62, 21–24. [Google Scholar] [CrossRef]
  3. Crowley, G. How to Extract Low-Cost Titanium. Adv. Mater. Process 2003, 161, 25–27. [Google Scholar]
  4. Fray, D.J. Novel methods for the production of titanium. Int. Mater. Rev. 2008, 53, 317–325. [Google Scholar] [CrossRef]
  5. Takeda, O.; Uda, T.; Okabe, T.H. Rare Earth, Titanium Group Metals, and Reactive Metals Production. In Treatise on Process Metallurgy, Volume 3: Industrial Processes, Part A; Seetharaman, S., Mclean, A., Guthrie, R., Sridhar, S., Eds.; Elsevier: Oxford, UK, 2014; pp. 995–1069. [Google Scholar]
  6. Van Vuuren, D.S. A Critical Evaluation of Processes to Produce Primary Titanium. J. S. Afr. Inst. Min. Metall. 2009, 109, 455–461. [Google Scholar]
  7. Kraft, E.H. Summary of Emerging Titanium Cost Reduction Technologies; Study for US DofE and ORNL/Subcontract 4000023694; EHK Technology: Vancouver, WA, USA, 2004. [Google Scholar]
  8. McCracken, C.G.; Motchenbacher, C.; Barbis, D.P. Review of titanium-powder-production methods. Int. J. Powder Metall. 2010, 46, 19–26. [Google Scholar]
  9. Van Vuuren, D.S.; Oosthuizen, S.J.; Heydenrych, M.D. Titanium production via metallothermic reduction of TiCl4 in molten salt: Problems and products. J. S. Afr. Inst. Min. Metall. 2011, 111, 141–148. [Google Scholar]
  10. Doblin, C.; Chryss, A.; Monch, A. Titanium Powder from the TiRO™ Process. Key Eng. Mater. 2012, 520, 95–100. [Google Scholar] [CrossRef]
  11. Oosthuizen, S.J. In search of low cost titanium: The Fray Farthing Chen (FFC) Cambridge process. J. S. Afr. Inst. Min. Metall. 2011, 111, 199–202. [Google Scholar]
  12. Chen, W.; Yamamoto, Y.; Peter, W.; Clark, M.; Nunn, S.; Kiggans, J.; Muth, T.; Blue, C.; Williams, J.; Akhtar, K. The investigation of die-pressing and sintering behavior of ITP CP-Ti and Ti-6Al-4V powders. J. Alloy. Compd. 2012, 541, 440–447. [Google Scholar] [CrossRef]
  13. Van Vuuren, D.S. Direct titanium powder production by metallothermic processes. In Titanium Powder Metallurgy: Science, Technology and Applications; Qian, M., Froes, F.H., Eds.; Elsevier: Amsterdam, The Netherlands, 2015; pp. 69–93. [Google Scholar]
  14. Fang, Z.Z.; Middlemas, S.; Guo, J.; Fan, P. A New, Energy-Efficient Chemical Pathway for Extracting Ti Metal from Ti Minerals. J. Am. Chem. Soc. 2013, 135, 18248–18251. [Google Scholar] [CrossRef]
  15. Zhang, Y.; Fang, Z.Z.; Xia, Y.; Sun, P.; Devener, B.V.; Free, M.; Lefler, H.; Zheng, S. Hydrogen assisted magnesiothermic reduction of TiO2. Chem. Eng. J. 2017, 308, 299–310. [Google Scholar] [CrossRef] [Green Version]
  16. Ahmadi, E.; Yashima, Y.; Suzuki, R.O.; Rezan, S. Formation of Titanium Sulfide from Titanium Oxycarbonitride by CS2 Gas. Metall. Mater. Trans. B 2018, 49, 1808–1821. [Google Scholar] [CrossRef]
  17. Suzuki, R.O.; Ono, K.; Teranuma, K. Calciothermic reduction of titanium oxide and in-situ electrolysis in molten CaCl2. Metall. Mater. Trans. B 2003, 34, 287–295. [Google Scholar] [CrossRef]
  18. Suzuki, R.O.; Natsui, S.; Kikuchi, T. Recent Studies on Titanium Refining: 2017–2020. Mater. Trans. 2021, 62, 905–913. [Google Scholar] [CrossRef]
  19. U.S. Geological Survey, Mineral Commodity Summaries, February 2019. Titanium Statistics and Information. Available online: https://prd-wret.s3-us-west-2.amazonaws.com/assets/palladium/production/atoms/files/mcs-2019-timin.pdf (accessed on 29 June 2021).
  20. Geetha, K.; Surender, G. Experimental and modelling studies on the aeration leaching process for metallic iron removal in the manufacture of synthetic rutile. Hydrometallurgy 2000, 56, 41–62. [Google Scholar] [CrossRef]
  21. Yaraghi, A.; Sapri, M.H.A.; Baharun, N.; Rezan, S.A.; Shoparwe, N.I.; Ramakrishnan, S.; Ariffin, K.S.; Fauzi, M.A.; Zabidi, H.B.; Ismail, H.; et al. Aeration Leaching of Iron from Nitrided Malaysian Ilmenite Reduced by Polystyrene-Coal Reductant. Procedia Chem. 2016, 19, 715–720. [Google Scholar] [CrossRef] [Green Version]
  22. Ahmadi, E.; Rezan, S.A.; Baharun, N.; Ramakrishnan, S.; Fauzi, M.N.A.; Zhang, G. Chlorination Kinetics of Titanium Nitride for Production of Titanium Tetrachloride from Nitrided Ilmenite. Metall. Mater. Trans. B 2017, 48, 2354–2366. [Google Scholar] [CrossRef]
  23. Ahmadi, E.; Fauzi, M.N.A.; Hussin, H.; Baharun, N.; Ariffin, K.S.; Rezan, S.A. Synthesis of titanium oxycarbonitride by carbothermal reduction and nitridation of ilmenite with recycling of polyethylene terephthalate (PET). Int. J. Min. Met. Mater. 2017, 24, 444–454. [Google Scholar] [CrossRef]
  24. Ardani, M.R.; Al Janabi, A.S.M.; Udayakumar, S.; Rezan, S.A.; Mohamed, A.R.; Lee, H.L.; Ibrahim, I. Reduction of TiCl4 to TiH2 with CaH2 in presence of Ni powder. In Rare Metal Technology 2019; Azimi, G., Kim, H., Alam, S., Ouchi, T., Neelameggham, N.R., Baba, A.A., Eds.; Springer: Cham, Switzerland, 2019; pp. 131–144. [Google Scholar]
  25. Ardani, M.R.; Fauzi, M.N.A.; Rezan, S.A.; Mohamed, A.R.; Lee, H.L.; Ibrahim, I. Thermodynamic Investigation of Titanium Hydride Formation from Reduction of Titanium (Ⅳ) Chloride with Magnesium Hydride in Presence of Hydrogen Atmosphere. MATEC Web Conf. 2020, 321, 07014. [Google Scholar] [CrossRef]
  26. Ardani, M.R.; Rezan, S.A.; Lee, H.L.; Mohamed, A.R.; Ibrahim, I. Low Temperature Synthesis Method of TiH2 Powder from TiCl4 Reduction with MgH2. In Proceedings of the TMS 2020 149th Annual Meeting & Exhibition Supplemental Proceedings, San Diego, CA, USA, 23–27 February 2020; The Minerals, Metals & Materials Society, Ed.; Springer: Cham, Switzerland, 2020; pp. 1669–1679. [Google Scholar]
  27. Robertson, M.I.; Schaffer, G.B. Comparison of sintering of titanium and titanium hydride powders. Powder Metall. 2010, 53, 12–19. [Google Scholar] [CrossRef]
  28. Fang, Z.Z.; Fan, P.; Middlemas, S.; Guo, J.; Zhang, Y.; Free, M.; Sathyapalan, A.; Xia, Y. Producing a Titanium Product. U.S. Patent US2016/0194733 A1, 7 July 2016. [Google Scholar]
  29. Granjo, J.F.O.; Oliveira, N.M.C. Process Simulation and Techno-Economic Analysis of the Production of Sodium Methoxide. Ind. Eng. Chem. Res. 2016, 55, 156–167. [Google Scholar] [CrossRef]
  30. Rodrigues, V.H.; de Melo, M.M.; Portugal, I.; Silva, C.M. Simulation and techno-economic optimization of the supercritical CO2 extraction of Eucalyptus globulus bark at industrial scale. J. Supercrit. Fluids 2019, 145, 169–180. [Google Scholar] [CrossRef]
  31. Larbi, F.; García, A.; del Valle, L.J.; Hamou, A.; Puiggalí, J.; Belgacem, N.; Bras, J. Simulation basis for a techno-economic evaluation of chitin nanomaterials production process using Aspen Plus® software. Data Brief 2018, 20, 1556–1560. [Google Scholar] [CrossRef] [PubMed]
  32. Alfonso-Cardero, A.; Pagés-Díaz, J.; Contino, F.; Rajendran, K.; Lorenzo-Llanes, J. Process simulation and techno-economic assessment of vinasse-to-biogas in Cuba: Deterministic and uncertainty analysis. Chem. Eng. Res. Des. 2021, 169, 33–45. [Google Scholar] [CrossRef]
  33. Petrides, D.; Sapidou, E.; Calandranis, J. Computer-aided process analysis and economic evaluation for biosynthetic human insulin production—A case study. Biotechnol. Bioeng. 1995, 48, 529–541. [Google Scholar] [CrossRef] [PubMed]
  34. Tan, J.; Foo, D.C.Y.; Kumaresan, S.; Aziz, R.A. Debottlenecking of a Batch Pharmaceutical Cream Production. Pharm. Eng. 2006, 26, 72–84. [Google Scholar]
  35. Koulouris, A.; Calandranis, J.; Petrides, D.P. Throughput Analysis and Debottlenecking of Integrated Batch Chemical Processes. Comput. Chem. Eng. 2000, 24, 1387–1394. [Google Scholar] [CrossRef]
  36. Athimulam, A.; Kumaresan, S.; Foo, D.; Sarmidi, M.; Aziz, R. Modelling and Optimization of Eurycoma longifolia Water Extract Production. Food Bioprod. Process. 2006, 84, 139–149. [Google Scholar] [CrossRef] [Green Version]
  37. Alshekhli, O.; Foo, D.C.Y.; Hii, C.L.; Law, C.L. Process Simulation and Debottlenecking for An Industrial Cocoa Manufacturing Process. Food Bioprod. Process. 2011, 89, 528–536. [Google Scholar] [CrossRef]
  38. Noor, N.Z.M.; Foo, D.C.Y.; Rahman, B.A.; Aziz, R.A. Modelling and Uncertainty Analysis for Pilot Scale Monoclonal Antibody Production. Pharm. Eng. 2014, 34, 40–54. [Google Scholar]
  39. Gebremariam, S.N.; Marchetti, J.M. Process simulation and techno-economic performance evaluation of alternative technologies for biodiesel production from low value non-edible oil. Biomass Bioenergy 2021, 149, 106102. [Google Scholar] [CrossRef]
  40. Lim, S.S.; Foo, D.C. Simulation and scale-up study for a chitosan–TiO2 nanotubes scaffold production. Food Bioprod. Process. 2017, 106, 108–116. [Google Scholar] [CrossRef]
  41. Sayar, N.A.; Şam, S.D.; Pinar, O.; Serper, D.; Akbulut, B.S.; Kazan, D.; Sayar, A.A. Techno-economic analysis of caffeine and catechins production from black tea waste. Food Bioprod. Process. 2019, 118, 1–12. [Google Scholar] [CrossRef]
  42. Pang, Y.X.; Yan, Y.; Foo, D.C.; Sharmin, N.; Zhao, H.; Lester, E.; Wu, T.; Pang, C.H. The influence of lignocellulose on biomass pyrolysis product distribution and economics via steady state process simulation. J. Anal. Appl. Pyrolysis 2020, 158, 104968. [Google Scholar] [CrossRef]
  43. Udayakumar, S.; Baharun, N.; Rezan, S.A.; Ismail, A.F.; Takip, K.M. Economic evaluation of thorium oxide production from monazite using alkaline fusion method. Nucl. Eng. Technol. 2021, 53, 2418–2425. [Google Scholar] [CrossRef]
  44. Ardani, M.R.; Sheikh Abdul Hamid, S.A.R.; Lee, H.L.; Mohamed, A.R.; Ibrahim, I. Characterization of TiH2 Powders Produced from TiCl4-MgH2 Reactions under Hydrogen Atmosphere. J. Mater. Eng. Perform. 2021, 30, 3243–3257. [Google Scholar] [CrossRef]
  45. Ardani, M.R.; Sheikh Abdul Hamid, S.A.R.; Mohamed, A.R. Synthesis of TiH2 powder from ilmenite using MgH2 under H2 atmosphere. Mater. Lett. 2021, 298, 129997. [Google Scholar] [CrossRef]
  46. Ahmadi, E.; Shoparwe, N.I.; Ibrahim, N.; Sheikh Abdul Hamid, S.A.R.; Baharun, N.; Ariffin, K.S.; Hussin, H.; Fauzi, M.N.A. The Effects of Experimental Variables on Iron Removal from Nitrided Malaysian Ilmenite by Becher Process. In Extraction 2018; Davis, B., Moats, M.S., Wang, S., Gregurek, D., Kapusta, J., Battle, T.P., Schlesinger, M.E., Flores, G.R.A., Jak, E., Goodall, G., et al., Eds.; The Minerals, Metals & Materials Series; Springer: Cham, Switzerland, 2018; pp. 1383–1396. [Google Scholar]
  47. Yaraghi, A.; Sapri, M.H.A.; Ahmadi, E.; Baharun, N.; Rezan, S.; Shoparwe, N.F.; Ramakrishan, S.; Ariffin, K.S.; Fauzi, M.N.A.; Zabidi, H.; et al. Microstructural Study of Leached Nitrided Malaysian Ilmenite with Coal-Polystyrene Reductant. Key Eng. Mater. 2016, 701, 132–137. [Google Scholar] [CrossRef]
  48. Roine, A. Outokumpu HSC Chemistry, Chemical Reaction and Equilibrium Software with Extensive Thermochemical Database; Finland Outokumpu Research Oy: Temper, Finland, 2006. [Google Scholar]
  49. Intelligen. SuperPro Designer User’s Guide; Intelligen, Inc.: Scotch Plains, NJ, USA, 2006. [Google Scholar]
  50. Stull, D.R.; Prophet, H. JANAF Thermochemical Tables, 2nd ed.; National Standard Reference Data System: USA, 1971. Available online: https://www.govinfo.gov/app/details/GOVPUB-C13-bfd606acc2525ccef2762b19002a6d4f (accessed on 30 August 2021).
  51. Barin, I. Thermochemical Data of Pure Substances, 3rd ed.; Wiley-VCH: Weinheim, Germany, 1995. [Google Scholar]
  52. Rezan, S.; Zhang, G.; Ostrovski, O. Carbothermal Reduction and Nitridation of Titanium Dioxide in a H2-N2 Gas Mixture. J. Am. Ceram. Soc. 2011, 94, 3804–3811. [Google Scholar] [CrossRef]
  53. Hui, Y.J.; Shoparwe, N.I.; Rezan, S.A.; Baharun, N.; Sreekantan, S.; Fauzi, A.M.N. Effect of Carbon Reductant on the Formation of Copper Doped Titanium Oxycarbonitride by Carbothermal Reduction and Nitridation. In 8th International Symposium on High-Temperature Metallurgical Processing; Hwang, J.Y., Jiang, T., Kennedy, M.W., Yucel, O., Pistorius, P., Seshadri, V., Zhao, B., Gregurek, D., Keskinkilic, E., Eds.; The Minerals Metals & Materials Series; Springer: Cham, Switzerland, 2017. [Google Scholar]
  54. Udayakumar, S.; Sadaqi, A.; Ibrahim, N.; Fauzi, M.N.A.; Ramakrishnan, S.; Rezan, S.A. Mathematical Modelling of Titanium Hydride Formation from Titanium Tetrachloride with Magnesium Hydride using Matlab. J. Phys. Conf. Ser. 2018, 1082, 012037–012043. [Google Scholar] [CrossRef]
  55. Udayakumar, S.; Sadaqi, A.; Ibrahim, N.; Fauzi, M.N.A.; Ramakrishnan, S.; Rezan, S.A. Formation of Titanium Hydride from the Reaction Between Magnesium Hydride and Titanium Tetrachloride. J. Phys.Conf. Ser. 2018, 1082, 012003. [Google Scholar] [CrossRef] [Green Version]
  56. Lewis, R.J. Hawley’s Condensed Chemical Dictionary, 15th ed.; John Wiley & Sons, Inc.: Hoboken, NJ, USA, 2007. [Google Scholar]
  57. Rezan, S.; Zhang, G.; Ostrovski, O. Carbothermal Reduction and Nitridation of Ilmenite Concentrates. ISIJ Int. 2012, 52, 363–368. [Google Scholar] [CrossRef] [Green Version]
  58. Rezan, S.A.; Zhang, G.Q.; Ostrovski, O. Phase Development in Carbothermal Reduction and Nitridation of Ilmenite Concentrates. High Temp. Mater. Process. 2012, 31, 381–388. [Google Scholar] [CrossRef]
  59. Teyssandier, F.; Allendorf, M.D. Thermodynamics and Kinetics of Gas-Phase Reactions in the Ti-Cl-H System. J. Electrochem. Soc. 1998, 145, 2167–2178. [Google Scholar] [CrossRef]
  60. Zhang, Y.; Wang, C.; Liu, Y.; Liu, S.; Xiao, S.; Chen, Y. Surface Characterizations of TiH2 Powders before and after Dehydrogenation. Appl. Surf. Sci. 2017, 410, 177–185. [Google Scholar] [CrossRef]
  61. Couper, J.R.; Herts, D.W.; Smith, L. Process Economics. In Perry’s Chemical Engineers’ Handbook, 8th ed.; Green, D., Perry, R., Eds.; McGraw-Hill: New York, NY, USA, 2007; pp. 9/1–9/56. [Google Scholar]
  62. Sanjith, U.; Choong, W.; Sivakumar, R.; Fauzi, M.; Rezan, S. Kinetic modelling of oxidation of metallic iron to iron sulfate from iron-titanium oxycarbonitride composite. Mater. Today Proc. 2019, 17, 525–533. [Google Scholar] [CrossRef]
  63. Becher, R.G.; Canning, R.G.; Goodheart, B.A.; Uusna, S. A new process for upgrading ilmenite mineral sands. Proc. Aust. Min. Metall. 1965, 214, 21–44. [Google Scholar]
  64. Liu, J.; He, K.; Tang, S.; Wang, T.; Zhang, Z. A comparative study of ferrous, ferric and ferrate pretreatment for ceramic membrane fouling alleviation in reclaimed water treatment. Sep. Purif. Technol. 2019, 217, 118–127. [Google Scholar] [CrossRef]
  65. Swaminathan, K.; Subramanian, C.; Rao, C.S. The pressure oxidation of acidic FeCl2 solution with oxygen. Hydrometallurgy 1981, 6, 339–346. [Google Scholar] [CrossRef]
  66. Ahmadi, E.; Sheikh Abdul Hamid, S.A.R.; Hussin, H.; Baharun, N.; Ramakrishnan, S.; Ariffin, K.S.; Fauzi, A.M.N. The Preparation of Iron-Free TiCl4 from Reduced and Nitrided Ilmenite by Polyethylene Terephthalate. INROADS 2016, 5, 11–16. [Google Scholar]
  67. Moxson, V.S.; Duz, V.A.; Klevtsov, A.G.; Sukhoplyuev, V.D.; Sopka, M.D.; Shuvalov, Y.V.; Matviychuk, M. Manufacturing Pure Titanium Hydride Powder and Alloyed Titanium Hydride Powders by Combined Hydrogen-Magnesium Reduction of Metal Halides. U.S. Patent 9067264, 30 June 2015. [Google Scholar]
  68. Peters, M.S.; Timmerhaus, K.D.; West, R.E. Plant Design and Economics for Chemical Engineers, 5th ed.; McGraw-Hill: New York, NY, USA, 2003. [Google Scholar]
  69. Achilleos, E.C.; Calandranis, J.C.; Petrides, D.P. Quantifying the impact of uncertainty parameters in the batch manufacturing of active pharmaceutical ingredients. Pharm. Eng. 2006, 26, 1–6. [Google Scholar]
  70. Heinzle, E.; Biwer, A.P.; Cooney, C.L. Development of Sustainable Bioprocesses: Modelling and Assessment; Wiley: Hoboken, NJ, USA, 2007. [Google Scholar]
Figure 1. Schematics of a proposed process of Ti powder production from ilmenite.
Processes 09 01567 g001
Figure 2. Ti-Cl-H predominance diagram at a partial pressure of Cl2 (a) P C l 2 = 1 × 10⁻³⁰ atm; (b) P C l 2 = 1 × 10⁻³⁵ atm.
Processes 09 01567 g002
Figure 3. Mg-Cl-H predominance diagram at P C l 2 = 1 × 10⁻³⁰ atm.
Processes 09 01567 g003
Figure 4. Theoretical equilibrium phase composition calculated for molar ratio of (a) TiCl4:MgH2 = 2:2 and (b) TiCl4:MgH2 = 3:2.
Processes 09 01567 g004
Figure 5. Effect of X T i C l 4 ° in TiCl4-MgH2 reaction system on (a) equilibrium amount of TiH2 and (b) equilibrium TiH2 mole fraction.
Processes 09 01567 g005
Figure 6. Effect of X T i C l 4 ° on TiH2 formation efficiency in the temperature range up to 700 °C for TiCl4-MgH2 reaction system.
Processes 09 01567 g006
Figure 7. XRD analysis data for raw ilmenite, nitrided ilmenite before and after Becher process, and reduction process of TiCl4 with MgH2 at 500 °C for 12 h.
Processes 09 01567 g007
Figure 8. SEM images for: (a) as-received ilmenite, (b) reduced ilmenite under H2-N2 atmosphere, (c) reduced ilmenite after leaching process with spherical Fe particles, and (d) TiH2 powder after water washing and acid leaching. (Point (1) is EDX analysis micrograph for raw ilmenite, point (2) is EDX analysis micrograph for spherical particles in reduced ilmenite, and point (3) is EDX micrograph for obtained TiH2 powder after water washing and acid leaching).
Processes 09 01567 g008
Figure 9. Simulation flowsheet for titanium powder production in SuperPro Designer.
Processes 09 01567 g009
Figure 10. Probability distribution diagram after 5000 trials for (a) ROI and (b) unit production costs.
Processes 09 01567 g010
Figure 11. Contribution of uncertain parameters to the variance of (a) ROI and (b) unit production cost.
Processes 09 01567 g011
Table 1. Standard Gibbs free energy of formation for the compounds in the investigated system from 0 to 700 °C.
ComponentStandard Gibbs Energy of Formation ( Δ G f ° )   ( kJ / mol ) Reference
HCl (g) Δ G f ° = −93.084 − 0.008T[50]
MgCl2 Δ G f ° = −638.230 + 0.157T[50]
MgH2 Δ G f ° = −78.504 + 0.139T[51]
TiCl2 Δ G f ° = −512.330 + 0.158T[50]
TiCl2 (g) Δ G f ° = −238.000 − 0.022T[50]
TiCl3 Δ G f ° = −716.800 + 0.212T[50]
TiCl3 (g) Δ G f ° = −539.510 + 0.049T[50]
TiCl4 (g) Δ G f ° = −762.400 + 0.119T[50]
TiH2 Δ G f ° = −147.290 + 0.140T[50]
Ti2Cl6 (g) Δ G f ° = −245.430 − 0.018T[51]
Table 2. Overall process parameters for process simulation for different production scales of Ti powder.
Parameter1 t/batch5 t/batch10 t/batch
Utilized annual operation time (h/year)7914.247898.547894.90
Recipe batch time (h)60.2483.45124.09
Recipe cycle time (h)14.0031.2661.19
Number of batches per year562251128
Total amount of Ti produced (kg/year)562,0001,255,0001,280,000
Table 3. The required amount of raw material with their unit costs for different production scale.
Raw MaterialUnit CostAmount for Different Production Scales of Ti (kg/Batch)
1-t/Batch5-t/Batch10-t/Batch
NH4Cl 3.2 M (11% NH4Cl and 89% water)0.11 $/kg114,106.65570,533.241,141,066.48
Carbon (C)1.00 $/kg1113.275566.3711,132.74
Chlorine gas (Cl2)1.25 $/kg3282.6816,413.4332,826.87
HCl 1 M (9.7% HCl and 90.3% water) (P-5)0.097 $/kg1873.649368.1918,736.37
HCl 1 M (9.7% HCl and 90.3% water) (P-8)0.097 $/kg351.911759.523519.05
H2 gas (P-2)8.60 $/m393.25466.27932.55
H2 gas (P-7)8.60 $/m30.211.042.08
Ilmenite (FeTiO3)4.0 $/kg3519.0417,595.2335,190.45
Magnesium hydride (MgH2)143.00 $/kg1228.936144.6612,289.32
Nitrogen gas (N2)2.10 $/m3323.751618.763237.52
Oxygen gas (O2) (from air)0.0529.322646.635293.26
Table 4. The total equipment cost per batch for different production scales of Ti powder in USD.
Name1-t/Batch5-t/Batch10-t/Batch
NumberTotal CostsNumberTotal CostsNumberTotal Costs
R-1011649,00042,680,00074,774,000
AFR-1011436,00011,106,00011,700,000
GR-1011105,0001174,0001260,000
MF-101130,000148,000173,000
MF-102130,000156,000185,000
R-1021531,0001661,0001728,000
V-101129,000169,0001101,000
R-1031710,0001844,0001984,000
R-1041712,0001848,0001989,000
R-1051538,0001671,0001738,000
V-102160,0001134,0001229,000
Total price ($) 3,830,000 7,291,000 10,661,000
Table 5. Fixed capital estimate summary for different scale of Ti powder plant in USD.
Parameter1-t/Batch5-t/Batch10-t/Batch
Equipment Purchase Cost4,697,5009,114,00013,326,000
Total Plant Direct Cost (TPDC)15,539,00029,630,00044,344,000
Total Plant Indirect Cost (TPIC)9,323,00017,778,00026,007,000
Contractor’s Fee and Contingency3,729,0007,111,00010,403,000
Direct Fixed Capital Cost28,054,38854,519,00079,753,000
Table 6. Economic performance summary for different production scale.
Parameter1-t/Batch5-t/Batch10-t/Batch
Total Capital Investment ($)42,427,00083,025,000109,793,000
Operating Cost ($/year)138,577,000284,499,000286,964,000
Revenues ($/year)140,500,000313,750,000320,000,000
Net Profit ($/year)4,523,00032,675,00038,630,000
Cost Basis Annual Rate (kg MP/year) a562,0001,255,0001,280,000
Unit Production Cost ($/kg MP)246.58226.69224.19
Unit Production Revenue ($/kg MP)250.00250.00250.00
Gross Margin (%)1.379.3210.32
Return on Investment (ROI) (%)10.6639.3635.18
Payback Time (year)9.382.542.84
Rate of Return (IRR) after taxes (%)9.7763.2053.83
a MP = Total Flow of Stream “Ti powder”.
Publisher’s Note: MDPI stays neutral with regard to jurisdictional claims in published maps and institutional affiliations.

