
Photovoltaic Module Fault Detection Based on a Convolutional Neural Network


1
Department of Electrical Engineering, National Chin-Yi University of Technology, Taichung 411, Taiwan
2
Undergraduate Program of Vehicle and Energy Engineering, National Taiwan Normal University, Taipei 106, Taiwan
*
Author to whom correspondence should be addressed.
Processes 2021, 9(9), 1635; https://0-doi-org.brum.beds.ac.uk/10.3390/pr9091635
Submission received: 9 August 2021
/
Revised: 1 September 2021
/
Accepted: 8 September 2021
/
Published: 10 September 2021
(This article belongs to the Special Issue Application of Power Electronics Technologies in Power System)
Abstract
:With the rapid development of solar energy, the photovoltaic (PV) module fault detection plays an important role in knowing how to enhance the reliability of the solar photovoltaic system and knowing the fault type when a system problem occurs. Therefore, this paper proposed the hybrid algorithm of chaos synchronization detection method (CSDM) with convolutional neural network (CNN) for studying PV module fault detection. Four common PV module states were discussed, including the normal PV module, module breakage, module contact defectiveness and module bypass diode failure. First of all, the defects in 16 pieces of 20W monocrystalline silicon PV modules were preprocessed, and there were four pieces of each fault state. When the signal generator delivered high frequency voltage to the PV module, the original signal was measured and captured by the NI PXI-5105 high-speed data acquisition system (DAS) and was calculated by CSDM, to establish the chaos dynamic error map as the image feature of fault diagnosis. Finally, the CNN was employed for diagnosing the fault state of the PV module. The findings show that after entering 400 random fault data (100 data for each fault) into the proposed method for recognition, the recognition accuracy rate of the proposed method was as high as 99.5%, which is better than the traditional ENN algorithm that had a recognition rate of 86.75%. In addition, the advantage of the proposed algorithm is that the mass original measured data can be reduced by CSDM, the subtle changes in the output signals are captured effectively and displayed in images, and the PV module fault state is accurately recognized by CNN.
1. Introduction
With the development of renewable energy, solar photovoltaic (PV) has become one of the key development projects [1]. However, photovoltaic systems are exposed for a long time to outdoor environments with a high temperature and high humidity, which will cause the system performance, reliability, optoelectronic and material properties of the PV module to degrade and become faulty over time [2,3,4]. In ref. [2], the electrical aging of three types of crystalline silicon PV modules with different cells, encapsulates and back-sheets are proposed for accelerating during extended damp-heat tests at different stress levels. The humidity dosage is utilized to evaluate the degradation of power and the equivalent changes of solar cell circuit parameters. In ref. [3], the researchers used the electroluminescence scanning technique to determine the degradation of the PV modules fixed on a concrete slab. The PV modules were tested in a relatively high humidity and damp-heat (DH) stress-testing chamber, in an accelerated condition at 85% and 85 °C for 4000 h. The results showed that the retention performance of the PV modules mounted on the concrete was 93.2% after a 2500-h exposure test, which was almost 5% higher than the module without the concrete. The authors in ref. [4] presented an analytical method by using a single J–V (current density versus voltage) curve to extract the accurate values of the diode parameters of silicon solar cells at different operating temperatures and in different high illumination conditions. The results showed that the method was in good agreement with the measured experimental values within a 2% discrepancy for the values of the performance parameters. In addition, the common failure types [5,6,7,8] of PV array include modules failures [5], a hot-spot, diode failure, PV system degradation [6], a snail trail [7], solder joint degradation [8], glass breakage, etc. Many researchers and scholars have studied the PV module fault diagnosis by using artificial intelligence methods [9,10,11,12]. In ref. [9], the researchers proposed a deep belief network that is optimized by a genetic algorithm deep belief networks (GA-DBN) for PV fault diagnosis, including normal operation, grounded short circuit, open-circuit in series, partial shadow and abnormal aging. Even though the overall diagnostic accuracy is 95.73%, the average training time reaches 316.34 s, due to the complex optimization process of the initial weight and bias of DBN by GA. In ref. [10], the authors proposed a fault detection method based on pattern recognition, using multi-resolution signal decomposition (MSD) and a fuzzy-logic-based decision-making system to detect line to line (LL) faults and line to ground (LG) faults. For the LL faults, the detection accuracy is 97.69%, with a 20% mismatch. For LG faults, the average accuracy reaches 97.22% when the mismatch percentage is 50%. The researchers in ref. [11] presented a novel method that uses Continuous Wavelet Transform (CWT) to generate two-dimensional (2D) images from PV system data and utilizes convolutional neural networks (CNN) to carry out the PV fault classification. The fault detection accuracy is 73.53% for six different cases consisting of no faults, a cross string (LL) fault, an open circuit, partial shading, a fault in partial shading and an arc fault. However, the 2D CNN mode takes 208 min to be fine-tuned and pre-trained. The authors in ref. [12] introduced an unsupervised dictionary learning algorithm to detect disconnections in a PV array. The results showed that the algorithm has a 97% accuracy for classifying faults, based on the disconnect location. The researchers in ref. [13] proposed a novel photovoltaic (PV) hot-spotting fault detection algorithm, based on the cumulative density function (CDF) modeling technique, with a rate accuracy of 80%, to detect six different kinds of hot-spots, including 1 to 4 hot-spotted solar cells, ≥5 hot-spotted solar cells and one hot-spotted PV string.
By means of a review of the current literature, this study is the first to propose a hybrid algorithm that combines CSDM [14,15] and CNN [16] for the fault diagnosis of PV modules. Therefore, this study firstly adopted high-frequency signals to capture PV module original voltage variation signals by using the Lorenz CSDM to obtain Chaotic Dynamic Error Maps (CDEM) as the features of fault diagnosis. Secondly, the CNN was utilized to determine the fault types of a PV module, including a normal PV module (Type 1), a PV module surface rupture (Type 2), PV module contact defectiveness (Type 3) and PV module bypass diode failure (Type 4). The advantages of the proposed method are to reduce the captured original data and to detect the valid minimum movement of the original voltage variation signals from PV modules, so that the states can be detected by CNN. In addition, the chaotic dynamic error maps, as generated by the different fault types of PV modules, have special distribution densities and positions, which is good for the recognition of CNN. The proposed method has a detection rate of 99.5%, based on the extension theory after verification through actual measurement, and which certifies that the method employed in this study is applicable to PV module detection.
The rest of this paper is organized as follows: Section 2 describes the architecture of the whole PV system, and the proposed fault diagnosis algorithm is introduced in detail in Section 3. Section 4 presents simulation results, while Section 5 draws conclusions and suggests directions for future work.
2. Architecture of the System
2.1. Photovoltaic Module Fault Signal Capture
For developing an intelligent fault detection system for a PV module in an off-line state, four different fault models were built, based on the proposed algorithm. The waveform signals generated by the use of high-frequency voltage into a PV module were employed as the source of the data analysis. The fault waveform signals were captured by the capture card and imported into the chaos system to generate a CDEM. This map was used as a characteristic sample and the fault type was recognized by CNN. The architecture is shown in Figure 1 below:
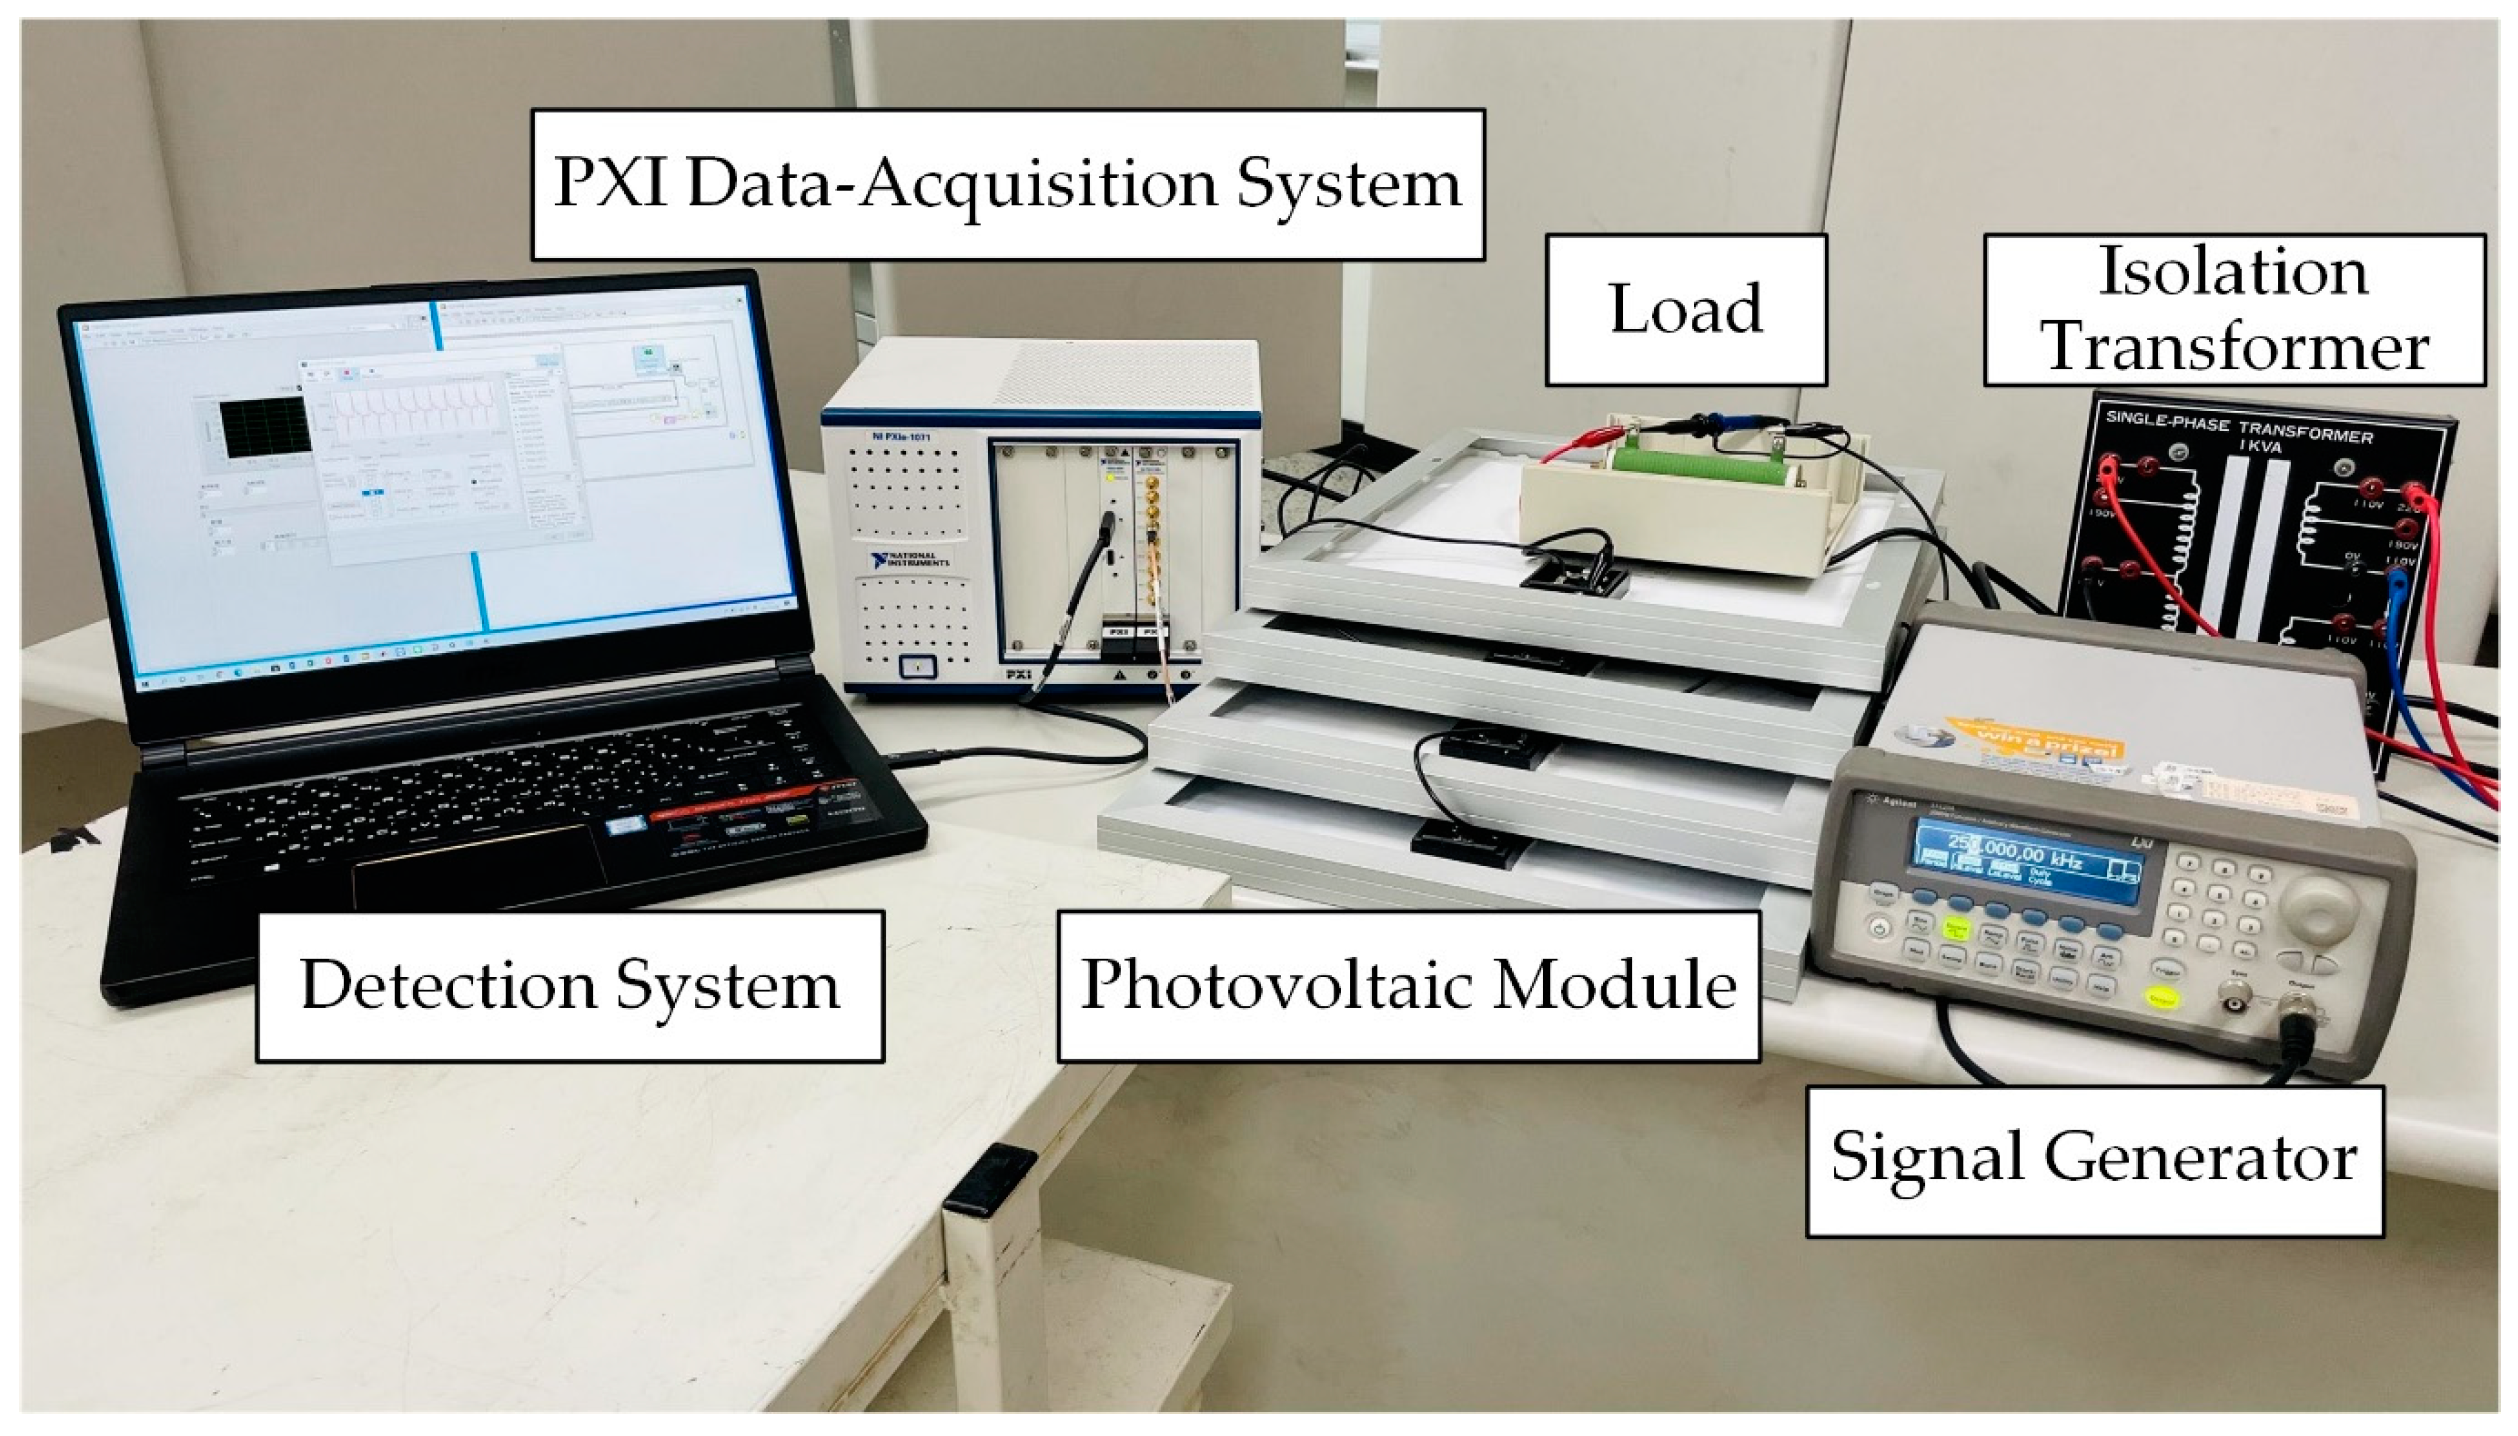
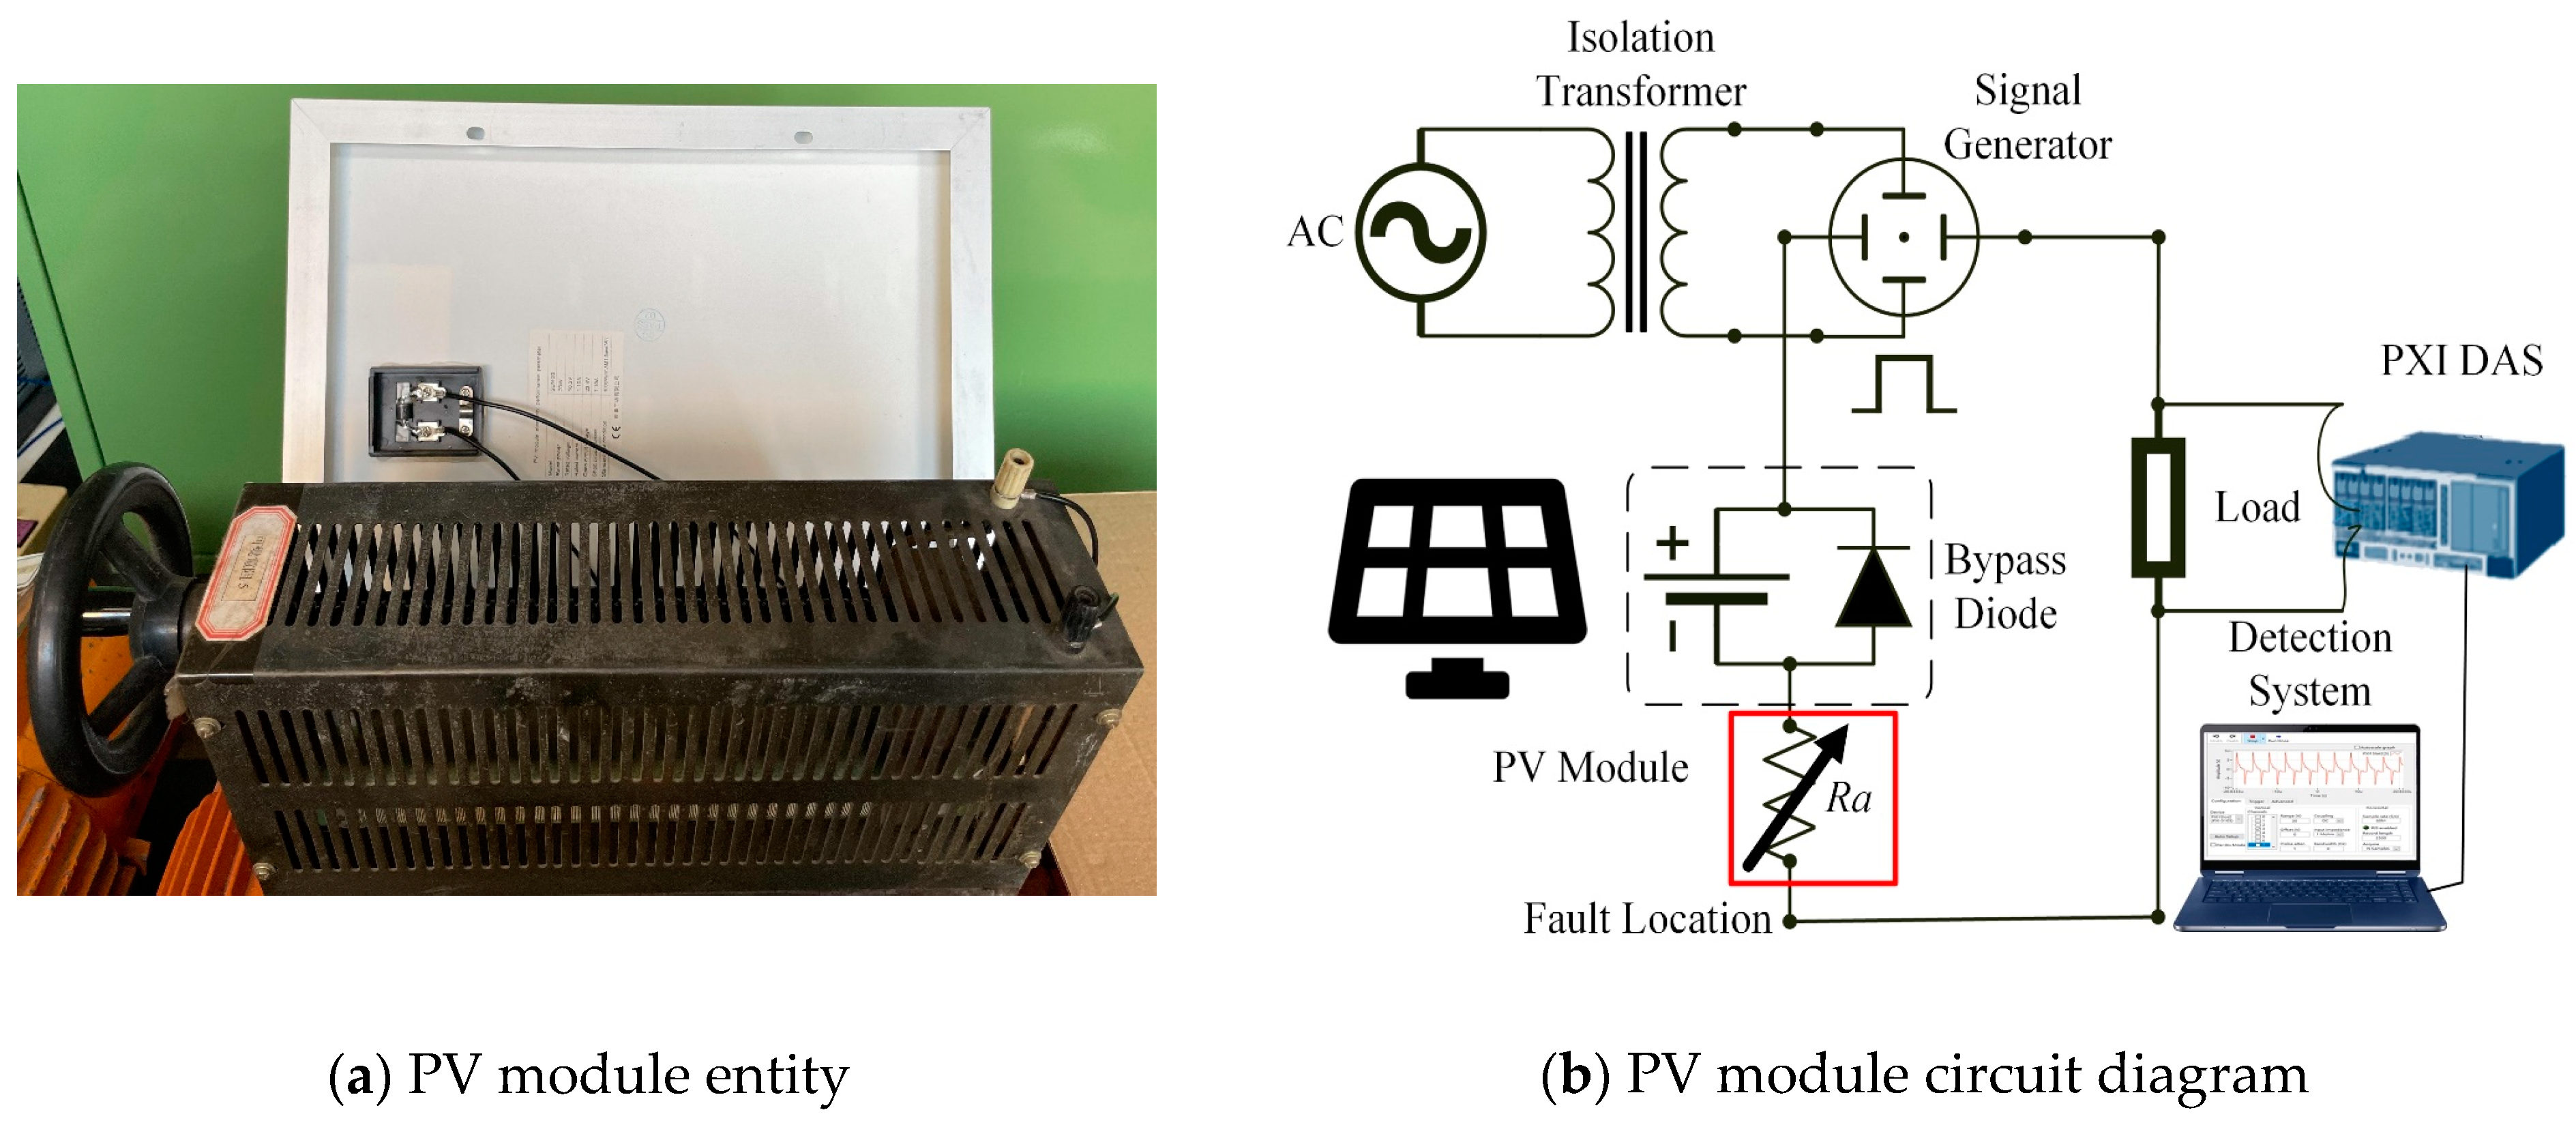
To detect the PV module fault, this study constructed a PV module testing platform. The signal generator was used as a signal input source. A 250 kHz square wave was imported into the anode and cathode of the test PV module power end. The signals were captured by NI PXI-5105 data acquisition system (DAS) and an algorithmic analysis was performed by the detection system. Figure 2 shows the signal acquisition on the PV module fault detection testing platform.
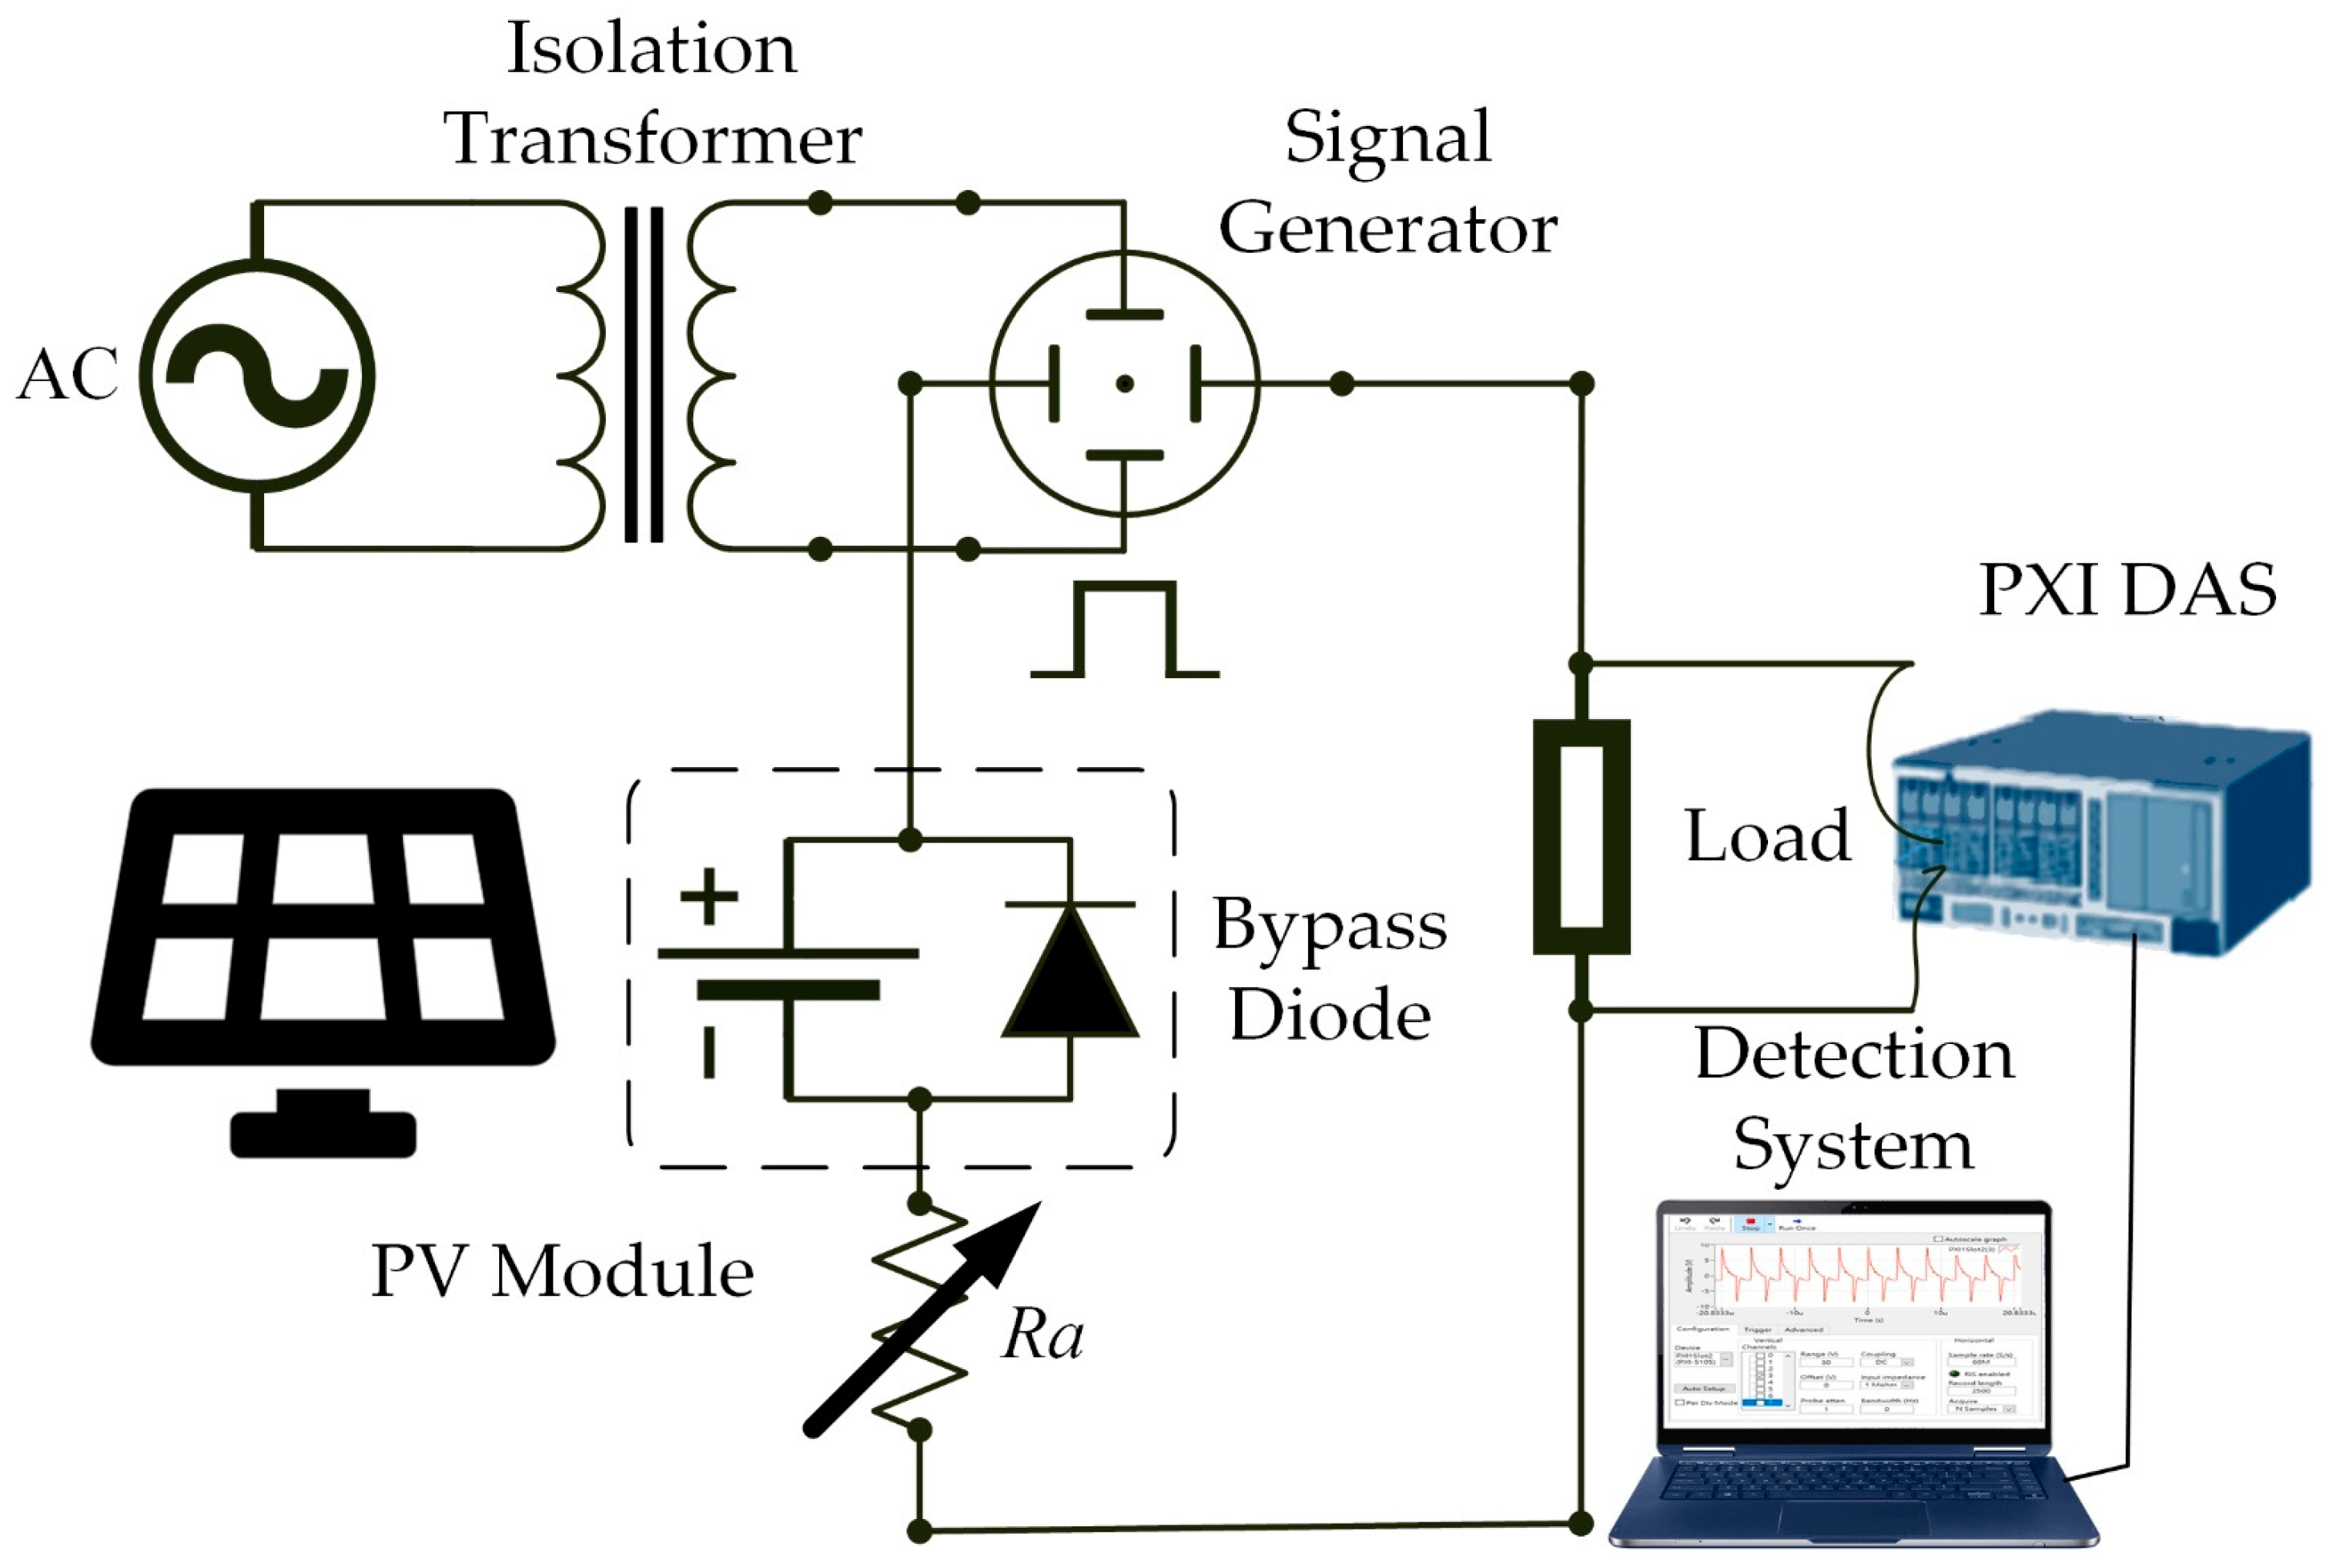
Figure 3 displays the circuit diagram of the PV module fault detection testing platform. The electrical measurement equipment must be isolated from each other to avoid a short circuit. An Isolation Transformer is added to the circuit for this purpose. In order to capture the fault signals of the PV module, the load was added to the circuit and the voltage signals on the load were measured by PXI DAS and then stored by detection systems.
To collect and detect PV module fault signals, this study employed PXI DAS as a signal acquisition device and adopted the detection system for accessing waveforms. The sampling rate was set as 60 MS/s, with 2500 sampling points. The voltage signal from the voltage drop resulting from the current passing through the load was captured by a probe. PXI DAS transferred the signal to a computer and then, after the filtering and feature extraction, the PV module defect type was recognized by the fault diagnosis system.
2.2. PV Module Defect Construction
Four common PV module fault state models were built in this study, as shown in Table 1 below. These include a normal PV module (Type 1), PV module breakage (Type 2), PV module contact defectiveness (Type 3) and PV module bypass diode failure (Type 4). To discuss the different signal results of the PV module measured in different fault defect conditions, the features were extracted by the chaos system and then identified by CNN.
2.2.1. Normal PV Module (Type 1)
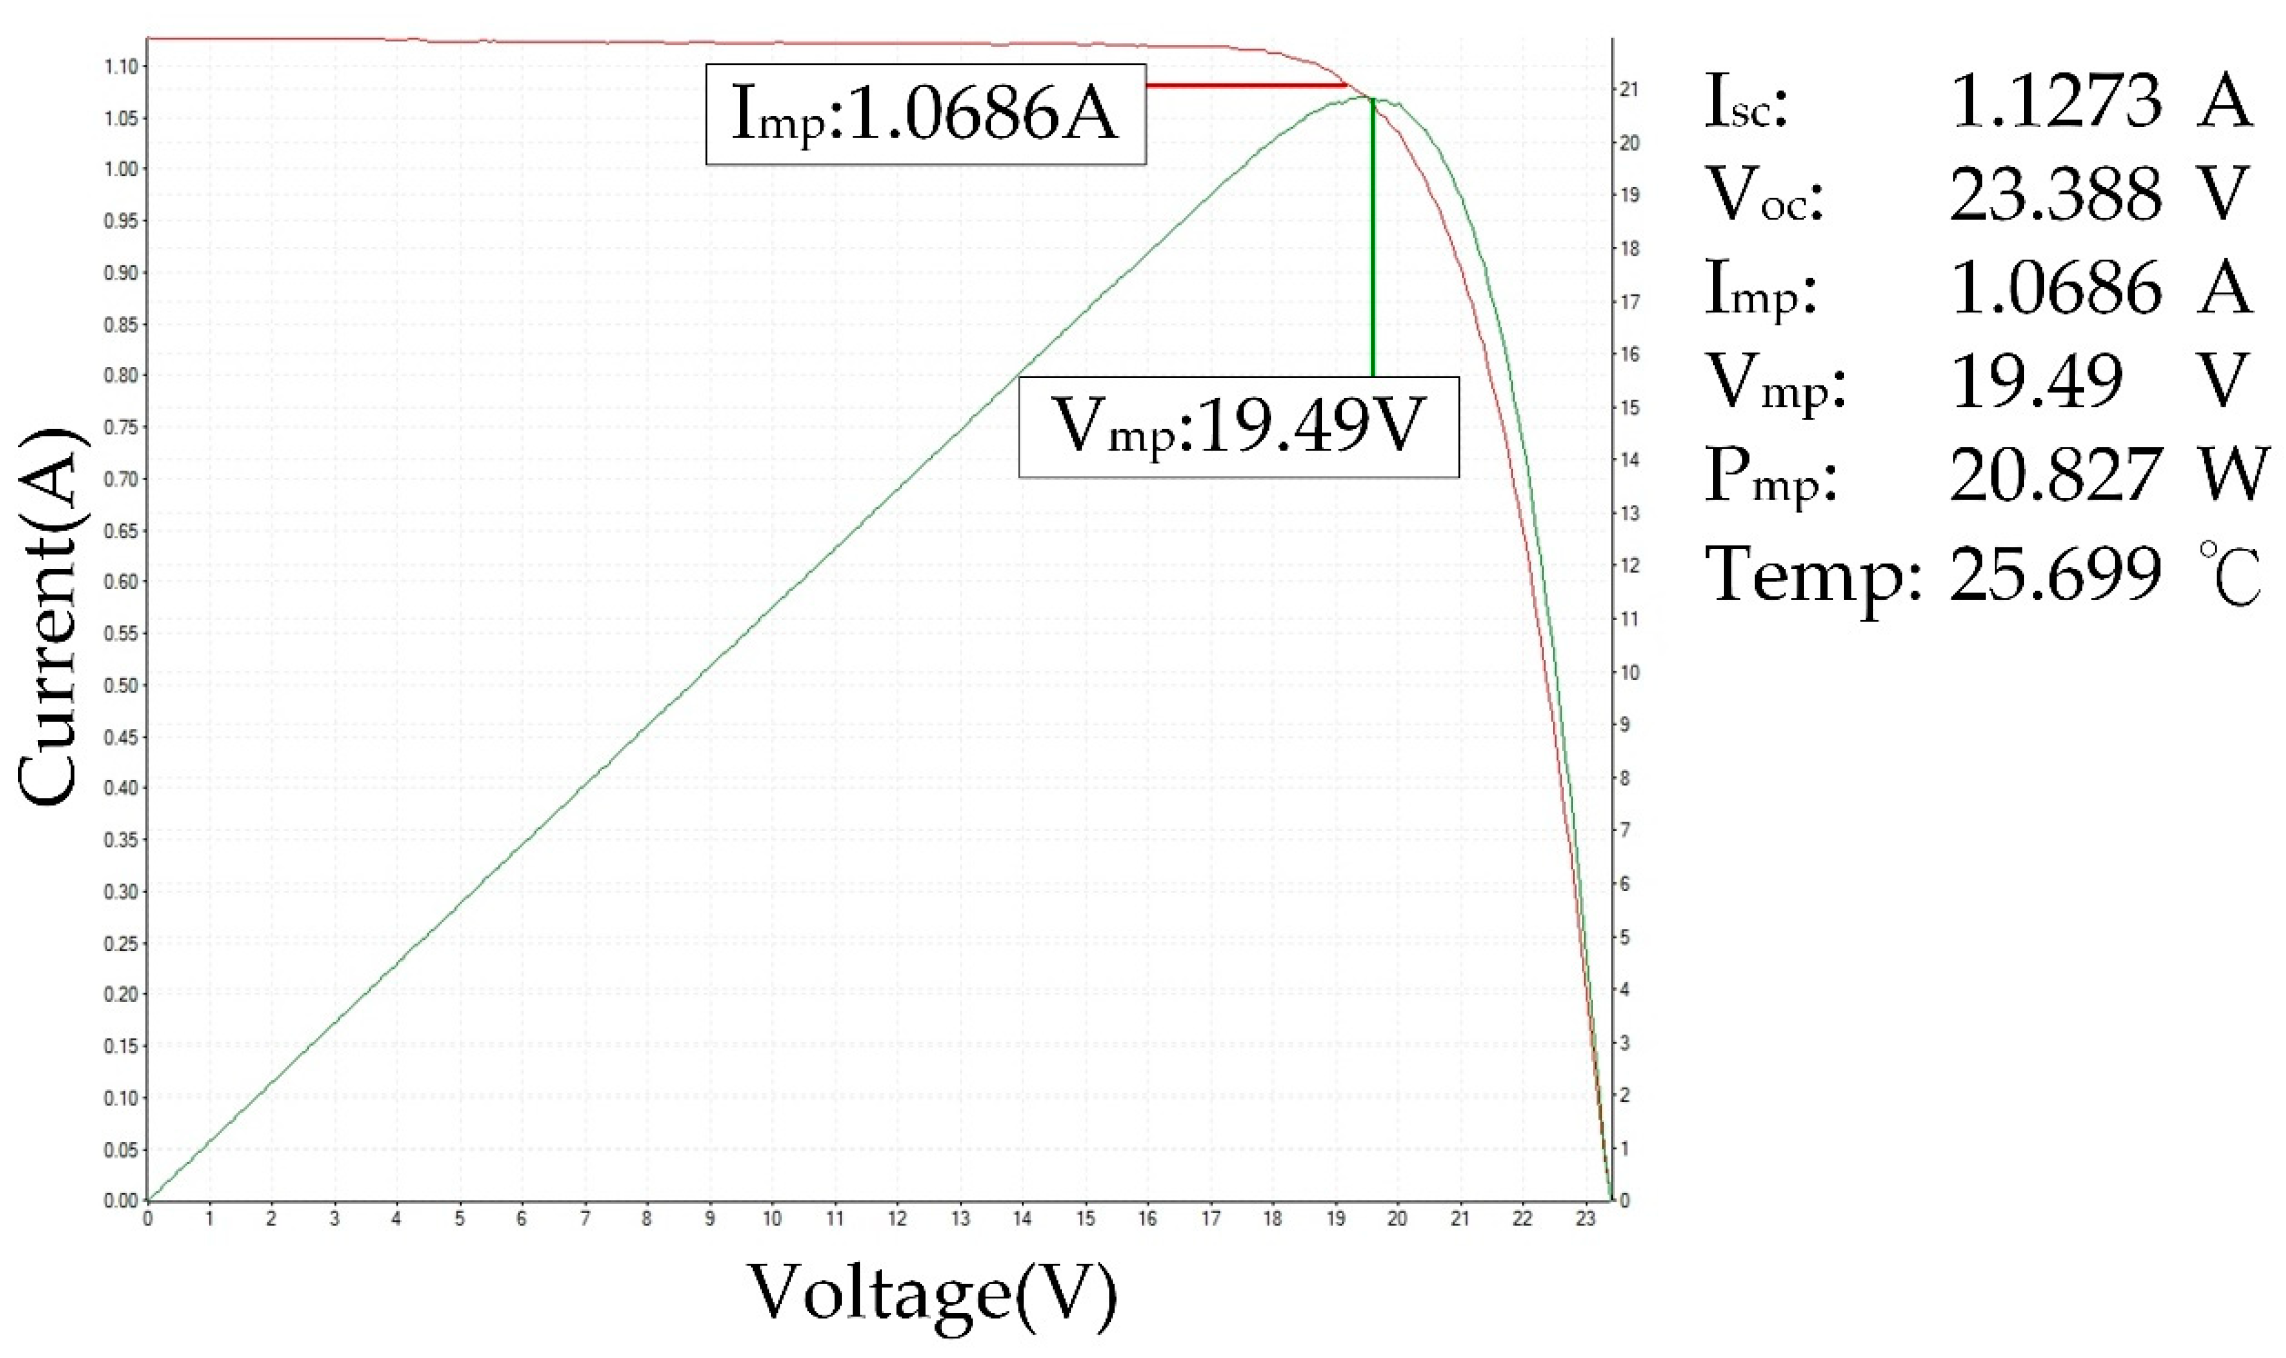
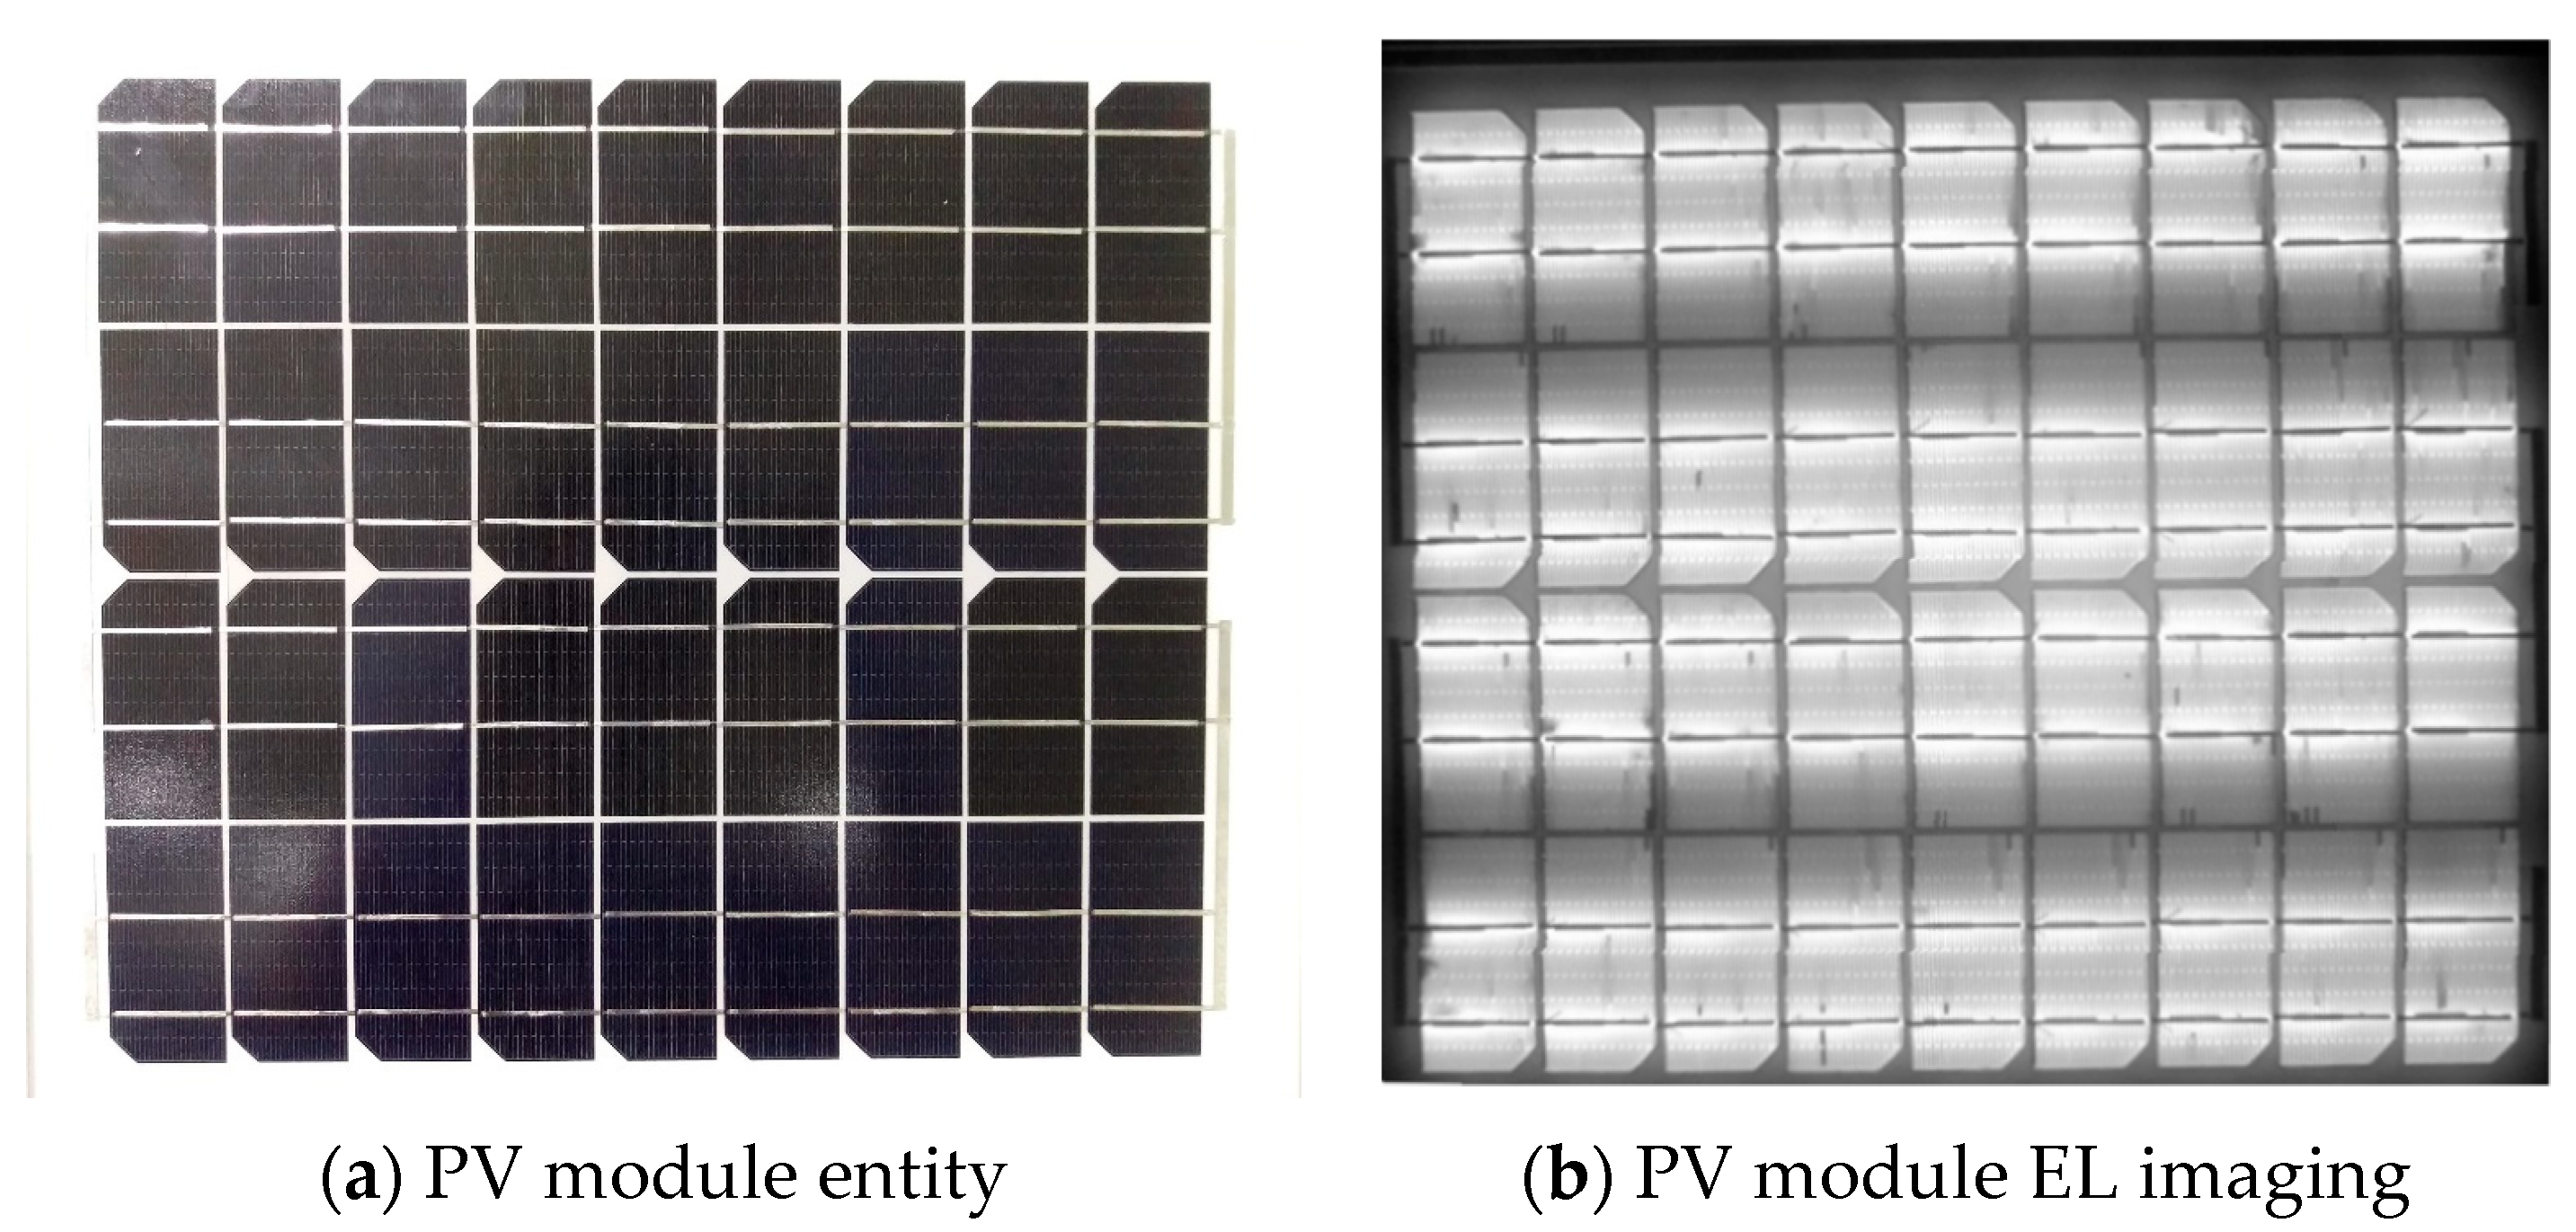
This study employed a 20W monocrystalline silicon PV module. The I-V curve measured by the I-V curve testing instrument in our photovoltaic laboratory is shown in Figure 4. The maximum voltage of 19.49 V, the maximum current of 1.0686 A and the maximum power of 20.827 W were measured at an ambient temperature of 25.699 °C and were close to the original manufacturer’s values. The normal PV module was built accordingly, and the whole entity is shown in Figure 5a. To guarantee the normal functioning of the PV module, the solar cell inside the module was checked for any damage. EL instrument was adopted for measurement and the shooting was performed in a dark area. The EL imaging is shown in Figure 5b. The EL image is free of apparent breakages and the research model was built according to this process.
2.2.2. PV Module Breakage (Type 2)
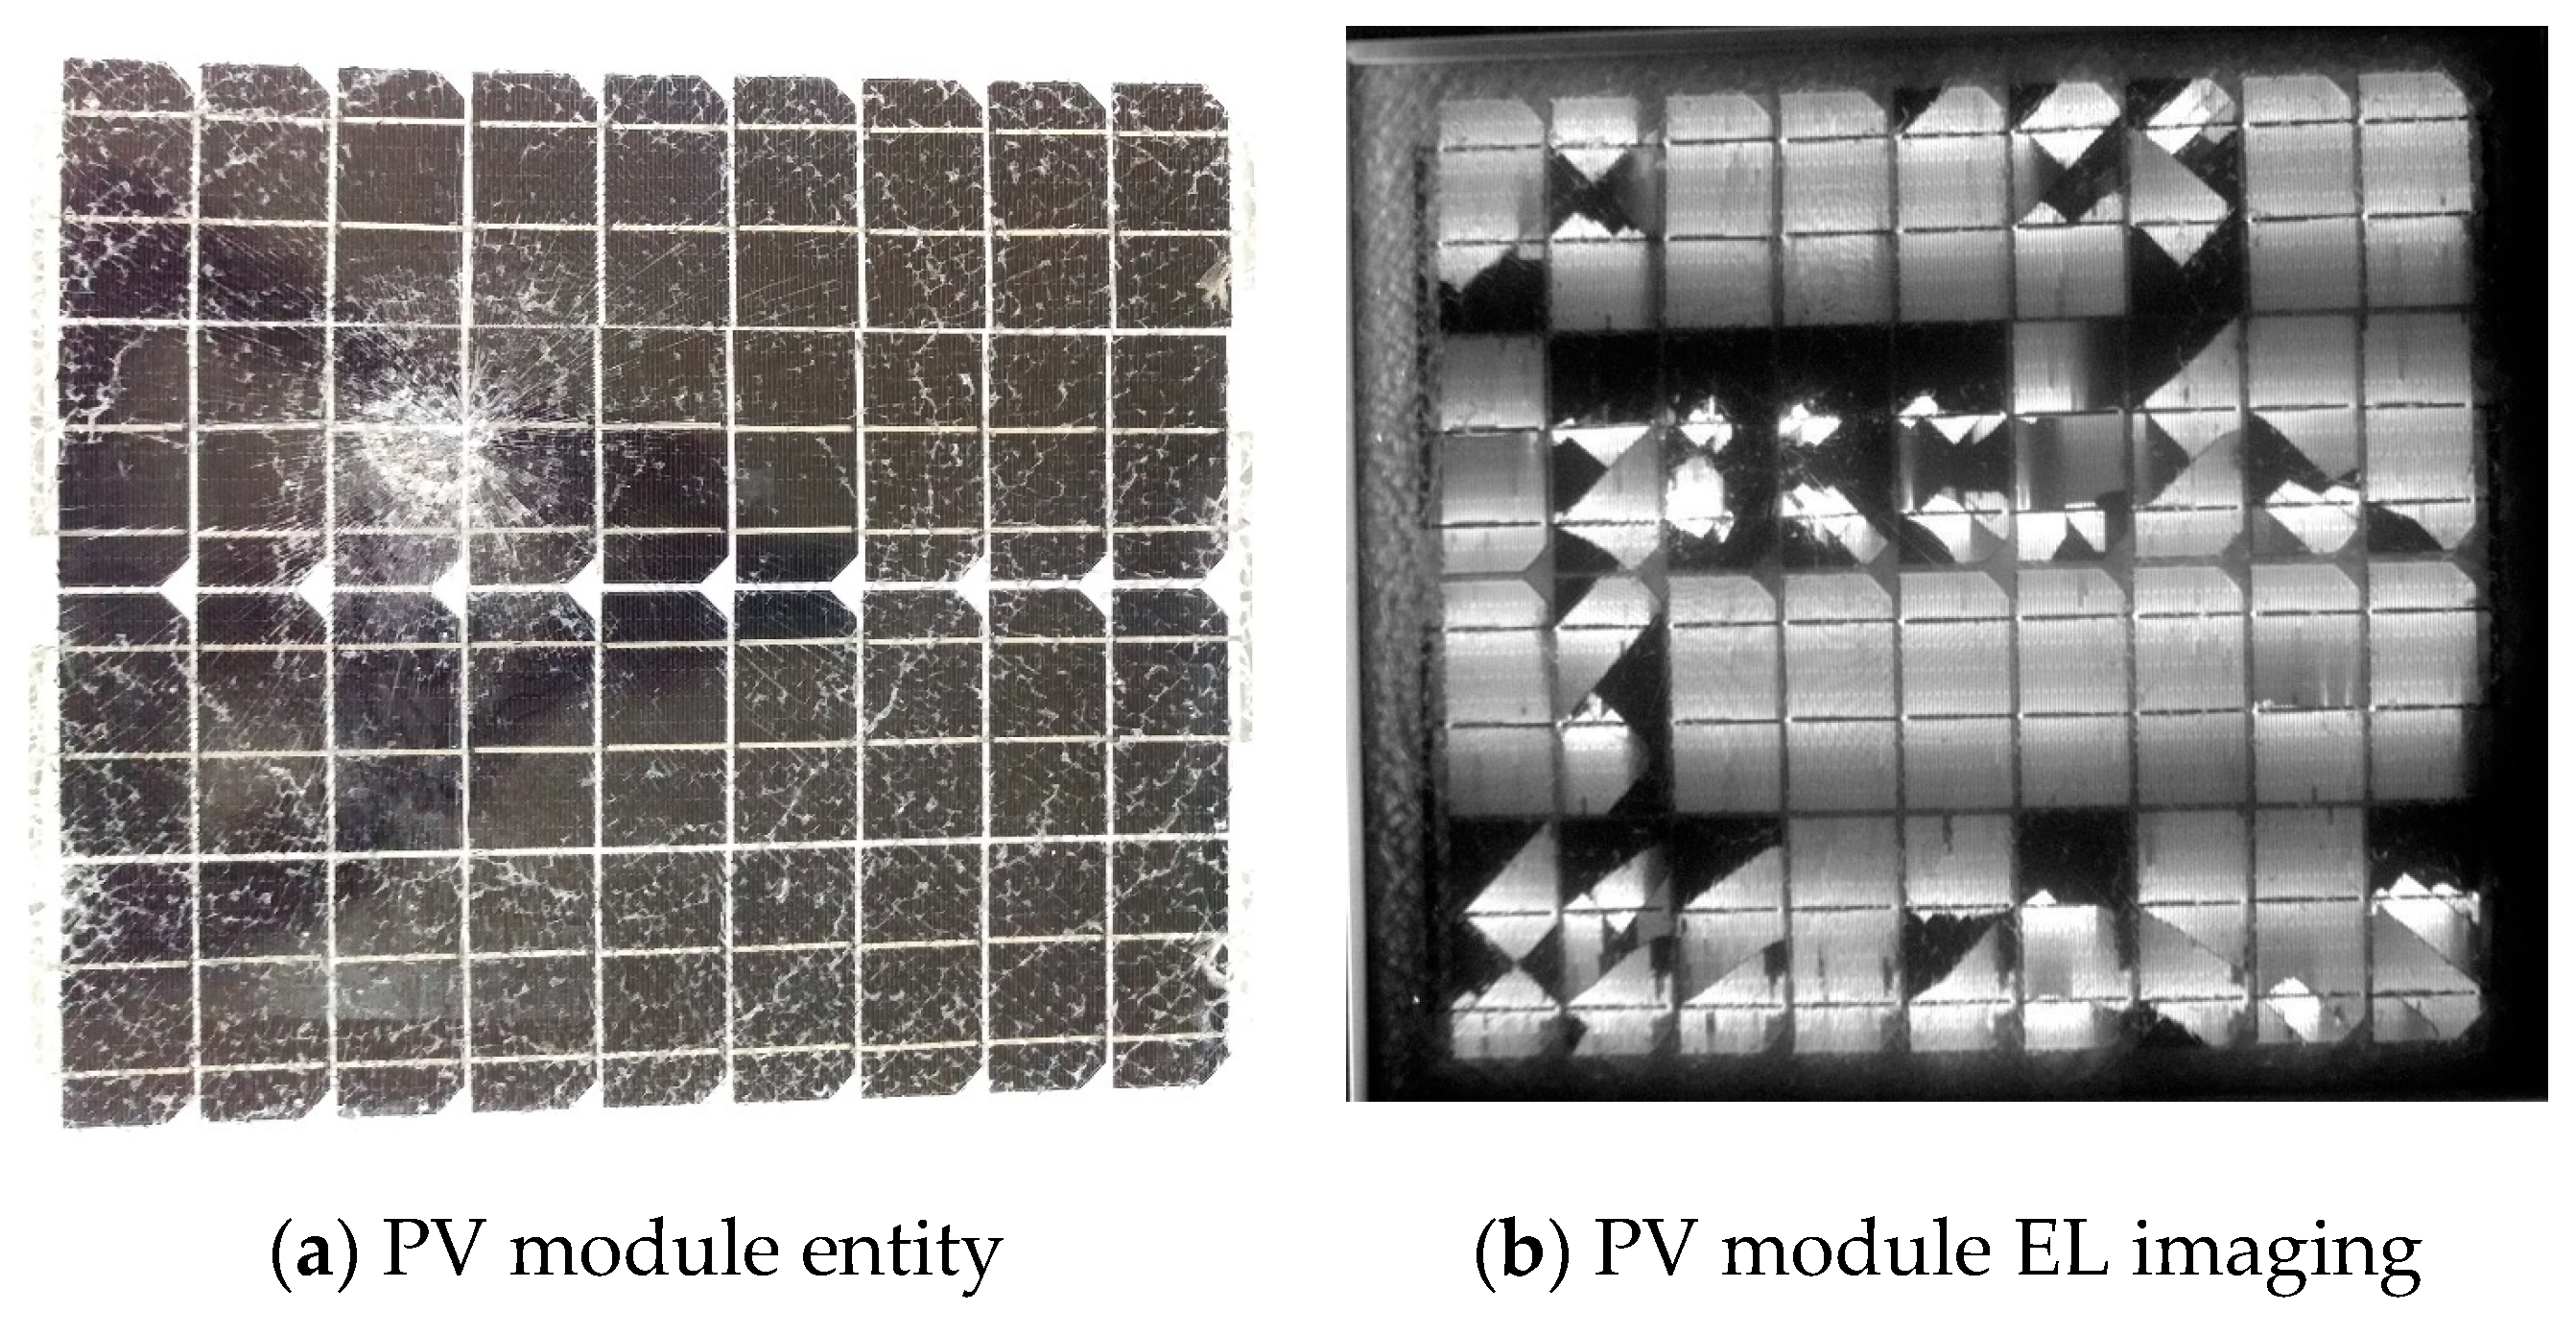
To build the ruptured PV module model, severe damage and light damage were performed. In terms of the establishment of severe damage, a sharp object applied an external force to knock the normal PV module, in order to simulate the severe damage. This simulated man-induced trampling and foreign object damage. Figure 6a shows the extensively damaged entity and Figure 6b shows the EL image. According to the EL image, under the effect of severe damage, the knocking point extends to the periphery and the other silicon wafers lose their normal function.
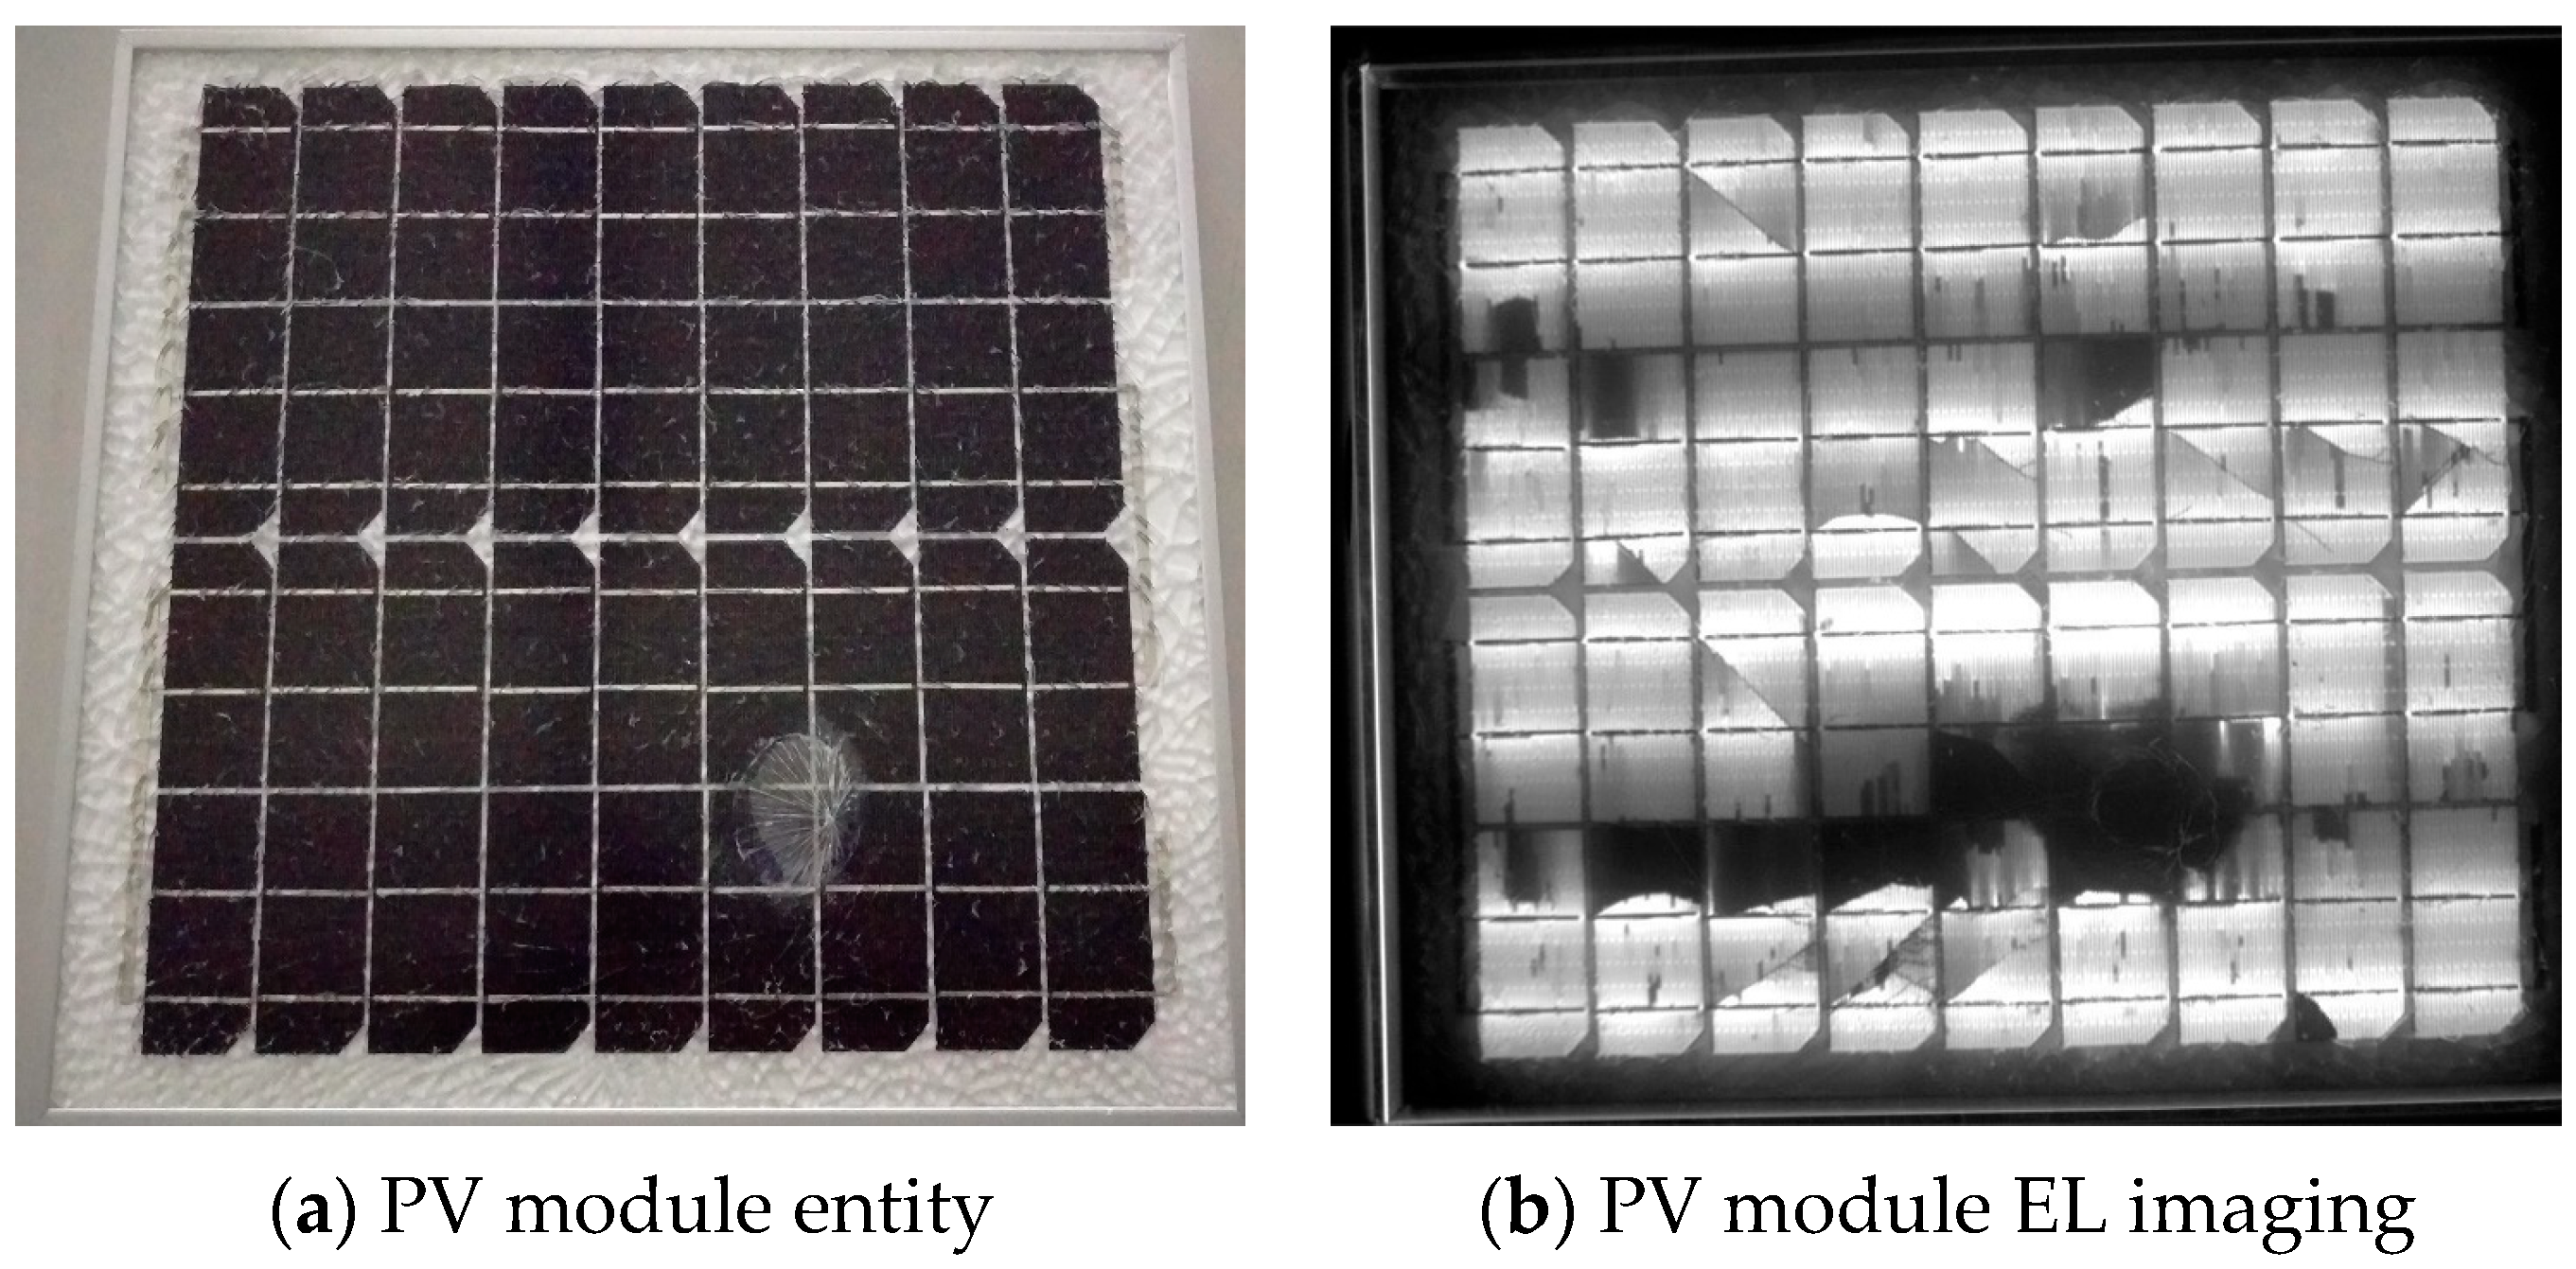
In terms of the partial failure of the PV module, the partial surface of the normal PV module was burnt at a high temperature by a blast burner. The module surface was ruptured by the physical phenomenon of thermal expansion and contraction, to simulate the hot-spot effect. Figure 7a shows the entity after partial failure, and Figure 7b shows the EL image. According to the EL image, the position burnt by the blast burner is black, which means that the solar cell is severely damaged and the other luminous part is normal.
2.2.3. PV Module Contact Defectiveness (Type 3)
The power circuit screws or pressure connection terminal may become loose in the long-term operation of electrical equipment, or due to ambient temperature changes. The contact area is reduced, which leads to excessive contact resistance. It influences the safety of the system in the long term. Therefore, in order to construct the PV module with contact defectiveness, this paper performed improvements according to the method presented in [17]. Series resistance was added to the PV module and 2 Ω and 10 Ω impedances were added to study the contact defectiveness. The resistance was equally divided into 10 parts, ranging from 1 Ω to 10 Ω, to establish the aging fault type. Figure 8a shows that the additional impedance of the PV module is adjusted by an impedor. A variable resistor in series was connected to the PV module for this study. Figure 8b shows the circuit diagram. Ra is changed to a variable resistor to adjust 1 Ω to 10 Ω for the experiment, which aims at the overall loop of regional line and contact point aging detection, not just the PV module aging fault.
2.2.4. PV Module Diode Failure (Type 4)
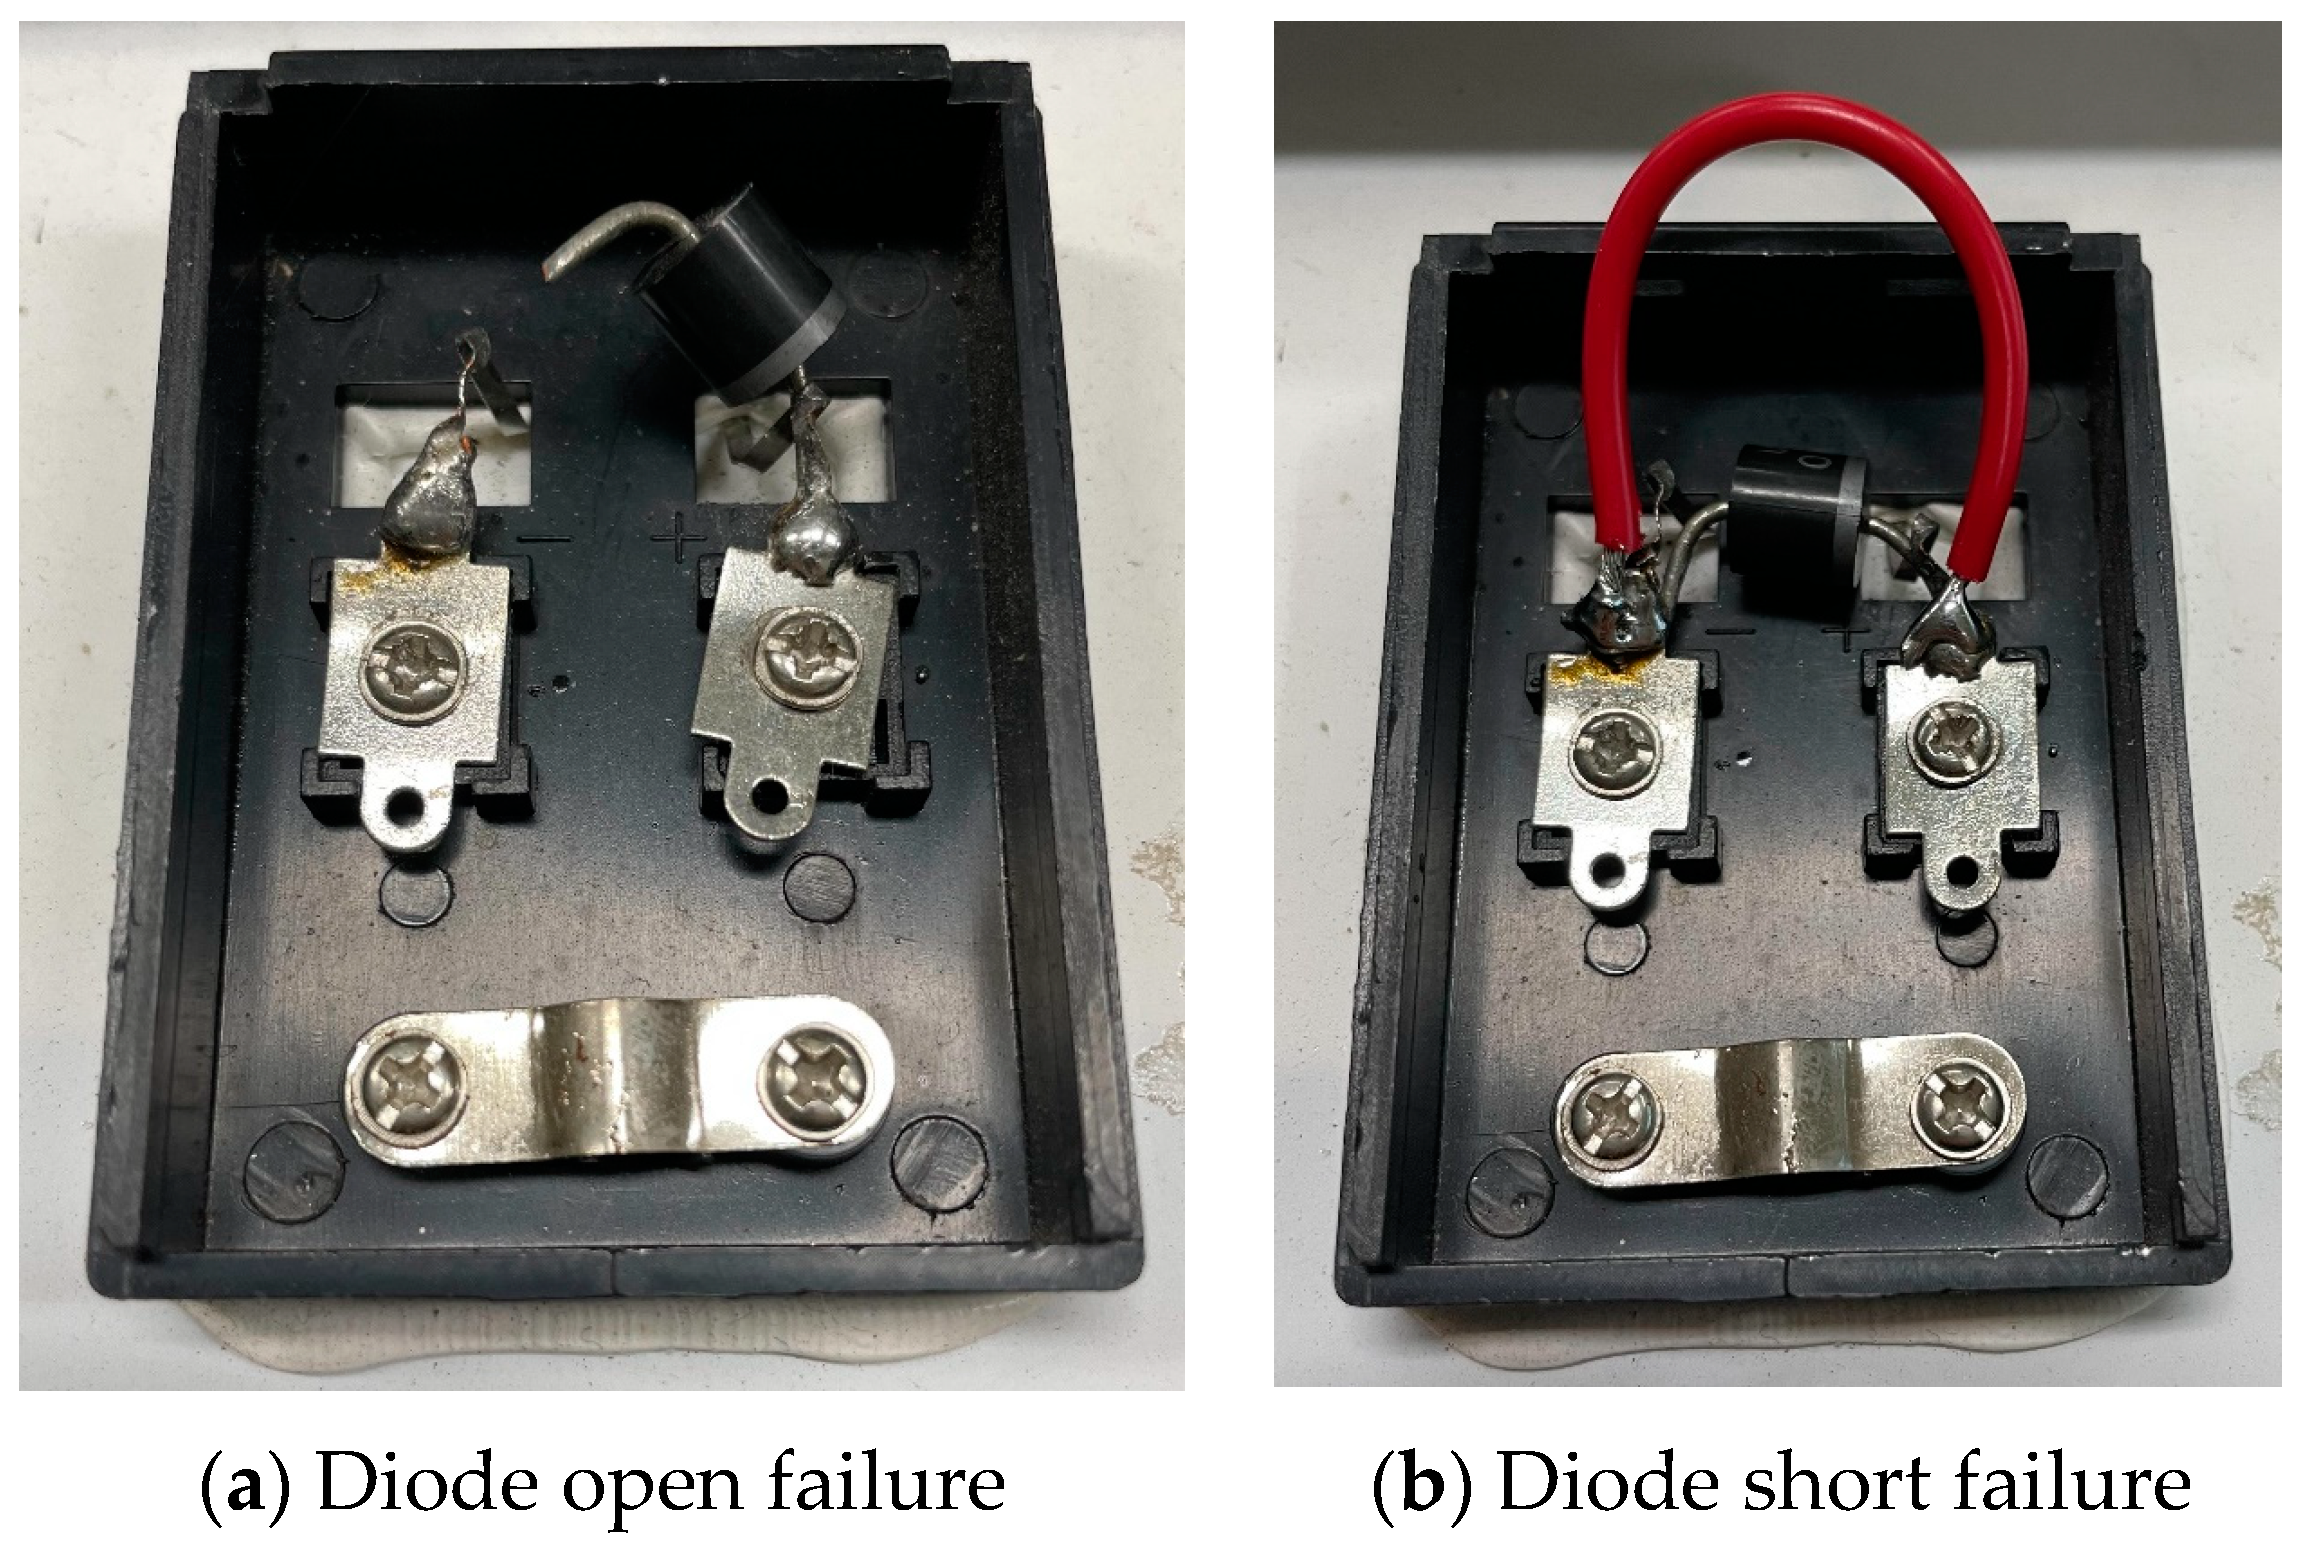
The PV module is inevitably influenced by external factors in the course of the PV module conversions. Some external factors, such as tree shade, contaminants and bird droppings reduce the amount of generated electricity. The damaged or shielded solar cell region begins to heat up and the bypass diode exerts a significant effect. The current can pass by the shaded PV module to decrease the hot-spot effect. The bypass diode of the normal PV module is removed, as shown in Figure 9a. A conductor is soldered, to open the bypass diode, as shown in Figure 9b.
3. Proposed Fault Diagnosis Algorithm
In terms of the PV module fault recognition method of this study, the output signals are captured by adding high-frequency signals. The features are extracted by CSDM and the fault category is recognized by CNN. These are then compared with ENN. The algorithmic procedure is shown in Figure 10 below:
3.1. Chaos Synchronization Detection Method
Edward Norton Lorenz proposed the chaos theory to discuss the instability of the nonlinear system. The non-periodic result is obtained by a simple chaos theory mathematical model. The signal generates a strange attractor through the chaos theory, so that the signal forms an orderly, but aperiodic, motion trajectory. This trajectory induces huge changes from subtle changes. There is a severely sensitive response to the micro-initial phenomenon and it is very applicable to the data with small original signal variation ranges. It is utilized in many aspects of science, such as economics, biology, engineering and physics. The general chaos theory includes the Lorenz chaos theory, the Sprott chaos theory and the Chen-Lee chaos theory. The chaos theory has a Master System (MS) and a Slave System (SS), which are represented as Equations (1) and (2). When the two systems obtain different signals, the signal values are diminished to acquire a chaos dynamic error. The master and slave systems generate the movement trajectory of different dynamic errors for the domain of engineering. The SS is provided with a controller to follow the MS, so that the MS and SS are adjusted to the same movement trajectory by the controller. This is known as the chaotic synchronization action [18].
The PV module voltage signal was put in the master-slave synchronization system. The dynamic error amounts of the intrinsic chase of SS and MS were reduced by the master and slave chaotic systems to gain the chaos dynamic error status.
wherein, fi (i = 1, 2, …, n) is the nonlinear function. Equations (1) and (2) are subtracted to form master-slave dynamic error definitions and are represented as Equation (3). The calculated dynamic error equation is displayed in Equation (4).
The Lorenz master and slave chaotic systems are chaos theory-designed mathematical models. Infinite models can be achieved. This study adopted the Lorenz equation and two Lorenz chaotic systems, which are Lorenz Lmaster and Lslave chaotic systems, respectively, and are expressed as Equations (5) and (6).
The chaos dynamic error is defined as and , the dynamic error vector is . The dynamic error equation of Lorenz chaotic systems is indicated in a matrix that is expressed as Equation (7) [19].
The x stands for MS and its initial value is zero, y stands for SS and its value is the PV module voltage value. The coefficients of adjustment error, α, β and γ, have the values of 10, 28 and (8/3), respectively. The Lorenz master and slave chaotic systems are generated by this group of error parameters [20]. The distance of chaos eye coordinates in the CDEM is computed by the largest root-mean-square deviation, and the chaos eye coordinate values are utilized as the eigenvalues of the PV module diagnosis system.
3.2. Convolutional Neural Networks
To diagnose the PV module fault type by images, this study employed the CDEM image (containing information of the fault state) based on the features generated by the Lorenz master and slave chaotic systems [21] in CSDM for fault recognition by the CNN. The CNN is a part that is defined in a deep learning network in modern times, e.g., facial feature recognition [22], biometric recognition embedded in an FPGA system [23] and high-tension cable fault diagnosis [24]. It is extensively used in signal processing and image classification. It has an excellent accuracy for image classification. The architecture of the model design of CNN varies with the test image. The main architecture is comprised of several convolution layers, pooling layers, fully-connected layers and activation layers. This study adopted CNN to diagnose the CDEM image of features of the PV module fault state. The image format was 64 × 64 × 3, where 64 × 64 was the image size and 3 represented the three primary colors (Red Green Blue, RGB). The designed CNN model architecture is shown in Figure 11 and the hierarchies are described below:
3.2.1. Convolution Layer
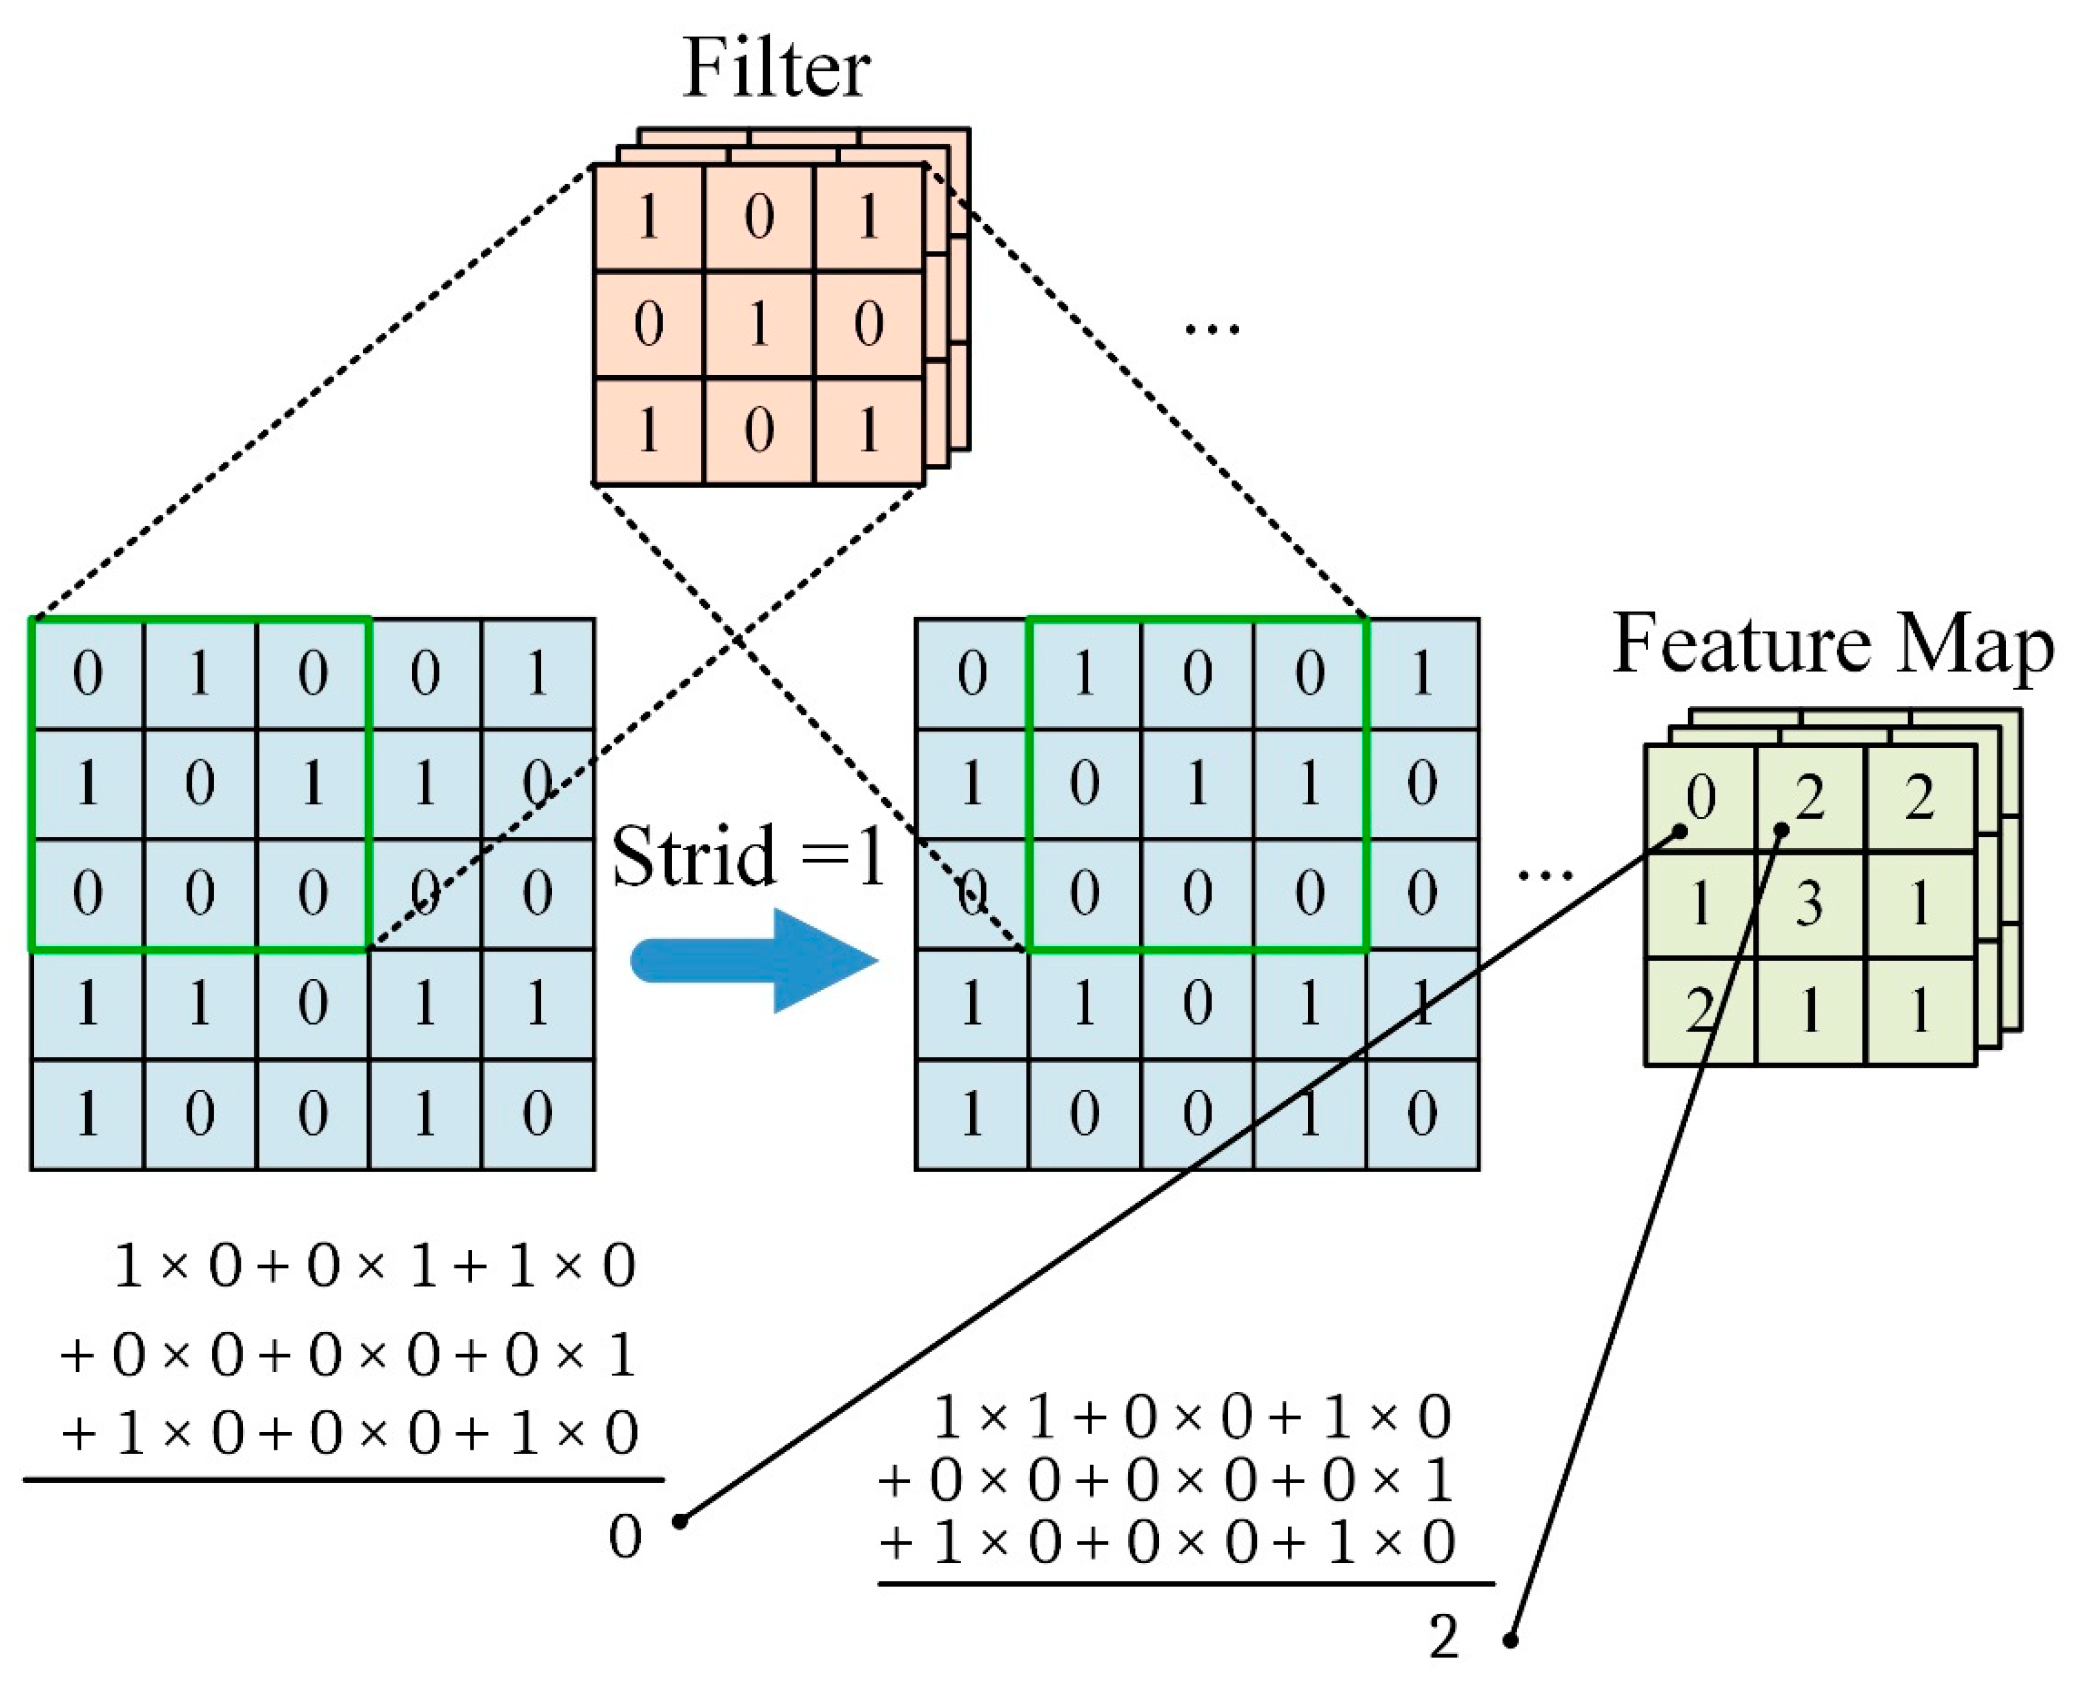
The main job of the convolution layer in the network is to extract image features. The layer performs a convolution operation through filters of different sizes. The image feature extraction or feature enhancement is performed by spatial filtering. A 3 × 3 filter is used for convolution and one stride is moved each time (Stride = 1). After all the pixels of the original input image are finished by the inner product of the filter, the feature map can be obtained. The operation process is shown in Figure 12.
3.2.2. Pooling Layer
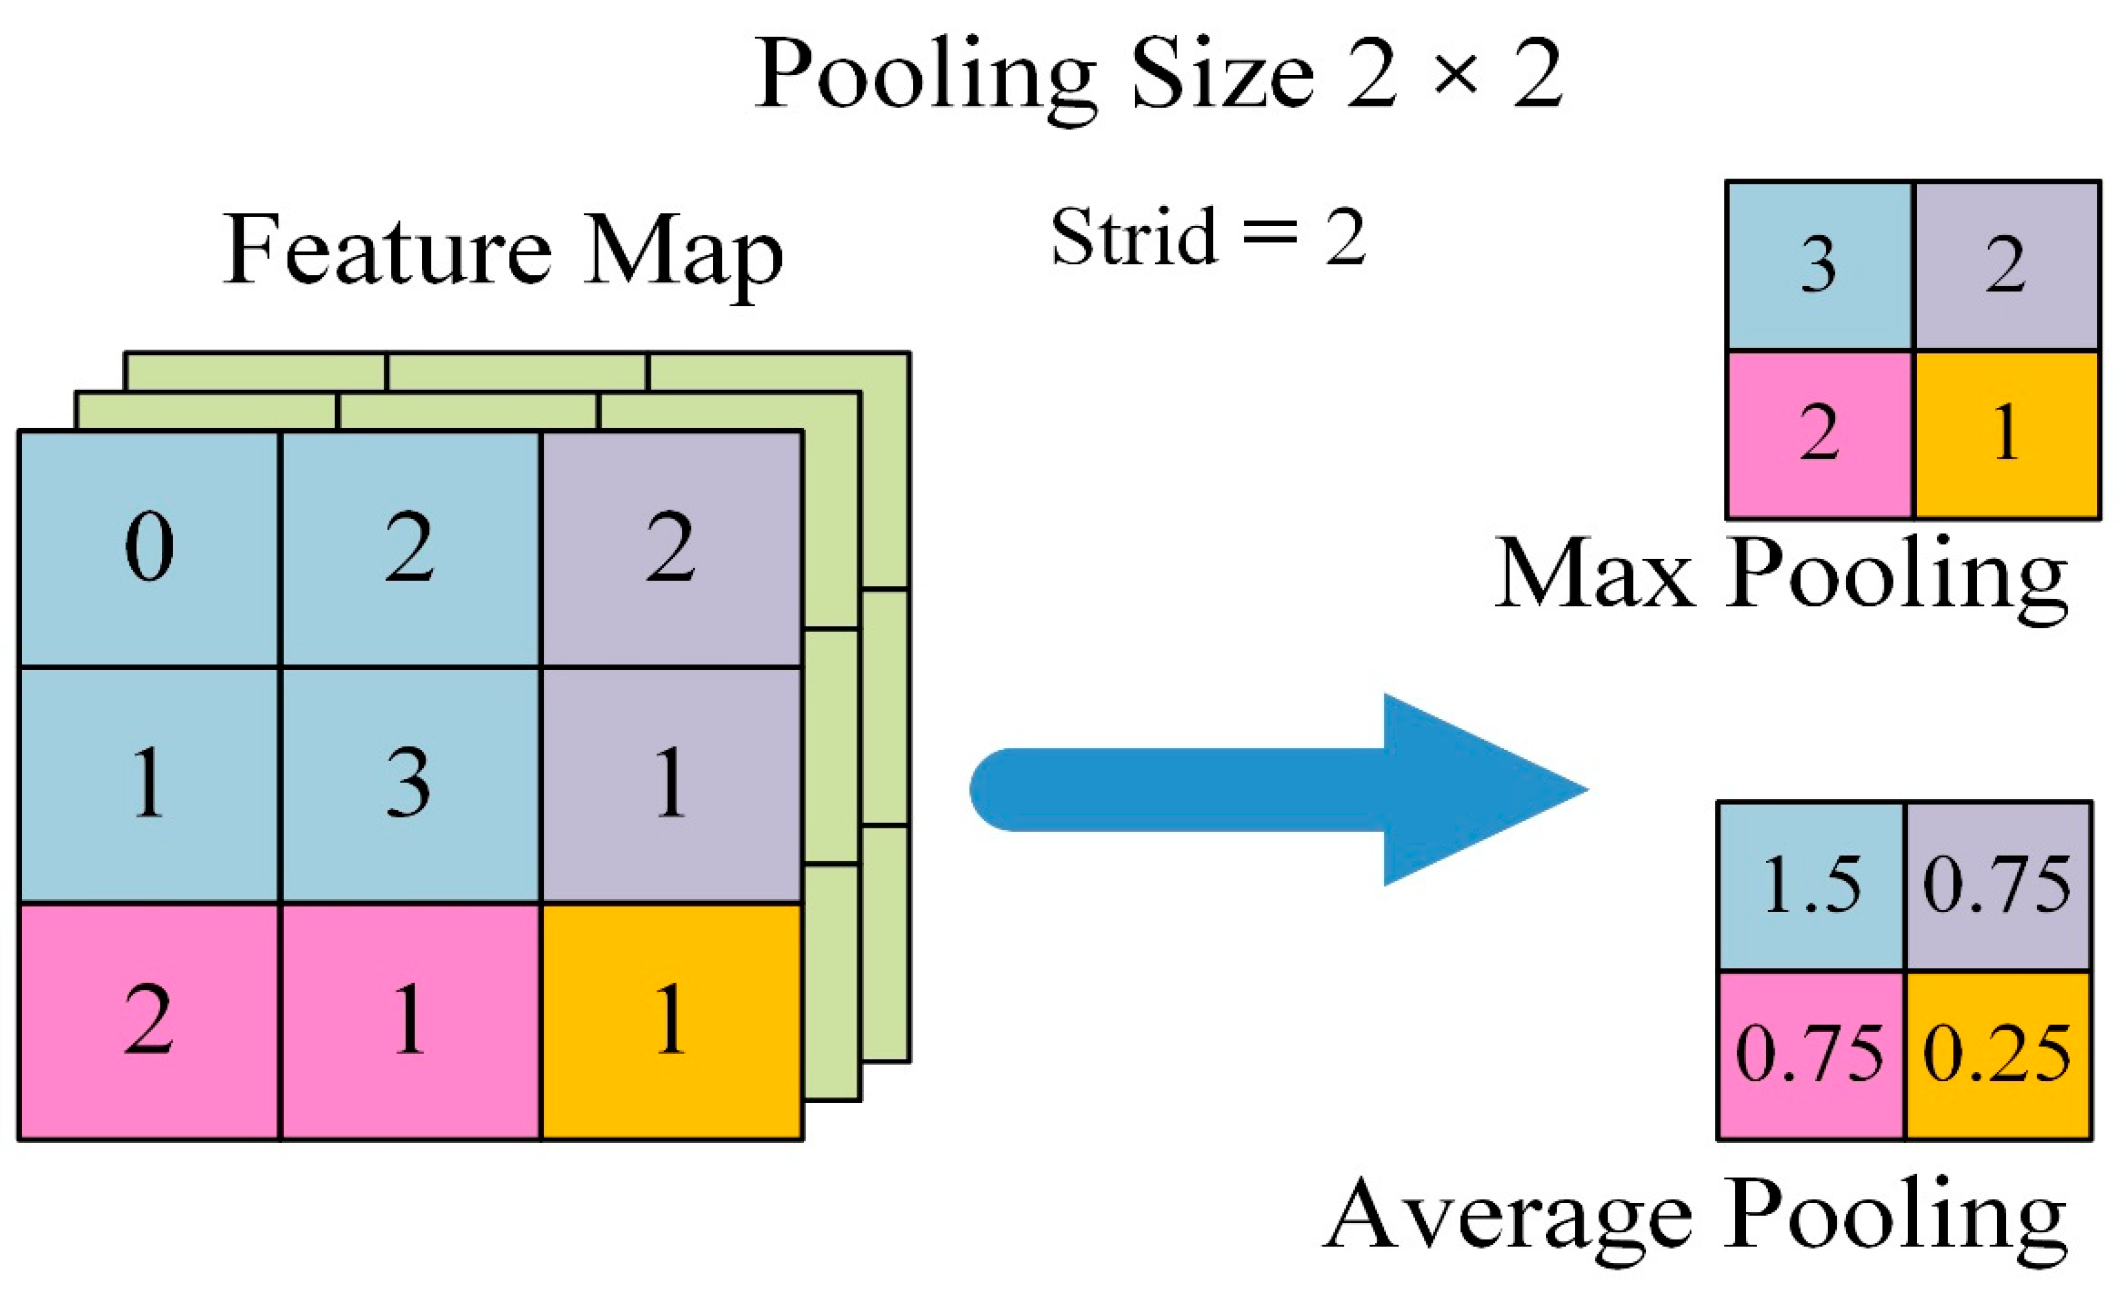
The image feature was obtained through the convolution layer. To reduce the feature size of the image and to minimize the influence on eigenvalue, the convolution extracted feature was added to the pooling layer. The computation complexity of the overall network could be reduced. The information after pooling further concentrated on whether there were accordant features in the image. The pooling layer was divided into Max Pooling and average pooling. Two strides were moved each time (Stride = 2) for pooling. The maximum value in the Feature Map 2 × 2 range was taken as Max Pooling, and the values in the Feature Map 2 × 2 range were added up and divided by 4 to obtain the average pooling. Figure 13 shows how the pooling layer works.
3.2.3. Fully-Connected Layer
The architecture of a fully connected layer is the traditional neural network model composed of flattening, a hidden layer and an output layer. The results of convolution and the pooling processes obtained in the CNN architecture were flattened into a one-dimensional vector. The image was predicted and classified by a fully connected layer. The neurons of the previous layer and of the next layer were connected and classified. Its structure is shown in Figure 14.
3.2.4. Activation Layer
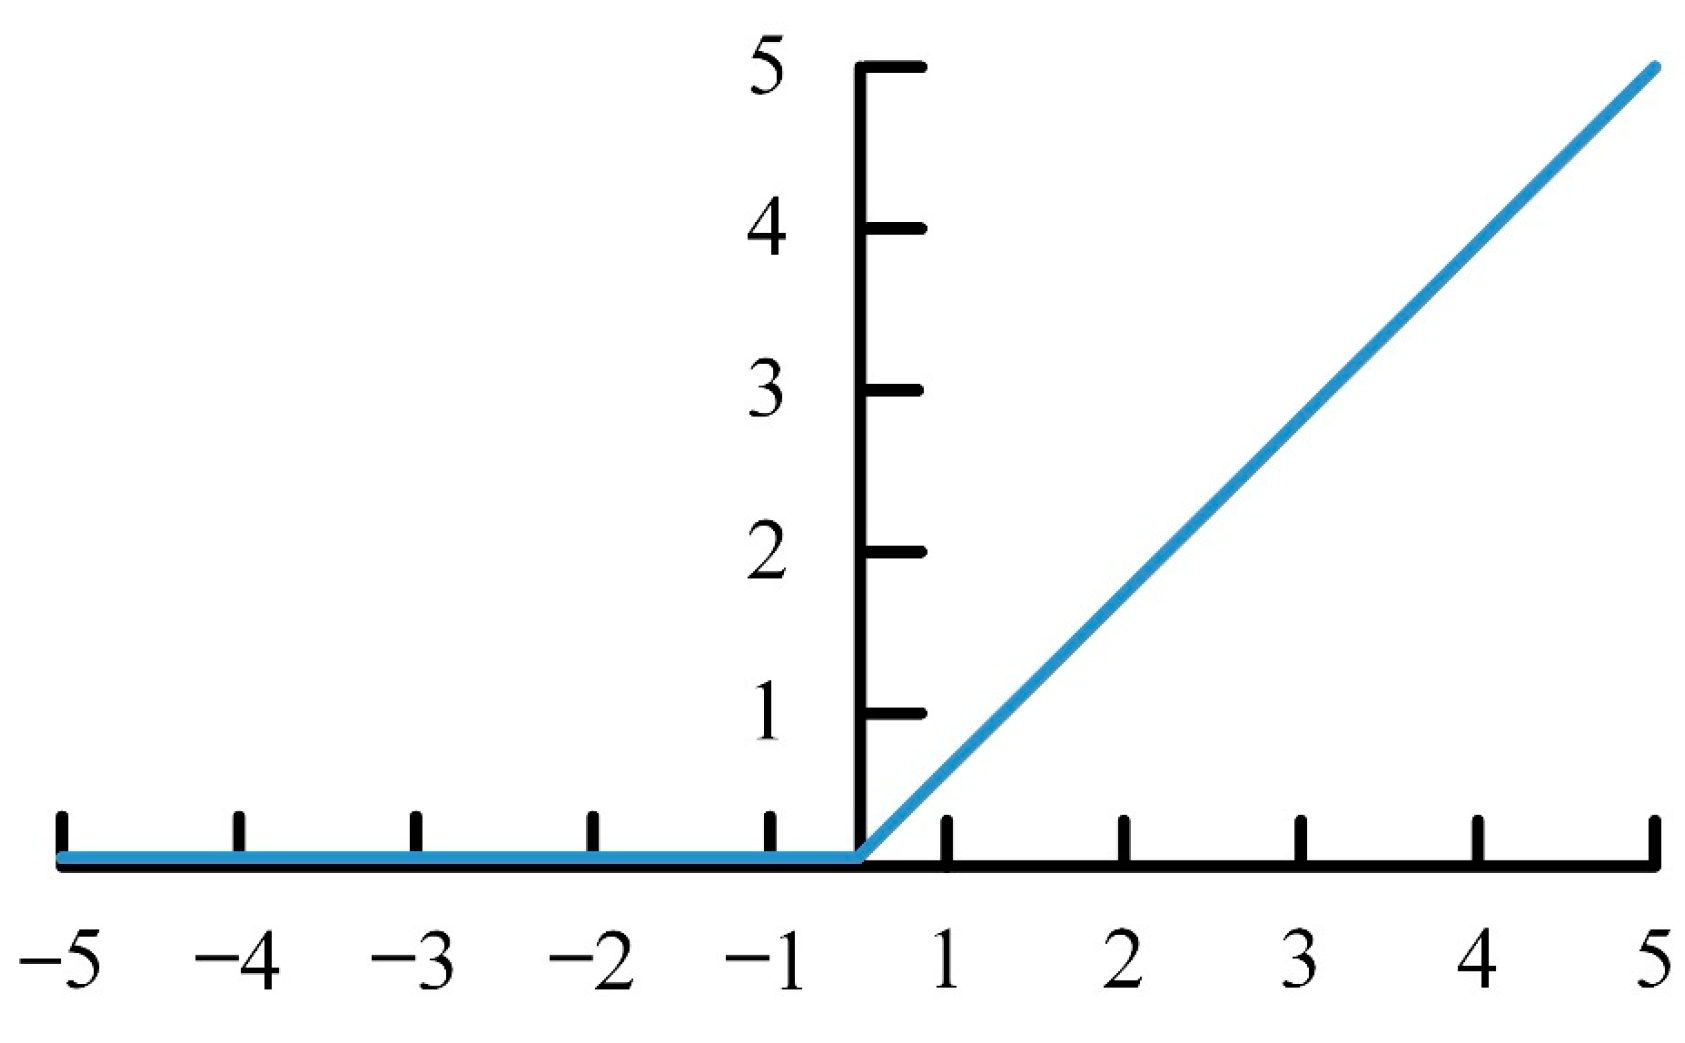
The major function of the activation layer is to improve the ability of the network for solving nonlinear separability. The general activation functions contain the Sigmoid, ReLu, TanHyperbolic (tanh) and Leaky ReLU functions [25]. This study uses the ReLU function as the activation function of CNN. The training speed of CNN is increased effectively, compared with the other functions [26], and the generalization accuracy of the model is not influenced. The ReLU function is expressed as Equation (8), wherein x is the last neuron output. The ReLU function is shown in Figure 15.
4. Results
This study employed 16 PV modules to construct four states, including three common fault defects and a normal module. Each state was tested by four modules connected in series. In the experimental detection phase, the signal generator was adopted as the signal input source. The PV module power end impressed frequency was 250 kHz and the voltage was 10 Vp-p high-frequency square wave signal for data acquisition. The data sampling time was 40 μs equivalent to 10 cycles. The sampling rate was 60 MS/s and the failure data of 2500 points were sampled. Four state models were built and 200 elements of data were extracted from each model. There were 800 pieces of data extracted for the experiment. The normal or defective signals of the PV module were captured and the CDEM was generated by the chaotic system for feature extraction.
4.1. Original Signal Captured
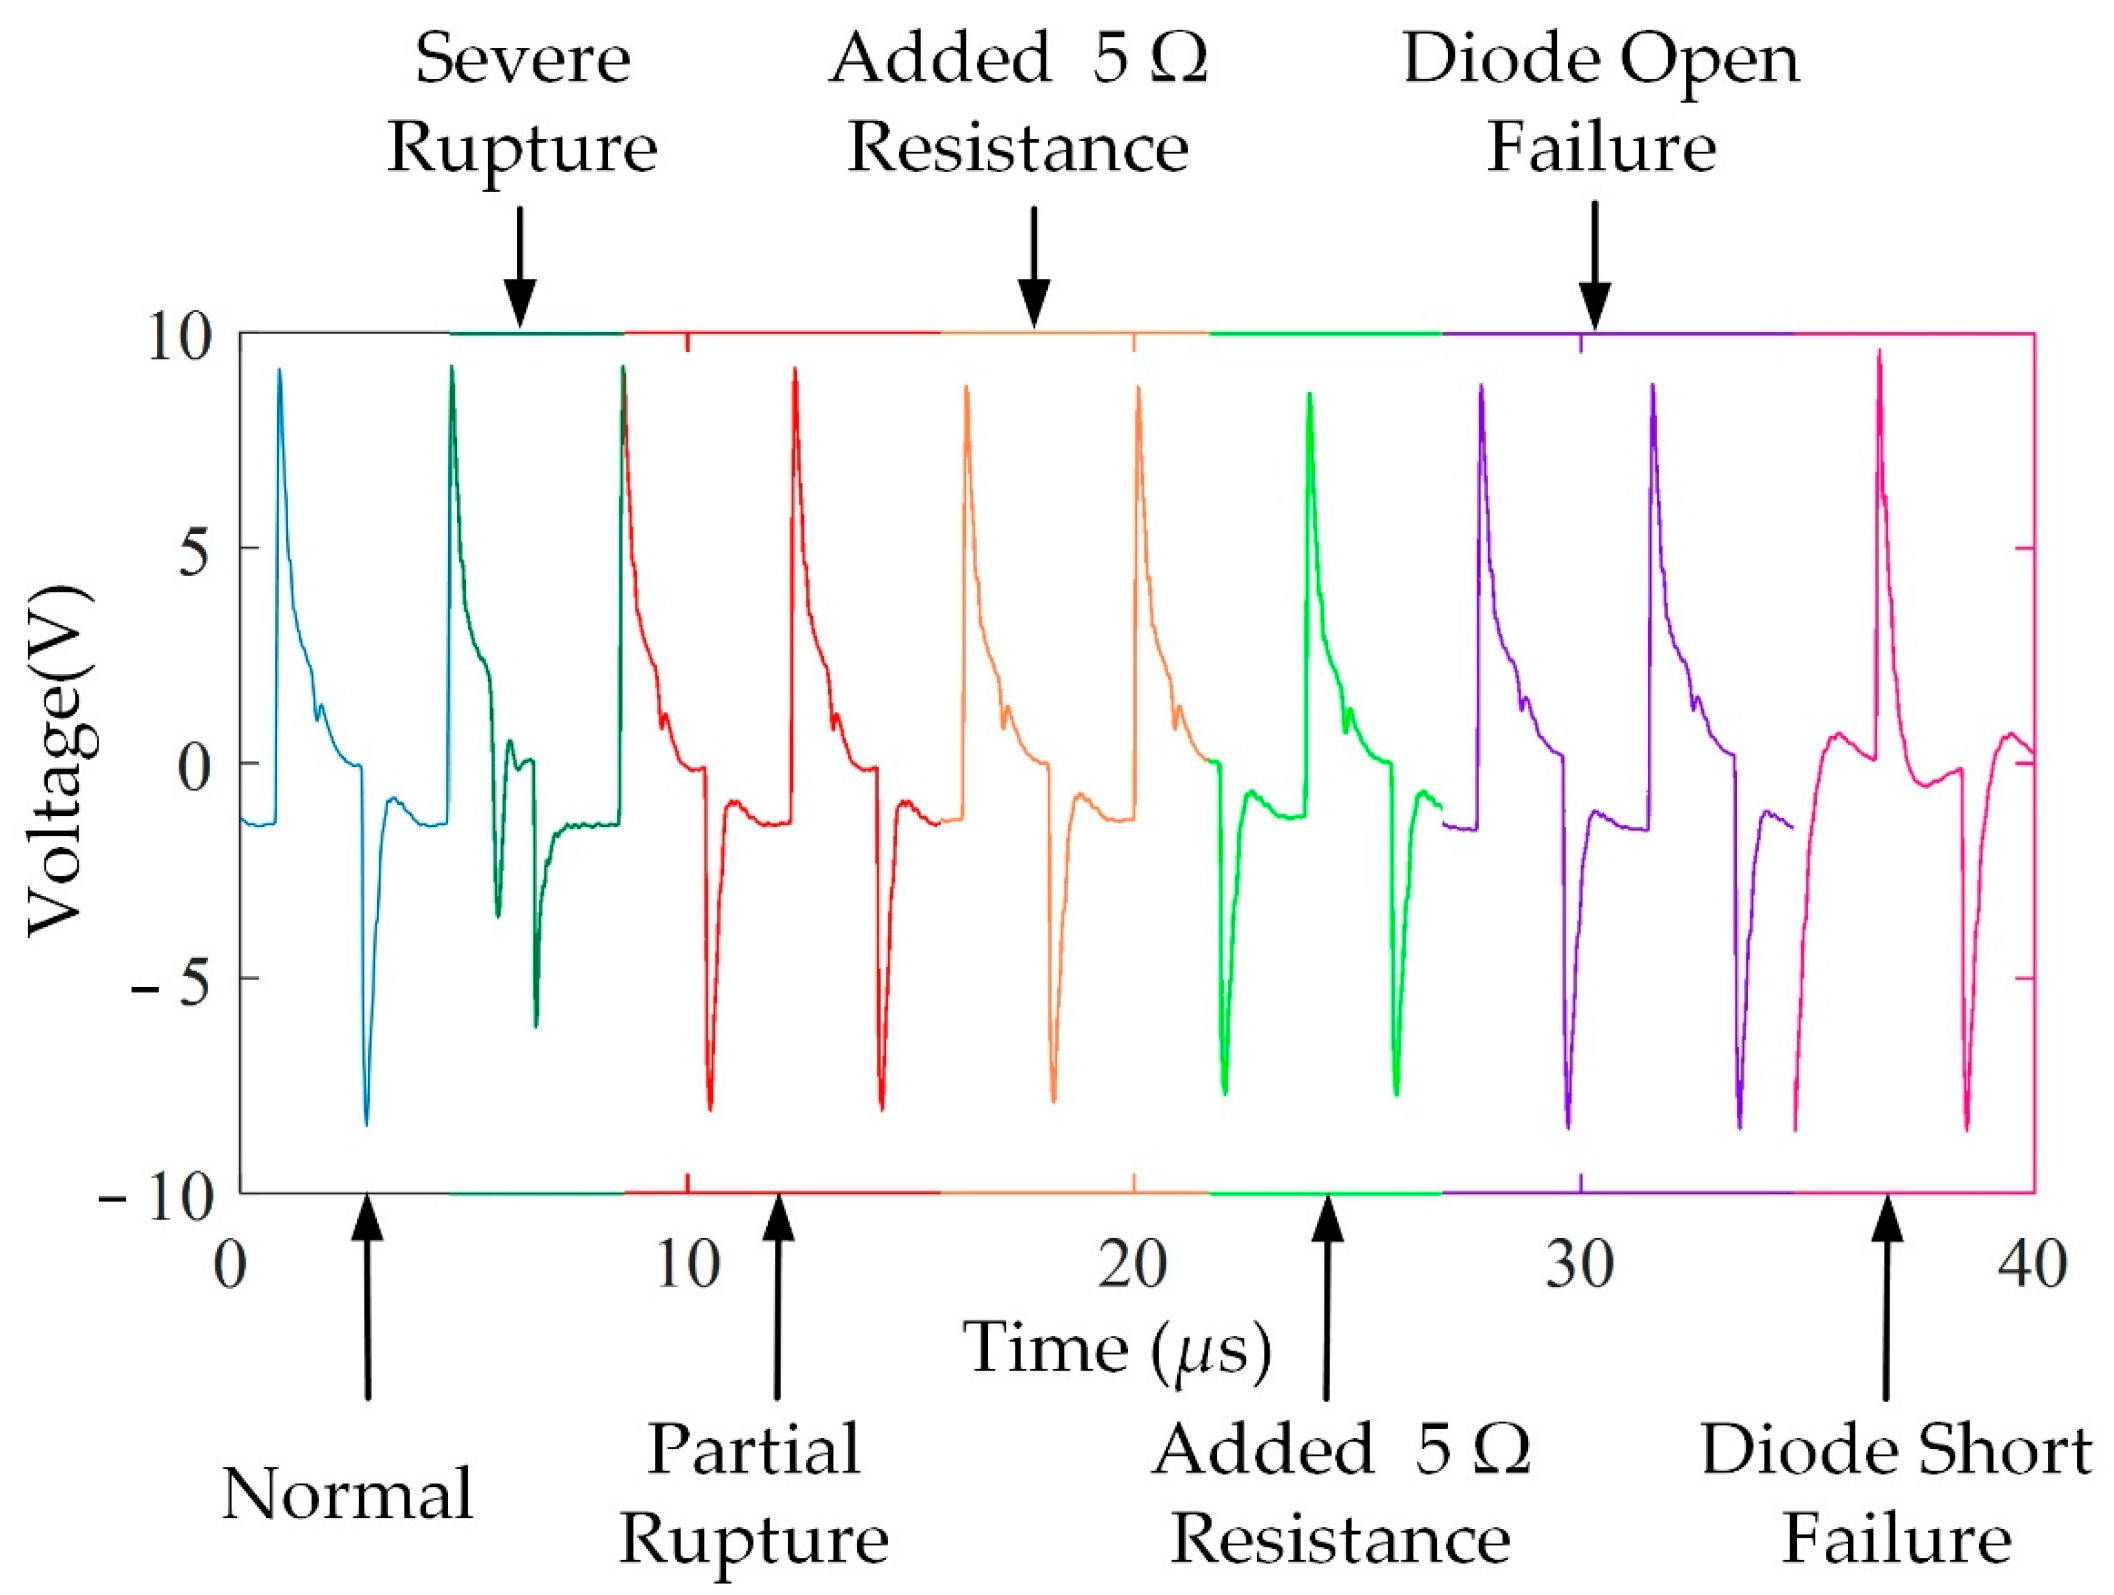
Seven images of the original signals of four fault models were overlapped and drawn. Figure 16 shows the integration of the original signals, normal, partial rupture, severe rupture, contact defectiveness, bypass diode open circuit and short circuit in different colors, from left to right. It was observed that partial rupture and diode failure were the most apparent. The rest was close to the waveform of a normal PV module. As a result, this paper used the proposed chaotic system to extract the differences in fault features.
4.2. Convolutional Neural Network Recognition Results
A total of 800 pieces of data were employed to build four PV module states, and each state adopted 200 pieces of data for calculation, via the chaotic system, to obtain the CDEM. Among the 200 data, 100 images were classified for training and 100 images for recognition. The fault classification accuracy of CDEM , and was analyzed by CNN.
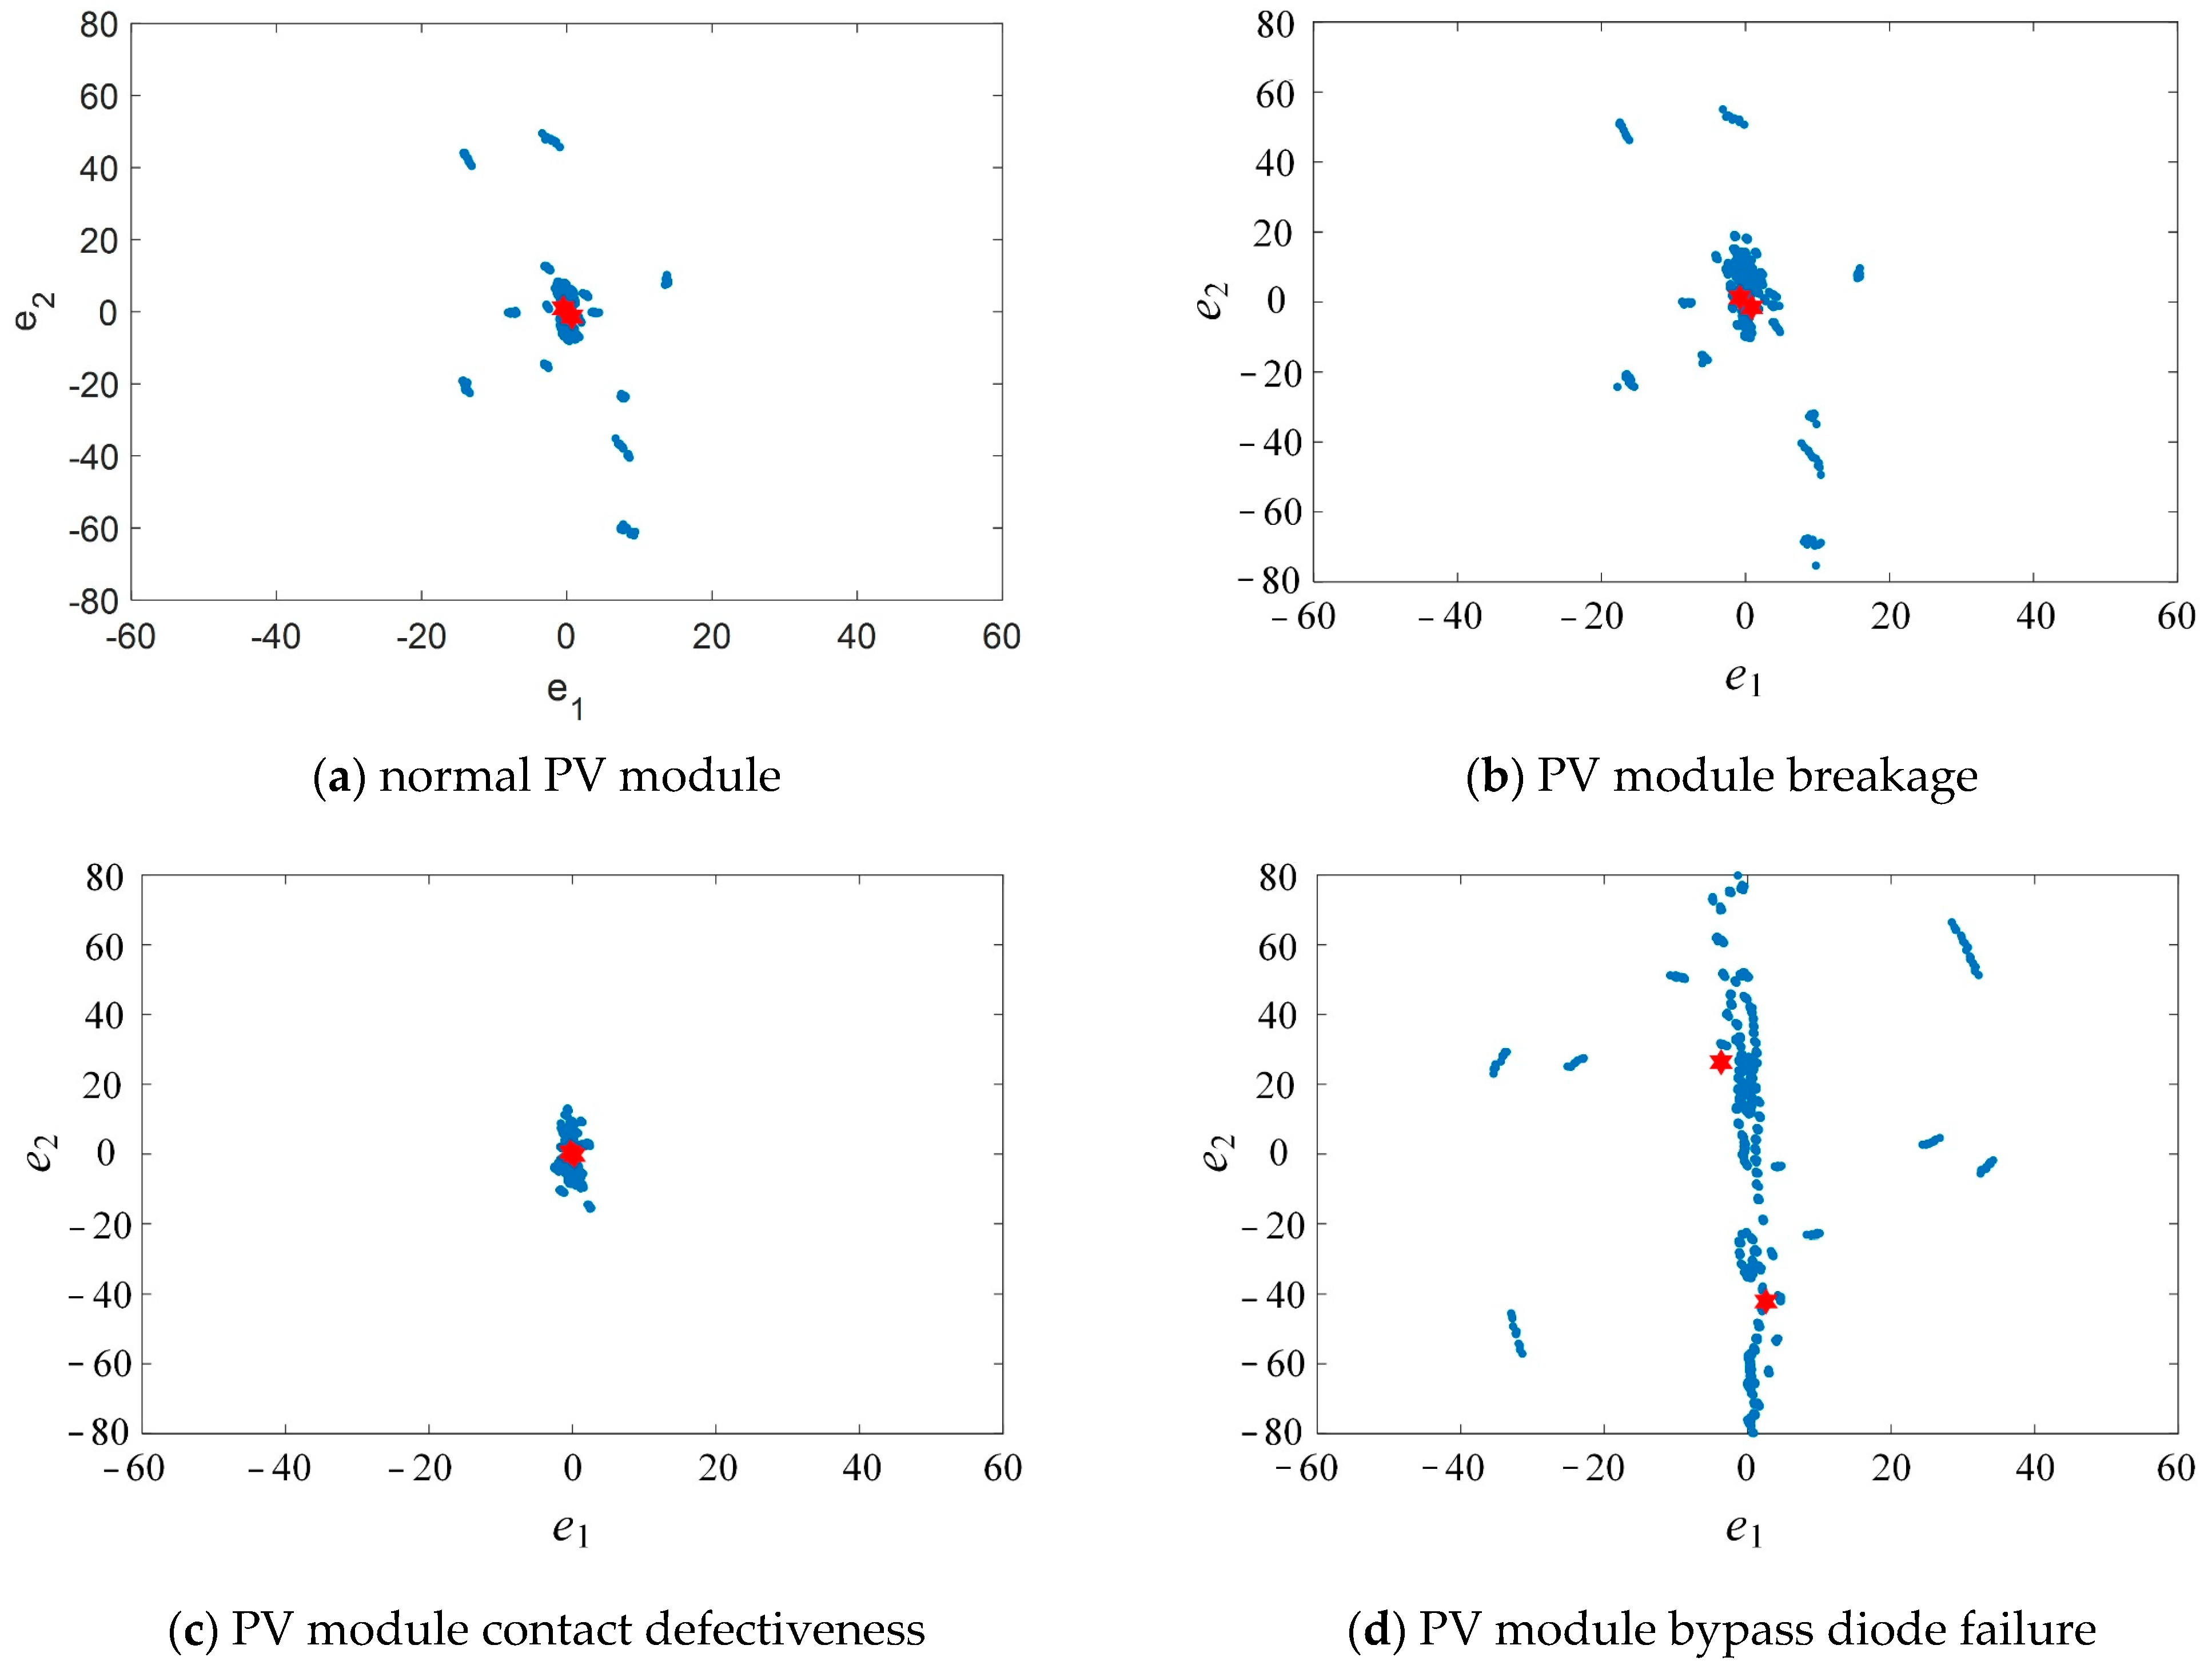
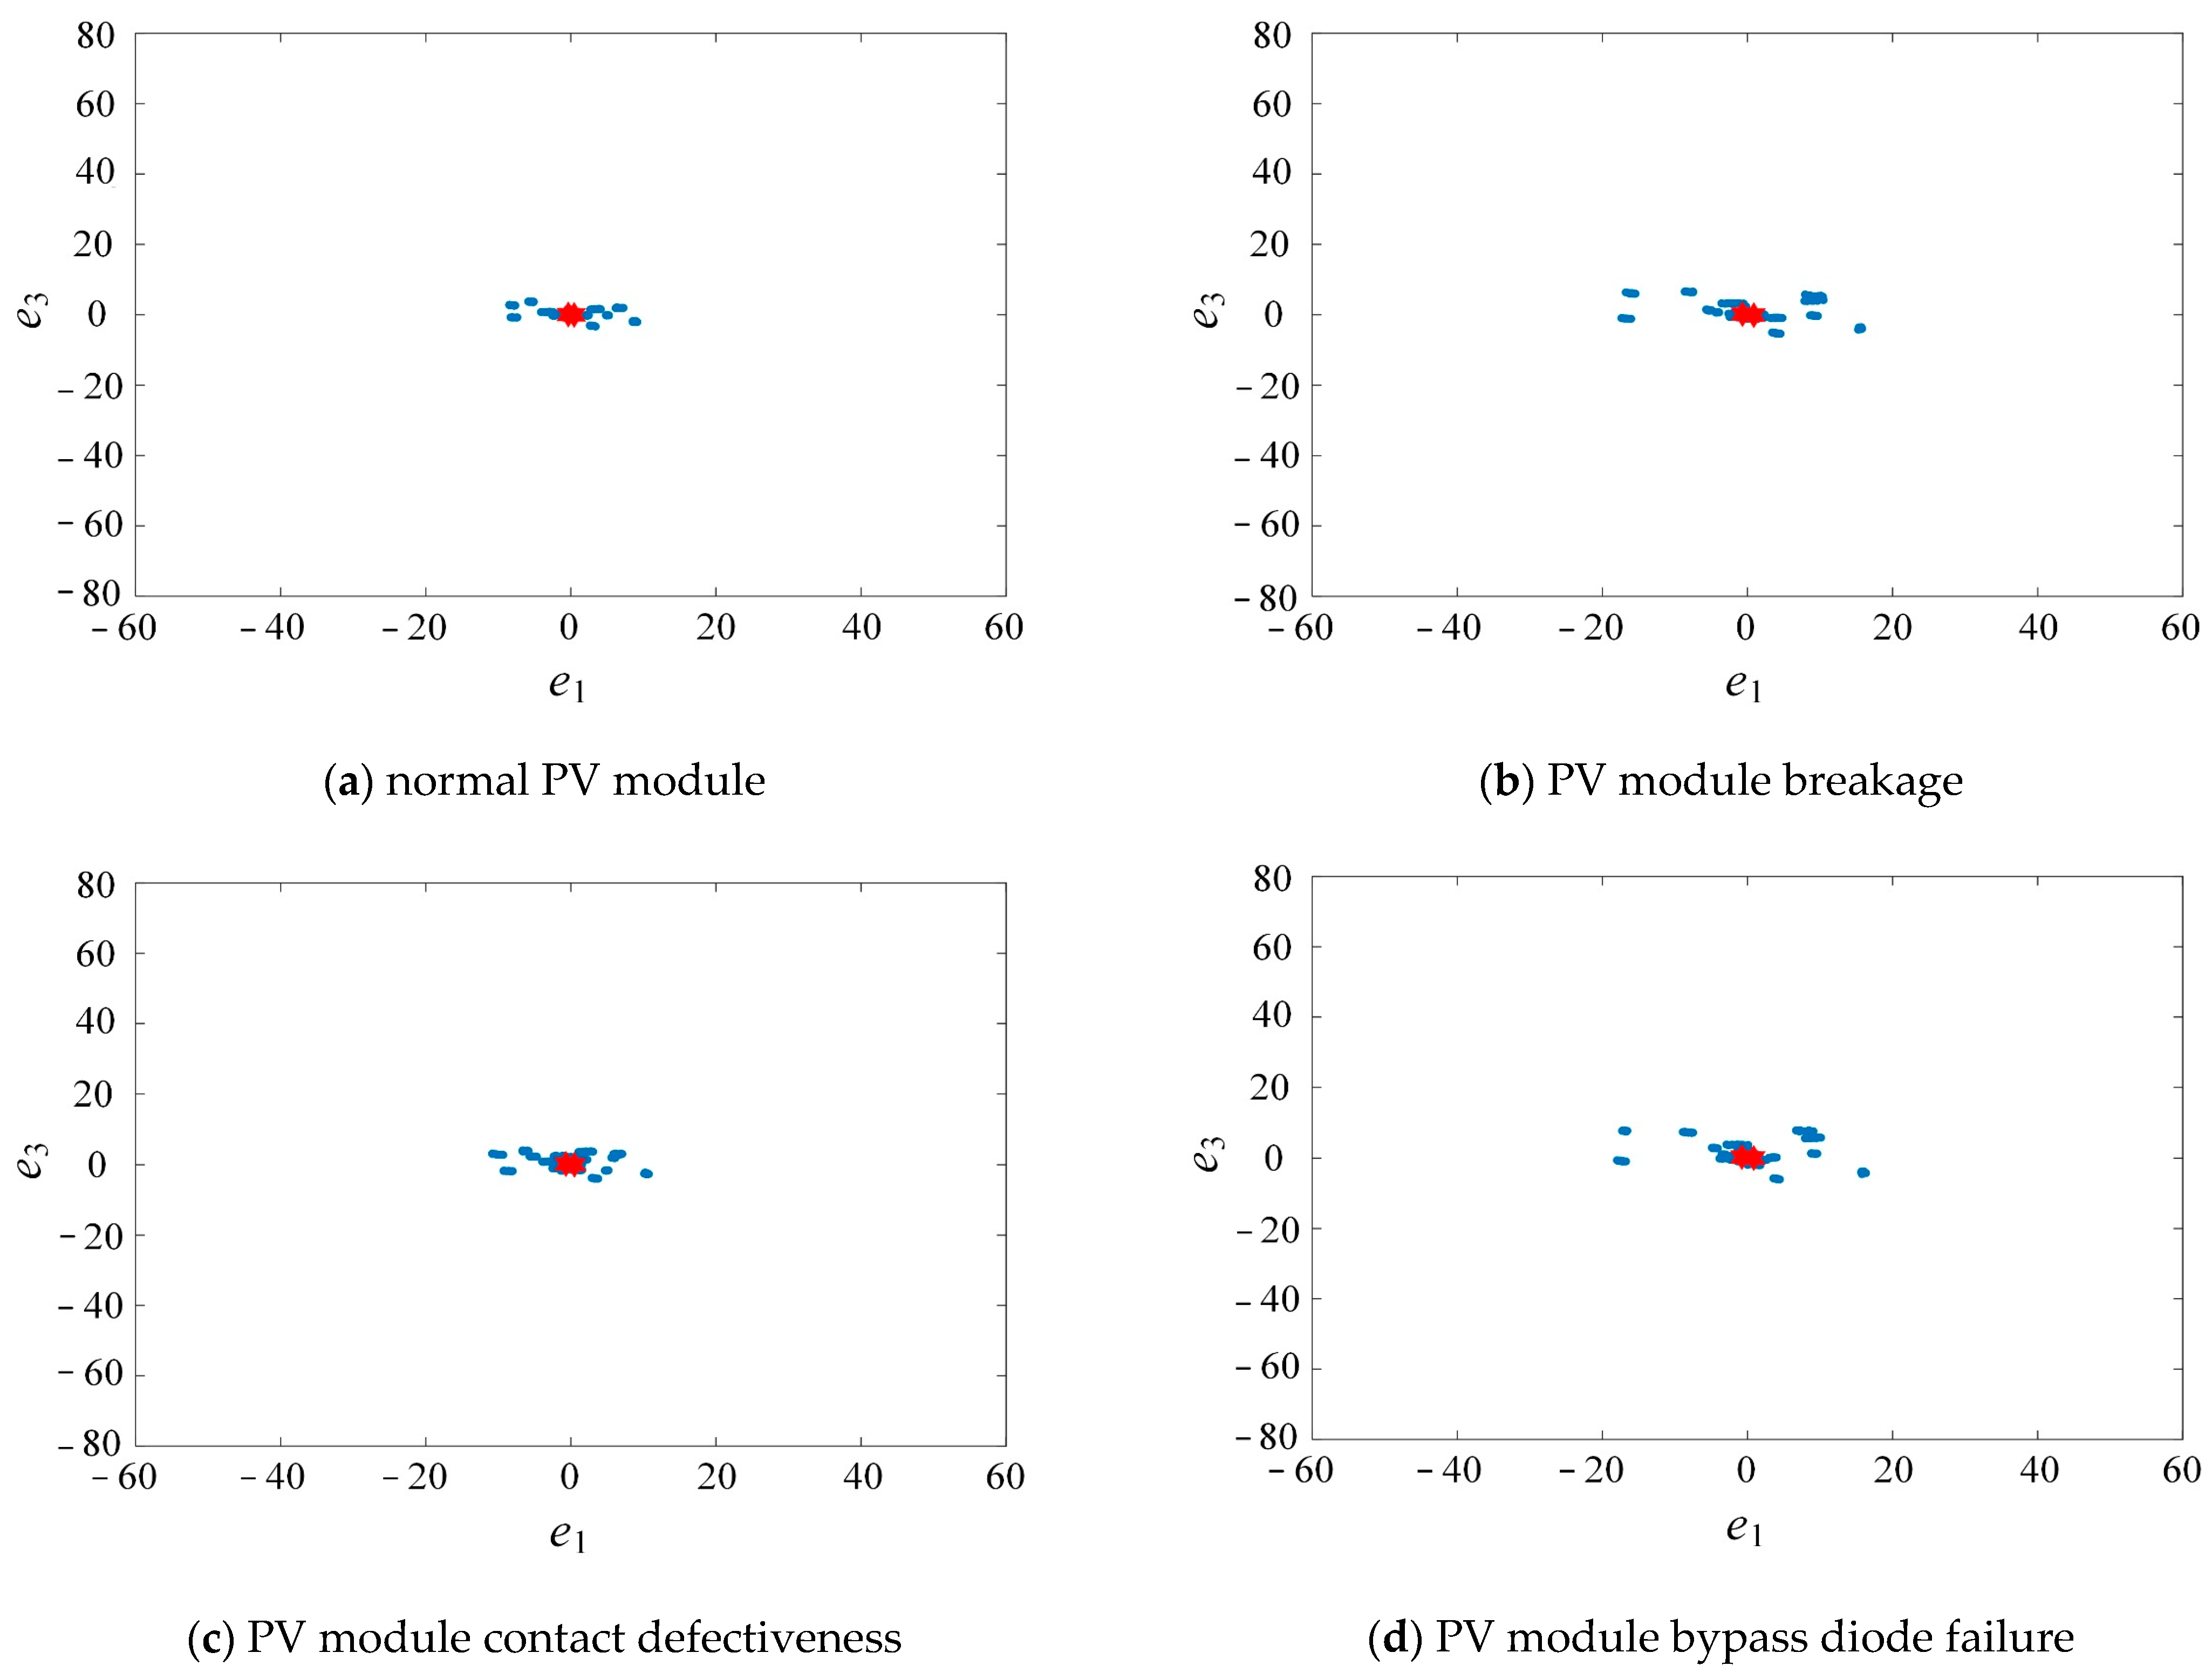
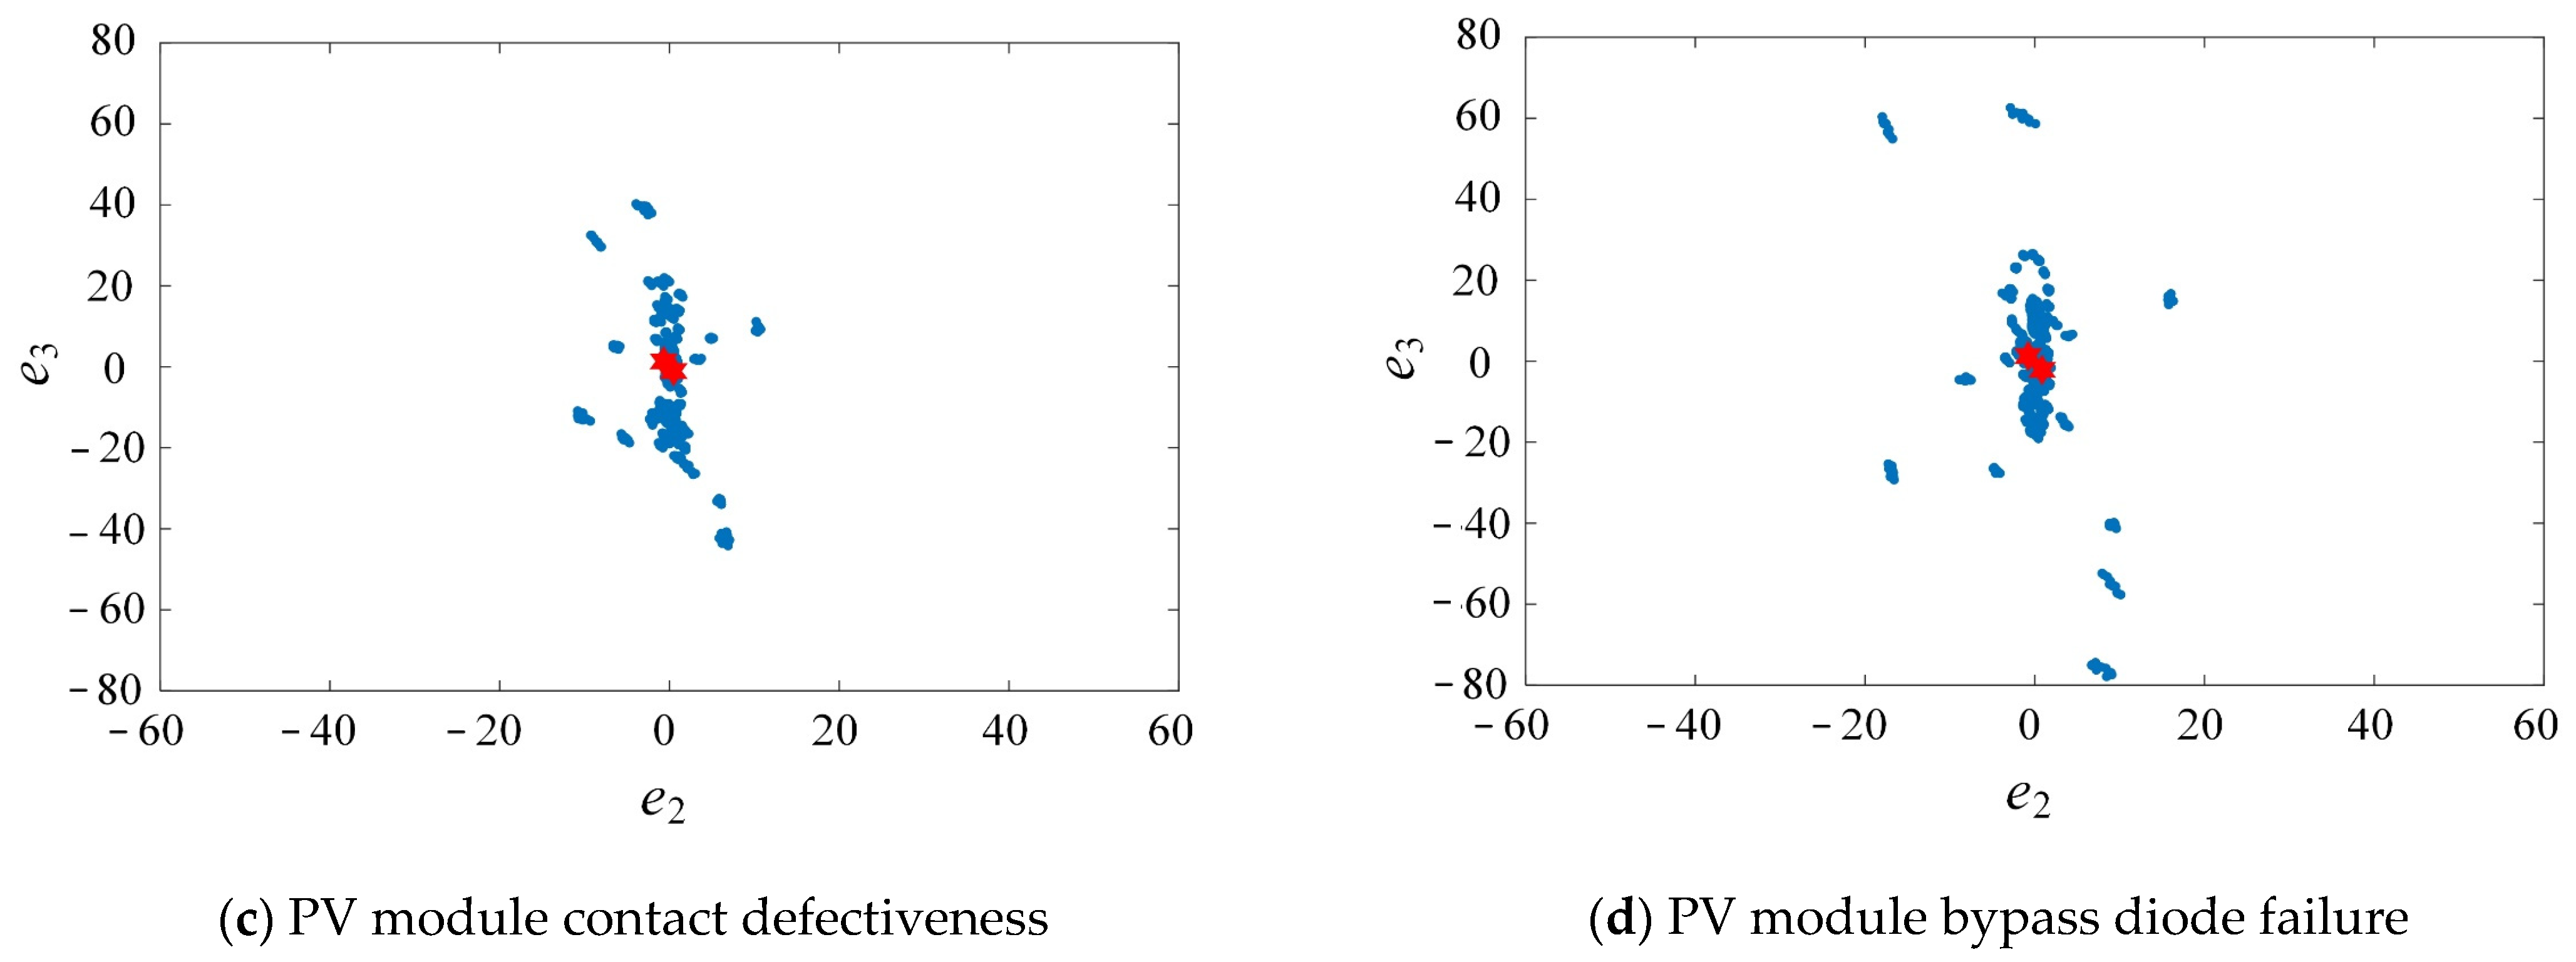
The computer hardware used for this study is the Intel Core (TM) i7-9700 [email protected] GHz processor and NVIDIA GeForce RTX 3060. The software configuration is a Windows 10 operating system with MATLAB 2021a for CNN. The CNN recognition model adjusts the convolution kernel size to 3 × 3 and uses ReLu as an activation function with Max Pooling, two pooling layers, two convolution layers and one fully connected layer. The dynamic errors CDEM , and are recognized by this network model for diagnosis. After the calculation by the Lorenz CSDM, the drawn normalized CDEM is shown in Figure 17a–d. The drawn normalized CDEM is shown in Figure 18a–d. The drawn normalized CDEM is shown in Figure 19a–d.
The simulation result is shown in Table 2. The CNN with Lorenz has the highest recognition accuracy, namely, 99.5%. The accuracy of CNN with Lorenzis 98%, that of ENN + dynamic error chaos eye coordinates is 80.25–86.75%. CNN with Lorenzhas the lowest recognition accuracy of 74%. As the chaotic scatter diagrams of Lorenzand Lorenzhave large differences for different fault types, favorable for image recognition analysis with CNN, the CNN with Lorenzand CNN with Lorenzhave a higher recognition rate than the other four detection methods, and are higher than the ENN, using numerical data for recognition.
Regarding the training time, while traditional ENN with Lorenz can complete the training in a shorter time (less than 1 s), CNN requires 9 s to finish the training. The CNN takes much more training time than ENN, as the CNN performs an image analysis, whereas the ENN uses a numerical analysis.
In addition, the recognition result of PV modules is displayed in a confusion matrix, as shown in Figure 20a–c, where the x-axis is the actual fault type, and the y-axis is the predicted fault type. The green and red grids of the confusion matrix represent the number of accurate recognitions and the number of misrecognitions, respectively. The recognition accuracy rate and misrecognition rate of the individual fault types are the green and red values in the whitish gray grids in the x-axis, respectively. The overall recognition accuracy rate and misrecognition rate are the green and red values in the lowest right gray grid of the confusion matrix, respectively. The overall recognition accuracy rate is the total value of green and red grids in the total value of green grids. As shown in Figure 20b, among the 100 test data of Type 1, the proposed method identified 90 data as Type 2, 1 data as Type 3, 1 data as Type 4 and 8 data as Type 1, so the recognition rate of Type 1 was only 8%. Similarly, the recognition of Type 2 of the proposed method was 90%, and that of Type 3 was 98%. Finally, the value of green grids divided by the sum of the green and red grid values, and the total recognition accuracy rate was 74%. Therefore, the CNN with Lorenz has a higher misrecognition rate of Types 1 and 2 than the other five detection methods, which means that Types 1 and 2 have similar CDEM (), which are unlikely to be recognized by CNN.
5. Conclusions
This study has successfully combined CNN with CSDM to develop a PV module fault diagnosis system. Four different fault models are built for common PV module fault defects. The waveform signals generated by high-frequency voltage are used as a data analysis source. The meaningful fault feature signals are captured by the chaos theory and the CDEM is imported into CNN for the PV module fault diagnosis. According to the actual measurement results, the diagnosis algorithm proposed in this study is better than ENN and it has a good diagnostic accuracy. Its recognition accuracy is 99.5%, which proves that the proposed method is valid in the fault detection of PV modules.
In the future, this study can expand its research in the direction of applying the PV fault diagnosis system on mobile APPs and the Internet of Things (IoT). After combining the programmable logic controller (PLC) with LabVIEW and building a human-machine interface (HMI) system, the proposed method will be able to perform real-time fault monitoring on PV Systems. The proposed method can be used in the other domains concerning electricity and energy, such as generators, power capacitors and wind-power generation systems. More different PV fault types can also be created, such as line to line faults, hot-spot faults and cell aging. Other AI algorithms can be introduced for fault diagnosis, so that preparations can be made according to the calculation analysis results, to provide power supply stability and the safety of PV systems.
Author Contributions
S.-D.L. conceived the presented idea, designed, experimented, and wrote this article; M.-H.W. supervised the findings of this work, and planned the experiments; S.-E.W., H.-D.L. and C.-C.W. performed the numerical simulations; all authors provided critical feedback and helped shape the research, analysis, and manuscript. All authors have read and agreed to the published version of the manuscript.
Funding
This research was funded by the Ministry of Science and Technology, Taiwan, R.O.C., under contract numbers: MOST 110-2221-E-167-025 and MOST 110-2221-E-167-008-MY3.
Conflicts of Interest
The authors declare no conflict of interest.
References
- Mariusz, M.; Jose, I.L.; Haitham, A.R. Solar Photovoltaic and Thermal Energy Systems: Current Technology and Future Trends. Proc. IEEE 2017, 105, 2132–2146. [Google Scholar]
- Jiang, Z.; Michael, K. Changes of solar cell parameters during damp-heat exposure. Prog. Photovolt Res. Appl. 2016, 24, 1346–1358. [Google Scholar]
- Khan, F.; Kim, J.H. Performance Degradation Analysis of c-Si PV Modules Mounted on a Concrete Slab under Hot-Humid Conditions Using Electroluminescence Scanning Technique for Potential Utilization in Future Solar Roadways. Materials 2019, 12, 4047. [Google Scholar] [CrossRef] [PubMed] [Green Version]
- Firoz, K.; Seong, H.B. Extraction of diode parameters of silicon solar cells under high illumination conditions. Energy Convers. Manag. 2013, 76, 421–429. [Google Scholar]
- Lorenzo, G.D.; Araneo, R.; Mitolo, M.; Niccolai, A. Review of O&M Practices in PV Plants: Failures, Solutions, Remote Control, and Monitoring Tools. IEEE J. Photovolt. 2020, 10, 914–926. [Google Scholar]
- Skomedal, A.; Deceglie, M.G. Combined Estimation of Degradation and Soiling Losses in Photovoltaic Systems. IEEE J. Photovolt. 2020, 10, 1788–1796. [Google Scholar] [CrossRef]
- Lillo-Bravo, I.; González-Martínez, P.; Larrañeta, M.; Guasumba-Codena, J. Impact of Energy Losses Due to Failures on Photovoltaic Plant Energy Balance. Energies 2018, 11, 363. [Google Scholar] [CrossRef] [Green Version]
- Ogbomo, O. Effect of operating temperature on degradation of solder joints in crystalline silicon photovoltaic modules for improved reliability in hot climates. Sol. Energy 2018, 170, 682–693. [Google Scholar] [CrossRef] [Green Version]
- Caixia, T.; Xu, W. Fault diagnosis of photovoltaic array based on deep belief network optimized by genetic algorithm. Chin. J. Electr. Eng. 2020, 6, 106–114. [Google Scholar]
- Zhehan, Y.; Amir, H.E. Fault Detection for Photovoltaic Systems Based on Multi-Resolution Signal Decomposition and Fuzzy Inference Systems. IEEE Trans. Smart Grid 2017, 8, 1274–1283. [Google Scholar]
- Farkhanda, A.; Azhar, U.H. A Novel Convolutional Neural Network-Based Approach for Fault Classification in Photovoltaic Arrays. IEEE Access 2020, 8, 41889–41904. [Google Scholar]
- Ayobami, S.E.; Cody, L. Finding Faults in PV Systems: Supervised and Unsupervised Dictionary Learning with SSTDR. IEEE Sens. J. 2021, 21, 4855–4865. [Google Scholar]
- Mahmoud, D.; Peter, M. Novel Photovoltaic Hot-Spotting Fault Detection Algorithm. IEEE Trans. Device Mater. Reliab. 2019, 19, 378–386. [Google Scholar]
- Faqih, A.; Kamanditya, B.; Kusumoputro, B. Multi-Step Ahead Prediction of Lorenz’s Chaotic System Using SOM ELM-RBFNN. In Proceedings of the 2018 Internacional Conference on Computer, Information and Telecommunication Systems (IEEE, 2018), Alsace, Colmar, France, 11–13 July 2018; pp. 1–5. [Google Scholar]
- Li, B.; Li, P.; Zhang, L.; Ma, M. Research on islanding detection method for PV module power system based on chaos theory. In Proceedings of the 2008 China International Conference on Electricity Distribution, Guangzhou, China, 10–13 December 2008; pp. 1–5. [Google Scholar]
- Hasegawa, S.; Ueda, Y. I-V Curve Differences Image Classification by CNN for Failure Factor Determination in PV module system. In Proceedings of the 2020 47th IEEE Photovoltaic Specialists Conference (PV moduleSC), Calgary, AB, Canada, 15 June–21 August 2020; pp. 683–688. [Google Scholar]
- Huang, J.; Wai, R.; Gao, W. Newly-Designed Fault Diagnostic Method for Solar Photovoltaic Generation System Based on IV-Curve Measurement. IEEE Access 2019, 7, 70919–70932. [Google Scholar] [CrossRef]
- Khelifa, M.A.; Boukabou, A.; Hammami, N. Data Transmission Based on Chaotic Synchronization System. In Proceedings of the International Conference on Computer Applications Technology, Sousse, Tunisia, 20–22 January 2013; pp. 1–2. [Google Scholar]
- Huang, C.H.; Lin, C.H.; Kuo, C.L. Chaos Synchronization-Based Detector for Power-Quality Disturbances Classification in a Power System. IEEE Trans. Power Deliv. 2010, 26, 944–953. [Google Scholar] [CrossRef]
- Yau, H.T.; Wang, M.H. Chaotic Eye-Based Fault Forecasting Method for Wind Power Systems. IET Renew. Power Gener. 2015, 9, 593–599. [Google Scholar] [CrossRef]
- Liu, R.; Meng, G.; Yang, B.; Sun, C.; Chen, X. Dislocated Time Series Convolutional Neural Architecture: An Intelligent Fault Diagnosis Approach for Electric Machine. IEEE Trans. Ind. Inform. 2017, 13, 1310–1320. [Google Scholar] [CrossRef]
- Sharma, A.K.; Foroosh, H. Slim-CNN: A Light-Weight CNN for Face Attribute Prediction. In Proceedings of the 2020 15th IEEE International Conference on Automatic Face and Gesture Recognition (FG 2020), Buenos Aires, Argentina, 16–20 November 2020; pp. 329–335. [Google Scholar]
- Chen, Y.H.; Fan, C.P.; Chang, R.C.H. Prototype of Low Complexity CNN Hardware Accelerator with FPGA-based PYNQ Platform for Dual-Mode Biometrics Recognition. In Proceedings of the 2020 International SoC Design Conference (ISOCC), Yeosu, Korea, 21–24 October 2020; pp. 189–190. [Google Scholar]
- Wang, M.H.; Lu, S.D.; Liao, R.M. Fault Diagnosis for Power Cables Based on Convolutional Neural Network with Chaotic System and Discrete Wavelet Transform. IEEE Trans. Power Deliv. 2021, 1. [Google Scholar] [CrossRef]
- Lau, M.M.; Lim Hann, K. Review of Adaptive Activation Function in Deep Neural Network. In Proceedings of the 2018 IEEE-EMBS Conference on Biomedical Engineering and Sciences (IECBES), Sarawak, Malaysia, 3–6 December 2018; pp. 686–690. [Google Scholar]
- Wang, Y.; Li, Y.; Rong, X. The Influence of the Activation Function in a Convolution Neural Network Model of Facial Expression Recognition. Appl. Sci. 2020, 10, 1897. [Google Scholar] [CrossRef] [Green Version]
Figure 1.
Architecture of system.

Figure 2.
PV module fault detection testing platform.

Figure 3.
The circuit diagram of the PV module fault detection testing platform.

Figure 4.
PV module I-V curve.

Figure 5.
Built-in normal PV module.

Figure 6.
Extensively damaged of the built PV module.

Figure 7.
Partial failure of the built PV module.

Figure 8.
Contact defectiveness of the built-in PV module.

Figure 9.
Bypass diode failure of the built-in PV module.

Figure 10.
The algorithmic procedure.

Figure 11.
The designed CNN model architecture.

Figure 12.
Schematic for the convolutional operation process.

Figure 13.
Schematic for the pooling operation process.

Figure 14.
Model architecture for fully connected layer.

Figure 15.
Activation function for ReLU.

Figure 16.
The integration of the original signals.

Figure 17.
Normalized chaotic dynamic error map () of PV module fault types.

Figure 18.
Normalized chaotic dynamic error map () of PV module fault types.

Figure 19.
Normalized chaotic dynamic error map () of PV module fault types.


Figure 20.
Confusion matrixes of CNN with Lorenz CSDM for fault diagnosis of PV modules.


Table 1.
PV module fault state models.
| Work Style | PV Module Defect Construction |
|---|---|
| (Off-line) | normal PV module (Type1) |
| PV module breakage (Type2) | |
| PV module contact defectiveness (Type3) | |
| PV module bypass diode failure (Type4) |
Table 2.
Simulation results with different algorithms.
| Algorithm | Epoch | Training Rate (%) | Accuracy Rate (%) | Training Time (s) | Ranking |
|---|---|---|---|---|---|
| CNN + Lorenz | 50 | 100 | 99.5 | 9 | 1 |
| CNN + Lorenz | 50 | 100 | 98 | 9 | 2 |
| ENN + Lorenz | 100 | 97.2 | 86.75 | 0.154 | 3 |
| ENN + Lorenz | 100 | 95.5 | 83.25 | 0.146 | 4 |
| ENN + Lorenz | 100 | 95.25 | 80.25 | 0.143 | 5 |
| CNN + Lorenz | 50 | 100 | 74 | 9 | 6 |
Publisher’s Note: MDPI stays neutral with regard to jurisdictional claims in published maps and institutional affiliations. |
© 2021 by the authors. Licensee MDPI, Basel, Switzerland. This article is an open access article distributed under the terms and conditions of the Creative Commons Attribution (CC BY) license (https://creativecommons.org/licenses/by/4.0/).
Share and Cite
MDPI and ACS Style
Lu, S.-D.; Wang, M.-H.; Wei, S.-E.; Liu, H.-D.; Wu, C.-C. Photovoltaic Module Fault Detection Based on a Convolutional Neural Network. Processes 2021, 9, 1635. https://0-doi-org.brum.beds.ac.uk/10.3390/pr9091635
AMA Style
Lu S-D, Wang M-H, Wei S-E, Liu H-D, Wu C-C. Photovoltaic Module Fault Detection Based on a Convolutional Neural Network. Processes. 2021; 9(9):1635. https://0-doi-org.brum.beds.ac.uk/10.3390/pr9091635
Chicago/Turabian StyleLu, Shiue-Der, Meng-Hui Wang, Shao-En Wei, Hwa-Dong Liu, and Chia-Chun Wu. 2021. "Photovoltaic Module Fault Detection Based on a Convolutional Neural Network" Processes 9, no. 9: 1635. https://0-doi-org.brum.beds.ac.uk/10.3390/pr9091635
Note that from the first issue of 2016, this journal uses article numbers instead of page numbers. See further details here.