
Kinetics of Cometabolic Transformation of 4-chlorophenol and Phenol Degradation by Pseudomonas putida Cells in Batch and Biofilm Reactors


Department of Safety, Health and Environmental Engineering, Central Taiwan University of Science and Technology, 666, Bu-zih Road, Bei-tun District, Taichung 406053, Taiwan
Processes 2021, 9(9), 1663; https://0-doi-org.brum.beds.ac.uk/10.3390/pr9091663
Submission received: 28 August 2021
/
Revised: 12 September 2021
/
Accepted: 13 September 2021
/
Published: 15 September 2021
Abstract
:The biodegradation kinetics of 4-chlorophenol (4-CP) and phenol and microbial growth of Pseudomonas putida (P. putida) cells were estimated in batch and biofilm reactors. The kinetic parameters of cells on phenol were determined using the Haldane formula. The maximum specific growth rate of P. putida on phenol, the half-saturation constant of phenol and the self-inhibition constant of phenol were 0.512 h−1, 78.38 mg/L and 228.5 mg/L, respectively. The yield growth of cells on phenol (YP) was 0.618 mg phenol/mg cell. The batch experimental results for the specific transformation rate of 4-CP by resting P. putida cells were fitted with Haldane kinetics to evaluate the maximum specific utilization rate of 4-CP, half-saturation constant of 4-CP, and self-inhibition constant of 4-CP, which were 0.246 h−1, 1.048 mg/L and 53.40 mg/L, respectively. The negative specific growth rates of cells on 4-CP obtained were fitted using a kinetic equation to investigate the true transformation capacity and first-order endogenous decay coefficient, which were 4.34 mg 4-CP/mg cell and 5.99 × 10⁻³ h−1, respectively. The competitive inhibition coefficients of phenol to 4-CP transformation and 4-CP to phenol degradation were 6.75 and 9.27 mg/L, respectively; therefore, phenol had a higher competitive inhibition of 4-CP transformation than the converse. The predicted model examining cometabolic transformation of 4-CP and phenol degradation showed good agreement with the experimental observations. The removal efficiencies for phenol and 4-CP were 94.56–98.45% and 96.09–98.85%, respectively, for steady-state performance.
1. Introduction
Phenolic and chlorophenolic compounds as intermediate products are present in pesticides, pharmaceuticals, insecticides, fungicides, etc. These compounds are difficult to remove owing to their toxic properties [1,2]. Conventional treatment methods such as adsorption, chemical oxidation, and electrochemical oxidation exhibit high removal efficiencies with various phenolic and chlorophenolic compounds; however, these methods have several drawbacks, such as high operation costs, toxic intermediate products, incomplete mineralization of the compounds, and the high disposal cost of chemical waste sludge [3]. Biological processes to treat phenolic and chlorophenolic compounds containing environmentally friendly and low-cost properties have been reported [4,5,6]. The application of biological processes to treat phenolic and chlorophenolic compounds in wastewater has gained much attention. Many researchers have performed kinetic studies of single- and dual-substrate biodegradation to improve our understanding of the detailed performance of biological processes.
Mathematical models for pollutant biodegradation have gained deep insight into the different interactions between multiple substrates. A generalized additive Monod model describing dual-substrate biodegradation with competitive inhibition was developed by Yoon et al. [7]. However, this model was not effective for predicting the complex interactions of phenol, benzene and toluene. A sum of a kinetic model involving interaction parameters was proposed by Reardon et al. [8], who successfully described the interactions of aromatic hydrocarbon mixtures containing benzene, toluene, ethylbenzene, and xylene compounds.
Pseudomonas putida (P. putida) is a widely used microorganism for the biodegradation of phenols [9]. Li et al. [10] successfully isolated P. putida LY1 from river sediment and conducted several batch experiments with a wide range of initial phenol concentrations from 0 to 800 mg/L at 25 °C. Their experimental results revealed that P. putida LY1 had the ability to utilize phenol at low temperatures and showed good growth at room temperature. Loh and Chua [11] reported complete degradation of 600 mg/L benzoate in 11 h using P. putida ATCC 49451. Li et al. [12] performed intergeneric protoplast fusion between P. putida and Bacillus subtilis to enhance benzoate tolerance as high as 10,000 mg/L with a specific growth rate of 30.9 × 10⁻³ h. Yu et al. [13] conducted the bacterial metal detoxification systems to observe the role of P. putida cells surface sulfhydryl sites in the detoxification of Cd. Their experimental results found that P. putida cells could detoxify Cd concentrations of 5 and 20 mg/L.
In previous studies, P. putida cells in the presence of phenol and sodium glutamate as growth substrates were found to have a high capacity for removing 4-chlorophenol (4-CP) due to cometabolism [14,15]. In previous studies, 4-CP was found to be very toxic to cell growth and severely retarded the biotransformation capacity of bacteria. This author concluded that cometabolism involving multiple substrates could be optimized and biphasic growth patterns could be avoided to utilize sodium glutamate more effectively for enhancing the cometabolism of phenol and 4-CP. The cometabolic transformation of 4-CP and phenol degradation by Stenotrophomonas maltophilia KB2 has been evaluated [16]. The experimental results revealed that the removal efficiencies for 4-CP and phenol were approximately 90–95% and 100%, respectively, in the batch experiments. However, the kinetics of cometabolic transformation and phenol degradation in the biofilm process have not yet been proposed. The aim of the present study was to develop a kinetic model system to describe the performance of the cometabolic transformation of 4-CP and phenol degradation by P. putida cells in a packed-bed biofilm reactor.
The main objectives were to (1) cultivate and enrich P. putida ATCC 49451 using batch reactors; (2) determine the kinetic parameters of P. putida cells on phenol alone; (3) determine the kinetic parameters of P. putida cells on 4-CP with resting cells; (4) determine the substrate interaction parameters of phenol plus 4-CP; (5) develop a biofilm model system for the cometabolic transformation of 4-CP and phenol degradation; and (6) conduct continuous-flow packed-bed reactors to validate the kinetic model system for synchronous 4-CP transformation and phenol degradation
2. Description of Models
2.1. Kinetic Model for Phenol in Batch Reactor
To evaluate the biodegradation of growth substrate in batch reactors using P. putida cells at varying concentrations of growth substrate, the specific growth substrate utilization rate can be described as follows [17]:
where is the specific phenol utilization rate (mg phenol/mg cell-h), is the phenol concentration (mg/L), is the cell concentration (mg/L), is the specific growth rate (h−1) on phenol and is the yield coefficient of cells on phenol (mg cell/mg phenol). The Haldane model is widely used to express the inhibition kinetics of growth substrate on cell growth that can be written as the following equation [2]:
where is the maximum specific growth rate of cells on phenol (h−1), is the half-saturation constant of phenol (mg/L), and is the self-inhibition constant of phenol (mg/L). The growth pattern of cells on phenol biodegradation can be described with the following equation [18]:
2.2. Kinetic Model for 4-CP in Batch Reactor
The kinetics of 4-CP transformation by resting cells obtained from the growth substrate was used to determine the maximum specific utilization rate of 4-CP (), half-saturation constant of 4-CP () and self-inhibition constant of 4-CP () [19]. The form of the kinetic model expressing the specific transformation rate of 4-CP using the resting cells of P. putida is described as follows [16]:
where is the specific utilization rate of 4-CP (mg 4-CP/mg cell-h), is the true transformation capacity defined as the mass of non-growth substrate that would be transformed by the unit mass of cells in the absence of endogenous decay (mg 4-CP/mg cell), and is the first-order endogenous decay coefficient (h−1).
2.3. Kinetic Model for Phenol Plus 4-CP in Batch Reactor
A kinetic model was used to predict the biodegradation of growth and non-growth substrates using microbial cultures exposed to various concentration ratios of growth to non-growth substrates [20]. A kinetic model was developed to describe cell growth in a wide range of phenol and 4-CP substrate concentrations [21,22]. Enzyme inhibition caused by the simultaneous degradation of cometabolic substrates has generally been modeled by including competitive inhibition terms in the half-saturation constant of the equations describing the biodegradation rate of cometabolic substrates. In present study, Haldane substrate inhibition kinetics was used to model the inhibitory effect of phenol and 4-CP on their own biotransformation [16]. The specific biodegradation rate of both substrates can be described as:
where and are the specific degradation rates of phenol and 4-CP, respectively (mg substrate/mg cell-h); and are the phenol and 4-CP concentrations in the batch reactor, respectively (mg/L); and are the maximum specific utilization rates of phenol and 4-CP (mg substrate/mg cell-h), respectively; and are the half-saturation constants for phenol and 4-CP degradation, respectively (mg/L); and and are the competitive inhibition coefficients of phenol and 4-CP, respectively (mg/L) [23].
The specific growth rate of a cell is typically expressed as a function of growth substrate consumption and cell decay as follows [23]:
where is the specific growth rate on phenol and 4-CP (h−1); is the growth yield of P. putida cells (mg cell/mg phenol); and is true cell transformation capacity defined as the mass of non-growth substrate that would be transformed by the unit mass of cells in the absence of endogenous decay (mg 4-CP/mg cell). Thus, is the specific decay rate attributed to cometabolism alone (h−1) [24].
Equations (6)–(8) provide a complete mathematical description of the utilization rates of the growth substrate (phenol) and non-growth substrate (4-CP) and the growth rate of cells throughout the growth and decay periods. The model was named the competitive inhibition model (CIM).
2.4. Conceptual Basis of Phenol and 4-CP Concentration Profiles in Biofilm Reactor
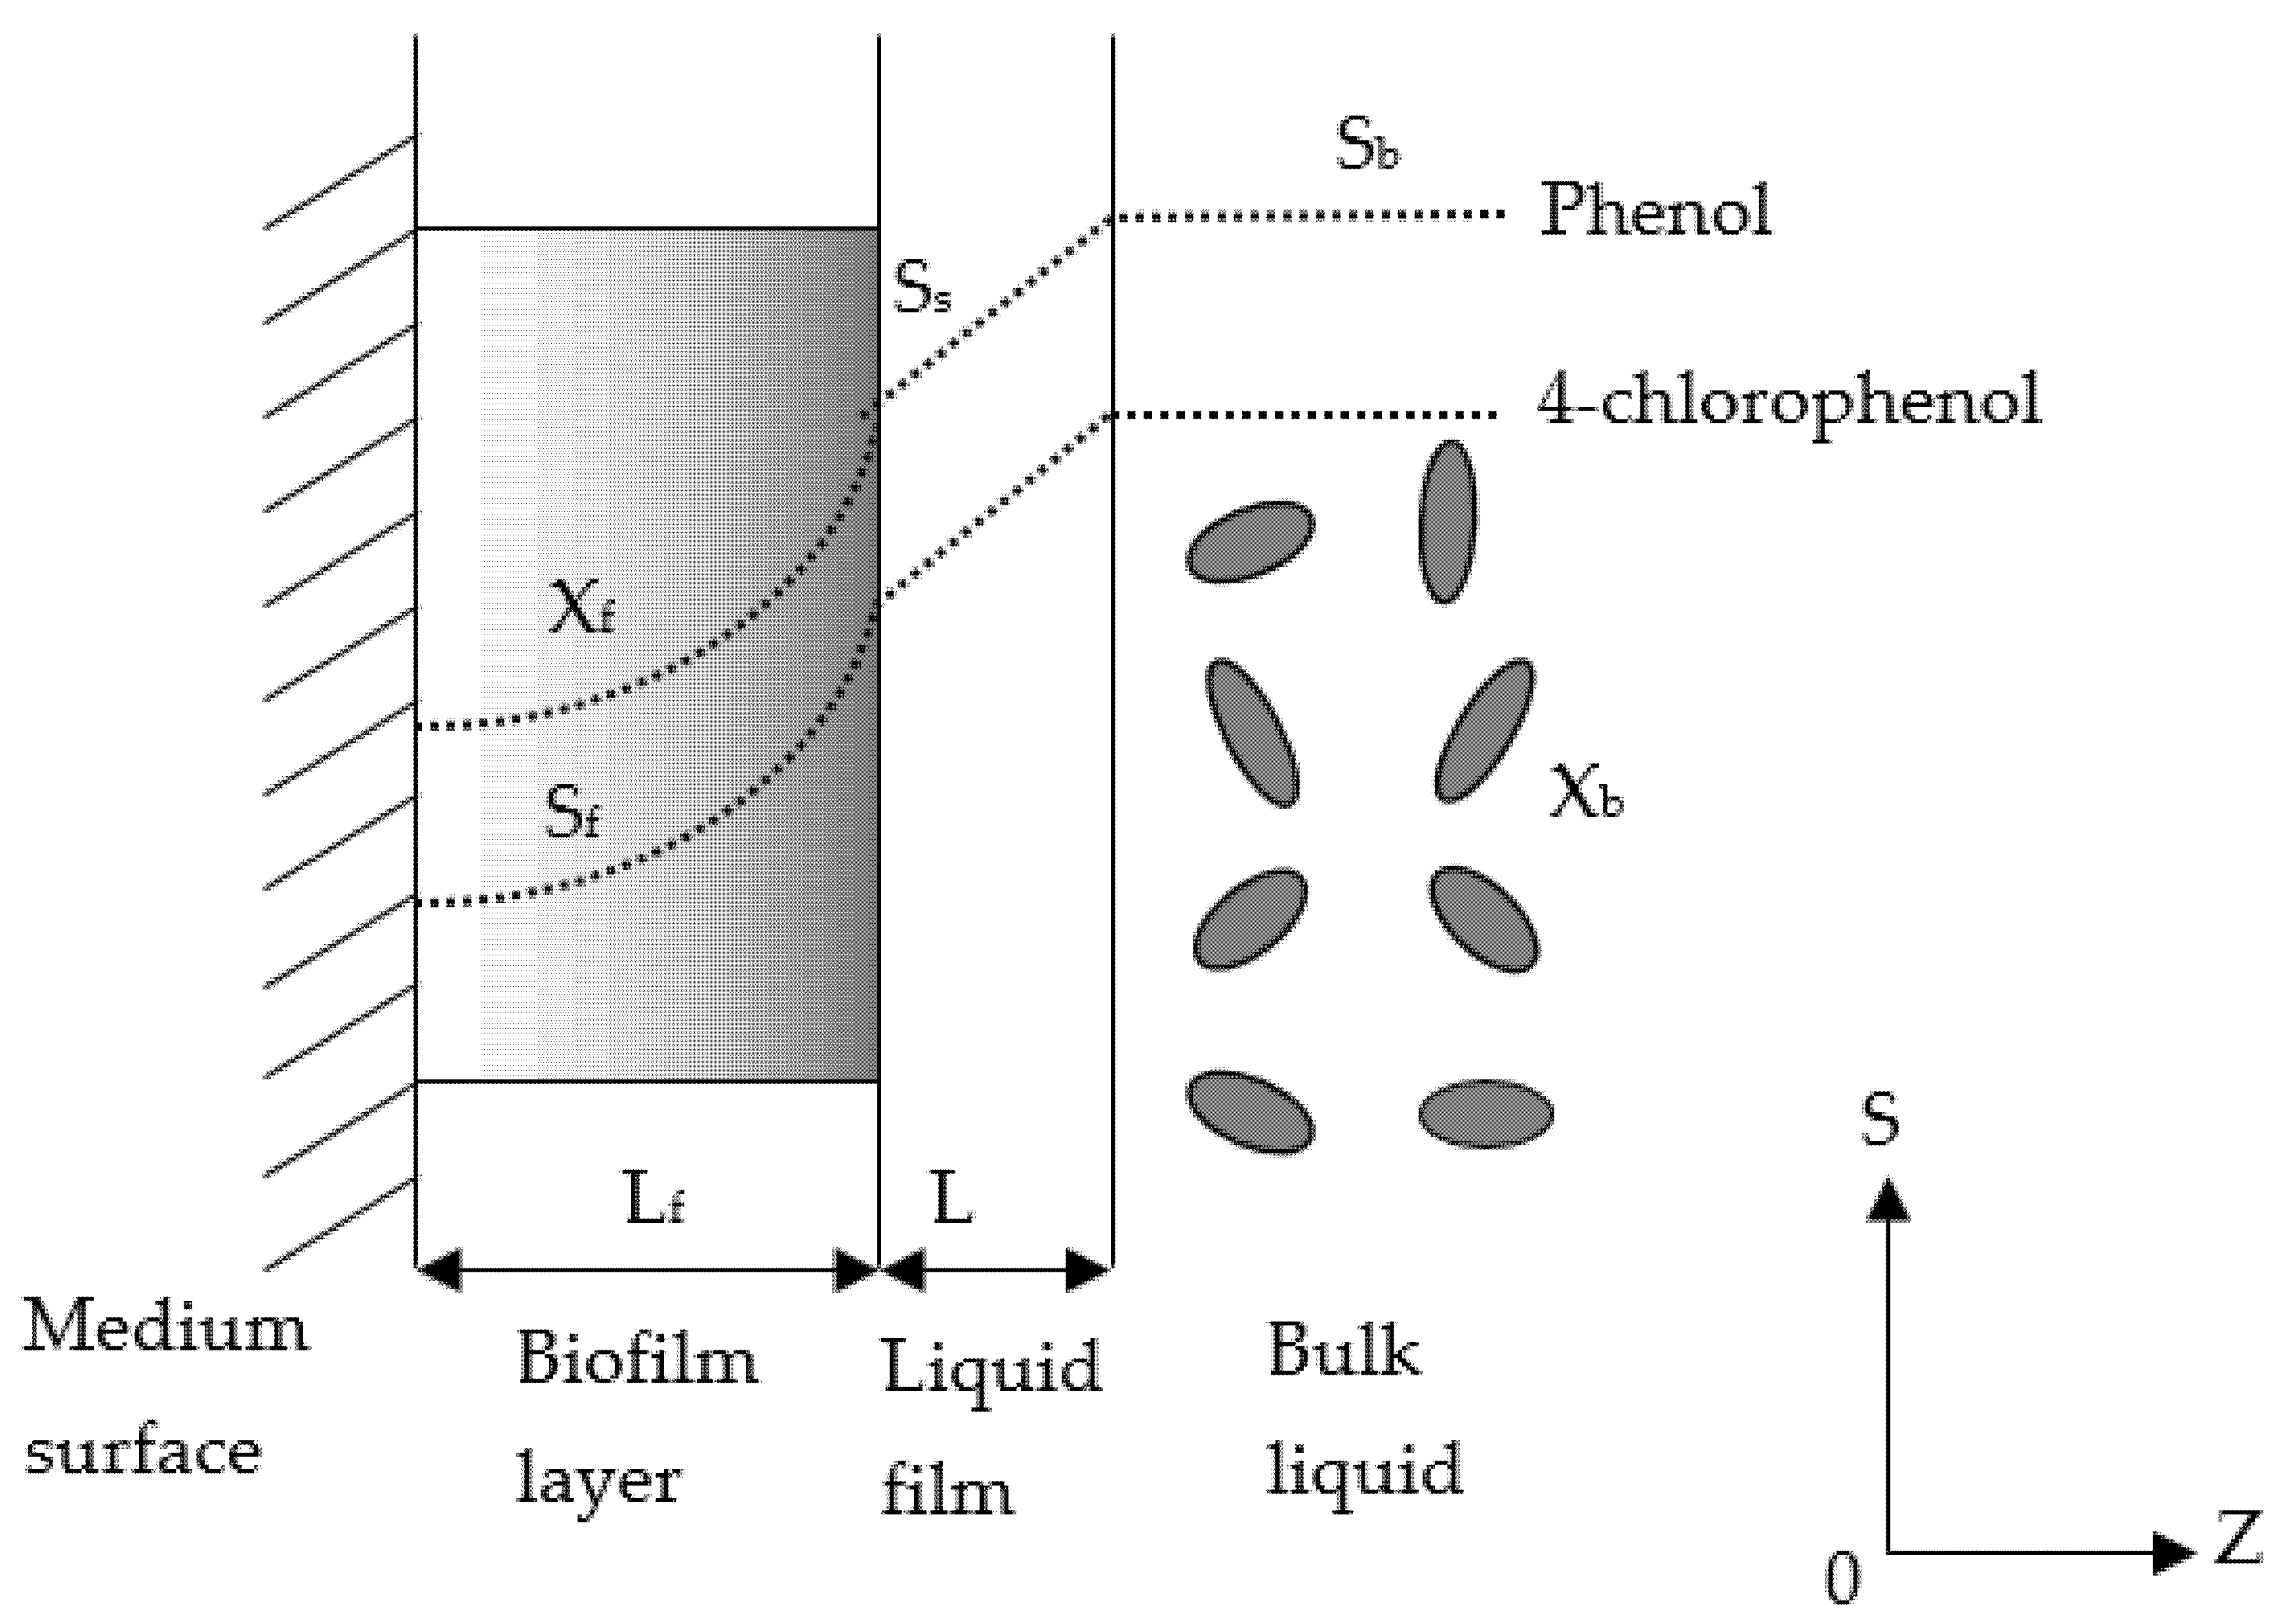
Figure 1 illustrates the concentration profiles of phenol and 4-CP in the bulk liquid, liquid film and biofilm in the continuous-flow biofilm reactor. In the bulk liquid, the substrate concentration profiles were flat lines owing to a completely mixed condition occurring during this phase. The phenol and 4-CP were then transferred through the liquid film and diffused into the biofilm to form curved concentration profiles in the fixed biofilm system.
2.5. Kinetic Model for Cometabolic Biodegradation in Biofilm Reactor
A reliable design model used to predict phenol and 4-CP biodegradation must be able to estimate the growth of cells and effluent concentrations of phenol and 4-CP. Based on diffusion (Fick’s Law) and modifying Haldane inhibition kinetics, the substrate balance for phenol and 4-CP in the biofilm can be expressed as:
where is the biofilm thickness (µm); and are the phenol and 4-CP concentrations in the biofilm (mg substrate/L), respectively; is the density of the biofilm (mg cell/L); is the shear loss of the biofilm (d−1); and is the radial distance (µm).
A fixed biofilm reactor in which a kinetic biofilm model can be applied is a completely mixed biofilm reactor. All the suspended cells at the liquid/biofilm interface were exposed to the same phenol and 4-CP concentrations. The substrate disappeared from the bulk liquid as it migrated into the liquid/biofilm interface. The suspended P. putida cells started growing because of substrate biodegradation. The mass balance of phenol and 4-CP, and the suspended cells in the fixed biofilm reactor can be described as:
where and are the phenol and 4-CP concentrations in the bulk liquid (mg/L), respectively; is the cell concentration in the bulk liquid; is the flow rate of the feed substrate (cm3/d); is working volume (cm3); is the total surface area of the media (cm2); and is the reactor porosity (dimensionless).
3. Materials and Methods
3.1. Chemicals
All chemicals were of analytical grade and were purchased from Sigma Aldrich Ltd., Germany. Stock solutions were prepared by dissolving 1 g phenol and 4-CP in 1.0 L distilled/deionized water (DIDW), respectively. Test solutions containing phenol and 4-CP were prepared by diluting 1000 mg/L of phenol and 4-CP stock solutions to the desired concentrations. All stock solutions were stored at 4 °C prior to use.
3.2. P. putida Cells Inoculum
A pure culture of P. putida ATCC 49451 was originally purchased from the American Type Culture Collection. The freeze-dried powder strain fixed firmly in a vacuum vial was placed at 4 °C in the refrigerator until use. The vacuum vial was cut in the laminar flow bench. In order to activate freeze-dried cells, the Luria Bertani (LB) Broth with 0.5 mL was added to the vial to melt the frozen stock culture [25]. The activated cells with LB was then transferred to small bottle with 2.5 mL LB. The small bottle was capped and placed in a shaker controlled at 130 rpm and 28 °C for 24 h to guarantee the viability of P. putida cells. The 0.1 mL glycerin was added into 0.9 mL inoculum and placed into low-temperature freezer controlled at −80 °C for strain preservation. P. putida ATCC 49451 stock strain was then inoculated into LB agar plate by overfired platinum inoculation loop and placed in an incubator at 28 °C for 16–18 h of cultivation. One colony was picked by inoculation loop and transferred into 500 mL Erlenmeyer flask containing 250 mL mineral salt medium for culturing in a shaking incubator at 130 rpm and 28 °C for 16–18 h. Activated cells in the late-exponential phase were harvested as inoculums for subsequent use.
3.3. Mineral Salt Medium
A pure culture of P. putida ATCC 49451 with high removal efficiency for phenol and cometabolic transformation of 4-CP has been demonstrated [15,22]. Therefore, P. putida strains were used to evaluate the biodegradation of phenol, 4-CP and phenol plus 4-CP. The mineral salt medium prepared for P. putida cells contained: K2HPO4, 0.65 g; KH2PO4, 0.2 g; NaNO3, 3.61 g; MgSO4·7H2O, 0.2 g; FeSO4·7H2O, 0.00556 g; (NH4)2·SO4, 0.5 g; and 10 mL of trace mineral solution per liter medium [26,27]. The trace mineral solution contained (g/L): nitrilotriacetic acid, 1.5; MnSO4·H2O, 0.5; CoCl2·6H2O, 0.1; CaCl2, 0.1; ZnSO4·7H2O, 0.1; CuSO4·5H2O, 0.01; H3BO3, 0.01; Na2MoO4·2H2O, 0.01; and AlK(SO4)2·12H2O, 0.01. To prepare the trace mineral solution, 1.5 g nitrilotriacetic acid was added to approximately 500 mL DIDW and adjusted to pH 6.5 with KOH to enhance dissolution. The remaining components of the trace mineral solution were then added, and the solution volume was brought to 1 L with DIDW. All media, pipette tips, stock solutions and Erlenmeyer flasks fitted with cotton plugs were autoclaved at 121 °C for 20 min for sterilization prior to use.
3.4. Analytical Methods
HPLC-UV with Alliance 2695 liquid chromatography (Waters Co., Milford, MA, USA) was used to measure phenol and 4-CP. The apparatus consisted of a Waters 2707 autosampler and Waters 2487 UV/Vis detector, and was equipped with a Symmetry® C18 column (particle size, 5 µm). The diameter of the column was 3.9 mm and the height was 150 mm. The samples were filtered through a Millipore filter (0.22 µm) before phenol and 4-CP analysis. A mobile phase composed of 50 mM potassium phosphate/acetonitrile (70/30, v/v) was used to elute the samples at a flow rate of 0.7 mL/min. The UV/Vis spectrophotometric detector was set to 254 nm. The injection volume of each sample was 6 µL. The average retention times for phenol and 4-CP were approximately 5.69 min and 9.25 min, respectively. Two calibration plots were obtained and used to estimate the phenol and 4-CP concentrations that were expressed using the following regression equation: Phenol (mg L–1) = 3.1992 + 3.0 × 10⁻⁴ × (Area), R2 = 1.0000 and 4-CP (mg L−1) = −3.3099 + 8.0 × 10⁻⁴ × (Area), R2 = 0.9999. The cell concentration was monitored spectrophotometrically by measuring the absorbance at 600 nm. The relationship between cell concentration and OD600 was determined as follows: X(mg/L) = 318.4 (OD600). The pH was measured using a pH electrode and a pH meter (HANNA, model HI 9021, Smithfield, RI, USA).
3.5. Batch Experiments
Wang and Loh [17] carried out the batch tests with P. putida cells to investigate the kinetics of phenol degradation at 30 °C at various initial phenol concentrations (25–800 mg/L). In the present study. P. putida cells were obtained from stock inoculums. The suspended active cells were centrifuged at 4000 rpm for 10 min and re-suspended in phosphate buffer and then centrifuged [28]. The cells were collected and transferred into batch reactors. Batch tests of free cells were performed in 250 mL Erlenmeyer flasks containing 200 mL mineral salt medium supplemented with different initial nominal concentrations of phenol (40–500 mg/L), and phenol (50–350 mg/L) plus 4-CP (5–60 mg/L), respectively. Resting cell experiments for 4-CP transformation with various initial nominal 4-CP concentrations (10–80 mg/L) in batch tests were performed as described by Hao et al. [29]. The batch tests were carried out at 30 °C on a rotary shaker at 120 rpm for the desired incubation periods. Samples were withdrawn at the indicated times for phenol, 4-CP and cell density analysis. Control experiments were also undertaken to evaluate abiotic degradation in a sterile medium.
3.6. Continuous-Flow Biofilm Bioreactor
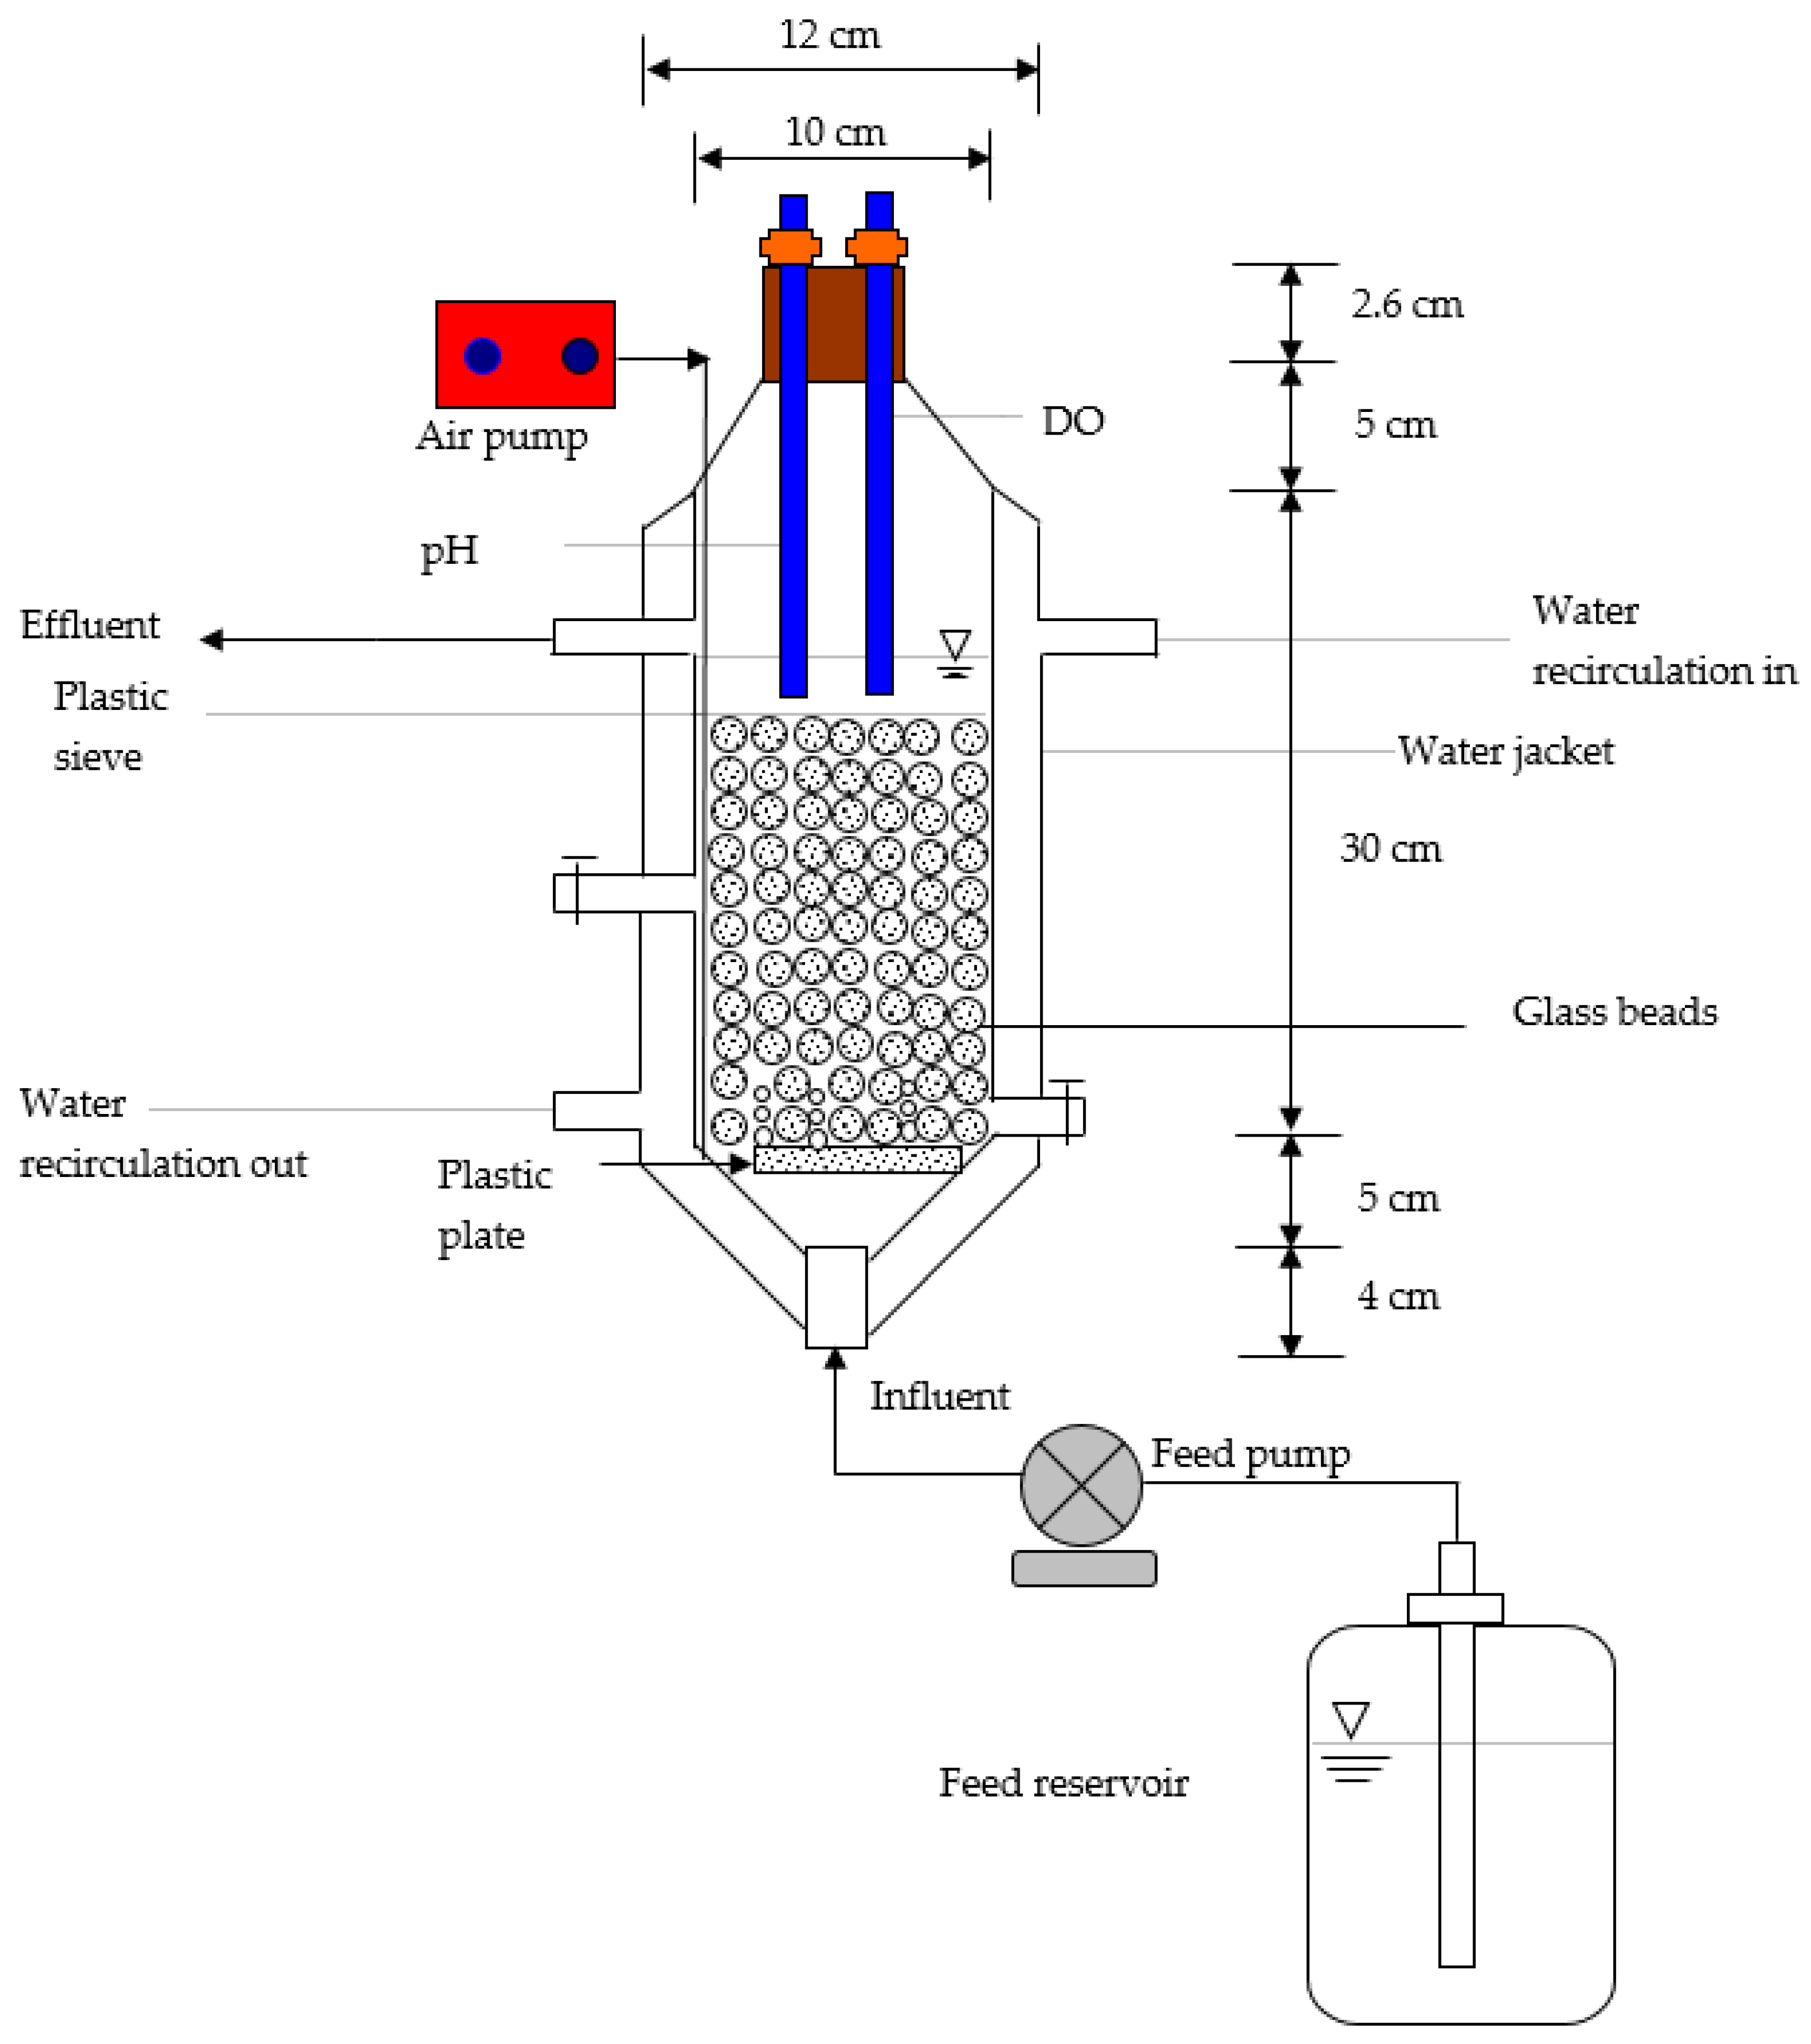
A schematic laboratory-scale completely mixed and continuous-flow bioreactor is shown in Figure 2. The system was a cylinder made of glass with an acrylic stand. The dimensions of this reactor were 10 cm internal diameter and 46.6 cm height with a liquid level of 30 cm, providing a total volume of 2.4 L. A working volume of 1.568 L yielded a hydraulic residence time of 6 h in the present study. Approximately 44% of the working volume (i.e., 690 cm3) was filled with glass beads with a diameter of 3 mm. The required air for the system was supplied by an aerated plate and one air aquarium compressor with an output air capacity of 30 L/min to maintain the dissolved oxygen at 2.3 ± 0.2 mg/L The reactor was maintained at 30 ± 0.1 °C through a water jacket using a circulating water bath (Yih Der Inc., Taipei, Taiwan). The influent was provided at the bottom of the reactor using a digital peristaltic pump (Model HT100IJ, Longer Pump) with an influent flow rate of 6.272 × 10³ mL/d. The influent feed was synthetic wastewater containing phenol plus 4-CP as dual substrate for biodegradation [2]. The pH was buffered at 7.1 ± 0.2 by HPO42−/H2PO4− in the feed solution. Control tests were also undertaken using glass beads without cells to evaluate whether the glass beads contributed to removing phenol plus 4-CP in the continuous-flow biofilm reactor.
4. Results and Discussion
4.1. Phenol Biodegradation and Cell Growth
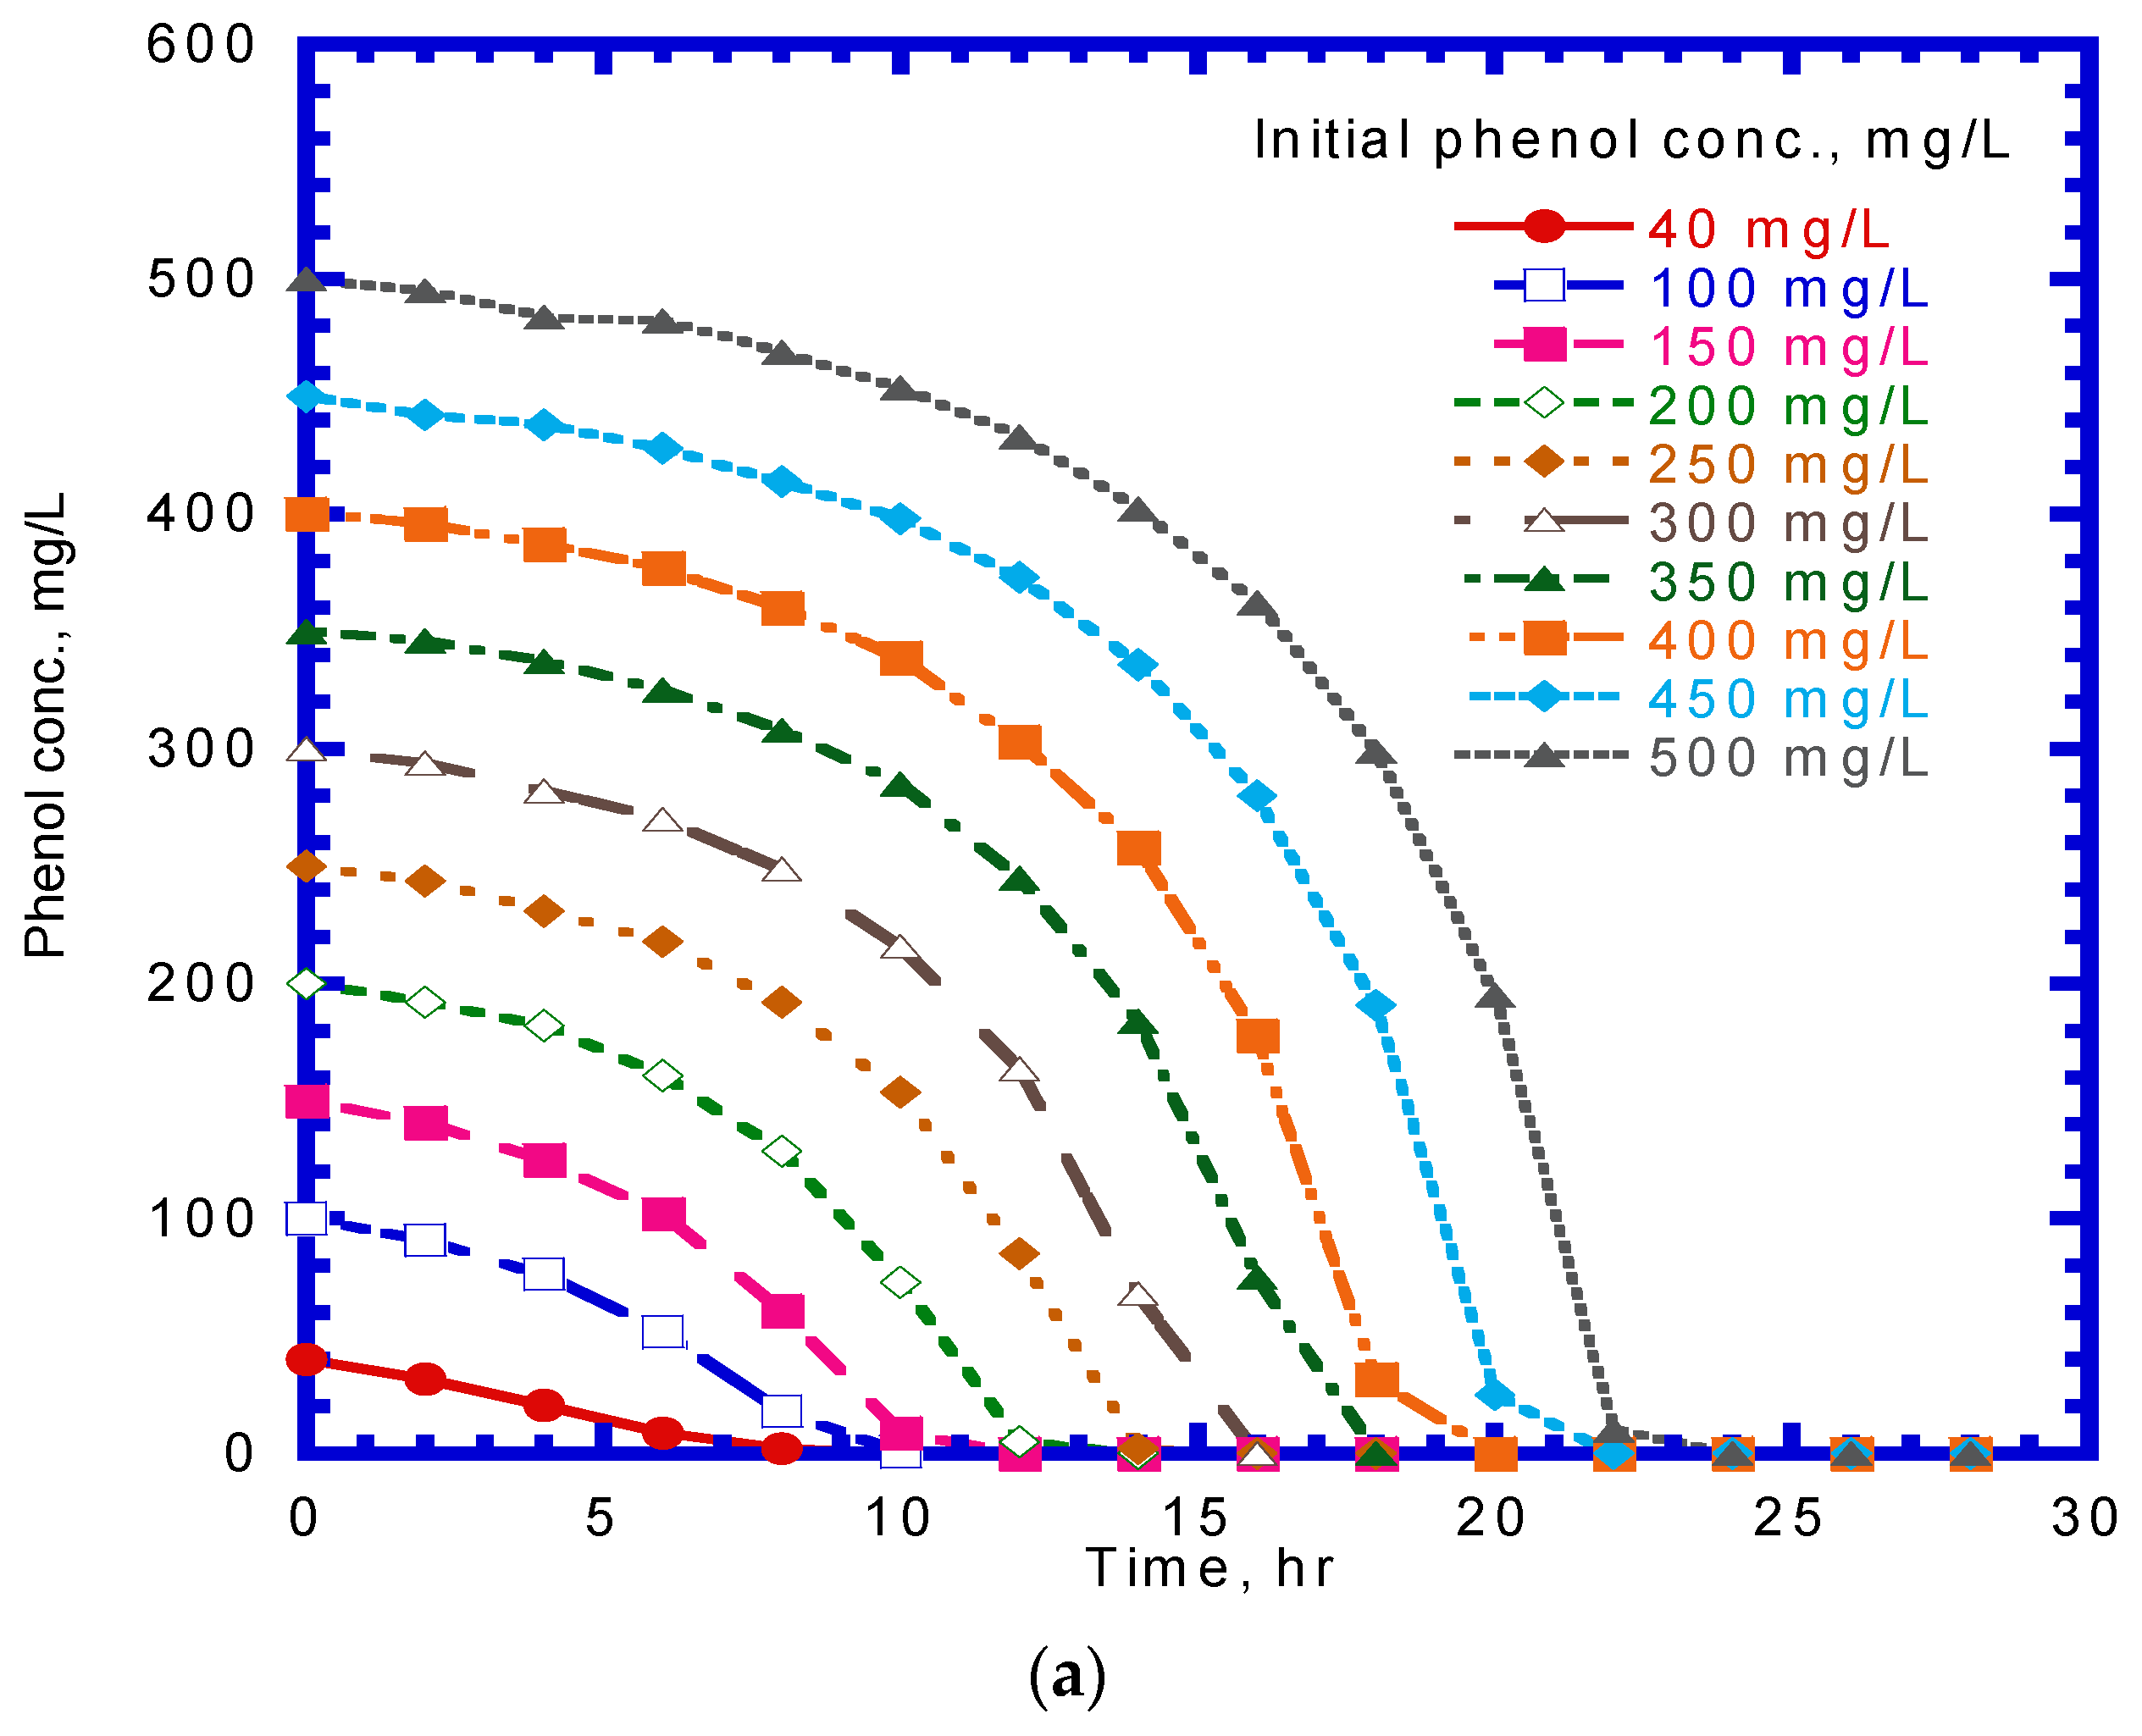
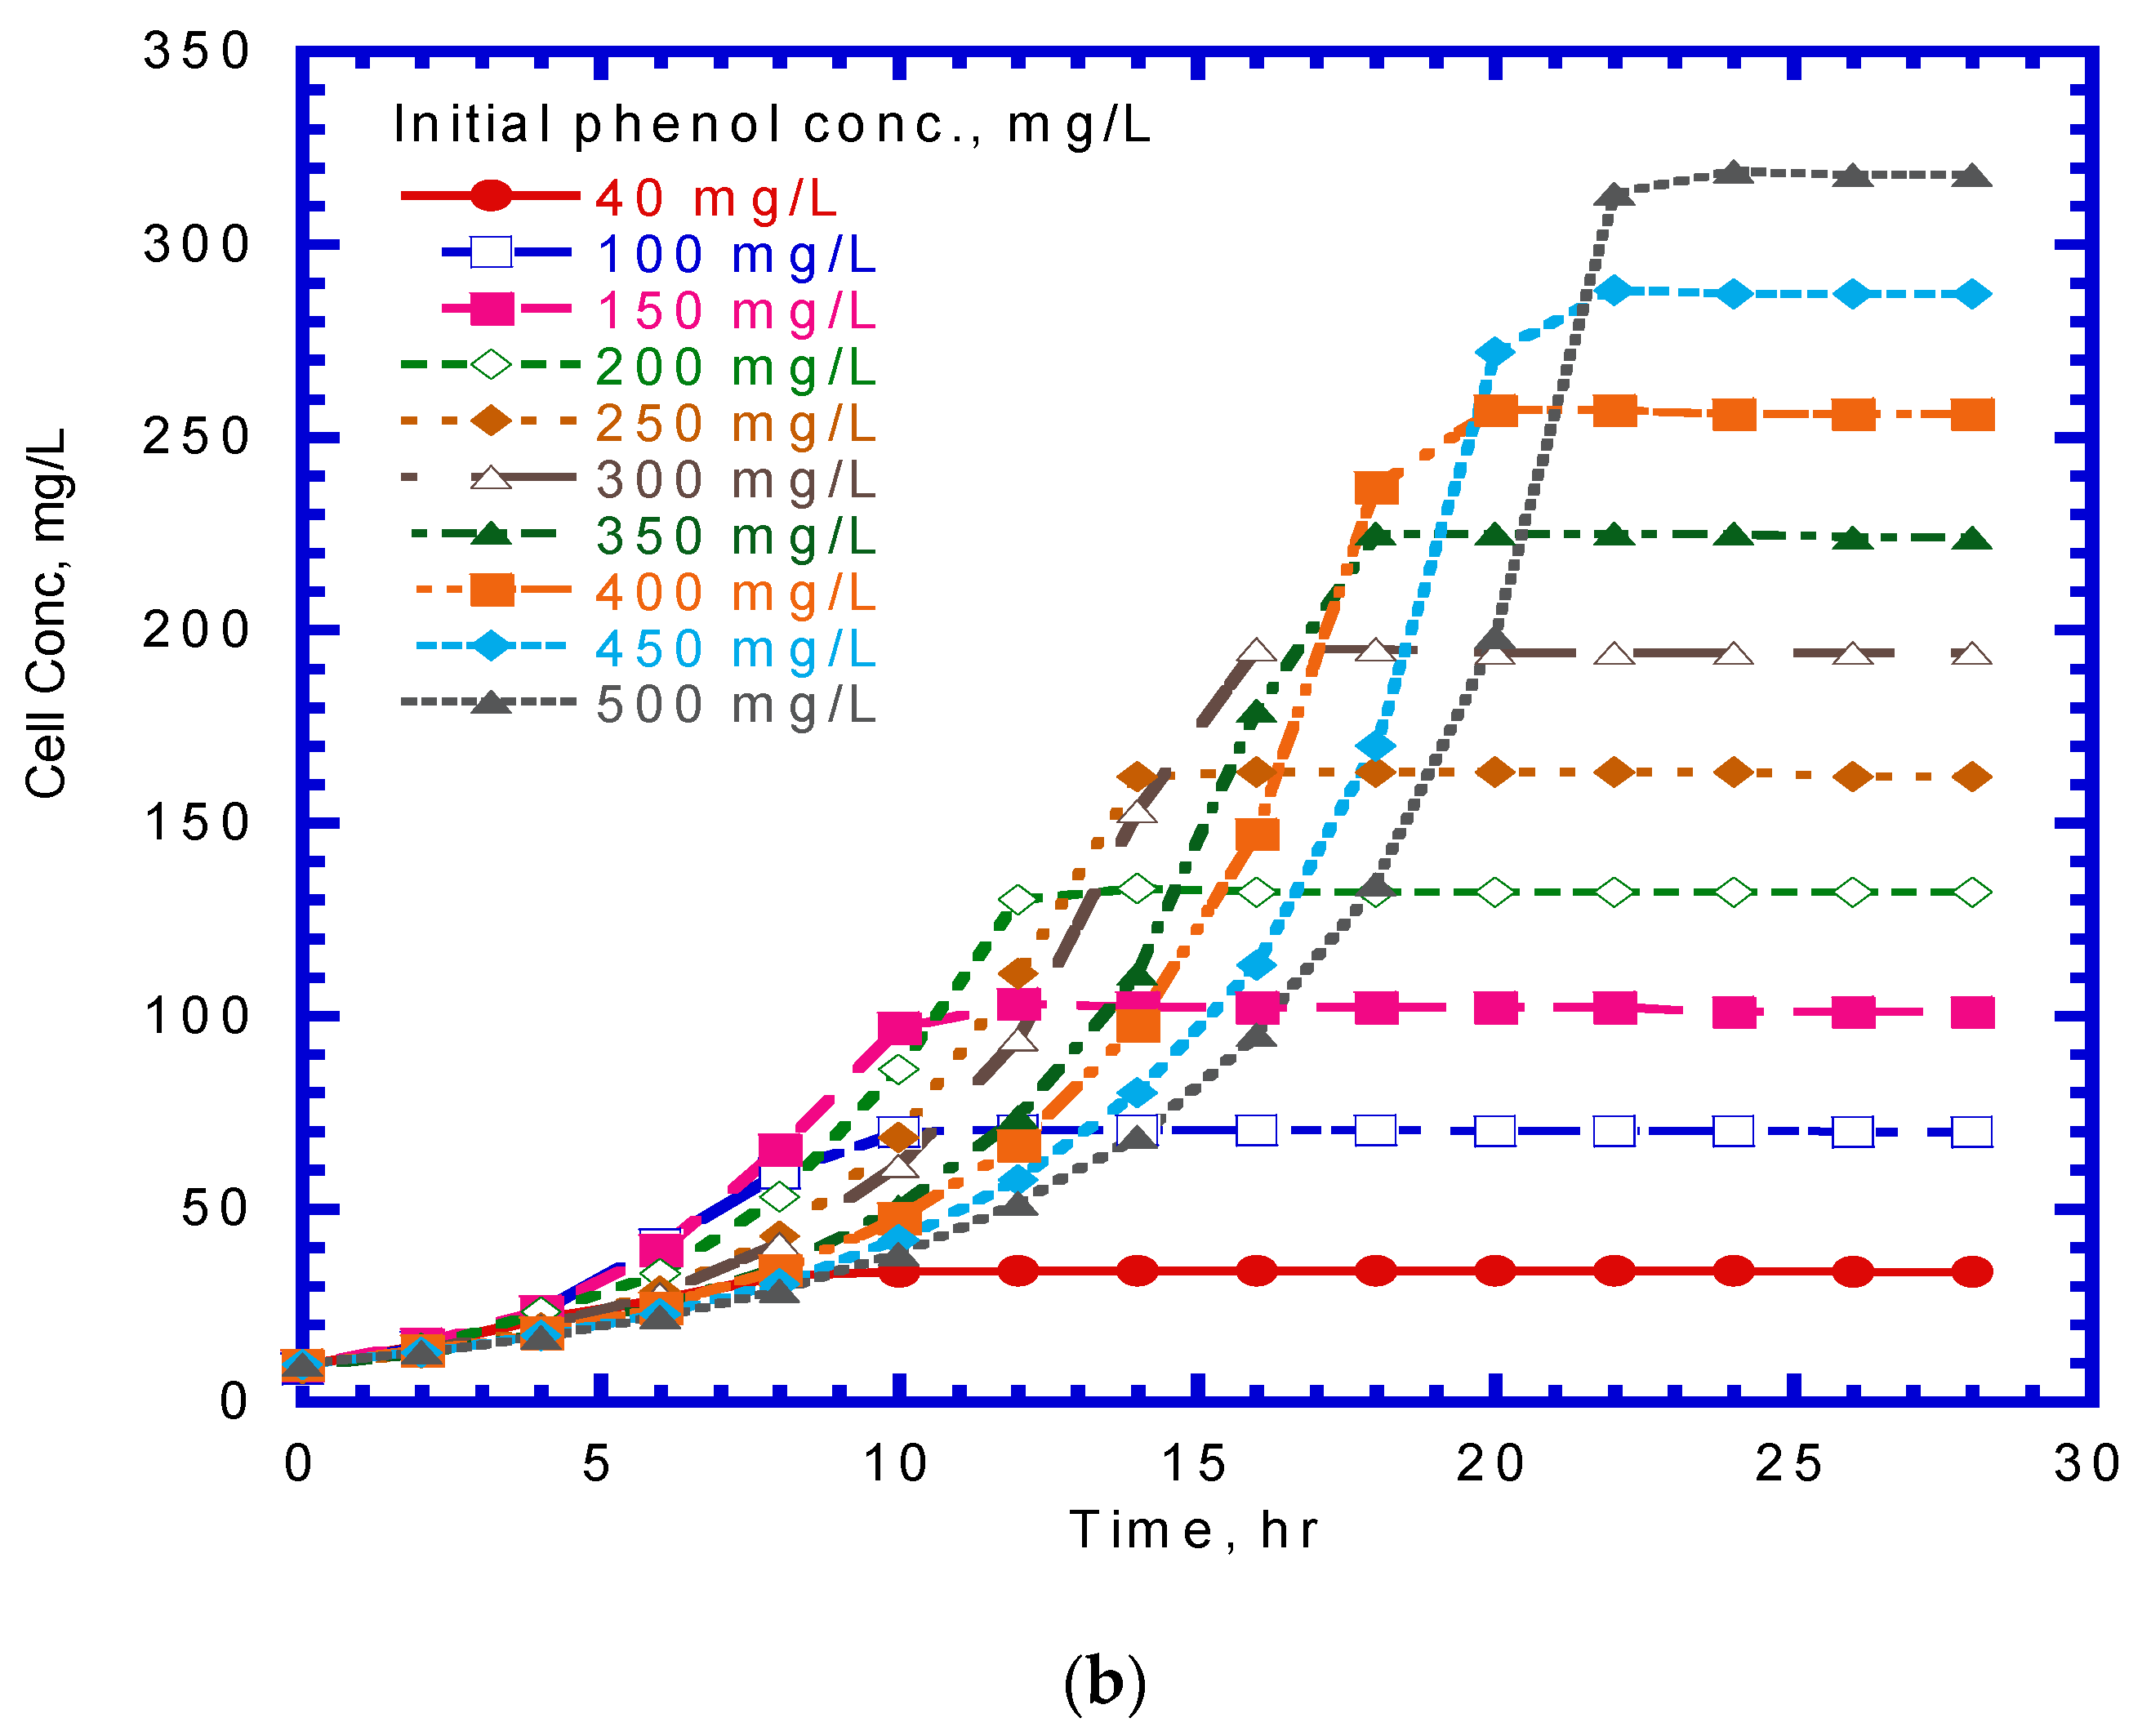
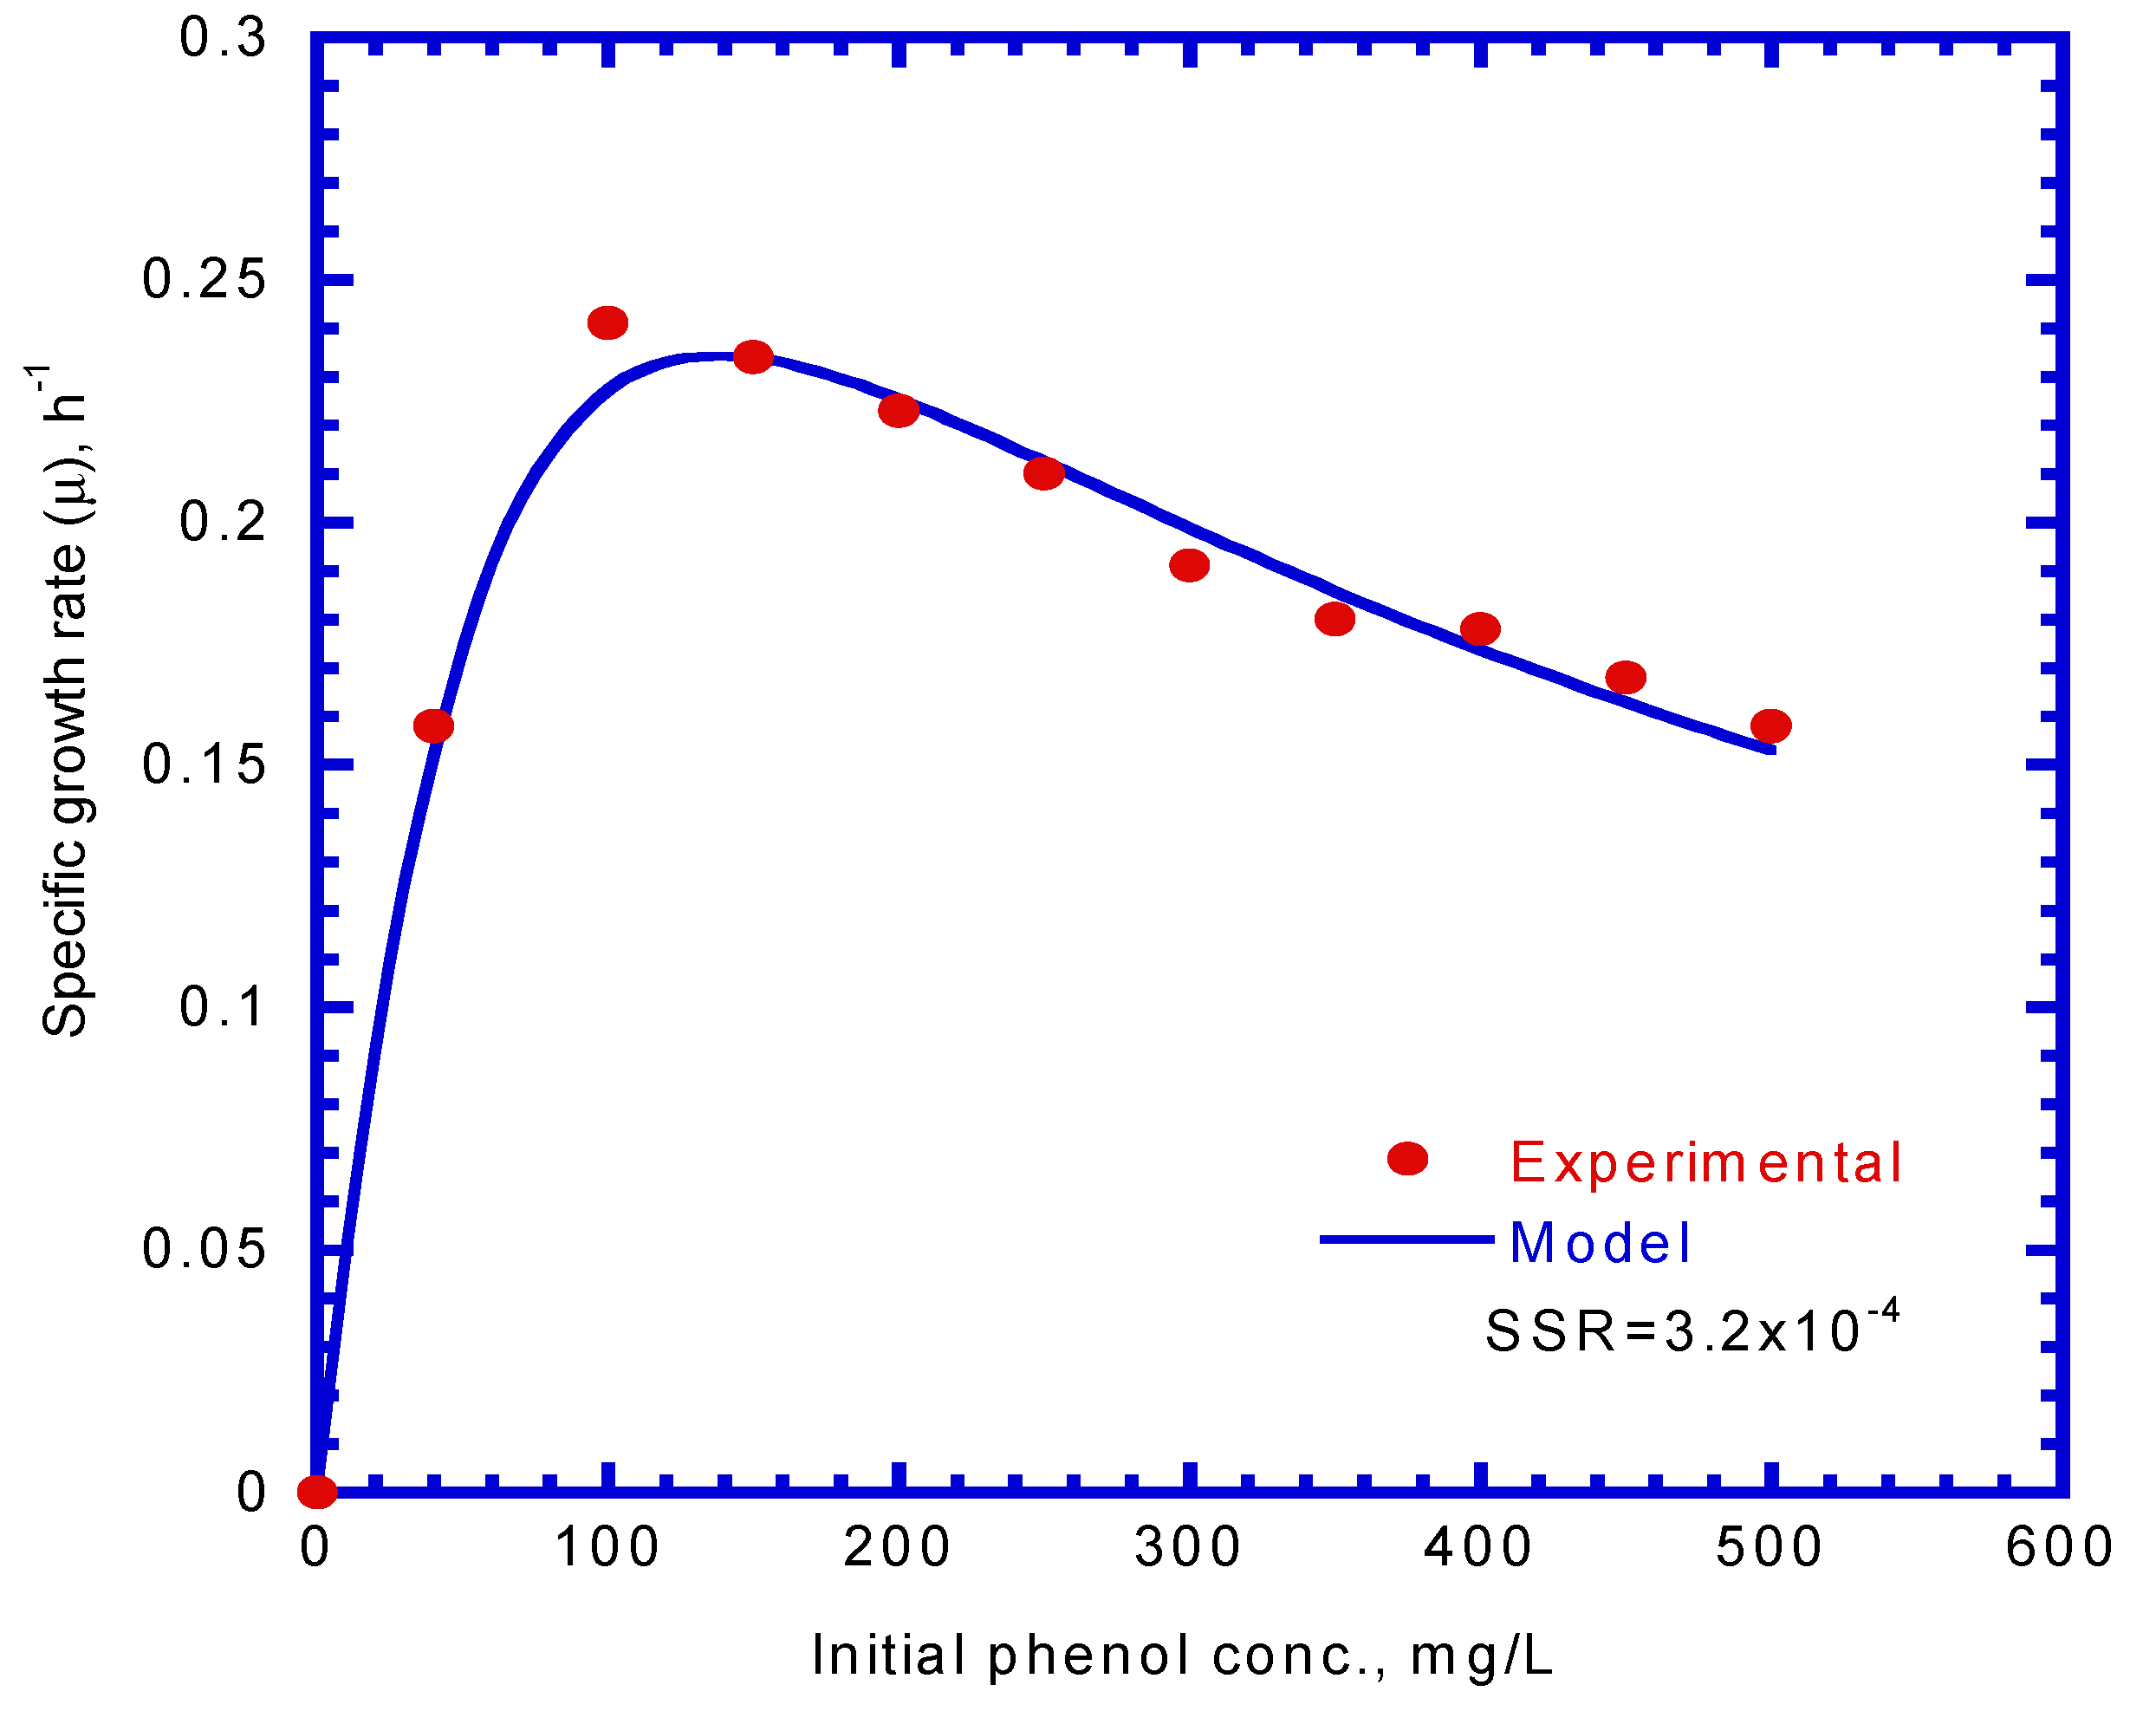
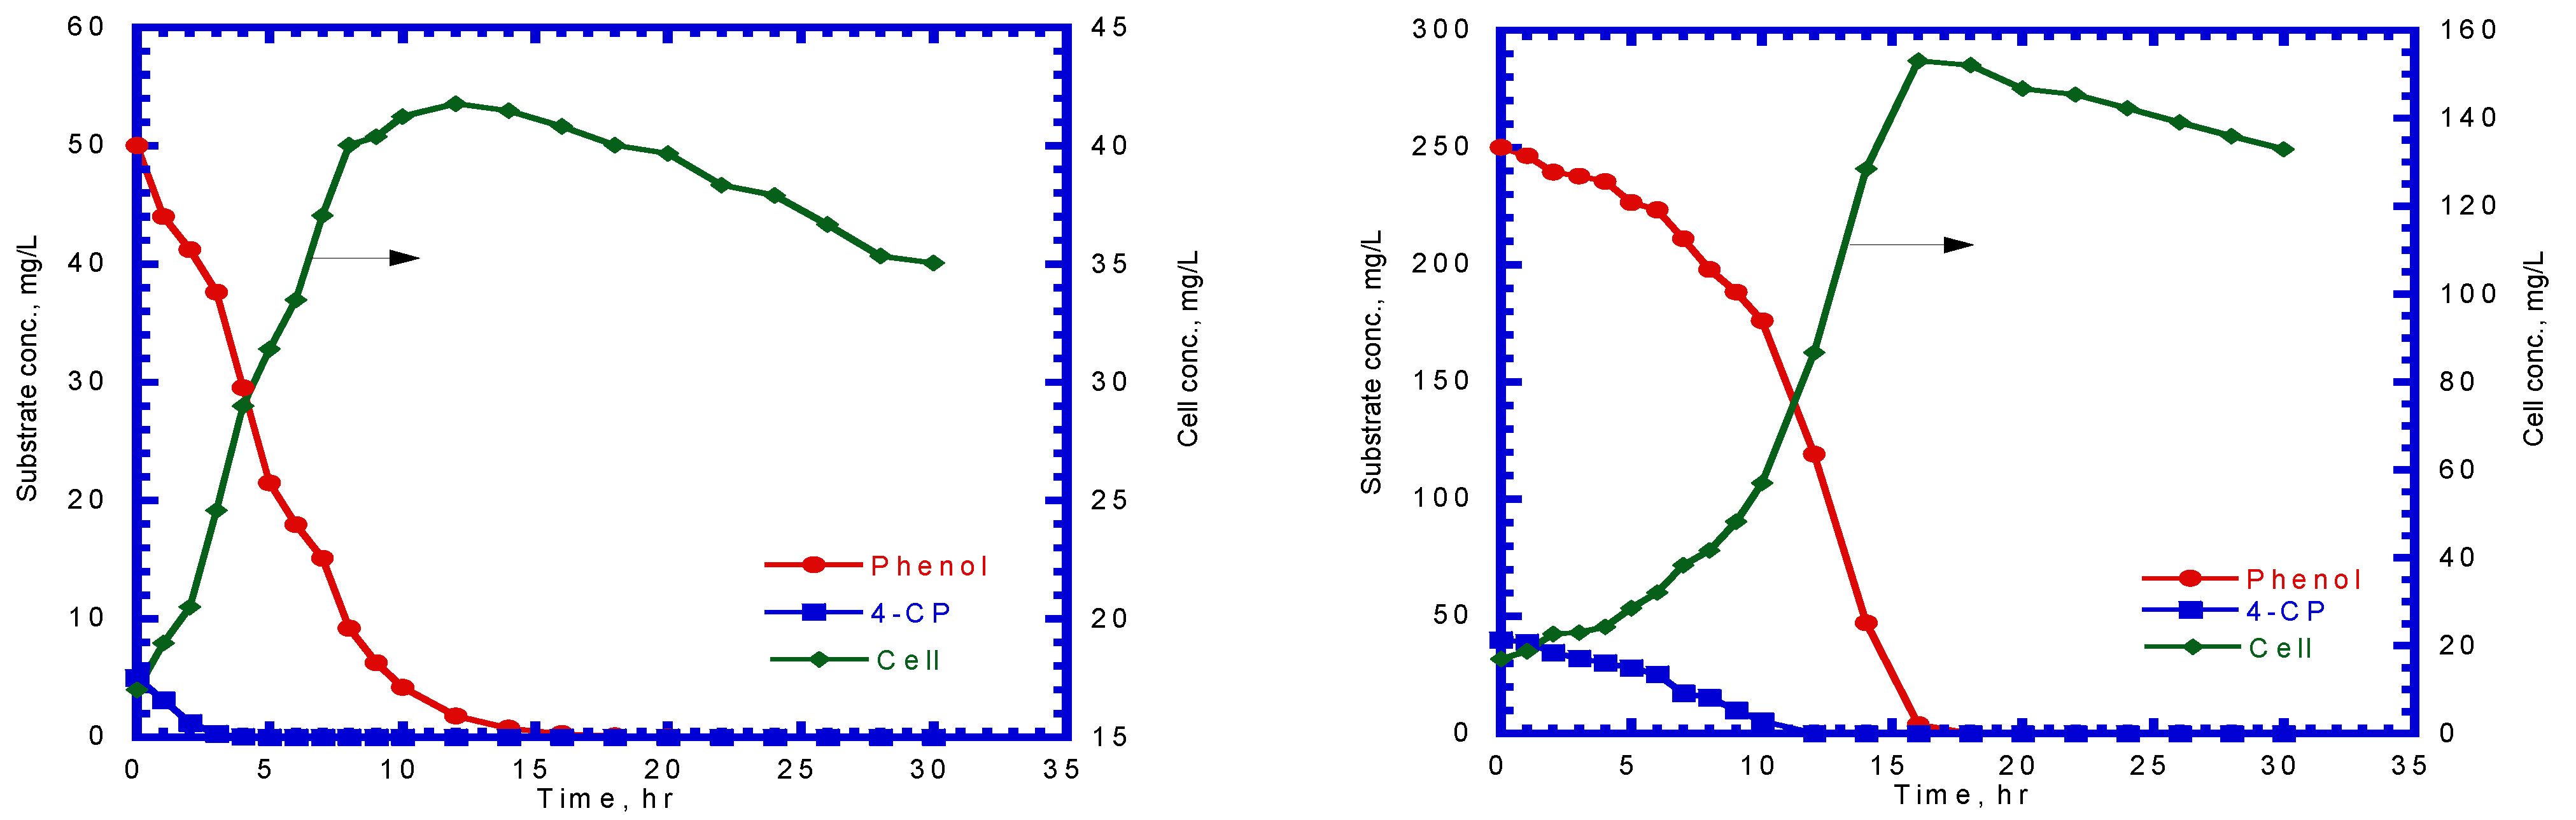
A series of batch tests were employed to observe phenol biodegradation and cell growth under varying initial nominal phenol concentrations of 40–500 mg/L. Figure 3a,b show the time course of phenol and cell concentration. The experimental results indicate that the time required for the complete biodegradation of phenol extended from 9 to 22 h at various initial phenol concentrations. The time for the lag stage of cell growth under different initial phenol concentrations was almost the same. The time required to reach a steady-state cell growth ranged from 10 to 21 h, whereas the cell concentration in the stationary phase was in the range of 34–313 mg/L. The time course of cell growth was monitored to determine the specific growth rate for each batch culture of P. putida cells containing initial nominal phenol concentrations ranging from 40 to 500 mg/L. The specific growth rate was evaluated by determining the slope of the natural logarithmic plot of the cell concentration versus time in the log-growth stage. The variation in the specific growth rate over cultivation time was fitted using the Haldane model to estimate the kinetic parameters of P. putida cells on phenol (Figure 4). The Haldane model agreed well with the experimental data. A non-linear least-squares regression analysis was employed to obtain a sum of squared residuals (SSR) of 3.2 × 10⁻⁴. Kinetic parameters for P. putida cells on phenol were determined as = 0.512 h–1, = 78.4 mg/L, and = 228.5 mg/L:
4.2. 4-CP Transformation by Resting Cells
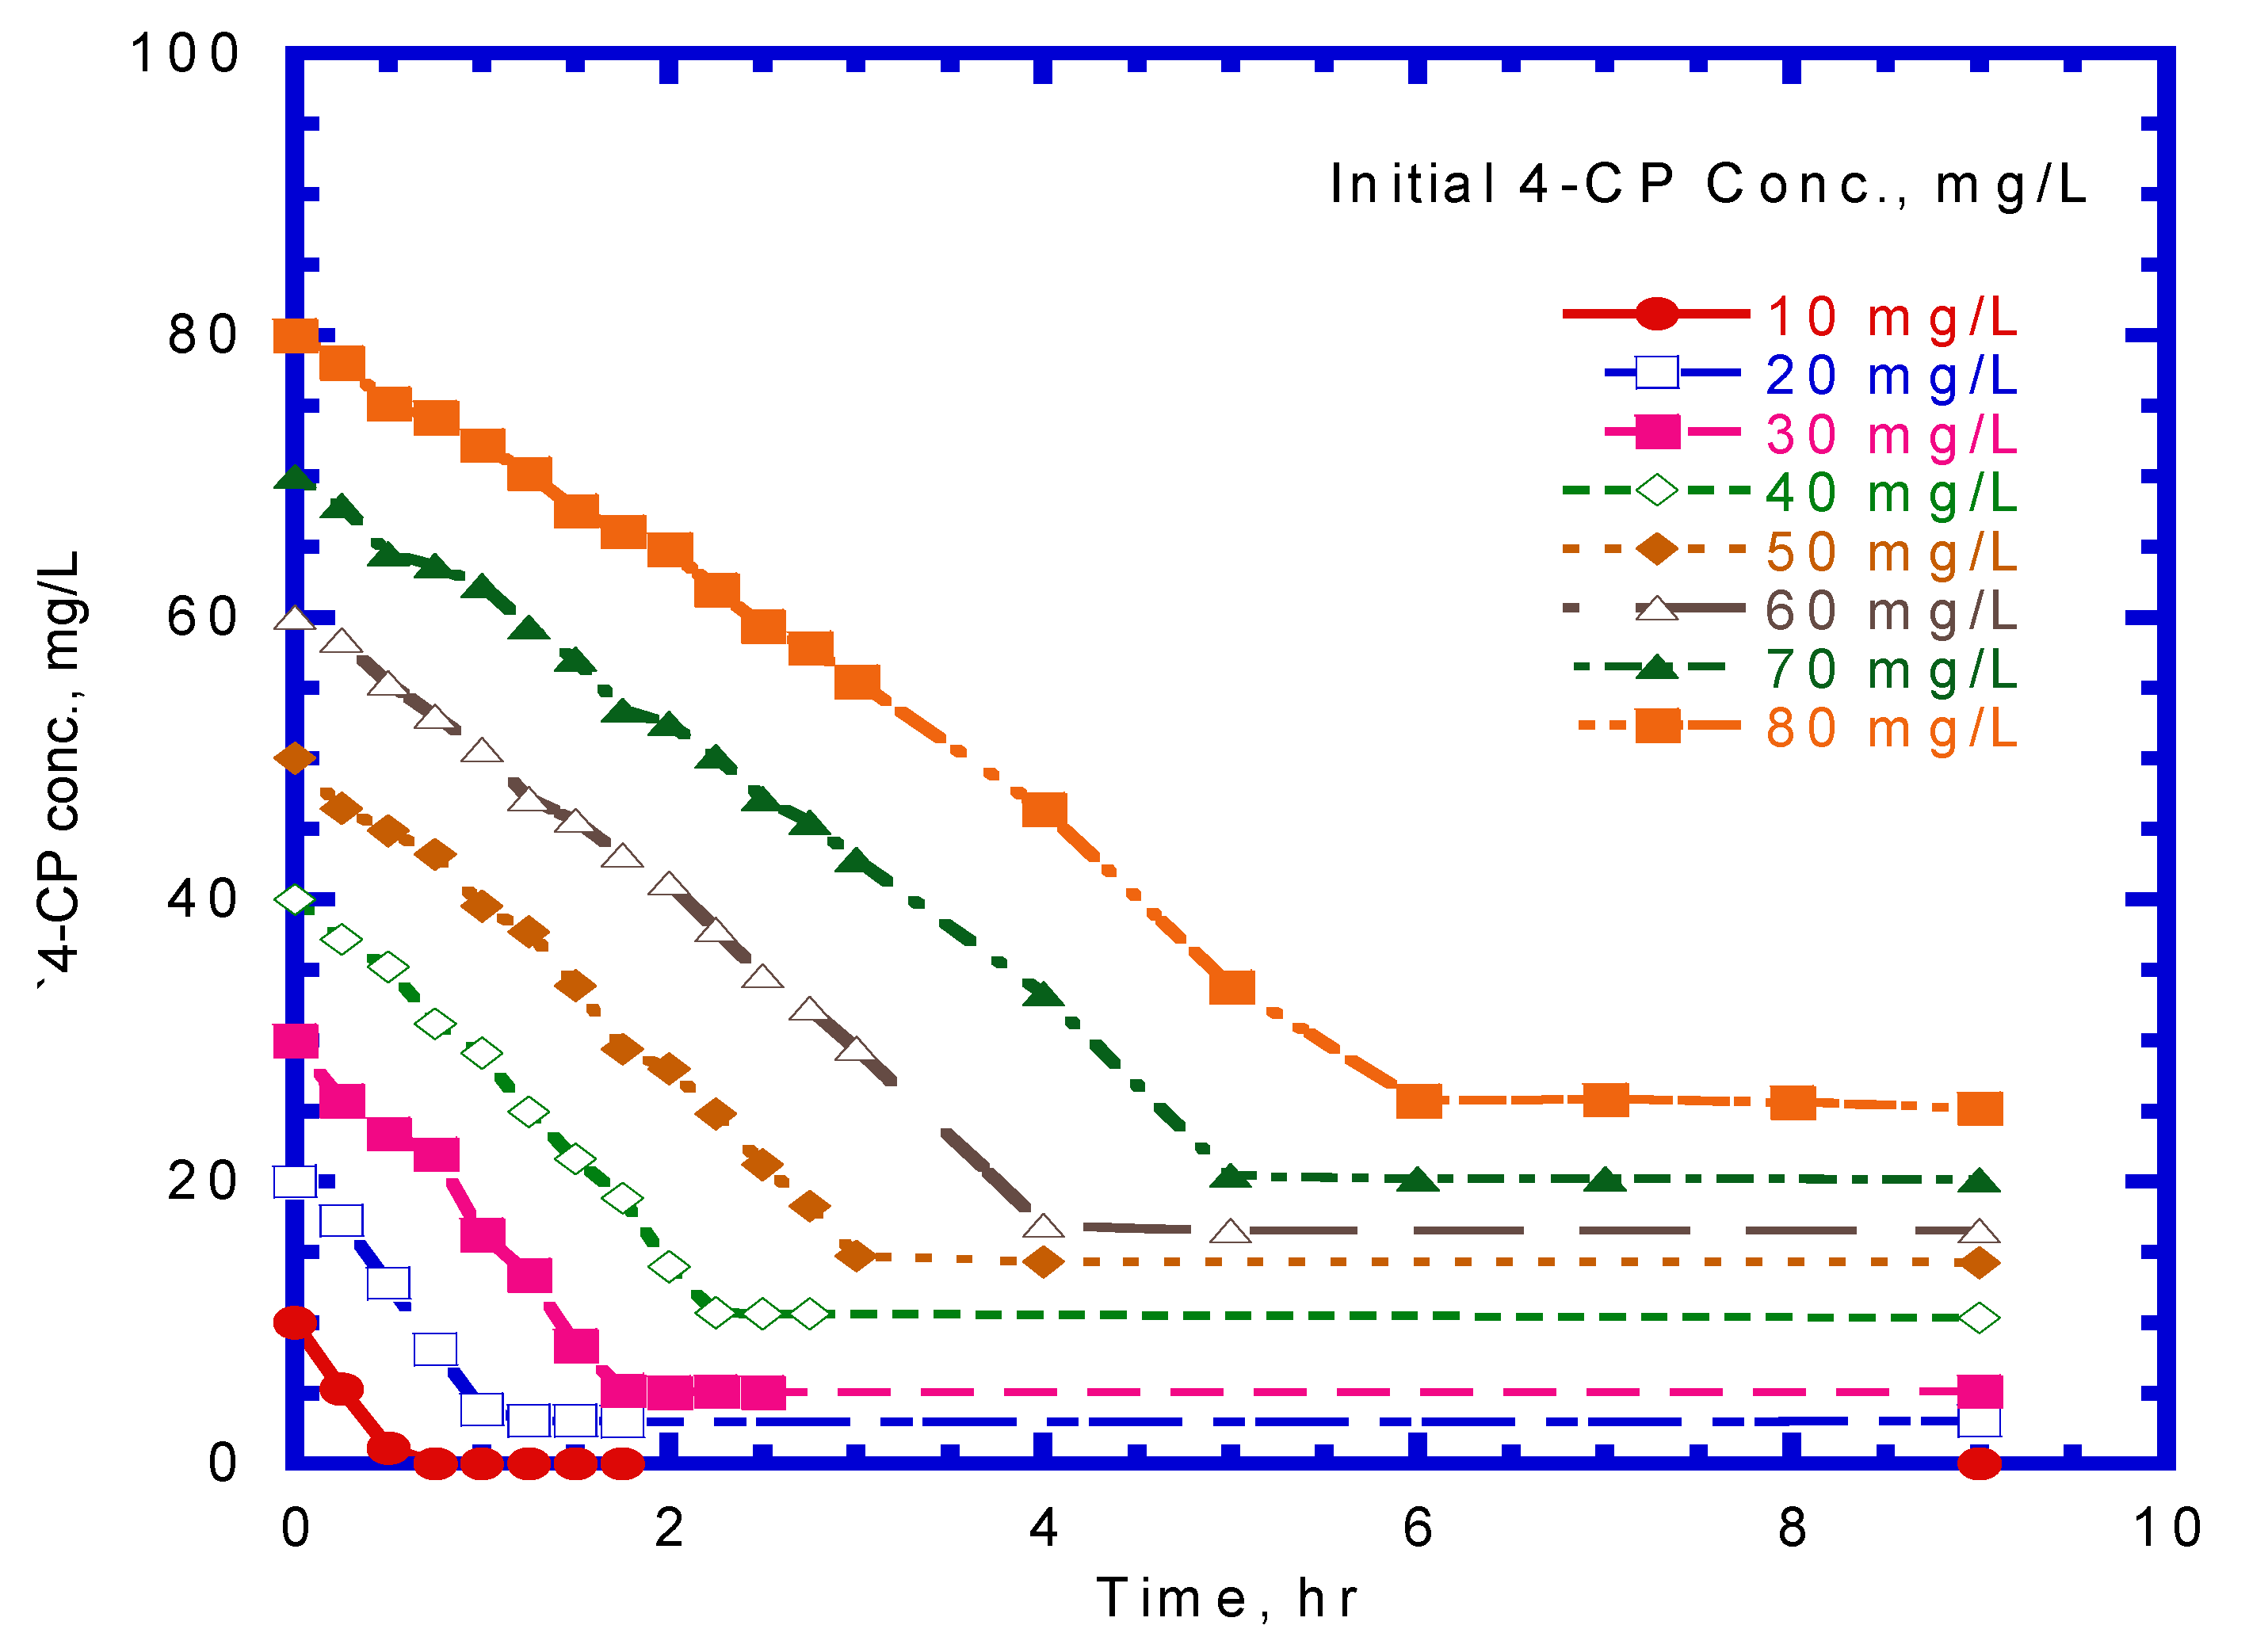
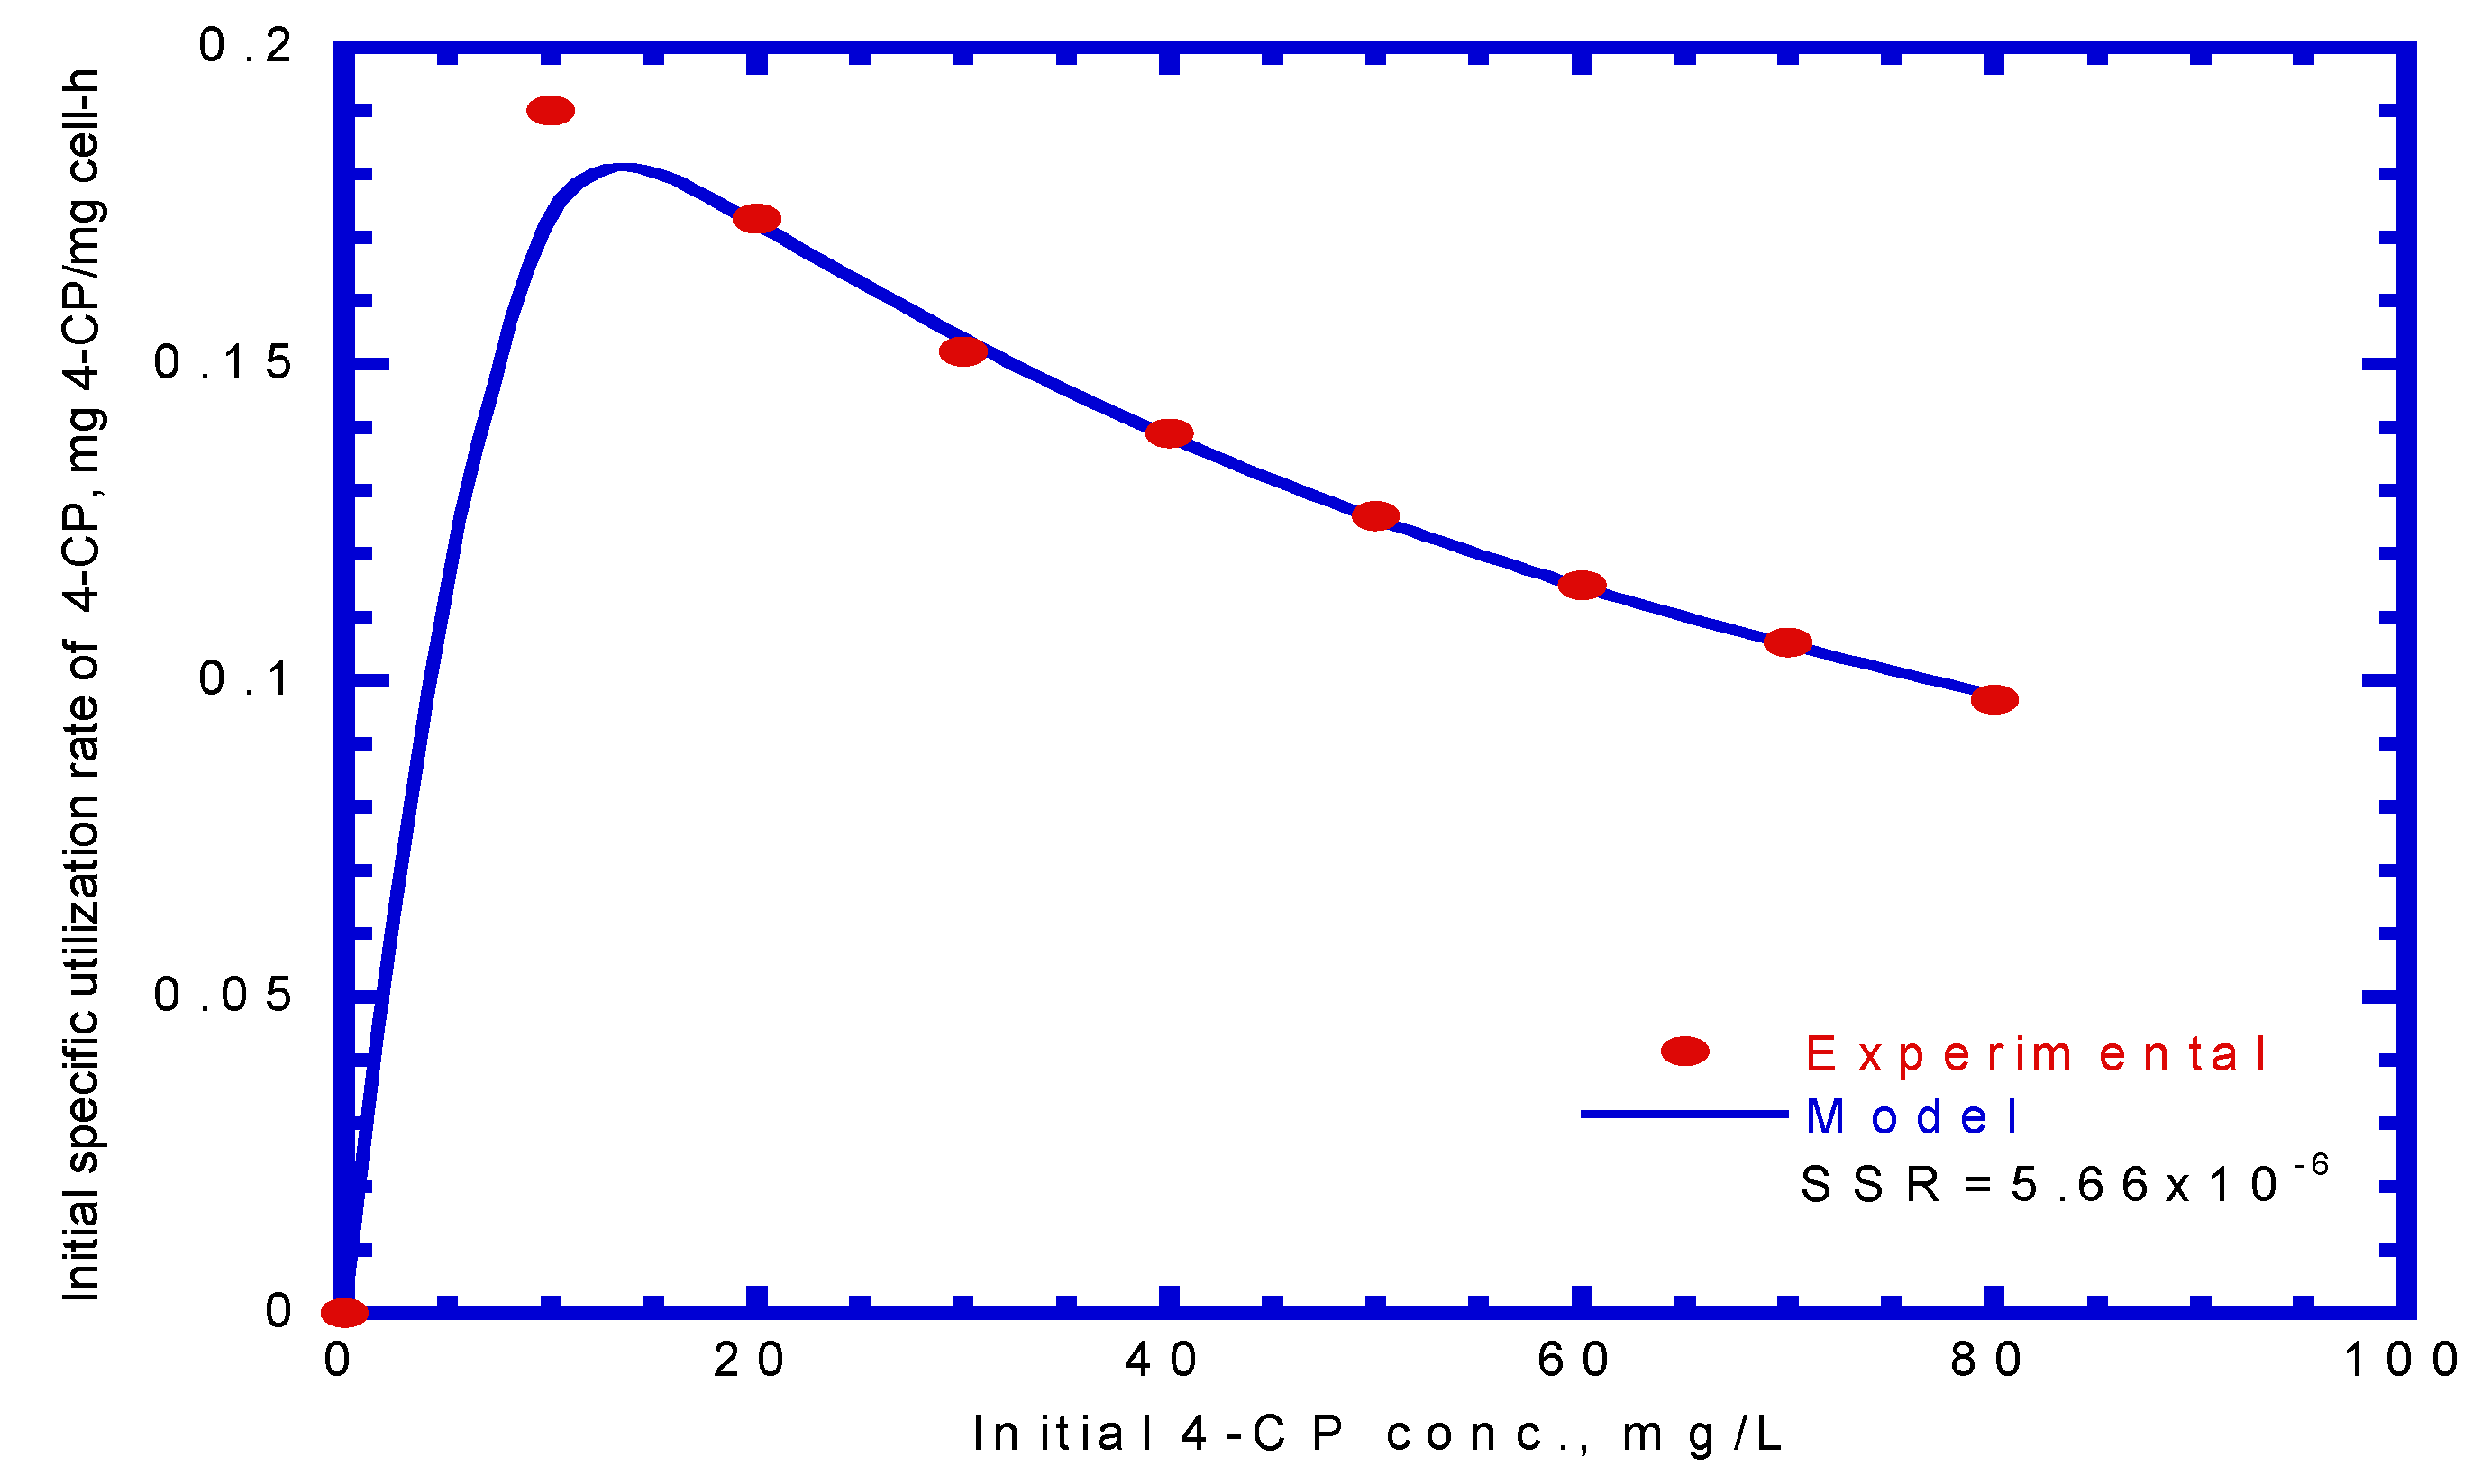
Several batch kinetic tests were performed to monitor the cometabolic transformation of 4-CP by pre-culturing phenol-induced cells. Figure 5 shows the effect of the initial 4-CP concentration on 4-CP transformation against culture time. The P. putida resting culture showed a finite capacity for 4-CP transformation as the culture time increased from 1 to 6 h at an initial 4-CP concentration of 20–80 mg/L. Hao et al. [29] conducted the batch experiments to evaluate the transformation of 4-CP by resting, phenol-induced Acinetobacter cultures with various initial 4-CP concentrations of 10–75 mg/L. A similar result was reported by Hao et al. [29], who found that the resting cell culture of Acinetobacter retained a residual amount of 4-CP after a culture time of 15 h. Rostkowski et al. [31] found that the resting cells had a finite transformation capacity due to a lack of reducing power. The experimental data indicated that 4-CP degradation decreased rapidly at the onset of batch tests. The higher initial nominal amount of 4-CP resulted in a higher residual amount of 4-CP. The residual 4-CP concentration was in the range of 3.03–25.2 mg/L as the initial 4-CP concentration ranging from 20 to 80 mg/L. The values of the maximum specific utilization rate of 4-CP (), half-saturation constant of 4-CP (), and inhibition constant of 4-CP () in the cometabolism kinetic model were determined by evaluating the specific transformation rate of 4-CP () under various initial nominal 4-CP concentrations (Figure 6). The kinetic constants obtained for 4-CP utilization by resting cells were = 0.246 h–1, = 1.048 mg/L, and = 53.40 mg/L. Thus, the kinetic equation for the specific utilization rate of 4-CP can be written as
The value obtained in the present study was much higher than that obtained from other studies ranging from 0.02 to 0.229 h−1 with pure or mixed cultures [16,29,32]. The value obtained in the present study was higher than that outlined in the previous literature [16,29]. Therefore, the cells used in this study had a lower affinity for 4-CP than those used in previous studies. In contrast, the value obtained in this study was within the range reported in the literature [16,29].
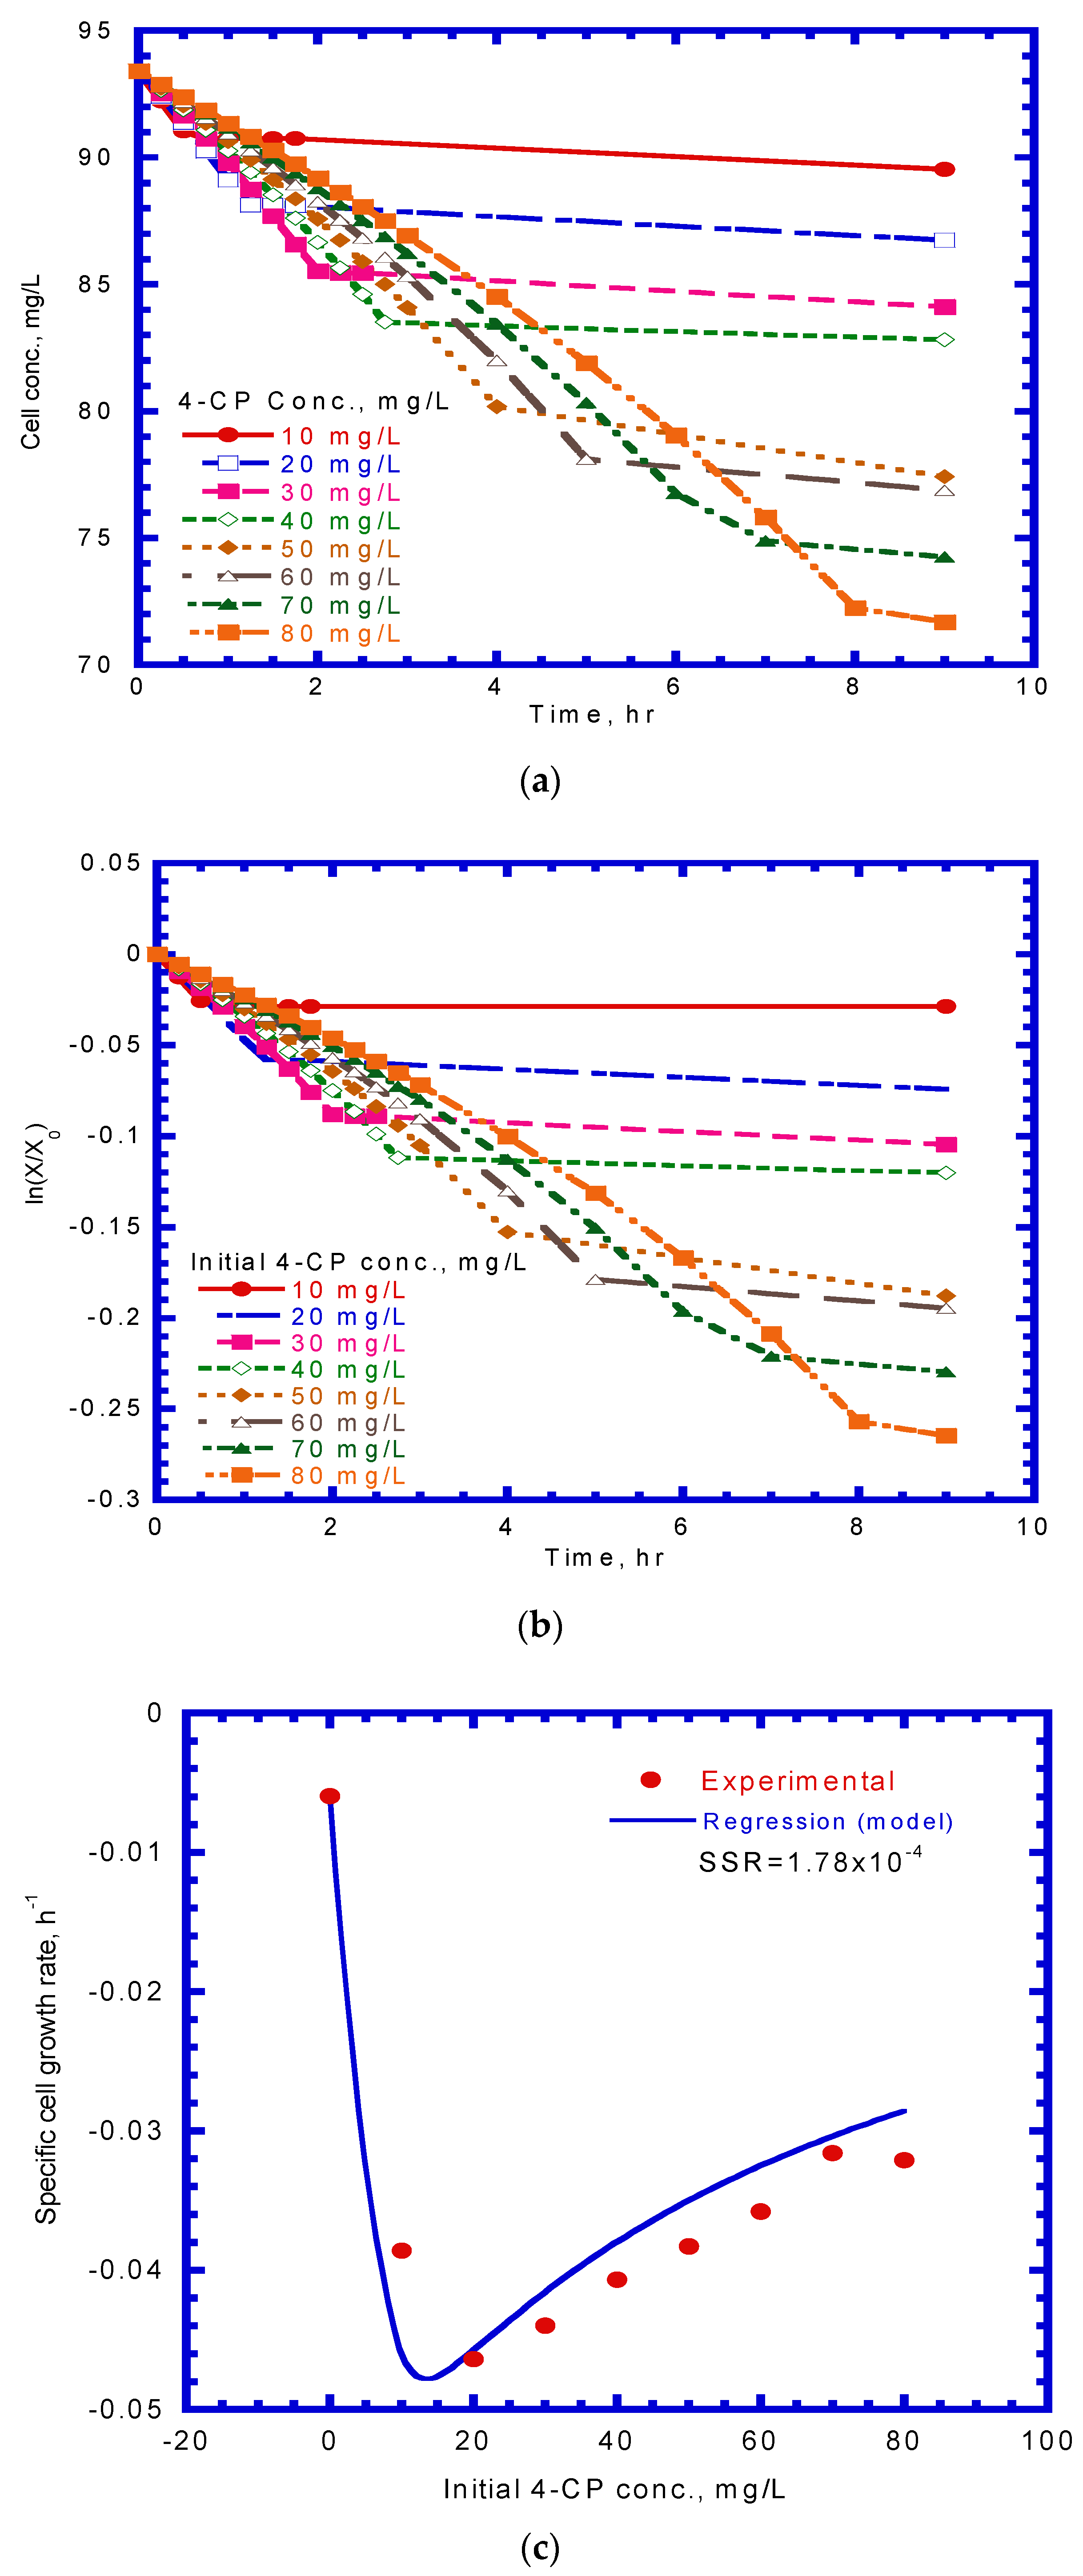
To evaluate the values of the true transformation capacity () and first-order endogenous decay coefficient (), the time-course variation of cell concentration at various initial nominal 4-CP concentrations is illustrated in Figure 7a. The experimental results are consistent with those reported by Miri et al. [19] who used toluene, benzene and ethylbenzene-assimilating resting cells to undertake with the cometabolic transformation of p-xylene. The negative values of the specific growth rate were determined by plotting ln (X/X0) against time (Figure 7b). Equation (5) was then used to fit the experimental profile of the change in the specific growth rate to determine the and values using the non-linear least square method by minimizing the SSR value (Figure 7c). The and values were 4.34 mg 4-CP/mg cell and 5.99 × 10⁻³ h–1, respectively, with an SSR value of 1.78 × 10⁻⁴. The specific growth rate of resting cells can be expressed as:
4.3. Phenol Degradation and 4-CP Transformation in Batch Experiments
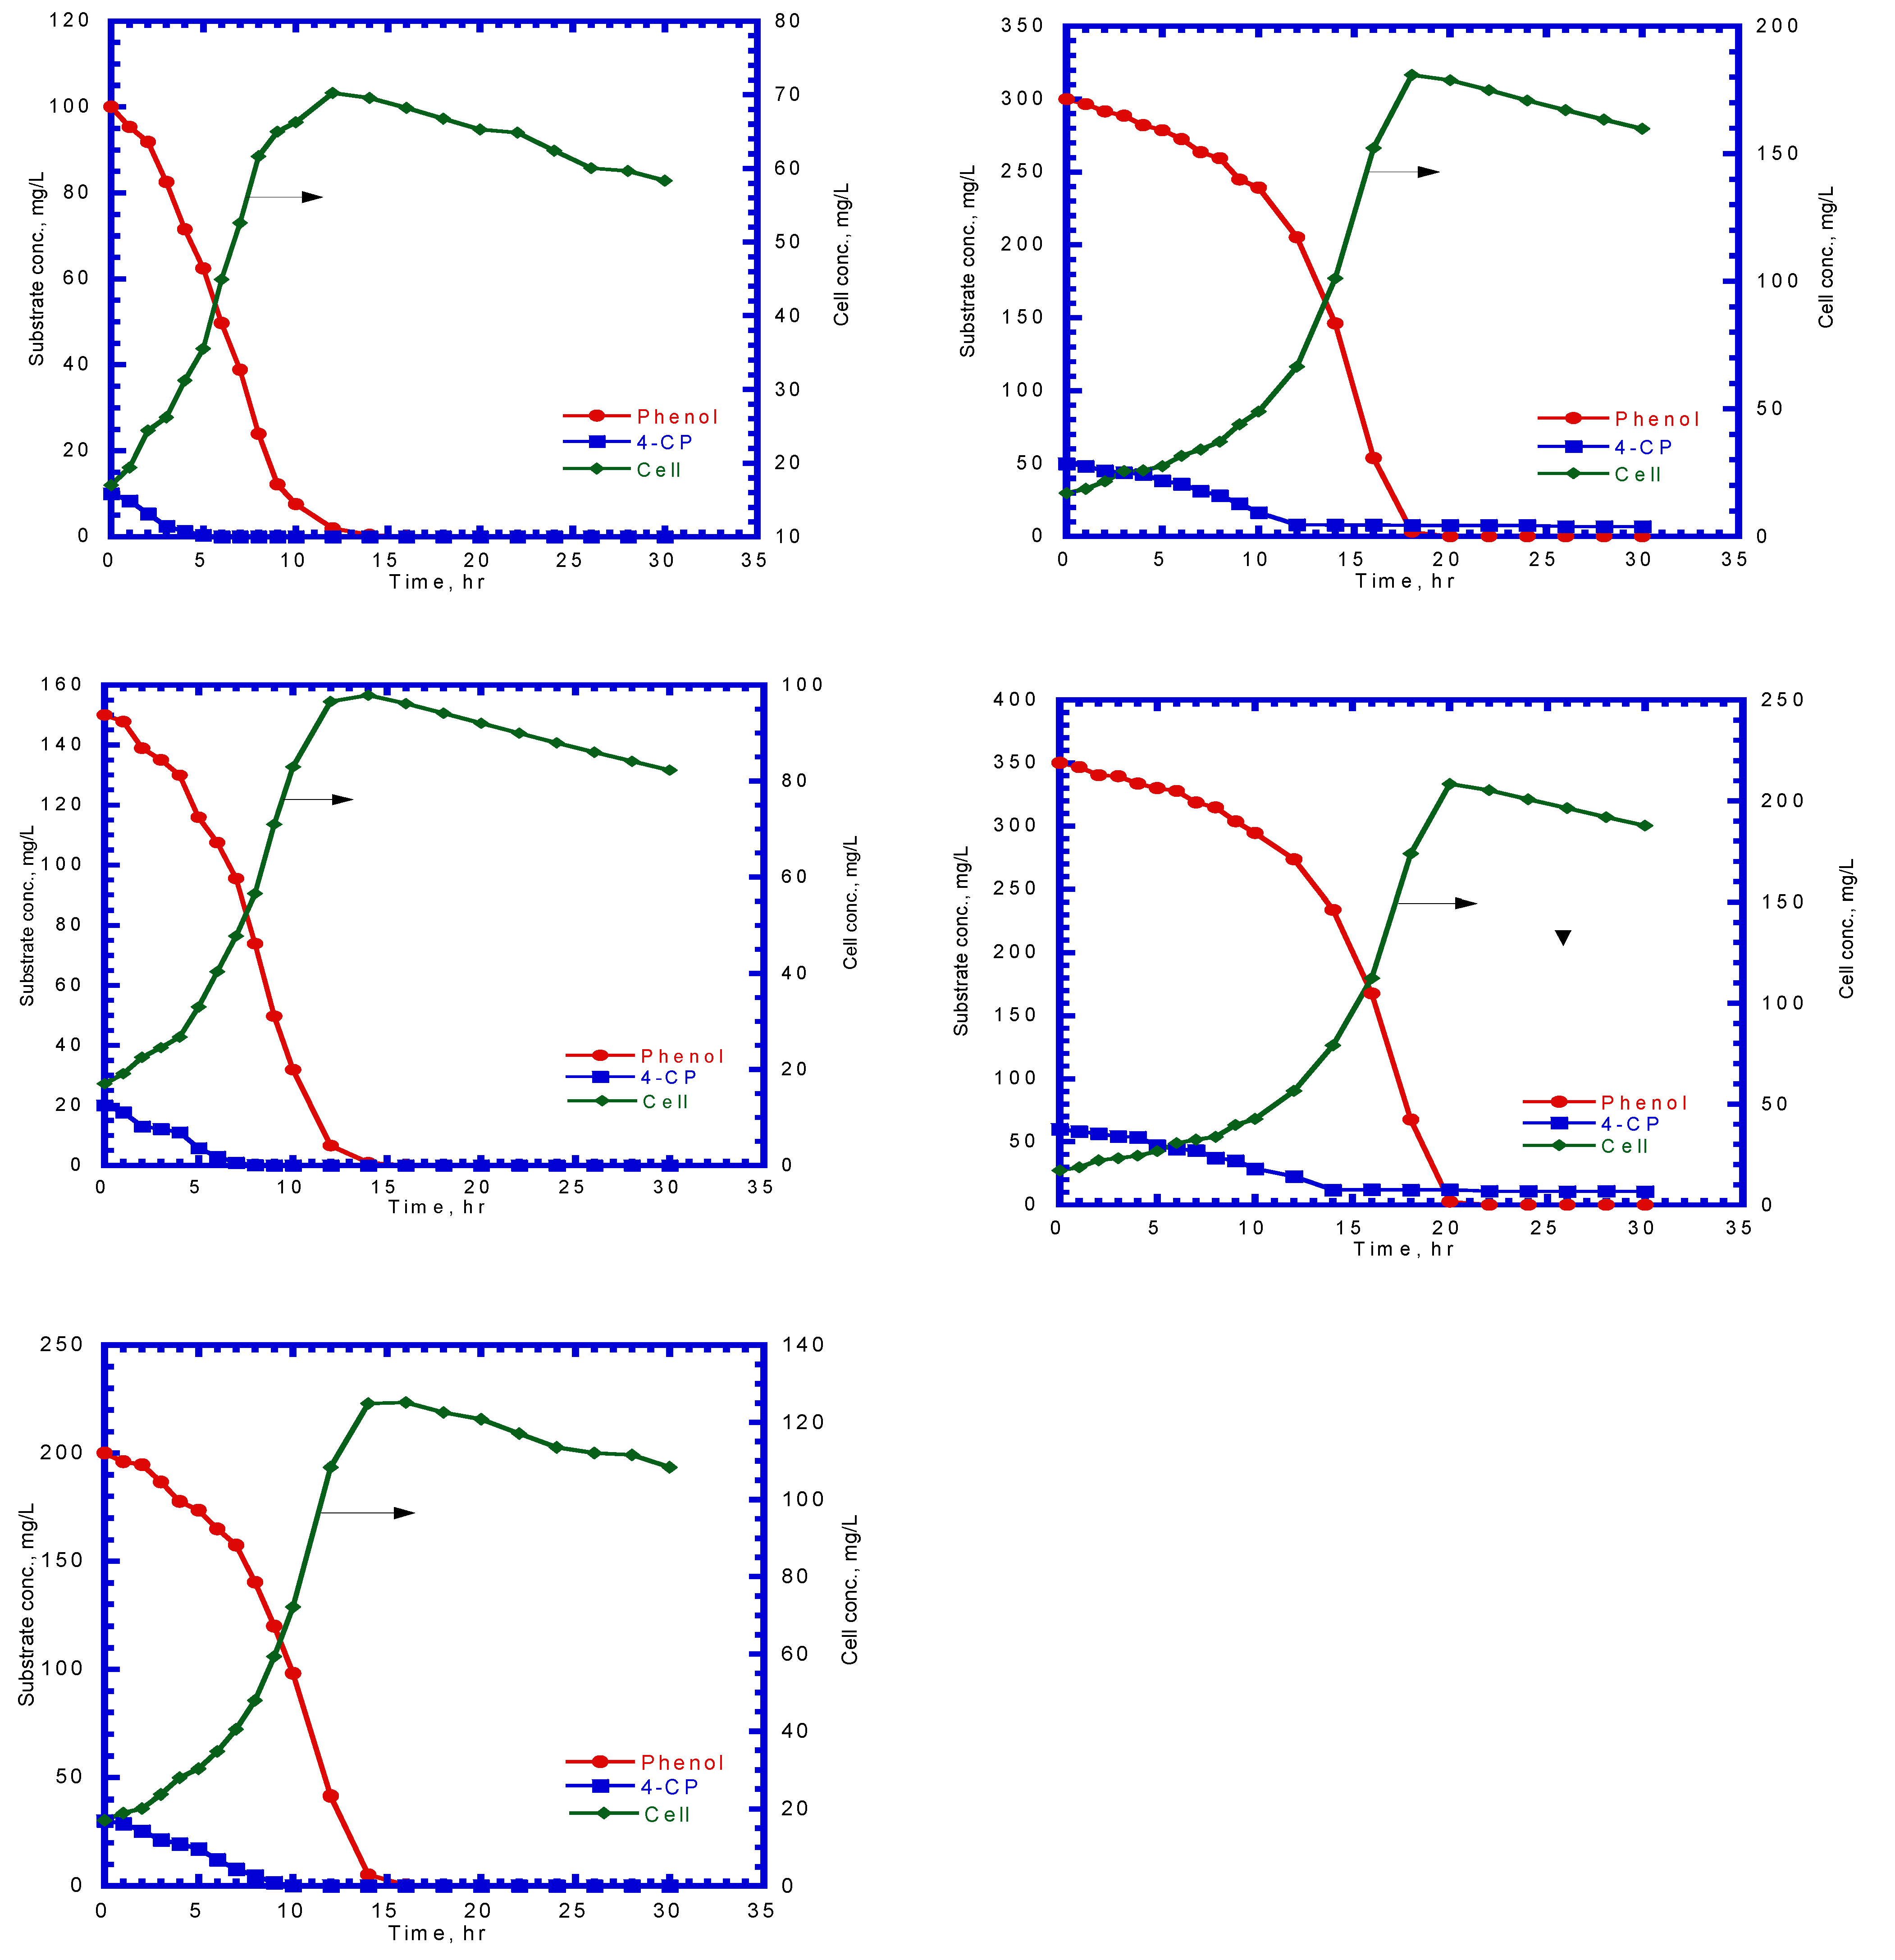
After determining the kinetic parameters of cells for phenol utilization and the co-metabolic transformation of 4-CP by resting cells, the competitive inhibition model describing the phenol (growth substrate) and 4-CP (non-growth substrate) utilization rates, and cell growth rate (Equations (6)–(8)) was utilized to estimate the competitive inhibition coefficient of phenol to 4-CP () and of 4-CP to phenol (). Figure 8 presents the phenol degradation and 4-CP transformation and cell growth at various initial nominal phenol and 4-CP concentrations. The experimental results reveal that the initial phenol concentrations ranging from 50 to 350 mg/L were completely consumed by P. putida cells; however, initial 4-CP concentrations over 40 mg/L retained the residual 4-CP concentration. The typical growth curve of cells followed exponential and endogenous phases. The overall specific growth rate was determined from the slopes of the two phases by plotting ln (X/X0) versus time. Phenol was used as the growth substrate, and 4-CP was used as the non-growth substrate in the dual-substrate cometabolic system. Thus, the specific utilization rates of phenol and 4-CP were used in the kinetic model (Equation (8)) to evaluate the and values. Figure 9 shows the variation in the specific growth rate with the initial phenol and 4-CP concentrations. The specific growth rate obtained from the experimental data in the cometabolic system was fitted using the kinetic equation (Equation (8)) to estimate the and values, which were 6.75 and 9.27 mg/L for phenol and 4-CP, respectively, with an SSR value of 6.077 × 10⁻⁴. Table 1 presents the kinetic constants and operational conditions of the biofilm process for model prediction.
4.4. Phenol Degradation and 4-CP Transformation in the Biofilm Process
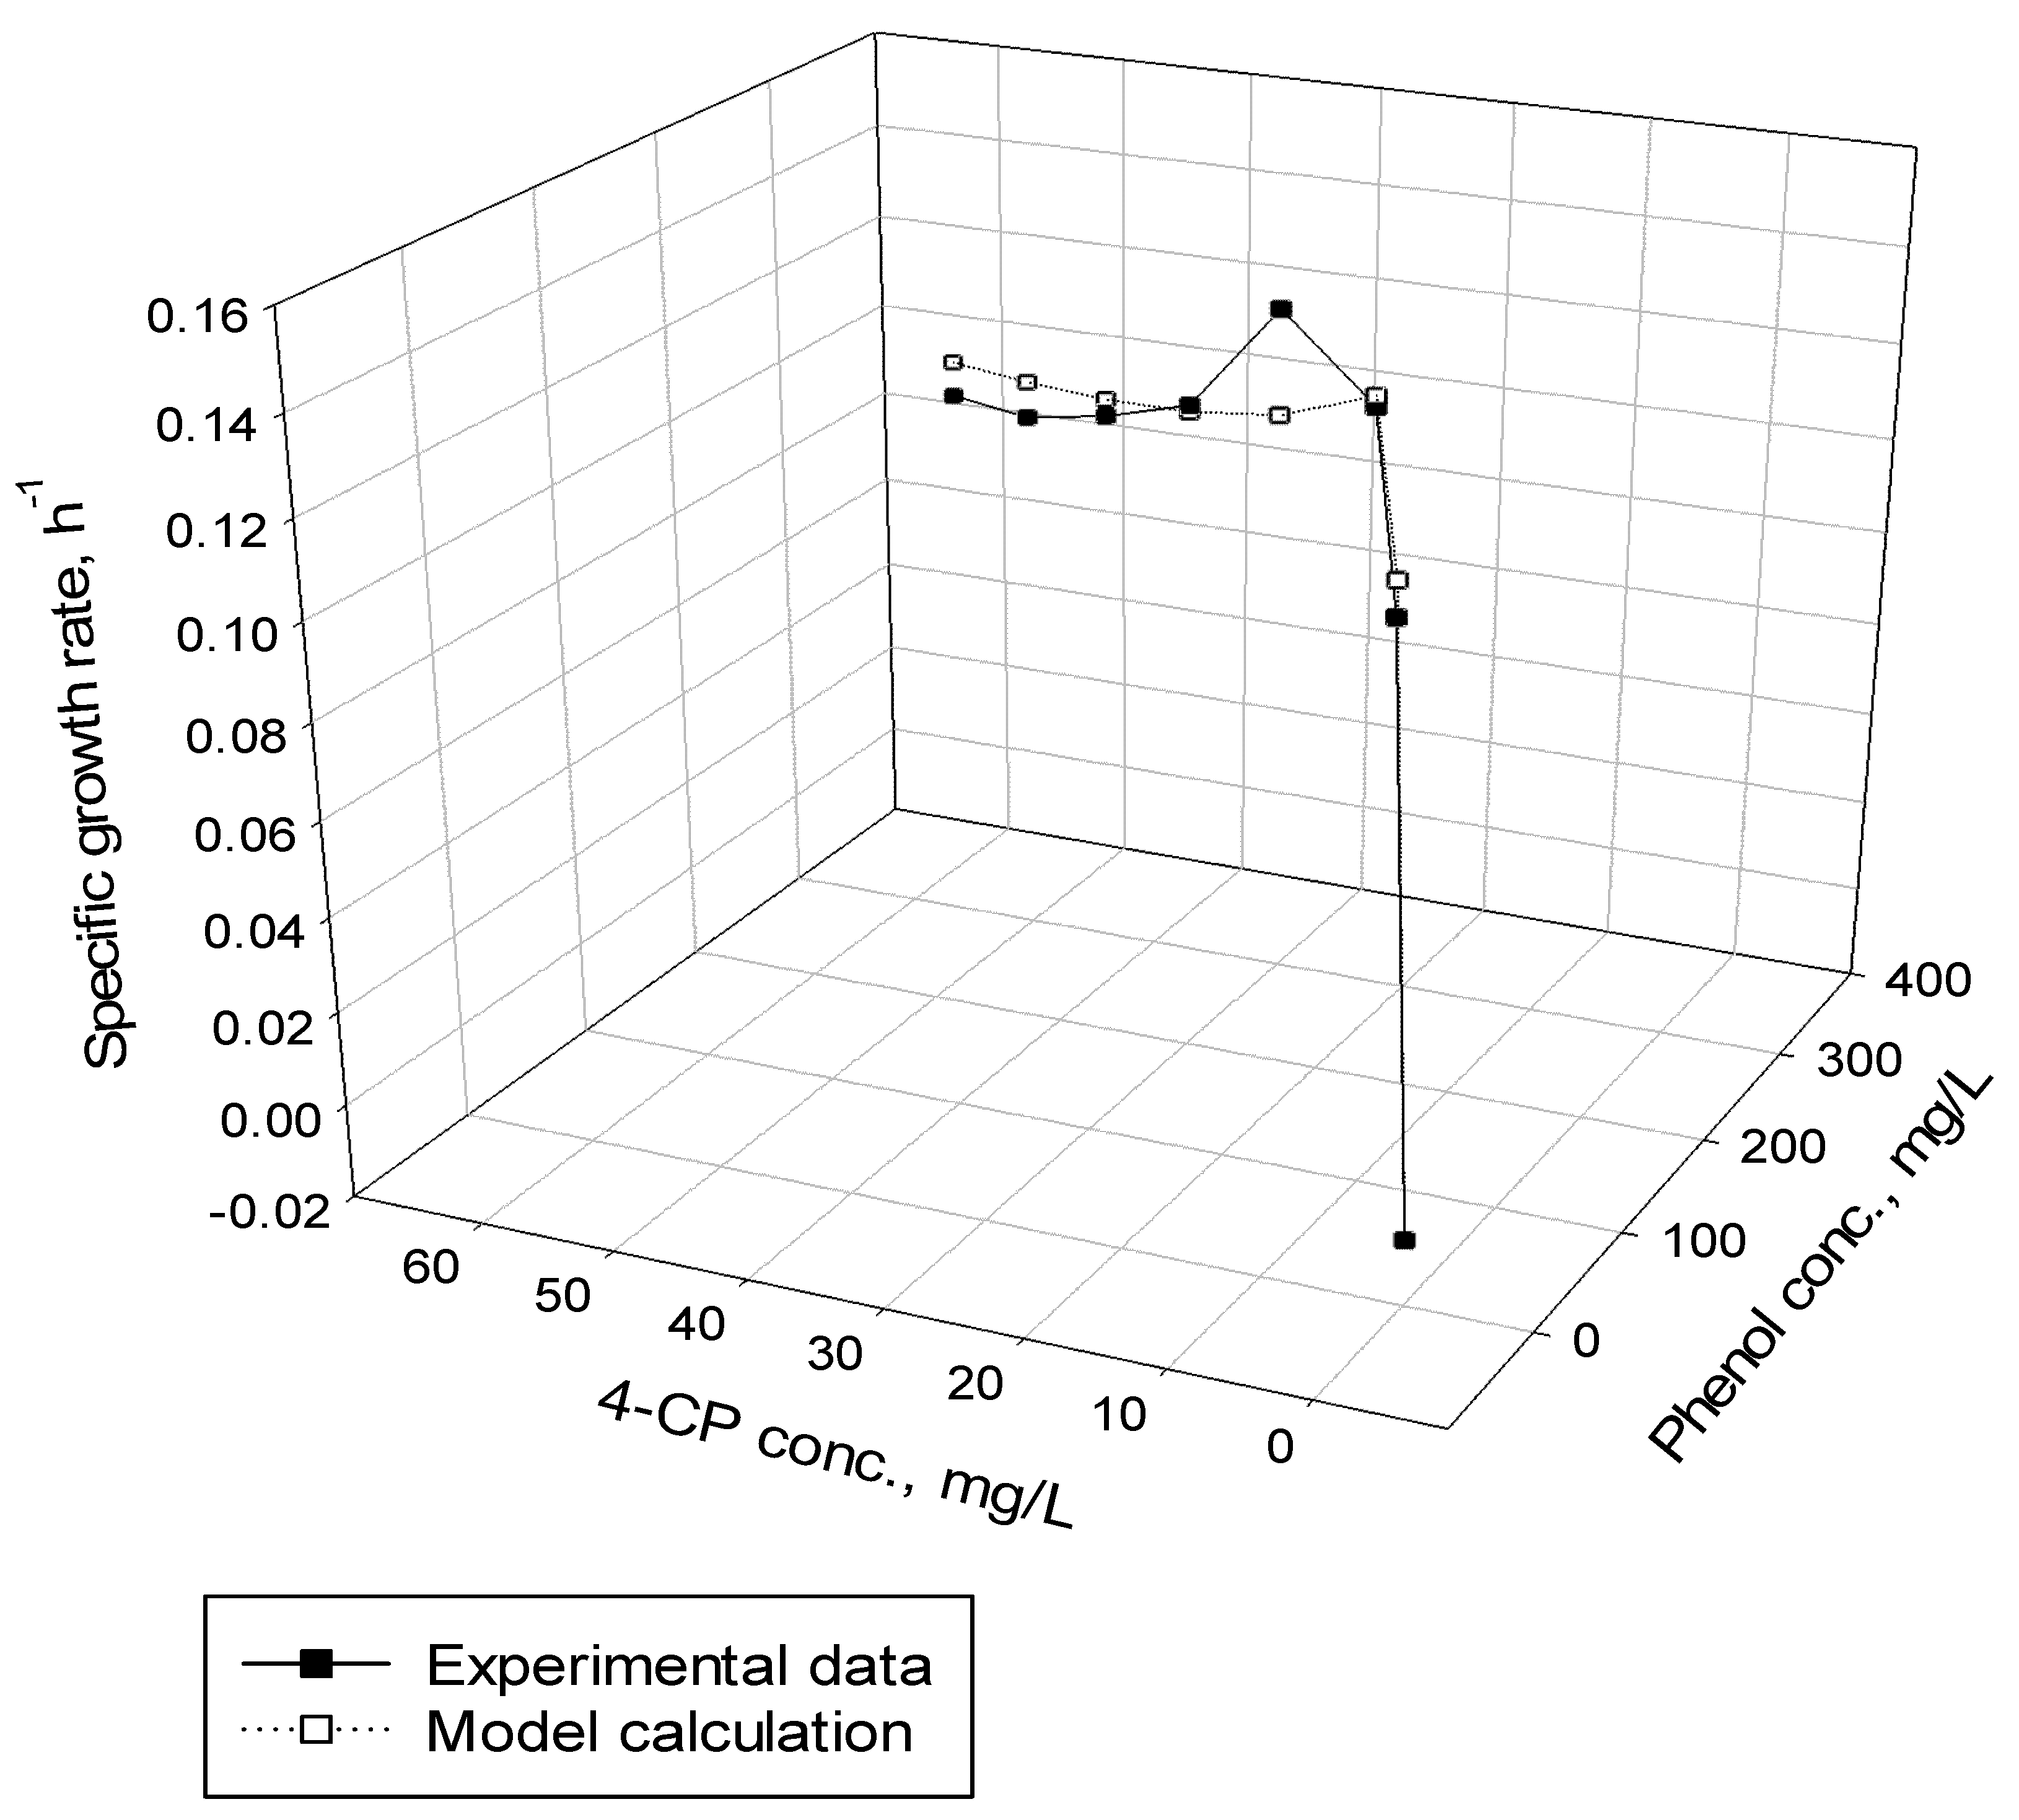
Figure 10 shows the model predictions and experimental data for phenol degradation and 4-CP transformation during the biofilm process. As shown in Figure 10a, the time course of phenol effluent concentration depicts a rapid increase during the transient period, which was 136.86 mg/L (0.684 Sb,P0) owing to the dilute-in flow characteristics. The phenol effluent concentration then leveled off from the peak of the curve and decreased after phenol biodegradation was initiated. The P. putida biofilm grew actively for phenol biodegradation from the transient period of 0.4–2 days. The steady-state period running from 2 to 8 days showed a stable phenol effluent concentration of approximately 4.68 mg/L (0.0234 Sb,P0), which reached a high phenol removal efficiency of 97.66%.
The time course of the 4-CP effluent concentration profile was similar to the phenol effluent concentration curve (Figure 10b). At the onset of the column test, the 4-CP effluent concentration abruptly increased to the highest effluent concentration value of 17.8 mg/L (0.712 Sb,CP0) because the initial 4-CP concentration in the reactor was zero at time zero. In sequence, 4-CP was degraded by the P. putida biofilm for cometabolic transformation to lower the effluent concentration. At the steady state, the effluent concentration was approximately 0.468 mg/L (0.0187 Sb,CP0), which resulted in a removal efficiency of 98.13% for 4-CP.
The growth of the biofilm is shown in Figure 10c. A lag phase of 0.5 days was observed for the P. putida biofilm, which started to grow and then followed the exponential phase. The model predicted that the biofilm thickness was 338.5 µm on day 8. The experimental data and model predictions for suspended P. putida cells in the bulk liquid are shown in Figure 10d. The biofilm and suspended cells contributed to degrading the phenol and simultaneously performed a cometabolic transformation of 4-CP during the biofilm process. A lag stage of 0.5 days was also observed, followed by an intensive and mild log-growth phase. The effluent concentration of the P. putida suspended cells was approximately 43.36 mg/L on day 8.
Phenol and 4-CP fluxes diffused into the biofilm and are shown in Figure 10e. Phenol had a higher flux than 4-CP because phenol had a higher initial concentration than 4-CP. Both phenol and 4-CP fluxes increased abruptly within one day. The fluxes reached a steady-state over 1–8 days. At the steady state, the flux values of phenol and 4-CP were 0.0879 and 0.0109 mg/cm2-d, respectively.
Experimental results for synchronous phenol and 4-CP biodegradation were observed as the phenol and 4-CP concentration ratios ranged from 6.7 to 15 (Figure 10f). Hao et al. [29] reported that phenol and 4-CP ratios greater than 4 made phenol and 4-CP disappear simultaneously within 18 h in batch experiments. Zilouei et al. [33] performed packed-bed bioreactors with mixed bacterial consortia to degrade a mixture of chlorophenolic compounds. The experimental results indicate that a removal efficiency greater than 99% was attained at a total chlorophenol loading rate of 11 mg/L-h. In the present study, the phenol and 4-CP loading rates increased from 8.33 to 58.3 mg phenol/L-h and 0.83 to 8.33 mg 4-CP/L-h, respectively, and the removal efficiency in the biofilm reactor increased from 94.56% to 98.45% for phenol and 96.09% to 98.68% for 4-CP at the steady-state operational period.
5. Conclusions
The kinetics of phenol, 4-CP and phenol plus 4-CP in batch reactors was investigated to observe substrates degradation and growth of P. putida cells and the decrease in the concentration of resting cells. The experimental results obtained from the batch tests were fitted using Haldane kinetics to determine the biokinetic parameters. The effective diffusivity, mass-transfer coefficient, and shear-loss coefficient were estimated using empirical formulas. The kinetic parameters and coefficients were used as input values for the fixed biofilm model prediction. A completely mixed and continuous-flow fixed biofilm reactor was used to observe the effluent concentrations of phenol and 4-CP compared to the prediction results. Good agreement between the model prediction and experimental data for the effluent concentrations of phenol and 4-CP was achieved. The high removal efficiencies of phenol and 4-CP were monitored under steady-state operational conditions. The removal efficiencies for phenol and 4-CP were in the range of 94.56–98.45% and 96.09–98.85%, respectively, at the steady-state performance. The cometabolic transformation of 4-CP and phenol degradation can be simulated using kinetic model systems to predict the interaction behaviors of cometabolic substrates involving dual-substrate contaminants in various wastewater and industrial effluents. The kinetic model systems developed in the present study are powerful tools for designing batch and biofilm reactors to treat multiple substrates containing phenolic and chlorophenolic compounds in wastewater.
Funding
This study was supported by funding from the Ministry of Science and Technology of Taiwan under Contract No. MOST 109-2221-E-166-002-.
Institutional Review Board Statement
Not applicable.
Informed Consent Statement
Not applicable.
Data Availability Statement
Not applicable.
Conflicts of Interest
The author declares no conflict of interest.
References
- Silva, C.D.; Gómez, J.; Beristain-Cardoso, R. Simultaneous removal of 2-chlorophenol, phenol, p-cresol and p-hydroxybenzaldehyde under nitrifying conditions: Kinetic study. Bioresour. Technol. 2011, 102, 6464–6468. [Google Scholar] [CrossRef]
- Liu, J.; Jia, X.; Wen, J.; Zhou, Z. Substrate interactions and kinetics study of phenolic compounds biodegradation by Pseudomonas sp. cbp1-3. Biochem. Eng. J. 2012, 67, 156–166. [Google Scholar] [CrossRef]
- Farag, A.M.; Fawzy, A.; El-Naggar, M.Y.; Ghanem, K.M. Biodegradation and enhancement of 2,4-dichlorophenol by marine halophilic Bacillus subtilis AAK. Egypt. J. Aquat. Res. 2021, 47, 117–123. [Google Scholar] [CrossRef]
- Wang, Y.J.; Song, J.; Zhao, W.; He, X.L.; Chen, J.; Xiao, M. In situ degradation of phenol and promotion of plant growth in contaminated environments by a single Pseudomonas aeruginosa strain. J. Hazard. Mater. 2011, 192, 354–360. [Google Scholar] [CrossRef] [PubMed]
- Christen, P.; Vega, A.; Casalot, L.; Simon, G.; Auria, R. Kinetics of aerobic phenol biodegradation by the acidophilic and hyperthermophilic archaeon Sulfolobus solfataricus 98/2. Biochem. Eng. J. 2012, 62, 56–61. [Google Scholar] [CrossRef]
- Kayan, I.; Oz, N.A.; Kantar, C. Comparison of treatability of four different chlorophenol-containing wastewater by pyrite-Fenton process combined with aerobic biodegradation: Role of sludge acclimation. J. Environ. Manag. 2020, 279, 111781. [Google Scholar] [CrossRef]
- Yoon, H.; Klinzing, G.; Blanch, H.W. Competition for mixed substrates by microbial populations. Biotechnol. Bioeng. 1977, 19, 1193–1210. [Google Scholar] [CrossRef]
- Reardon, K.F.; Mosteller, D.C.; Rogers, J.B.; DuTeau, N.M.; Kim, K.-H. Biodegradation kinetics of aromatic hydrocarbon mixtures by pure and mixed bacterial cultures. Environ. Health Perspect. 2002, 110, 1005–1011. [Google Scholar] [CrossRef] [Green Version]
- Berfield, L.D.; Randall, C.W. Biological Process Design for Waste Water Treatment; Prentice Hall: Hoboken, NJ, USA, 1980. [Google Scholar]
- Li, Y.; Li, J.; Wang, C.; Wang, P. Growth kinetics and phenol biodegradation of psychrotrophic Pseudomonas putida LY1. Bioresour. Technol. 2010, 101, 6740–6744. [Google Scholar] [CrossRef]
- Loh, K.-C.; Chua, S.-S. Ortho pathway of benzoate degradation in Pseudomonas putida: Induction of meta pathway at high substrate concentrations. Enzyme Microb. Technol. 2002, 30, 620–626. [Google Scholar] [CrossRef]
- Li, M.; Yi, P.; Liu, Q.; Pan, Y.; Qian, G. Biodegradation of benzoate by protoplast fusant via intergeneric protoplast fusion between Pseudomonas putida and Bacillus subtili. Int. Biodeterior. Biodegrad. 2013, 85, 577–582. [Google Scholar] [CrossRef]
- Yu, Q.; Mishra, B.; Fein, J.B. Role of bacterial cell surface sulfhydryl sites in cadmium detoxification by Pseudomonas putida. J. Hazard. Mater. 2020, 391, 122209. [Google Scholar] [CrossRef]
- Wang, S.-J.; Loh, K.-C. New cell growth pattern on mixed substrates and substrate utilization in cometabolic transformation of 4-chlorophenol. Water Res. 2000, 34, 3786–3794. [Google Scholar] [CrossRef]
- Wang, S.-J.; Loh, K.-C.; Chua, S.S. Prediction of critical cell growth behavior of Pseudomonas putida to maximize the cometabolism of 4-chlorophenol with phenol and sodium glutamate as carbon sources. Enzyme Microbial Technol. 2003, 32, 422–430. [Google Scholar] [CrossRef]
- Gąszczak, A.; Bartelmus, G.; Rotkegel, A.; Greñ, I.; Janecki, D. Kinetics of cometabolic biodegradation of 4-chlorophenol and phenol by stenotrophomonas maltophilia KB2. Chem. Process Eng. 2018, 39, 395–410. [Google Scholar]
- Wang, S.-J.; Loh, K.-C. Modeling the role of metabolic intermediates in kinetics of phenol biodegradation. Enzyme Microb. Technol. 1999, 25, 177–184. [Google Scholar] [CrossRef]
- Panigrahy, N.; Barik, M.; Sahoo, R.K.; Sahoo, N.K. Metabolic profile analysis and Kinetics of p-cresol biodegradation by an indigenous Pseudomonas citronellolis NS1 isolated from coke oven wastewater. Int. Biodeterior. Biodegrad. 2019, 147, 104837. [Google Scholar] [CrossRef]
- Miri, S.; Davoodi, S.M.; Darvanjooghi, M.H.K.; Brar, S.K.; Rouissi, T.; Martel, R. Precision modelling of co-metabolic biodegradation of recalcitrant aromatic hydrocarbons in conjunction with experimental data. Process. Biochem. 2021, 105, 113–127. [Google Scholar] [CrossRef]
- Kim, M.H.; Fan, C.; Pan, S.-Y.; Lee, I.; Lin, Y.; Kim, H. Kinetics of competitive cometabolism under aerobic conditions. Water-Energy Nexus 2020, 3, 62–70. [Google Scholar] [CrossRef]
- Wang, S.J.; Loh, K.C. Cell growth kinetics of Pseudomonas putida in cometabolism of phenol and 4-chlorophenol in the presence of a conventional carbon source. Biotechnol. Bioeng. 2000, 68, 437–447. [Google Scholar] [CrossRef]
- Wang, S.-J.; Loh, K.-C. Biotransformation kinetics of Pseudomonas putida for cometabolism of phenol and 4-chlorophenol in the presence of sodium glutamate. Biogeochemistry 2001, 12, 189–199. [Google Scholar] [CrossRef]
- Jesus, J.; Frascari, D.; Pozdniakova, T.; Danko, A.S. Kinetics of aerobic cometabolic biodegradation of chlorinated and brominated aliphatic hydrocarbons: A review. J. Hazard. Mater. 2016, 309, 37–52. [Google Scholar] [CrossRef] [PubMed]
- Criddle, C.S. The kinetics of cometabolism. Biotechnol. Bioeng. 1993, 41, 1048–1056. [Google Scholar] [CrossRef]
- Ma, X.; Li, N.; Jiang, J.; Xu, Q.; Li, H.; Wang, L.; Lu, J. Adsorption–synergic biodegradation of high-concentrated phenolic water by Pseudomonas putida immobilized on activated carbon fiber. J. Environ. Chem. Eng. 2013, 1, 466–472. [Google Scholar] [CrossRef]
- Banerjee, A.; Ghoshal, A.K. Phenol degradation performance by isolated Bacillus cereus immobilized in alginate. Int. Biodeterior. Biodegrad. 2011, 65, 1052–1060. [Google Scholar] [CrossRef]
- Mollaei, M.; Abdollahpour, S.; Atashgahi, S.; Abbasi, H.; Masoomi, F.; Rad, I.; Lotfi, A.S.; Zahiri, H.S.; Vali, H.; Noghabi, K.A. Enhanced phenol degradation by Pseudomonas sp. SA01: Gaining insight into the novel single and hybrid immobilizations. J. Hazard. Mater. 2010, 175, 284–292. [Google Scholar] [CrossRef]
- Juang, R.-S.; Tsai, S.-Y. Growth kinetics of Pseudomonas putida in the biodegradation of single and mixed phenol and sodium salicylate. Biochem. Eng. J. 2006, 31, 133–140. [Google Scholar] [CrossRef]
- Hao, O.J.; Kim, M.H.; Seagren, E.A.; Kim, H. Kinetics of phenol and chlorophenol utilization by Acinetobacter species. Chemosphere 2002, 46, 797–807. [Google Scholar] [CrossRef]
- Lob, K.C.; Tar, C.P.P. Effect of additional carbon sources on biodegradation of phenol. Bull. Environ. Contam. Toxicol. 2000, 64, 756–763. [Google Scholar]
- Rostkowski, K.H.; Pfluger, A.R.; Criddle, C.S. Stoichiometry and kinetics of the PHB-producing Type II methanotrophs Methylosinus trichosporium OB3b and Methylocystis parvus OBBP. Bioresour. Technol. 2013, 132, 71–77. [Google Scholar] [CrossRef]
- Assadi, A.; Alimoradzadeh, R.; Movahedyan, H.; Amin, M.M. Intensified 4-chlorophenol biodegradation in an aerobic sequencing batch reactor: Microbial and kinetic properties evaluation. Environ. Technol. Innov. 2020, 21, 101243. [Google Scholar] [CrossRef]
- Zilouei, H.; Guieysse, B.; Mattiasson, B. Biological degradation of chlorophenols in packed-bed bioreactors using mixed bacterial consortia. Process. Biochem. 2006, 41, 1083–1089. [Google Scholar] [CrossRef]
Figure 1.
Concentration profiles of cometabolic substrates in the biofilm.

Figure 2.
A completely mixed and continuous-flow packed bed bioreactor.

Figure 3.
Effect of initial phenol concentration on (a) phenol degradation and (b) cell growth.


Figure 4.
Specific growth rate versus initial phenol concentration, fitted by the Haldane model to determine the maximum specific growth rate on phenol (), half-saturation constant for phenol ( ) and self-inhibition constant of phenol ( ).
Figure 4.
Specific growth rate versus initial phenol concentration, fitted by the Haldane model to determine the maximum specific growth rate on phenol (), half-saturation constant for phenol ( ) and self-inhibition constant of phenol ( ).

Figure 5.
Effect of initial 4-CP concentration on transformation of 4-CP by resting cells with initial cell concentration of 93.4 mg/L.
Figure 5.
Effect of initial 4-CP concentration on transformation of 4-CP by resting cells with initial cell concentration of 93.4 mg/L.

Figure 6.
Specific utilization rate versus initial 4-CP concentration and fitted by the Haldane model to determine kinetic parameters of maximum specific utilization rate of 4-CP (KCP), half-saturation constant for 4-CP (KS,CP) and self-inhibition constant of 4-CP (KI,CP).
Figure 6.
Specific utilization rate versus initial 4-CP concentration and fitted by the Haldane model to determine kinetic parameters of maximum specific utilization rate of 4-CP (KCP), half-saturation constant for 4-CP (KS,CP) and self-inhibition constant of 4-CP (KI,CP).

Figure 7.
Batch tests to determine kinetic parameters of true cells’ transformation capacity and first-order endogenous decay coefficient: (a) time course variation of cell concentration; (b) time course variation of ln(X/X0) to determine specific growth rate; (c) variation of specific growth rate with initial 4-CP concentration.

Figure 8.
Phenol degradation and 4-CP transformation and cell growth at various initial nominal phenol and 4-CP concentrations of 50–350 mg phenol/L and 5–60 mg 4-CP/L, respectively. Initial cell concentration = 17 mg/L.
Figure 8.
Phenol degradation and 4-CP transformation and cell growth at various initial nominal phenol and 4-CP concentrations of 50–350 mg phenol/L and 5–60 mg 4-CP/L, respectively. Initial cell concentration = 17 mg/L.


Figure 9.
The specific growth rate in the cometabolic system was fitted by competitive inhibition model to determine the competitive inhibition coefficients of phenol and 4-CP, respectively.
Figure 9.
The specific growth rate in the cometabolic system was fitted by competitive inhibition model to determine the competitive inhibition coefficients of phenol and 4-CP, respectively.

Figure 10.
Model prediction and experimental results: (a) phenol effluent concentration; (b) 4-CP effluent concentration; (c) P. putida biofilm growth; (d) P. putida suspended cells growth; (e) phenol and 4-CP fluxes into biofilm; and (f) effect of substrate load on removal efficiency.
Figure 10.
Model prediction and experimental results: (a) phenol effluent concentration; (b) 4-CP effluent concentration; (c) P. putida biofilm growth; (d) P. putida suspended cells growth; (e) phenol and 4-CP fluxes into biofilm; and (f) effect of substrate load on removal efficiency.


Table 1.
Summary of the kinetic constants as well as the operation conditions for the model prediction.
Table 1.
Summary of the kinetic constants as well as the operation conditions for the model prediction.
| Symbol | Parameters Description (unit) | Value | Remarks |
|---|---|---|---|
| Reactor porosity (dimensionless) | 0.56 | measured | |
| Shear-loss coefficient of biofilm (d−1) | 0.0564 | calculated | |
| Total surface area of glass beads (cm2) | 1.384 × 10⁴ | calculated | |
| Effective diffusivity of phenol in the glass bead (cm2 d−1) | 0.759 | calculated | |
| Effective diffusivity of 4-CP in the glass bead (cm2 d−1) | 0.689 | calculated | |
| Mass-transfer coefficient of phenol (cm d−1) | 249.64 | calculated | |
| Mass-transfer coefficient of 4-CP (cm d−1) | 233.91 | calculated | |
| Self-inhibition constant of phenol (mg L−1) | 228.5 | calculated | |
| Self-inhibition constant of 4-CP (mg L−1) | 53.4 | calculated | |
| Half-saturation constant of phenol (mg L−1) | 78.38 | calculated | |
| Half-saturation constant of 4-CP (mg L−1) | 1.048 | calculated | |
| Competitive inhibition coefficient by phenol (mg L−1) | 6.75 | measured | |
| Competitive inhibition coefficient by 4-CP (mg L−1) | 9.27 | measured | |
| Influent flow rate (mL d−1) | 6.272 × 10³ | measured | |
| First-order endogenous decay rate (h−1) | 5.99 × 10⁻³ | calculated | |
| True transformation capacity (mg 4-CP [mg cell] −1) | 4.34 | calculated | |
| Concentration of phenol in the feed (mg L−1) | 200 | measured | |
| Concentration of 4-CP in the feed (mg L−1) | 25 | measured | |
| Effective working volume (mL) | 1.568 × 10³ | measured | |
| Maximum specific utilization rate of phenol (h−1) | 0.512 | measured | |
| Maximum specific utilization rate of 4-CP (h−1) | 0.246 | measured | |
| Initial biofilm thickness (cm) | 4 × 10⁻⁵ | assumed | |
| Density of P. putida biofilm (mg mL−1) | 9.47 | calculated | |
| Initial concentration of suspended P. putida cells in the reactor (mg L−1) | 6.83 | measured | |
| Growth yield of cell on phenol (mg cell [mg phenol]−1) | 0.618 | measured |
Publisher’s Note: MDPI stays neutral with regard to jurisdictional claims in published maps and institutional affiliations. |
© 2021 by the author. Licensee MDPI, Basel, Switzerland. This article is an open access article distributed under the terms and conditions of the Creative Commons Attribution (CC BY) license (https://creativecommons.org/licenses/by/4.0/).
Share and Cite
MDPI and ACS Style
Lin, Y.-H. Kinetics of Cometabolic Transformation of 4-chlorophenol and Phenol Degradation by Pseudomonas putida Cells in Batch and Biofilm Reactors. Processes 2021, 9, 1663. https://0-doi-org.brum.beds.ac.uk/10.3390/pr9091663
AMA Style
Lin Y-H. Kinetics of Cometabolic Transformation of 4-chlorophenol and Phenol Degradation by Pseudomonas putida Cells in Batch and Biofilm Reactors. Processes. 2021; 9(9):1663. https://0-doi-org.brum.beds.ac.uk/10.3390/pr9091663
Chicago/Turabian StyleLin, Yen-Hui. 2021. "Kinetics of Cometabolic Transformation of 4-chlorophenol and Phenol Degradation by Pseudomonas putida Cells in Batch and Biofilm Reactors" Processes 9, no. 9: 1663. https://0-doi-org.brum.beds.ac.uk/10.3390/pr9091663
Note that from the first issue of 2016, this journal uses article numbers instead of page numbers. See further details here.