
A Numerical Analysis of the Effect of Impeller Rounding on Centrifugal Pump as Turbine

1
Department of Mechanical Engineering, Qingdao University of Science and Technology, Qingdao 266000, China
2
CRRC Qingdao Sifang Rolling Stock Research Institute Co., Ltd., Qingdao 266000, China
*
Author to whom correspondence should be addressed.
Processes 2021, 9(9), 1673; https://0-doi-org.brum.beds.ac.uk/10.3390/pr9091673
Submission received: 13 June 2021
/
Revised: 6 September 2021
/
Accepted: 15 September 2021
/
Published: 17 September 2021
Abstract
:Pump as turbine (PAT) is one of the micro-hydro system components. It can be used alone as a generator in remote areas without power supply, and in hydraulic networks instead of pressure-reducing valves. However, its hydraulic optimization still remains an open research problem. One of the optimization techniques is the rounding of the sharp edges at the blade periphery. Existing studies are mostly based on prototype experiments to obtain the optimization effect. In order to more intuitively analyze the influence of this structural optimization on the internal flow of PAT, this paper uses the CFD method to study the influence of the leading edge of the centrifugal pump blade and the fillet of the impeller on the turbine performance. By simulating the PAT performance at different flow rates and speeds, the internal hydraulic performance changes caused by the inverted circular blade are analyzed. Simulation results show that, under various operating conditions, the impeller inverted circle improves the efficiency of PAT to different degrees. At the speed of 1500 rpm, the efficiency is most obviously improved, which can reach 8.09%. Internal flow results show that the efficiency increases along with the decrease in impeller inlet resistance and the flow separation region in the impeller. This paper provides an effective method for studying the PAT hydraulic optimization problem.
1. Introduction
Along with the increasing energy demand, it is urgent to develop renewable and environment-friendly energy. Since the oil crisis of the 1970s, small hydropower has gained great attraction. Compared to the huge hydraulic turbines, pumps are easy to manufacture and maintain, and easily available all over the world. Experiments have shown that, at relatively low power outputs [1], pumps with high technological standards can compete with conventional turbines in terms of maximum efficiency in reverse operation [2].
An experimental study of district heating in Sweden shows that pump as turbine (PAT) can recover energy and supply power, thus reducing operating costs and providing temporary heating as a pump in case of failure of the main pump [3,4]. In another study, PAT was applied to the regional heating system in Poland for experimental study. The experimental results show that venue operating system (VOS) needs to be introduced for stable energy recovery. In addition, by using PAT instead of the pressure-reducing valve, the noise and vibration of the pipe network can be reduced and the damage of the pipe can be prevented or reduced [5,6].
The hydraulic losses in PAT are due to the long flow passage and unmatched fluid flow across the turbine, as it is not designed to run in reverse flow [7]. Modifications to optimize the performance were proposed to enhance the hydraulic characteristics and consequently increase the efficiency [8]. The proposed modifications include trimming the impeller blades, adjusting the blade number, adding splitter blades, installing guide vanes, and rounding impeller leading edges [9,10,11,12]. Experimental and numerical investigation into impeller trimming to the influence of PAT was carried out on a single-stage centrifugal PAT by Yang et al. [13,14]. As impeller diameter is cut down, its geometrical parameters of impeller diameter, blade wrap angle, impeller inlet width, and blade inlet angle are changed.
In [14], it was proposed to add splitter blades between the original blades of PAT. Results show that splitter blades have a positive impact on PAT performance. With the increase in splitter blades, its required pressure head is dropped and its efficiency is increased. In the study of Patel et al. [15], guide vanes were added at the entrance of the impeller in volute of PAT. The impeller and eight fixed guide vanes provided at 75 degrees led to improved performance of PAT. Although the inflow angle at the entrance of impeller has improved, these two methods undoubtedly increase the manufacturing cost of PAT. Zeng et al. [16,17] proposed the concept of “Impulse Pump—as—Turbine (Impulse PAT)”, where the centrifugal pump impeller is used as a hydro turbine by pairing with the spear valve injector from an impulse hydro turbine. The spear valve injector regulates water inlet flow rate and, thus, regulates power output of the new concept turbine. The validation methods from 1D calculation based on Euler’s turbine equation and numerical simulation by commercial CFD package shows that this new proposed concept is feasible, with efficiency around 40% [18,19].
Among all modifications, rounding the leading edge of the impeller is the simplest way to increase PAT efficiency. This modification can be achieved using simple tools. The purpose of rounding the impeller leading edges is to reduce the jet wake produced by sharp edges that caused flow separation. Ashish et al. [20] tested four kinds of centrifugal pumps with different rotating speed, and tested the effect of blade rounding and shroud rounding separately. Studies on rounding the impeller leading edges show enhanced hydraulic performance. There is an increase in efficiency between 1% and 2.5%. Experimental results show that, on most of the testing PATs, the efficiency of inner and outer shroud rounding is improved but, compared with blade rounding, the effect is not obvious. The effect of blade rounding plays an important role in the whole effect of the impeller rounding. Impeller rounding effectively reduces the loss within the flow region [18]. Shingh et al. [21] conducted experimental tests on a variety of PATs in a wider specific speed range and obtained positive results, and proposed to standardize the modification of impeller rounding on all PATs.
For the effect of impeller rounding on PAT, many researchers have conducted experiments with higher precision. In [10,11], theoretical models have been established, then a sophisticated experimental platform has been constructed to test the performance of various PATs, and the author proposes a comprehensive application of the modified method impeller rounding on all PATs. However, the flow conditions inside the PAT, such as pressure distribution and flow separation area, cannot be observed only through experimental methods.
Computational fluid dynamics (CFD) is a research method that aims to discretize the Navier–Stokes equations of nonlinear partial differential equations describing fluid phenomena into algebraic equations and obtain approximate solutions using numerical methods. The optimization process of PAT internal hydraulic performance can be accomplished through a comprehensive understanding of the flow visualization. The visualization of interfaces between fluid flow, rotating impeller, and pump casing can be achieved through simulation modeling. In addition, simulation modeling has the ability to investigate the fluid interaction, and pinpoint the root cause of the performance in the turbo machinery study. The objective of this paper is to study the effect of rounding the leading edges of impellers on PAT performance through computation simulation modeling. This enables internal hydraulic analysis that can determine the hydraulic changes causing the variations in PAT performance, which provides more comprehensive evidence for the study of theoretical models and experimental methods.
2. Structure of Impeller Rounding
The experimental evaluation of mass transfer distributions and oil flow visualization in long and short 90° elbows were conducted in a water tunnel [22]. It consists of a tank, a pump, and a settling chamber. Recently, in the study of PAT performance optimization, the effect of impeller rounding has been paid attention by many researchers. The authors of [23] compare three rounding schemes: (1) taking two times the gap width as the rounding radius; (2) taking one half of the blade thickness as the rounding radius; (3) on the basis of scheme (1), using small radius rounding for the back outer edge of the blade. Considering that the hydraulic efficiency is greatly improved and the head drop is small, the rounding method is adopted in this paper. In this study, impeller rounding can be divided into two modifications of impeller, namely, blade rounding and shroud rounding, and the fillet radius is one half of the blade thickness. The extent of the rounding of the peripheral edges of the impeller is shown in Figure 1, which comprises of ‘bullet shaped’ rounding of the blade edges in the front view and the shrouds in the side view. In order to understand the modification of blade rounding more intuitively, Figure 2 shows a schematic diagram of the changes before and after blade rounding.
In order to study the influence of impeller rounding on the flow region, the variable to be considered is the radial velocity [24]. The flow rate can be represented by the radial flow velocity component at the inlet impeller area, as shown in Equation (1):
where is the radial velocity at the impeller inlet, and is the flow area of the impeller inlet.
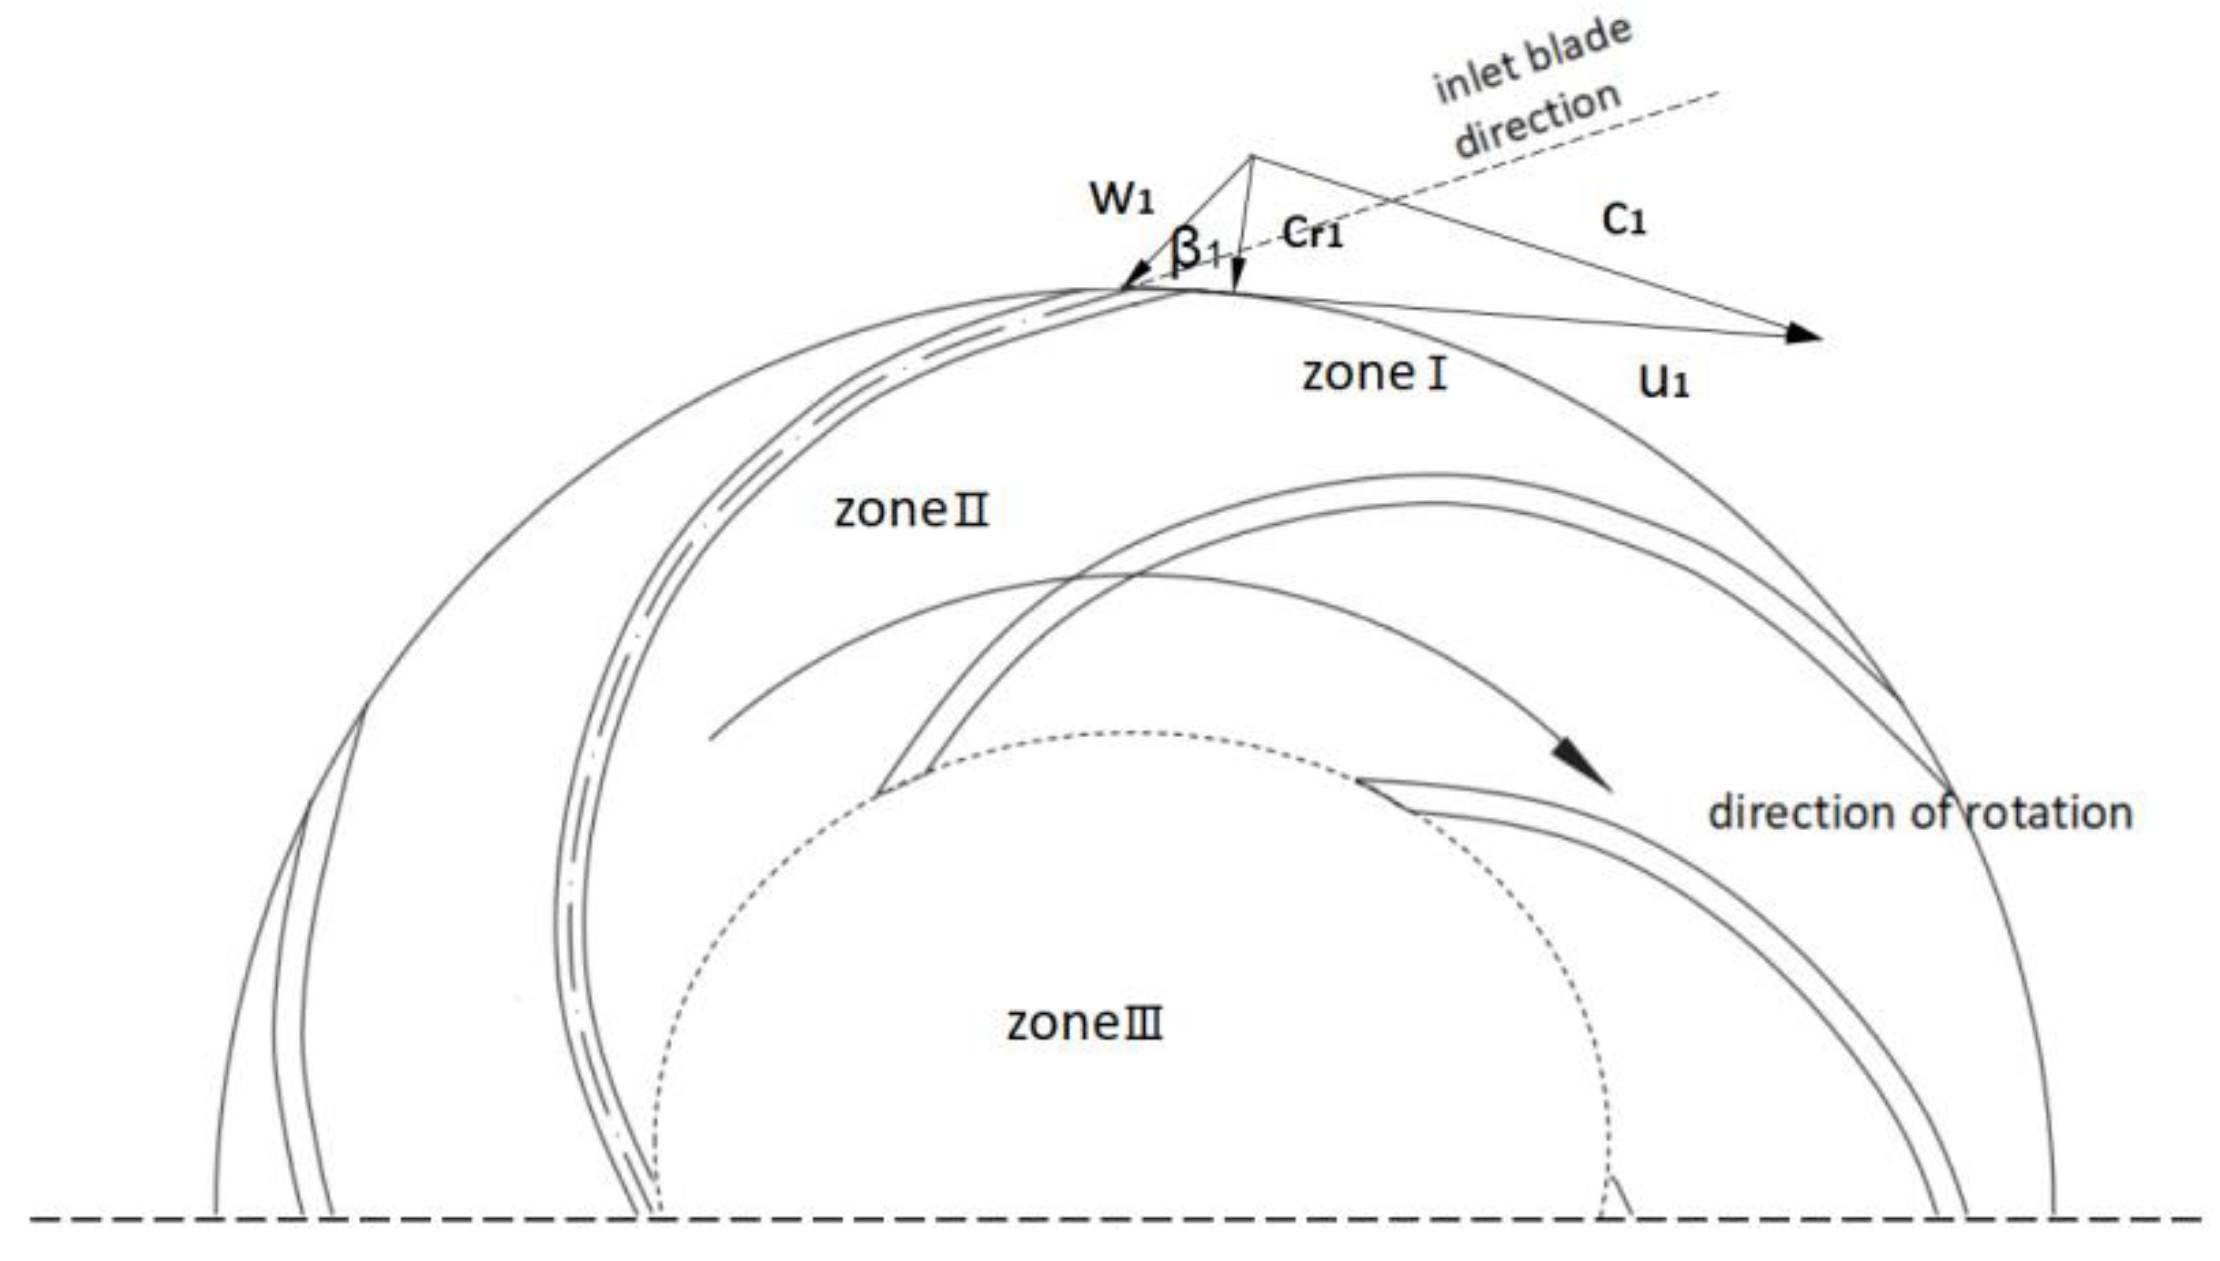
As seen from Equation (1), radial flow velocity depends on the flow rate and the flow area under consideration. It can be seen from Figure 1 that the impeller rounding increases the flow area at the impeller inlet. The change to the radial flow velocity component causes a change to the inlet vortex angle as well. However, as seen from the velocity triangles in Figure 3, the change to radial flow velocity could affect the relative flow entry (β1) at the inlet, which could, in turn, have an influence on the hydraulics in zone I and zone II.
3. Numerical Analysis and Modeling
3.1. Basic Equations
3.1.1. Governing Equation
The governing Navier–Stokes equations are based on the conservation laws for physical properties of fluids, which include mass, energy, and momentum. The standard k–ε turbulence model is selected to combine robustness with reasonable accuracy in turbomachinery analysis [24]. The mathematical equations applied to the momentum and energy can be expressed by the following equations.
Momentum equation:
Momentum equation with rotational forces:
3.1.2. Oil Flow Visualization
At present, the standard k–ε model is the most basic of the double equations model, the most widely used being the eddy viscosity model. The equations are as follows:
Turbulence kinetic energy k:
Dissipation rate :
where is the turbulent viscosity,; is the turbulent kinetic energy, ; is the vicious stress, = 1.0; is the turbulence stress, = 1.3; ; ; .
3.2. Modeling Process
3.2.1. Original Modeling and Model Modification of the PAT
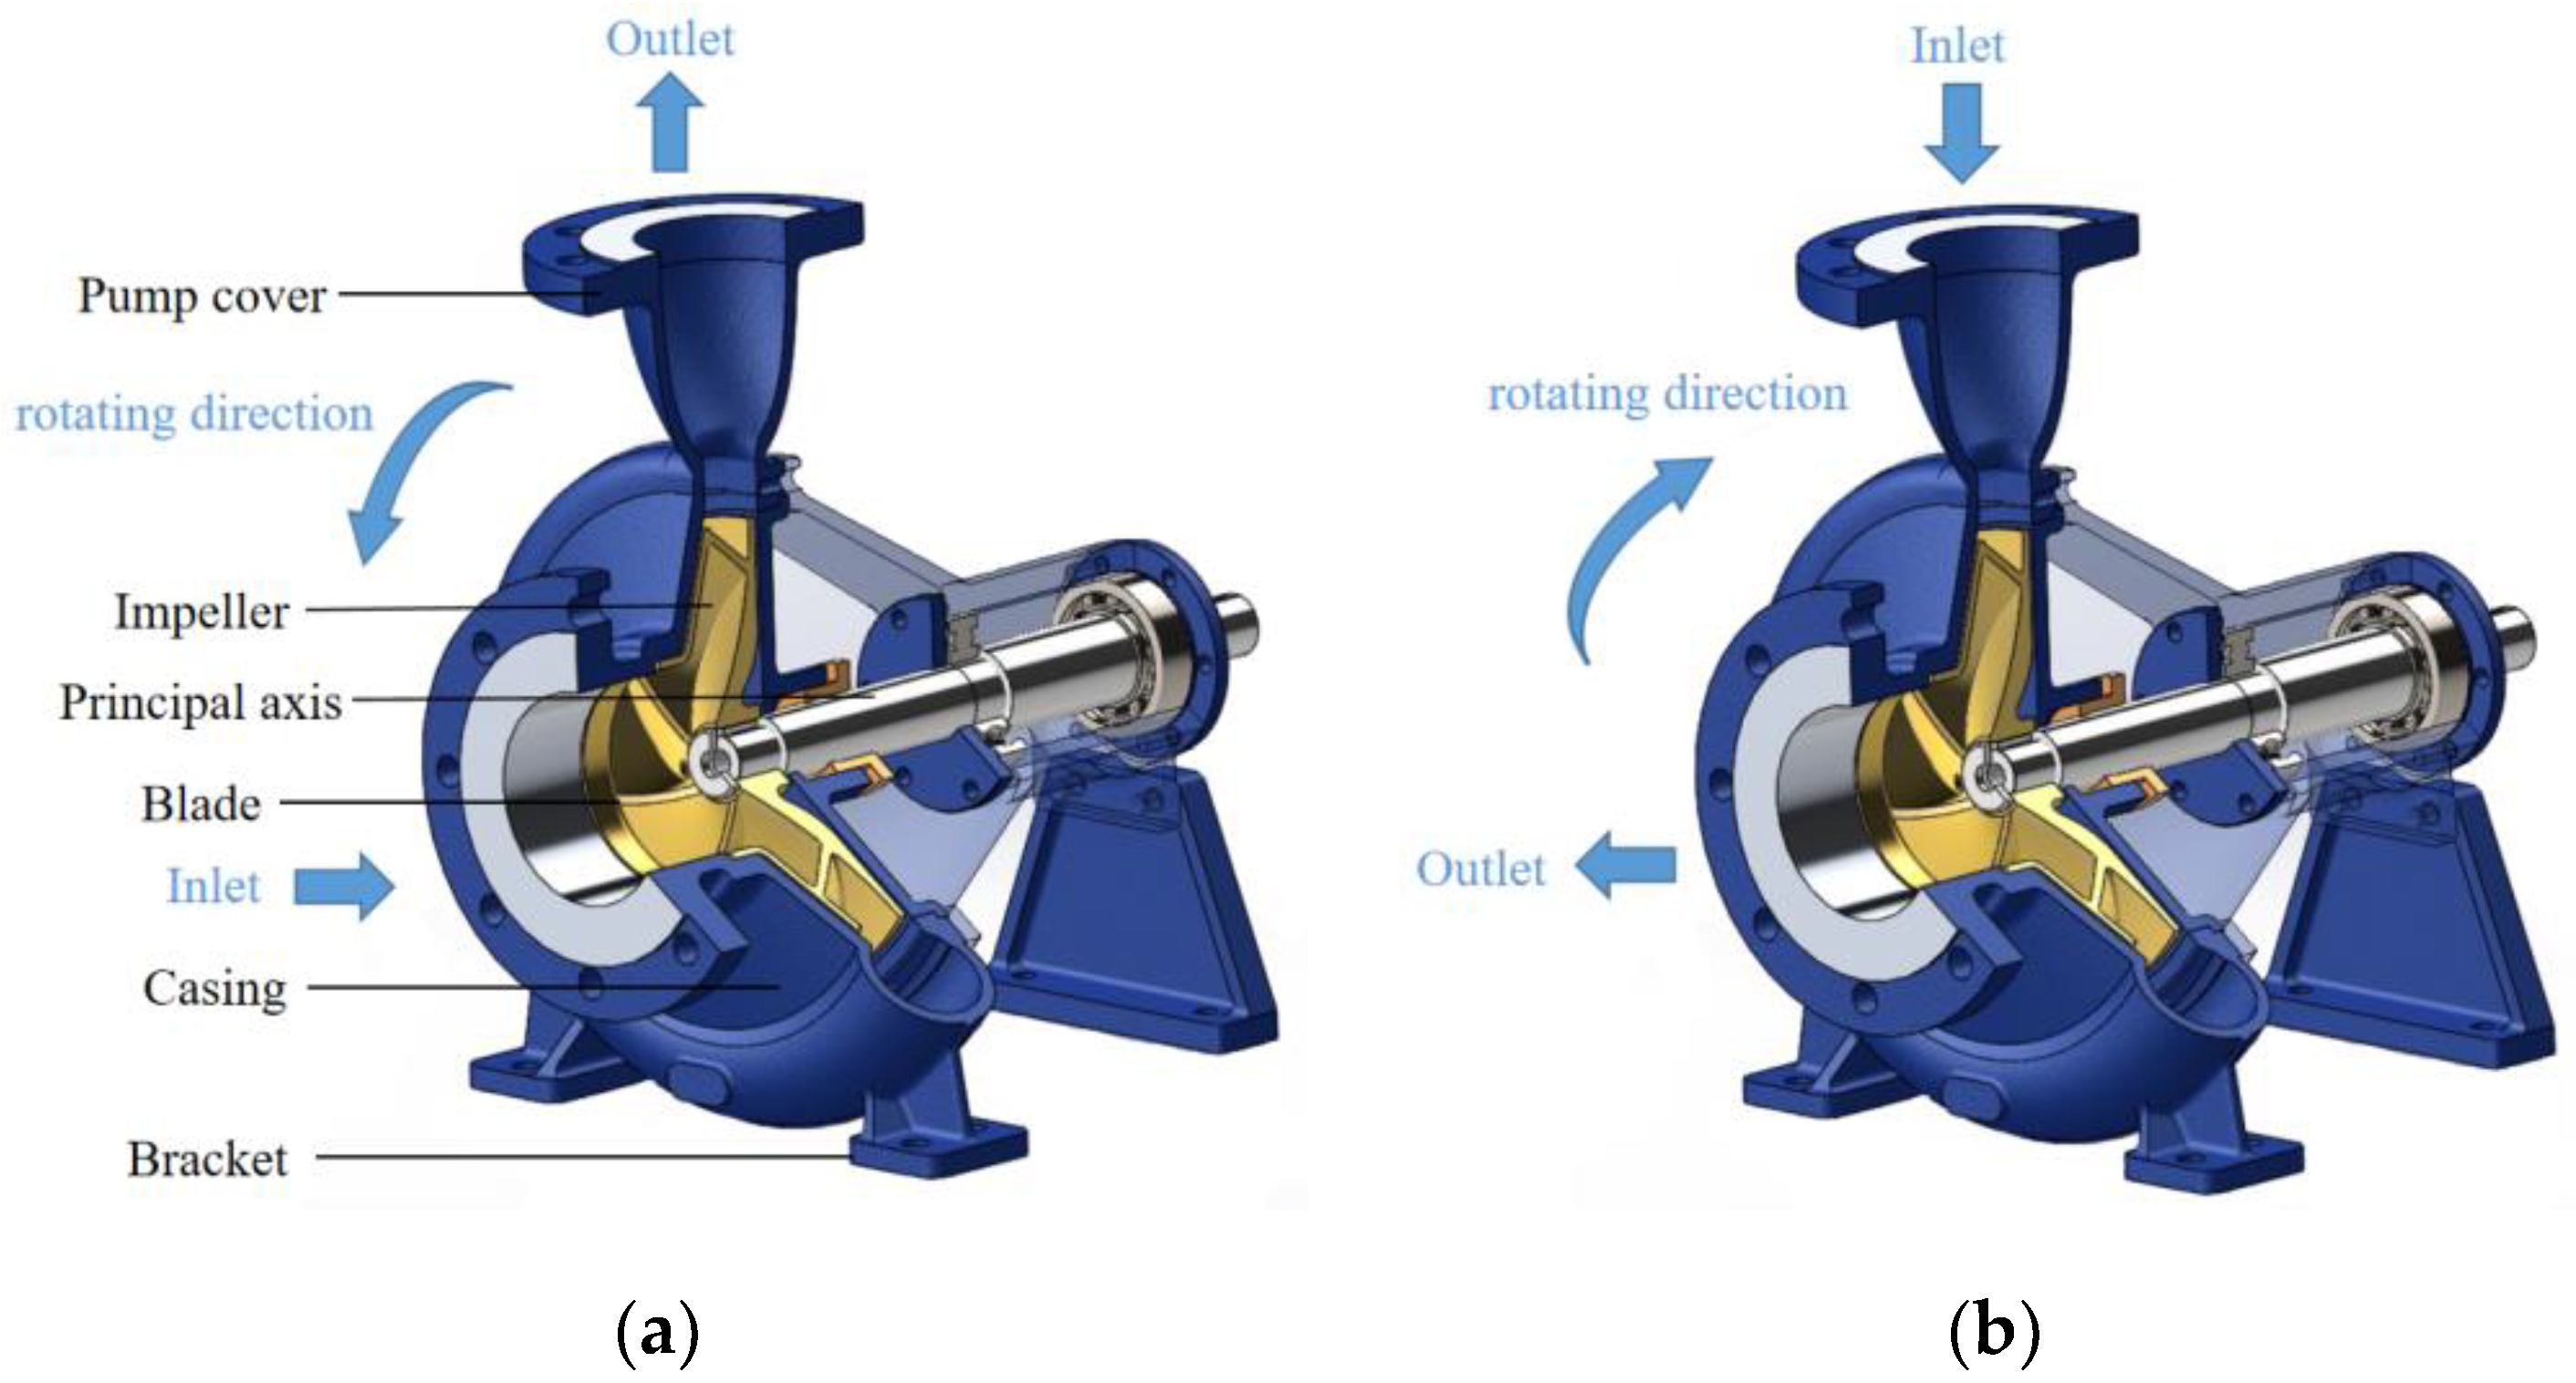
The model used in the numerical analysis of this paper is a horizontal single-stage centrifugal pump [25], as shown in Figure 3, where (a) runs in pump mode and (b) runs in PAT mode. The centrifugal pump uses the high-speed centrifugal rotation force to throw the water, which increases the water flow energy and flows out through the pump outlet. On the other hand, PAT utilizes the reverse rotation of the pump as a turbine for power generation.
The structure of the impeller is shown in Figure 4, which is composed of the front shroud, back shroud, and the blade. The design specifications in the pump mode are given in Table 1.
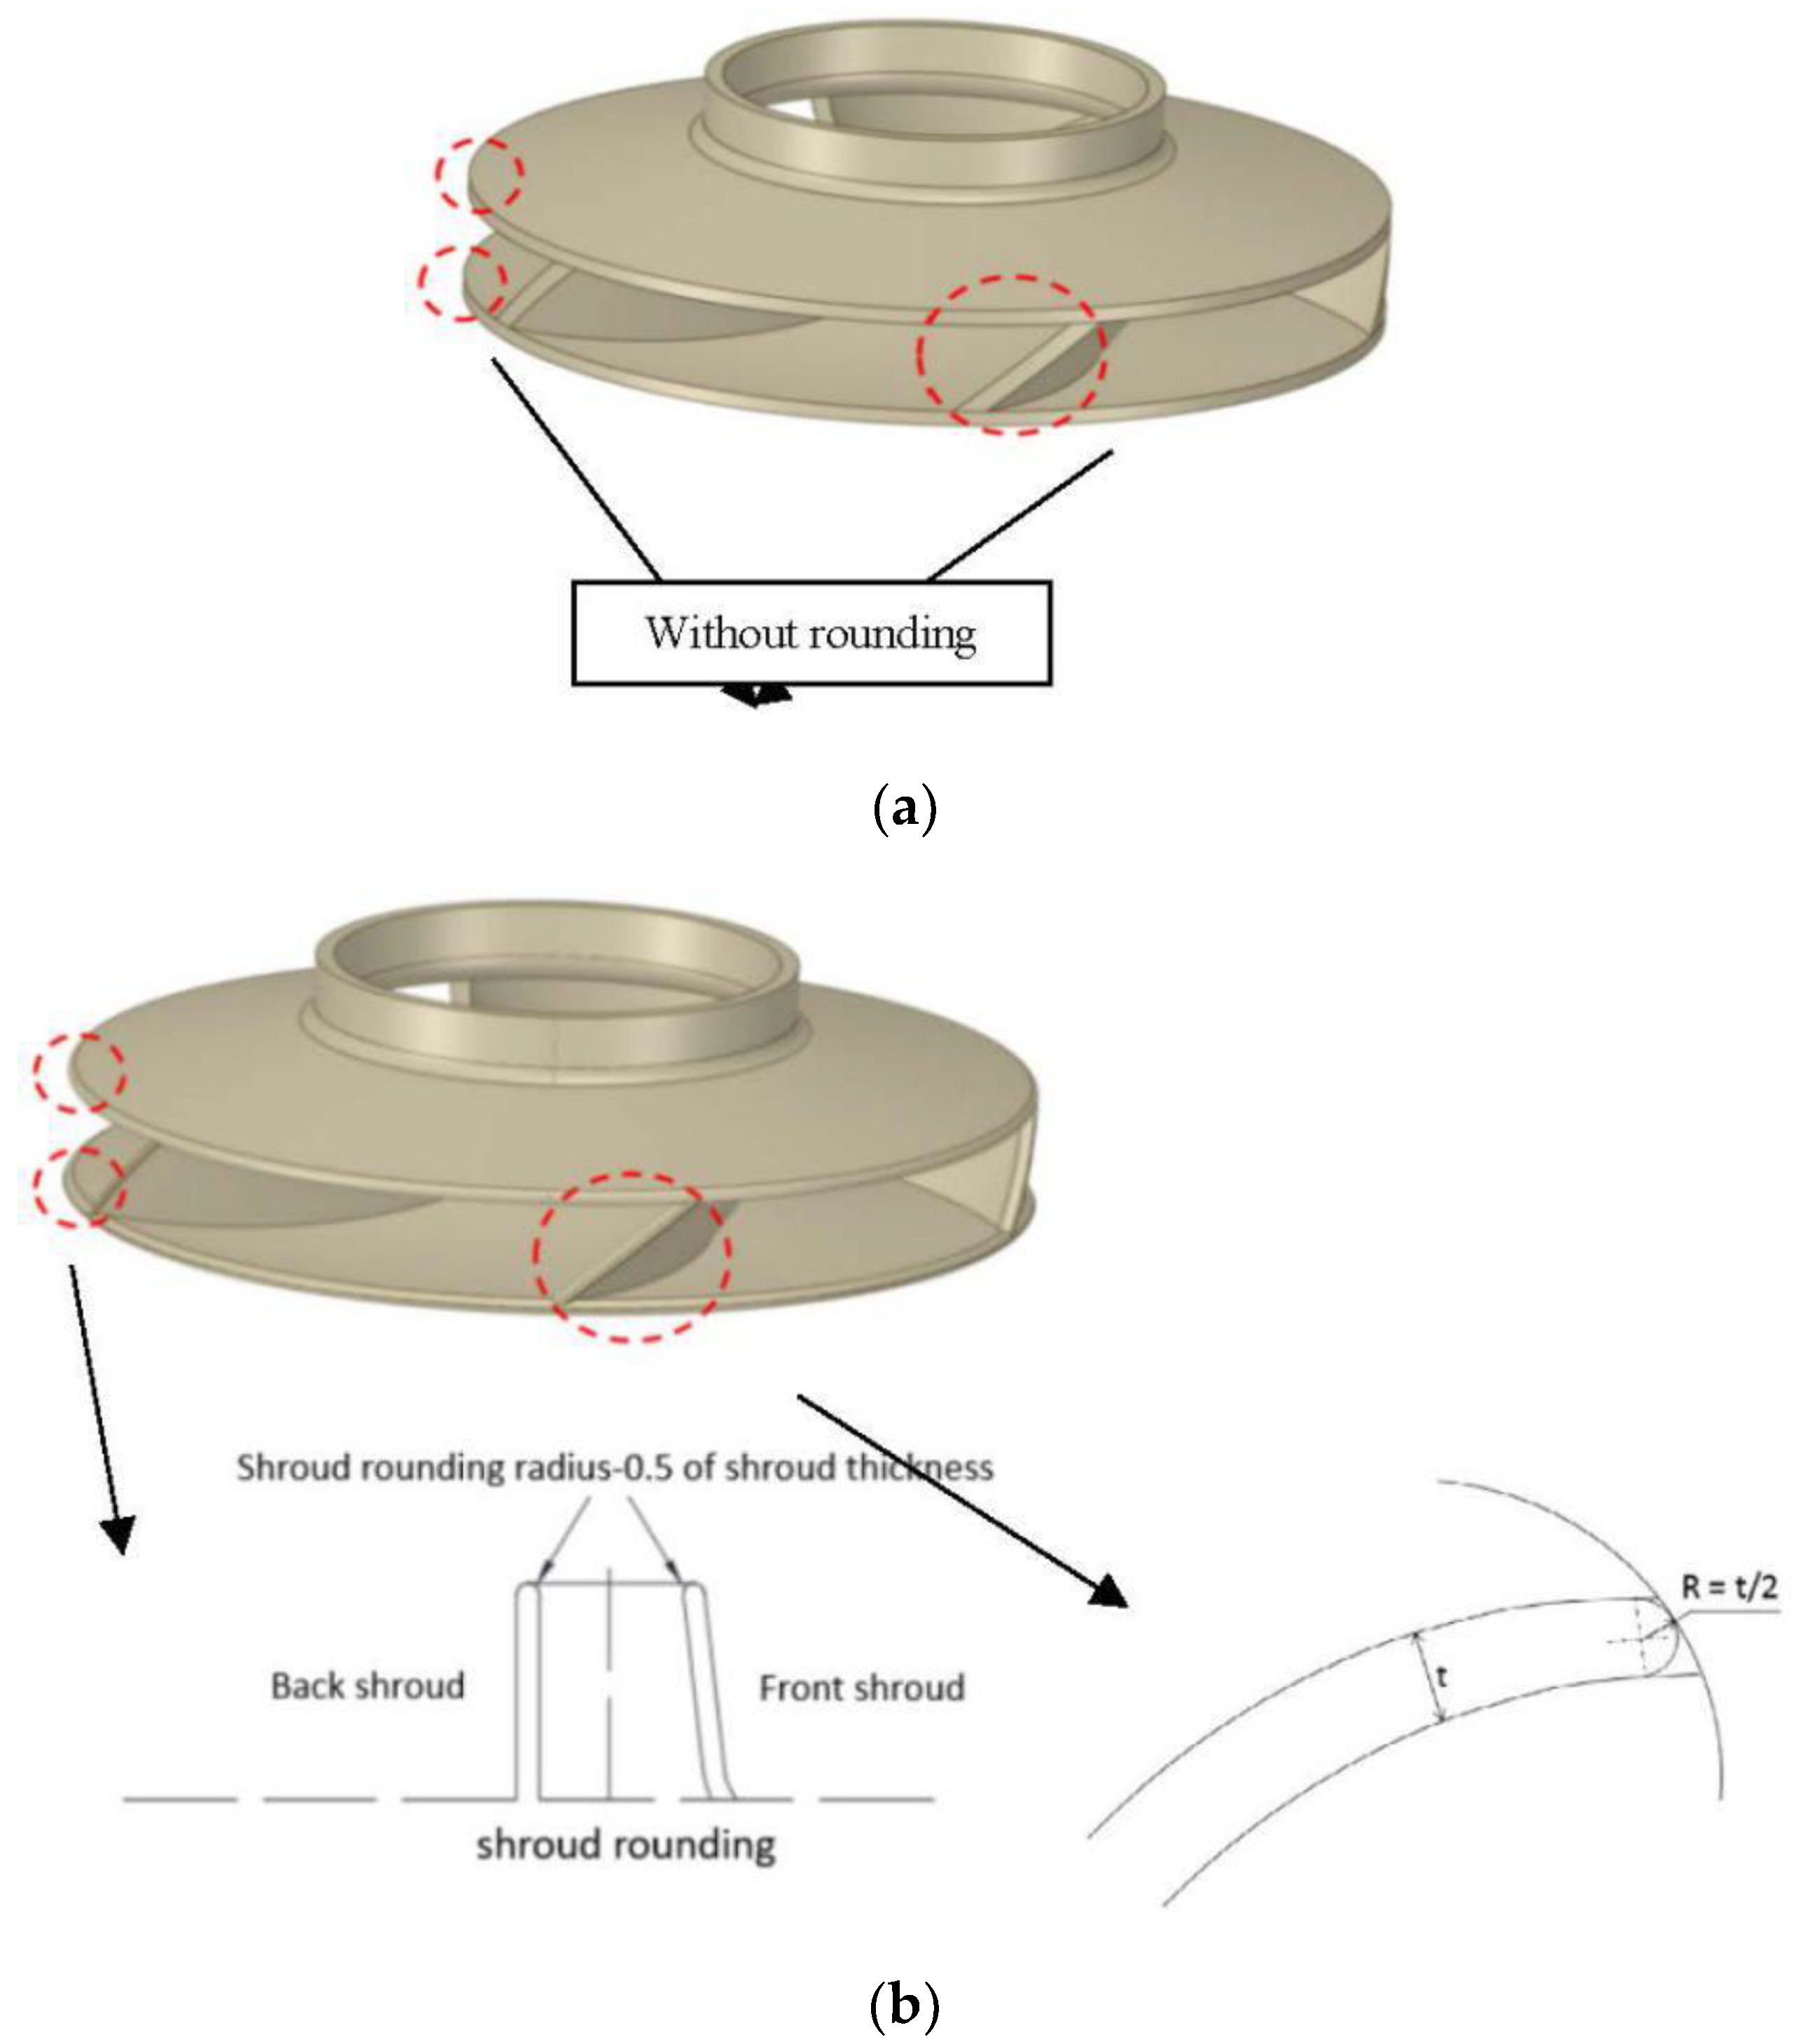
The modified part is to round off the edge of the PAT impeller. The rounding of the impeller can be divided into two parts, namely, the blade rounding and the shroud rounding. The radius of rounding is half of the thickness of the blade and shroud, respectively. The modification to the impeller is shown in Figure 5.
3.2.2. Flow Region and Grid Generation
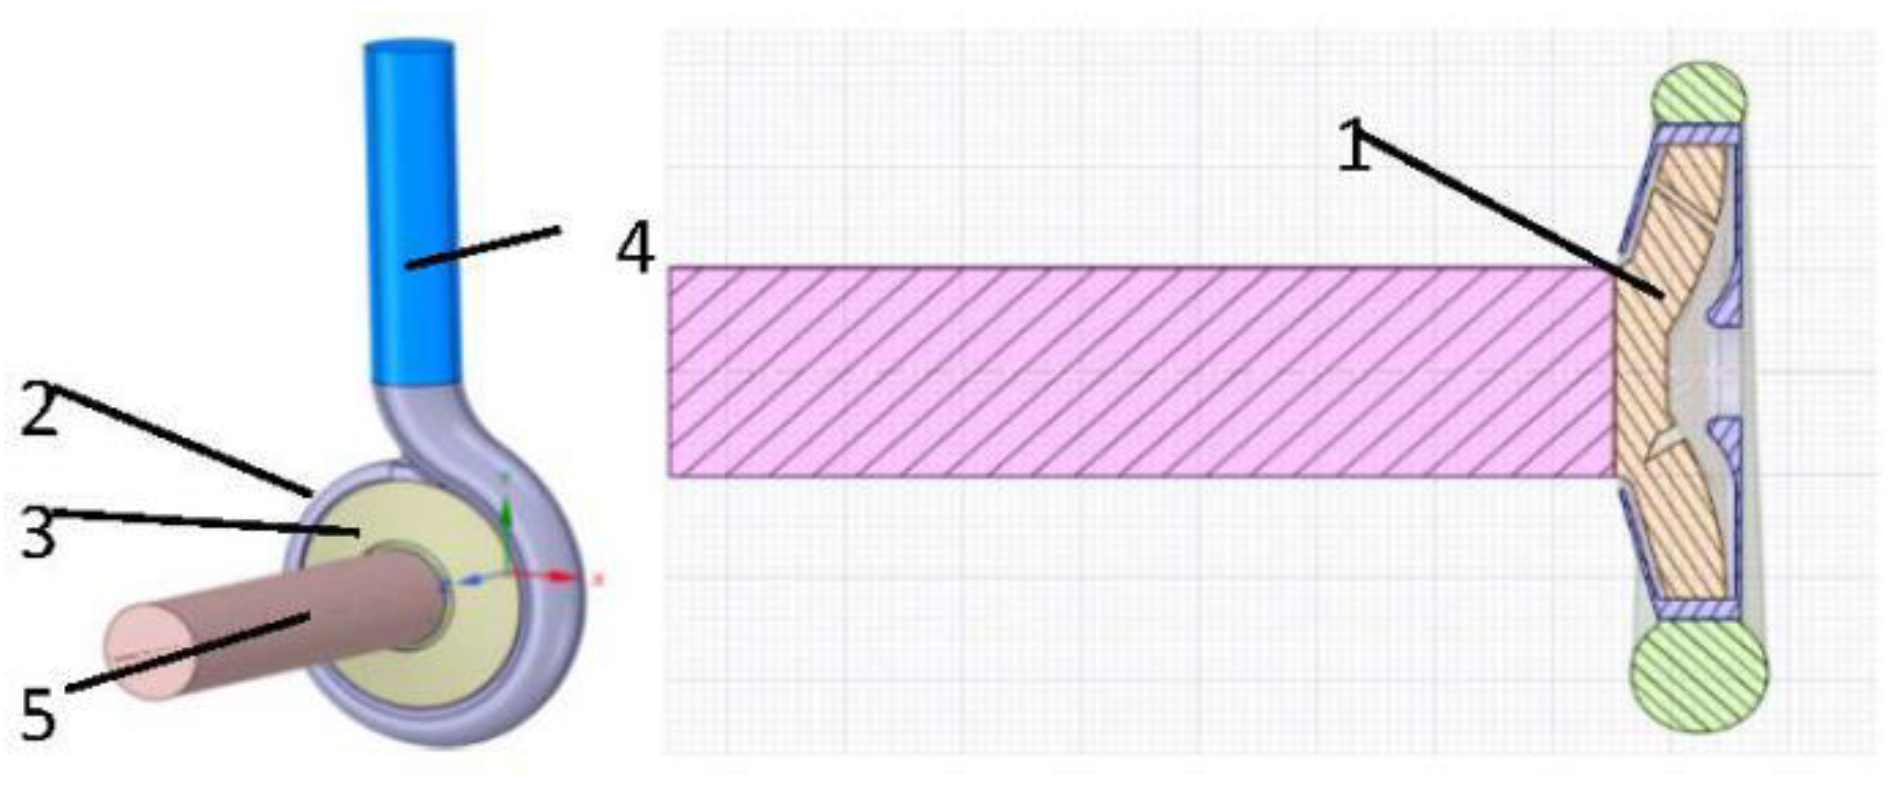
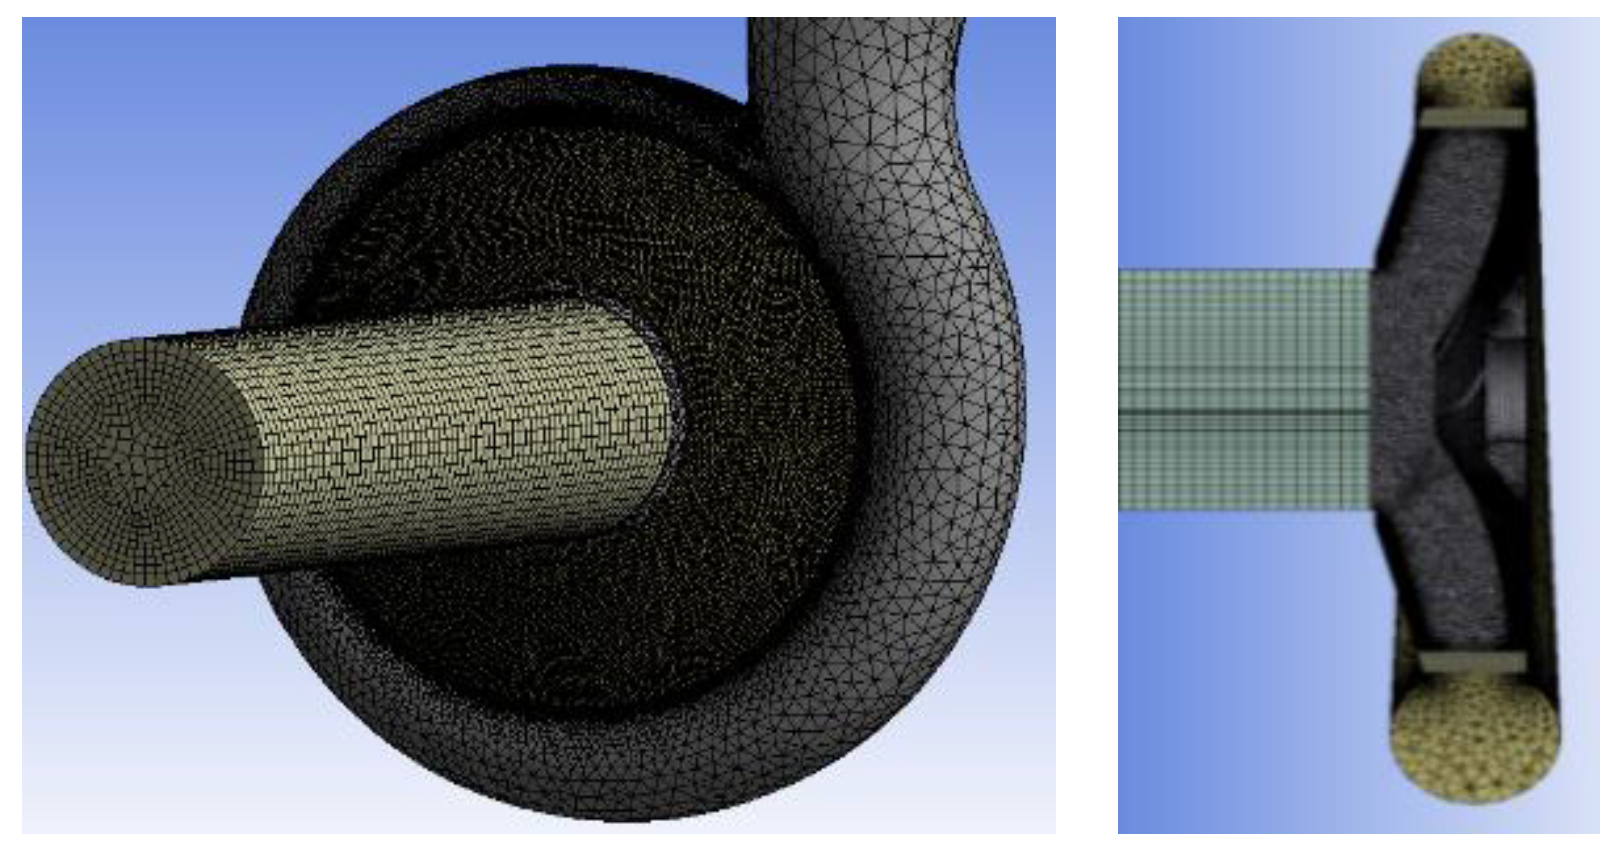
In FLUENT 18.2, the flow region of the PAT required for the simulation is extracted. As shown in Figure 6, the fluid was split into five component parts; these were volute, impeller, casing, inlet pipe, and outlet pipe. This separation allowed each mesh to be generated individually and tailored to the flow requirements in that particular component, as shown in Figure 7. To get a relatively stable inlet and outlet flow, four times the pipe diameter had been extended in the PAT inlet and outlet section. The number of grids is about 2.15 million.
3.2.3. Setting of Boundary Conditions for Numerical Analysis
The boundary conditions setting in FLUENT 18.2 is shown in Table 2. The numerical analysis uses steady-state simulation and sets the gravity in the reverse direction of y. For the turbulence model, the standard k–ε model is selected. The material of the fluid is set as water with normal temperature, and the surface roughness of all walls in the flow region is set to 50 micrometers. The boundary conditions of the inlet and outlet are the mass flow inlet and the pressure outlet, and the corresponding simulation results are obtained by the change of the mass flow; finally, the performance curve can be drawn.
Three fixed speeds of 1000 rpm, 1250 rpm, and 1500 rpm are selected for numerical simulation [7]. The reason for this choice is that, when used as a generator in the actual situation, it is always matched with a four-pole induction generator, and its rated speed is 1500 rpm. However, due to the influence of part-load conditions in actual situations, the rated speed may not be reached. Therefore, in order to test the effect of impeller rounding more comprehensively, three representative rotation speeds in the wide speed range of 1000 rpm to 1500 rpm were selected for testing.
3.2.4. Description of Performance Evaluation Parameters
When evaluating the performance of PAT, the three main parameters are water head, shaft power, and efficiency, among which efficiency is the most important parameter.
Herein, the head is indicated by H with the unit of meter. The head of the pump represents the effective energy provided by the pump to the liquid per unit weight, while the head of the PAT is the opposite. The head of the PAT represents the effective energy provided by the unit weight of water to the PAT. As shown in Equation (1), when the density and the acceleration of gravity are constant, the pressure difference between the inlet and outlet of the PAT obtained in FLUENT 18.2 is required when calculating the head [26].
The shaft power of the PAT represents the power output from the axial rotation of the impeller when the water flowing through the PAT drives the impeller to rotate. The shaft power is indicated by pshaft with the unit of pascal. It can be calculated by multiplying the torque value in the simulation result and the angular velocity of the impeller rotation.
Efficiency is the most important parameter. PAT efficiency is the ratio of shaft power to total input power; it is indicated by η [27]. As shown in Equation (7), when the flow rate is constant, it can be calculated by substituting the shaft power and the head.
Defining head:
Then, the efficiency:
4. Results and Discussion
4.1. Draw Performance Curves by Changing the Flow Rate
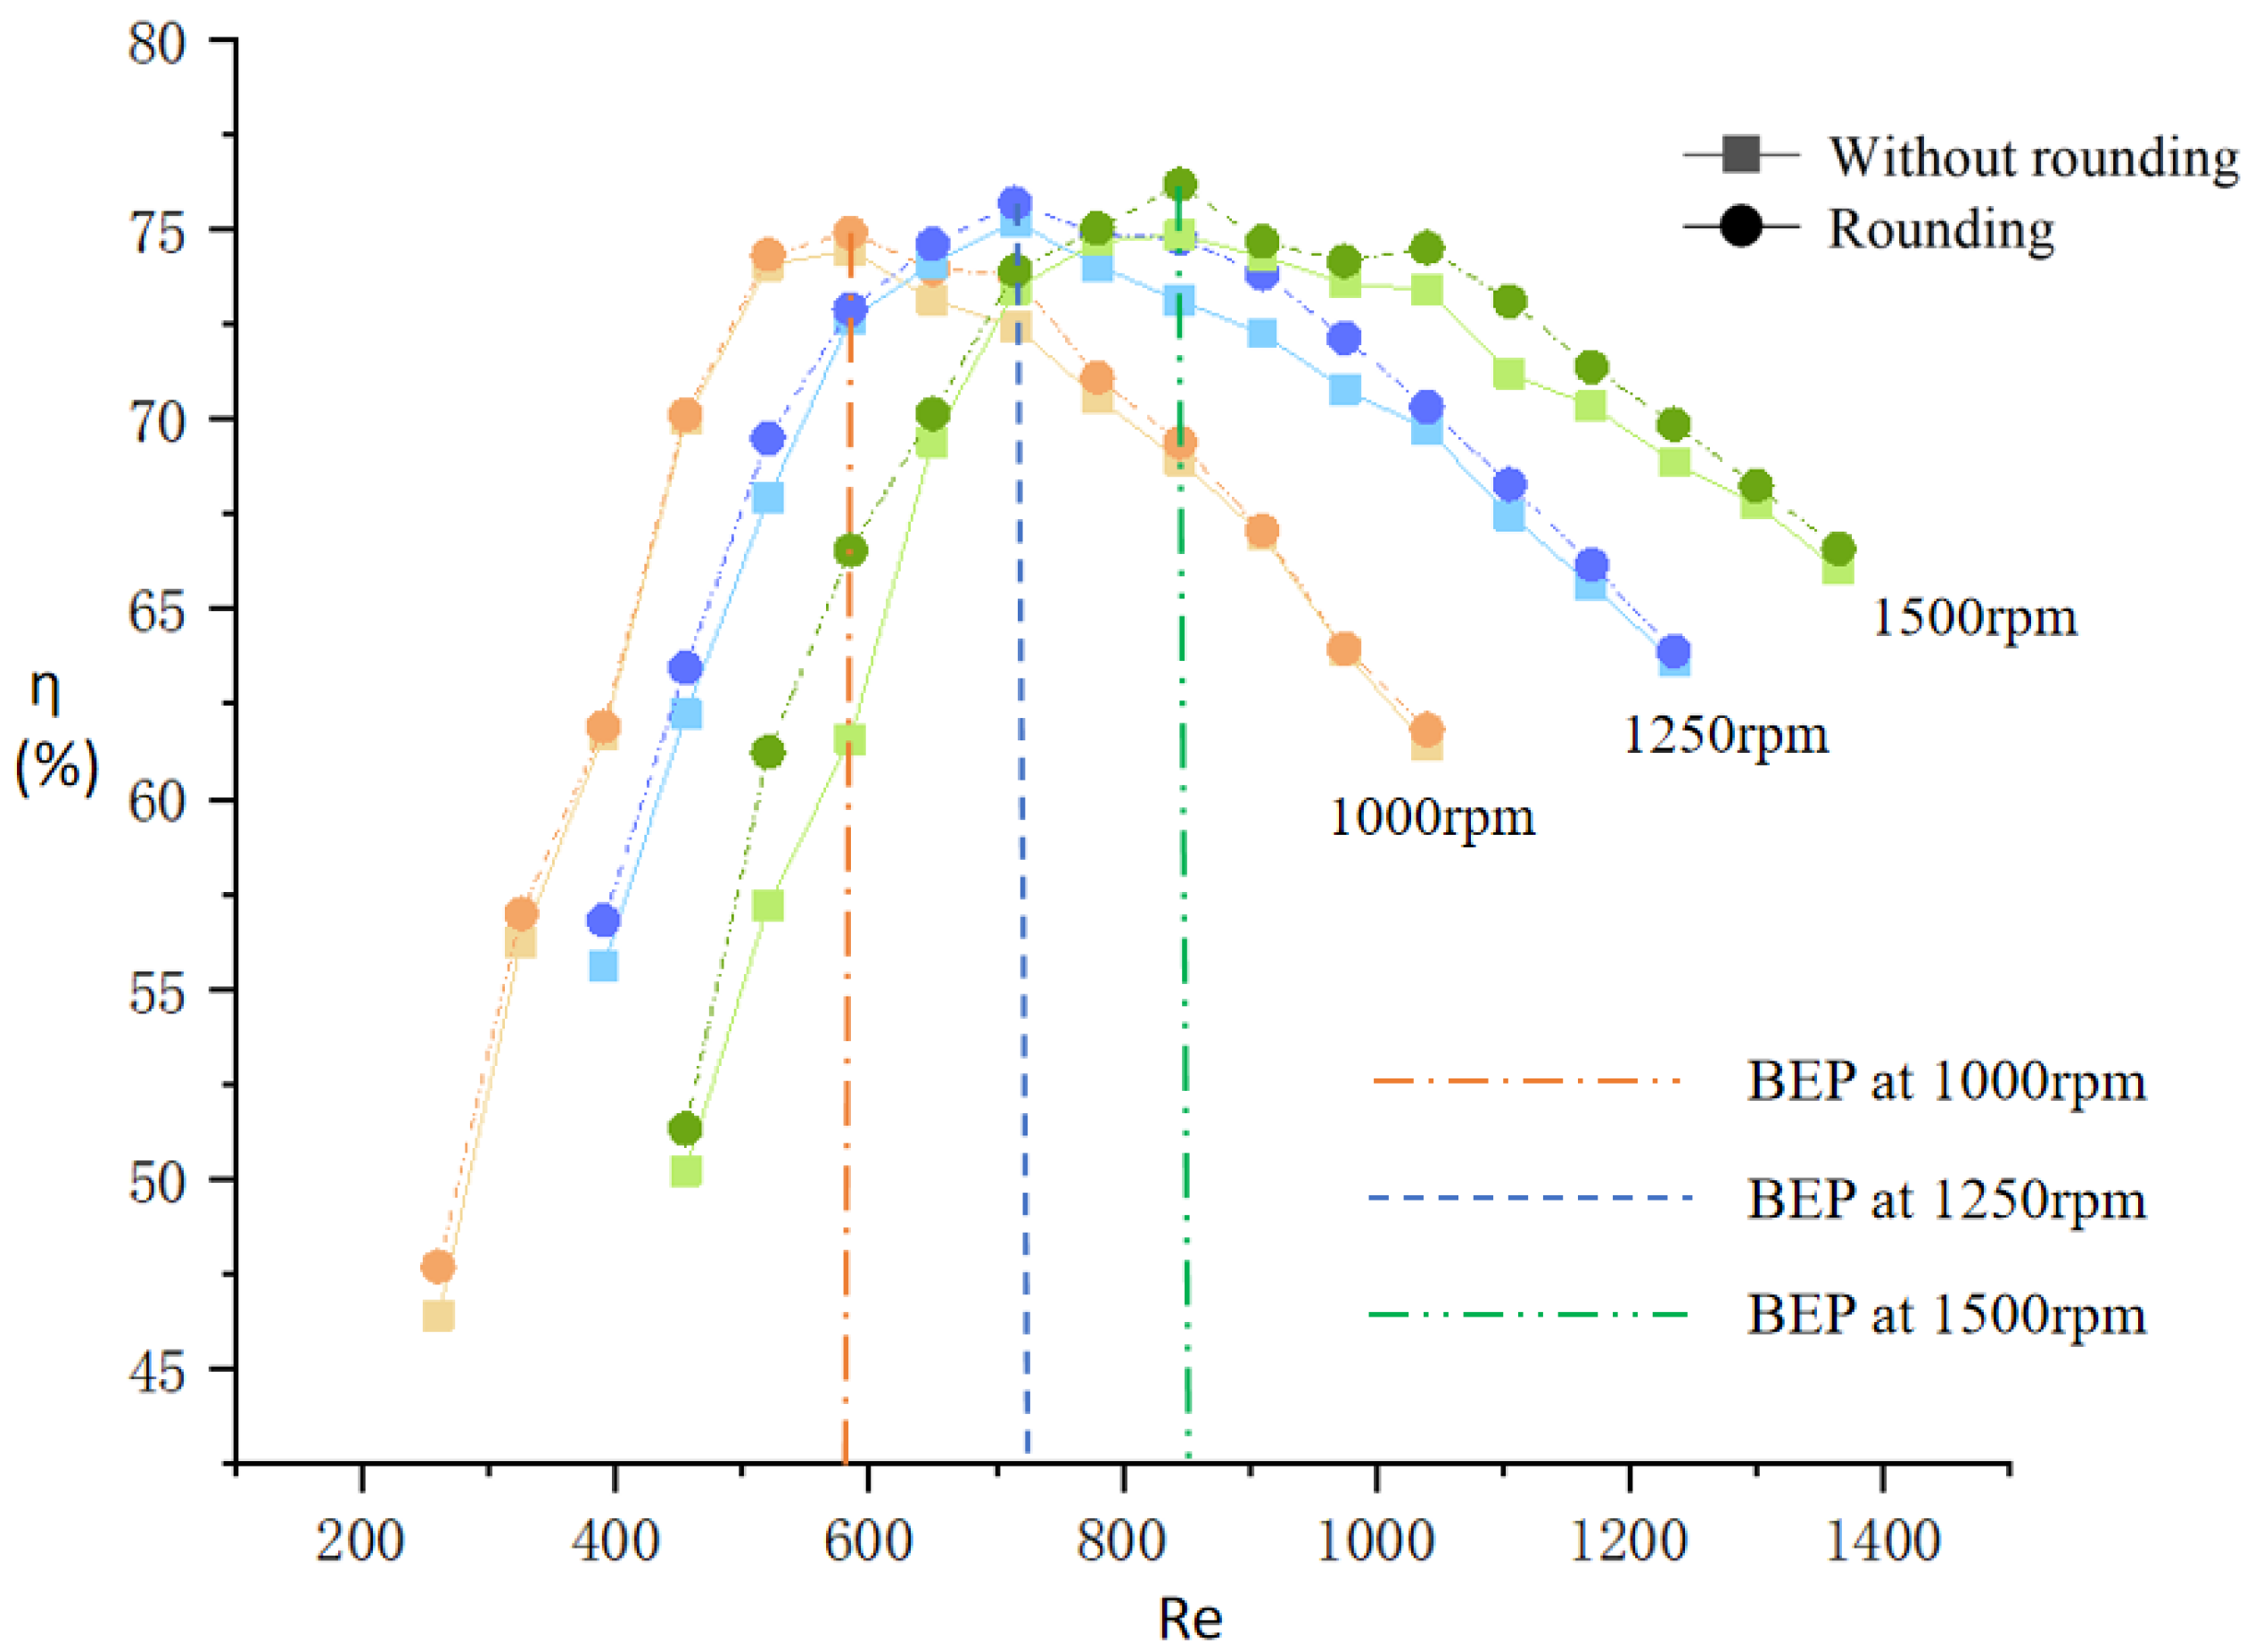
In this study, three representative speeds are selected for the performance test. Under these three rated speeds, the head, shaft power, and efficiency are obtained by changing the inlet mass flow, and then the efficiency curve is drawn. The calculated values of head, shaft power, and efficiency under various working conditions have been recorded in Table 3, Table 4 and Table 5. According to the expression of Reynolds number, the Reynolds number under various conditions is calculated. The efficiency curve is shown in Figure 8.
In the form of fixed Reynolds number, the effects on the efficiency of the two models before and after rounding are compared. Firstly, the Reynolds number of the model before rounding is calculated, and the Reynolds number of the rounding model is fixed to be the same as the original model, as shown in Equation (8), derived from and , then, the efficiency and the results before and after rounding are compared.
In Figure 8, the light curve represents the original PAT and the dark curve represents the rounding PAT. Comparing the two curves at the rated speed of 1000 rpm, the figure shows that PAT reaches the best efficiency point (BEP) when the Reynolds number is about 580. Compared with the original PAT, the efficiency of the PAT after impeller rounding has been improved in the entire flow rate range, with an increase of 0.32% to 1.34%. Although the efficiency has been improved under each working condition, the improvement is not obvious. Comparing the two curves at the rated speed of 1250 rpm, the BEP is reached when the Reynolds number is about 720. Compared with 1000 rpm, the Reynolds number needed to reach the optimal efficiency point is increased. Under low flow conditions, the increase in efficiency is small and the minimum increase is only 0.39%. At a higher flow rate, the efficiency can be increased by 2.26%.
It can be seen from the figure that, compared with the results of the previous two rated speed tests, the influence of impeller roundness is the most obvious at 1500 rpm. When the Reynolds number is about 850, the optimal efficiency point is achieved. In the flow range, PAT efficiency can be improved from 0.44% to 8.09%.
4.2. Comparison of Internal Flow Visualization Results
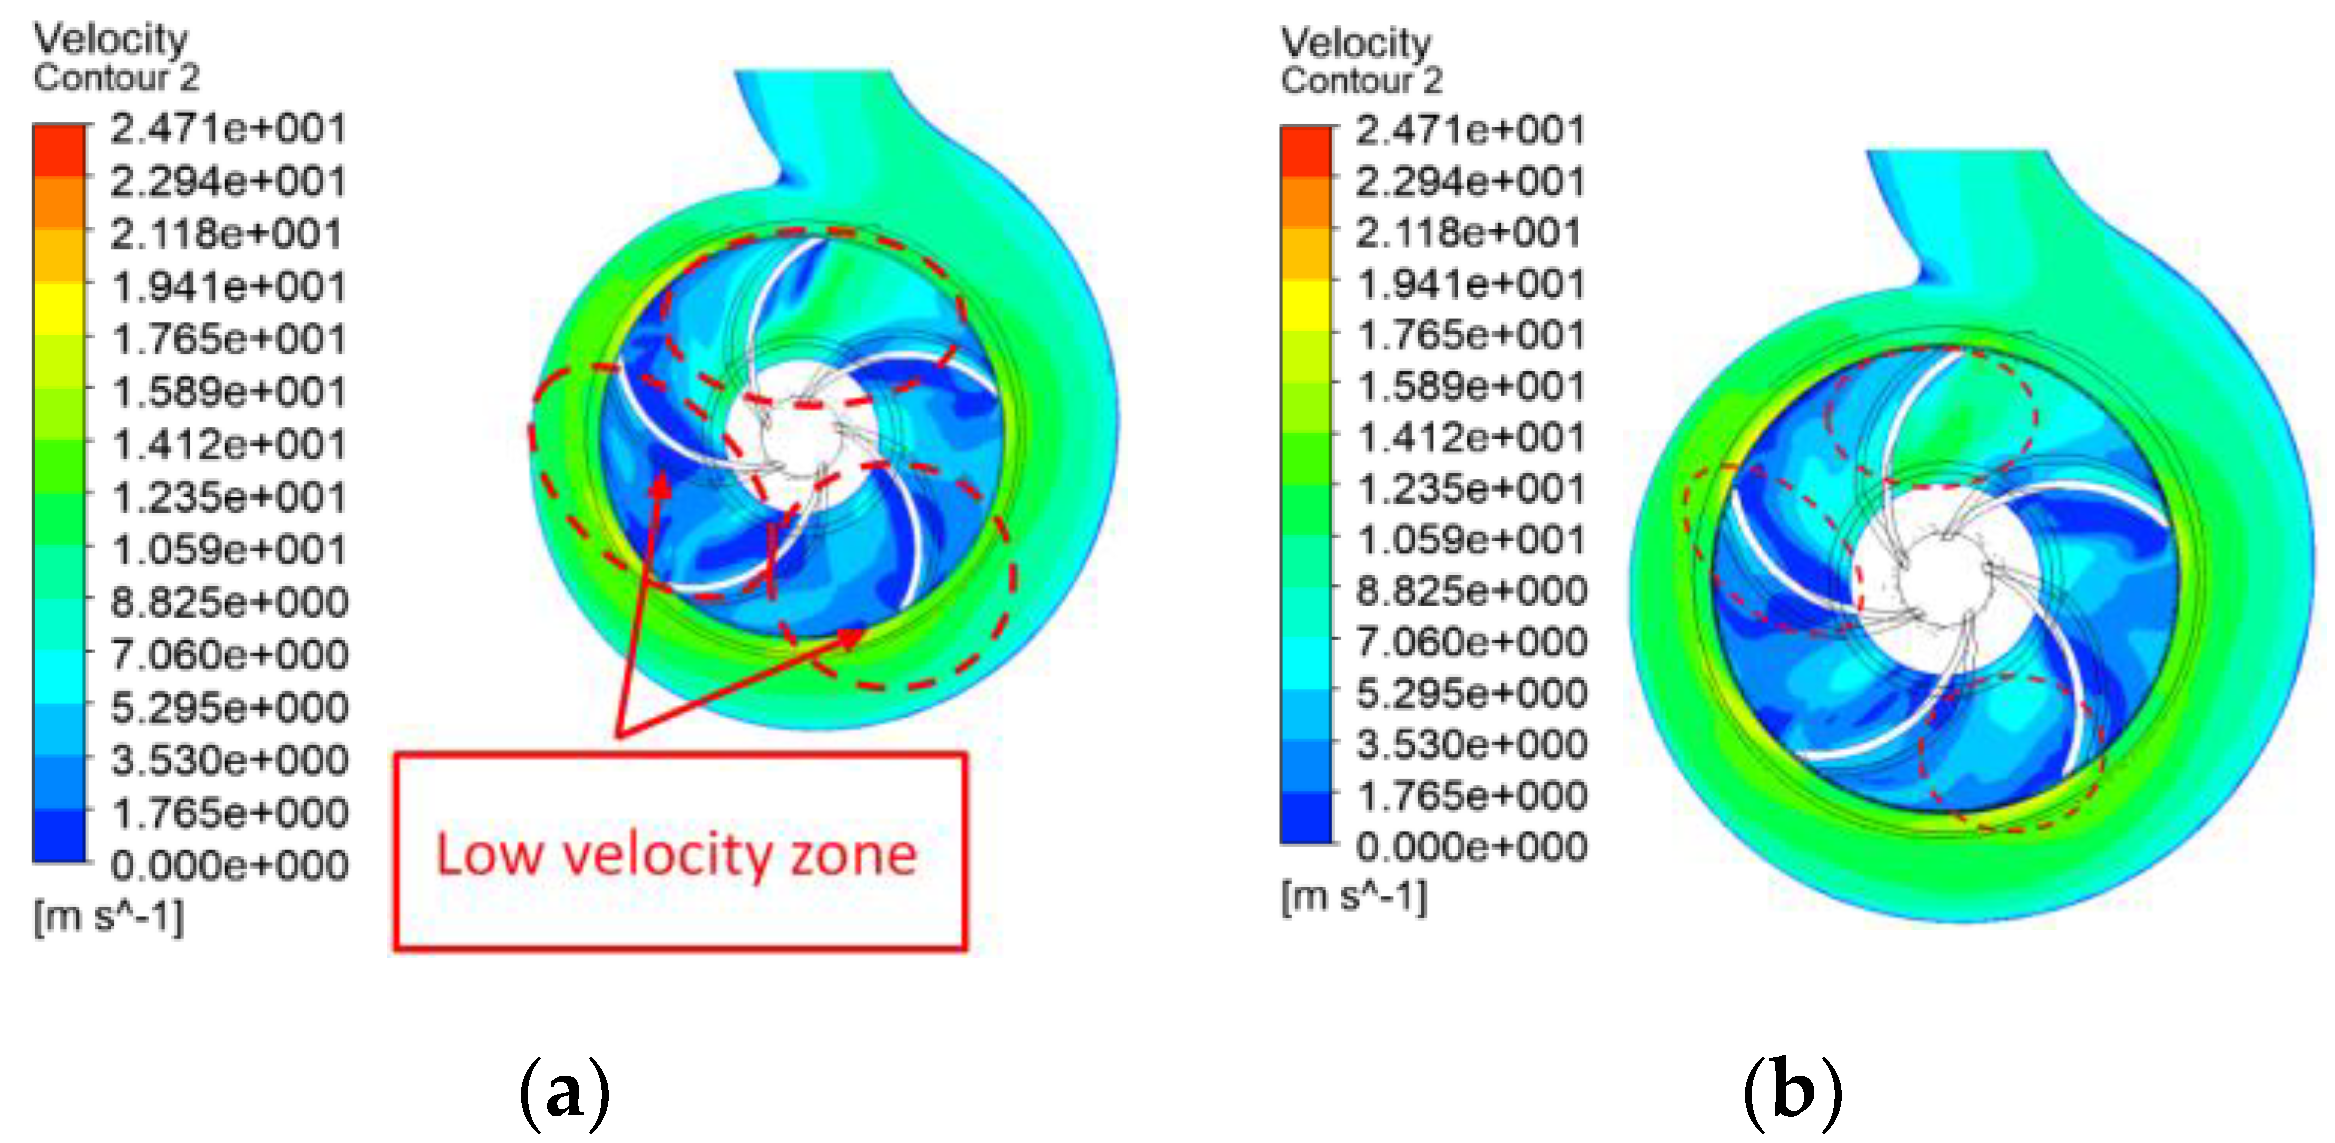
Visualization of internal flow is one of the advantages of CFD simulation. In order to understand the flow situation of water in PAT clearly, the flow situations of the internal flow region before and after the impeller rounding were observed and compared in CFD post-processing. First, a cross-section is provided in the front-view direction of the PAT, and the cross-section is located on the middle surface of the entire PAT. Then, the pressure contour, speed contour, and speed vector on the cross-section are inserted. The internal flow visualization results of PAT at the best efficiency points (BEP) at 1000 rpm, 1250 rpm, and 1500 rpm are selected for comparison.
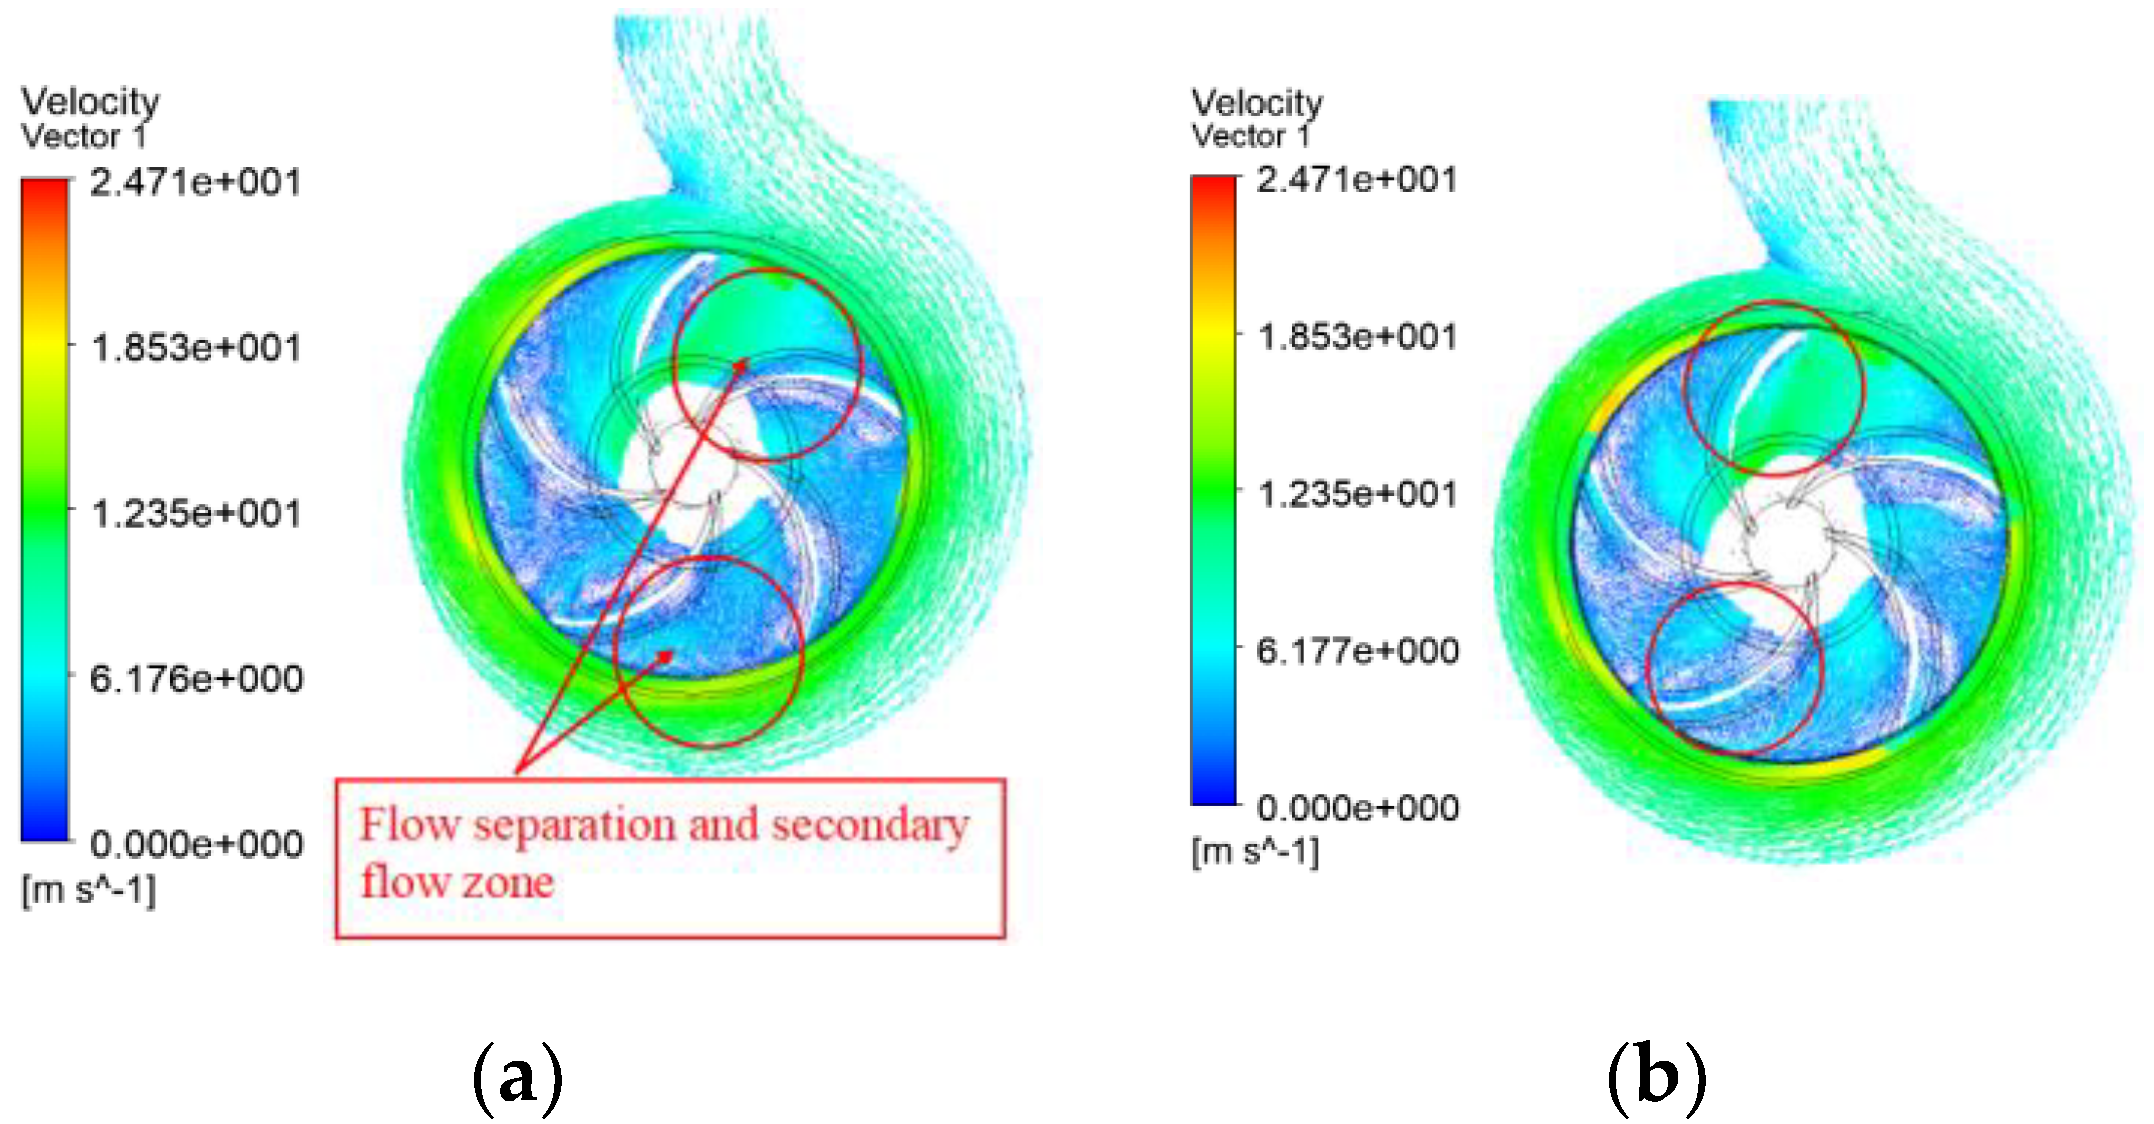
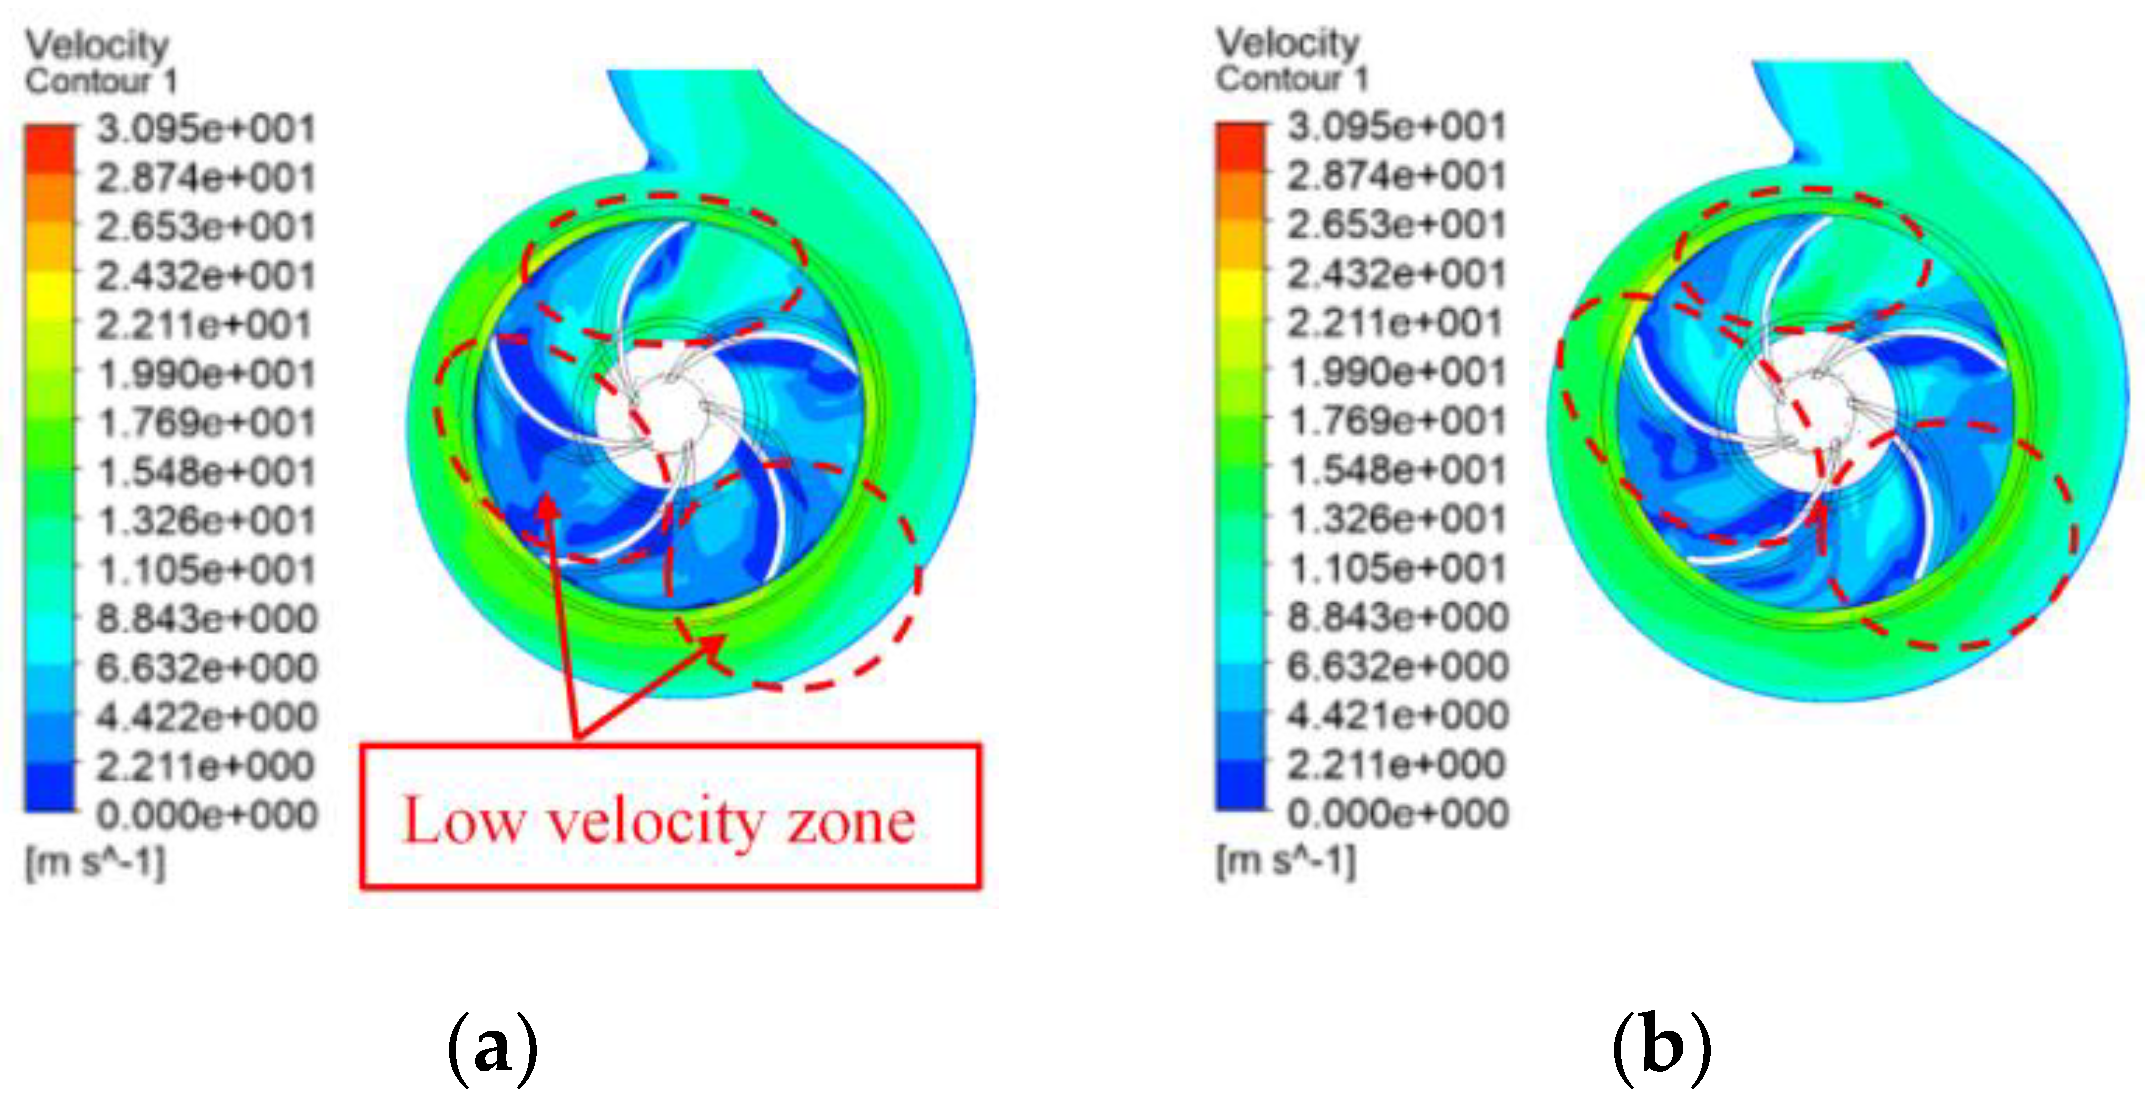
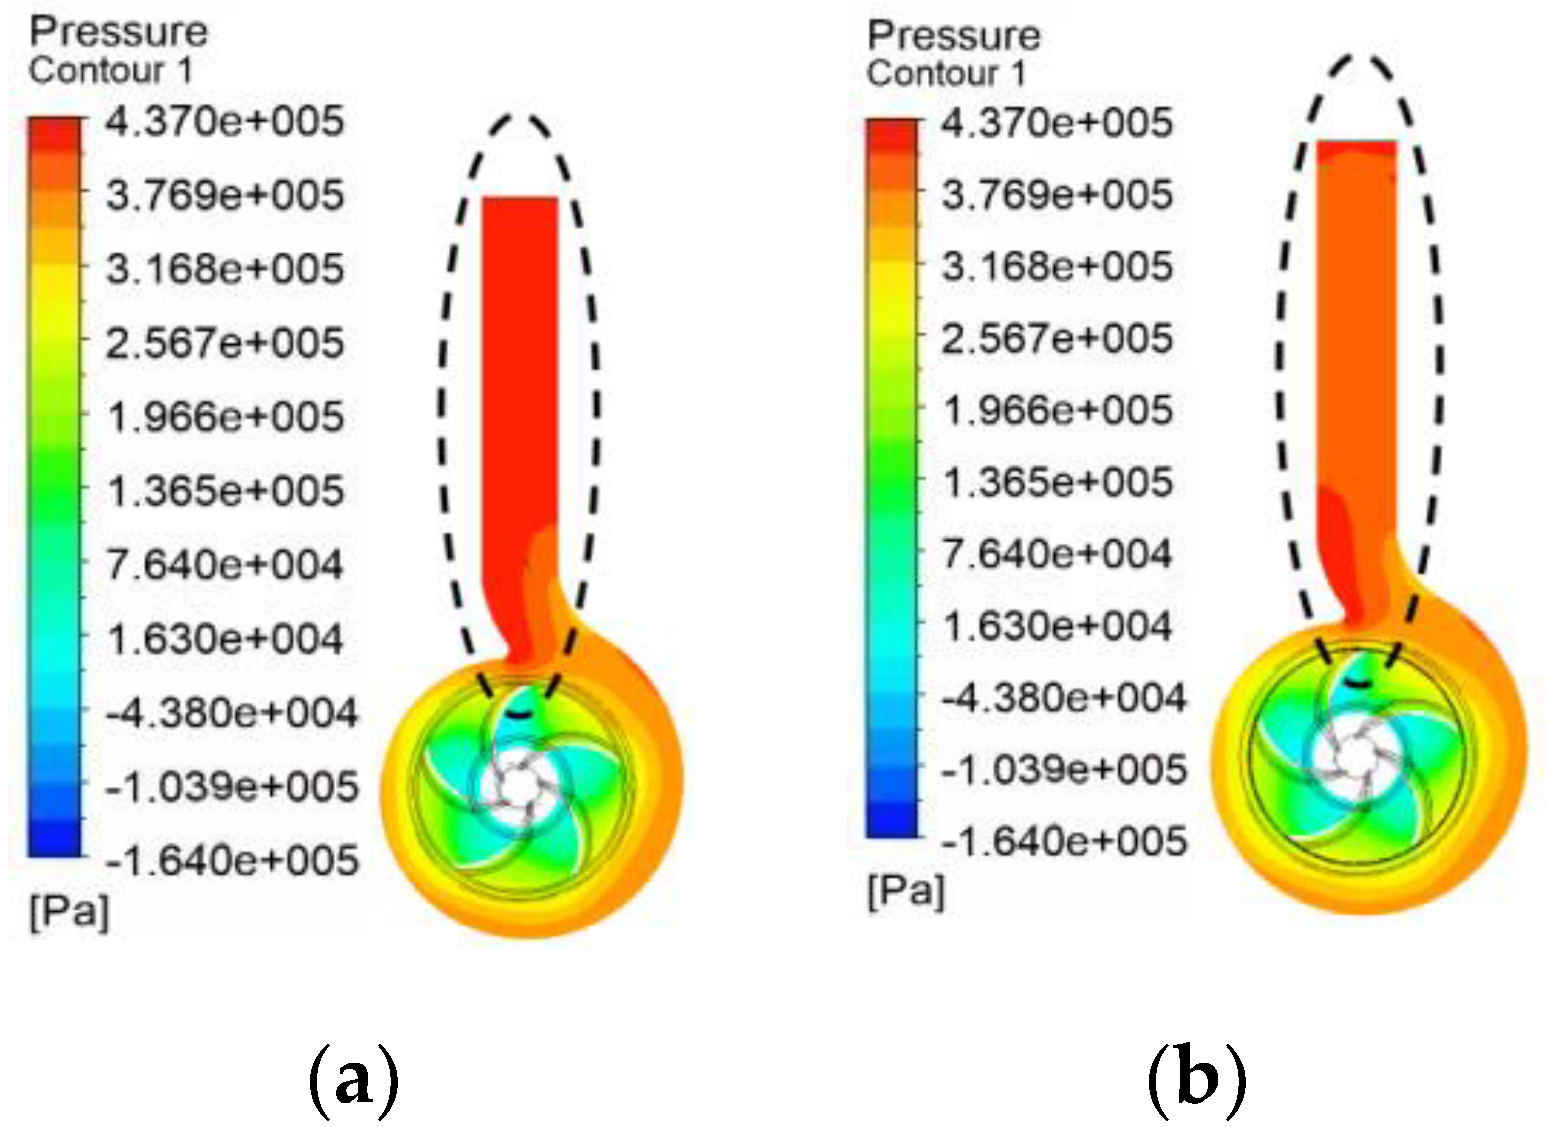
Figure 9, Figure 10 and Figure 11 are pressure contour, speed contour, and speed vector diagrams at 1000 rpm, respectively. It can be observed from the pressure contour in Figure 9 that the rounded impeller PAT has a small pressure gradient at the inlet of the impeller. In Figure 10, the low flow velocity region inside the modified PAT has been reduced, and the velocity distribution inside the impeller has improved. It can be seen in Figure 11 (velocity vector) that the overall flow separation region and secondary flow zones have been reduced to some extent.
The visualization results at 1250 rpm are shown in Figure 12, Figure 13 and Figure 14. It can be seen from the pressure distribution in Figure 12 that the flow obstruction at the entrance of the rounded impeller is reduced. This leads to a pressure reduction in the whole inlet pipe, which reduces the head. The low-speed region in Figure 13 is similar to 1000 rpm, and it is reduced to some extent. The low-velocity zones in Figure 13 are reduced to some extent, which is similar to the 1000 rpm. The flow separation and secondary flow zones in Figure 14 are also reduced.
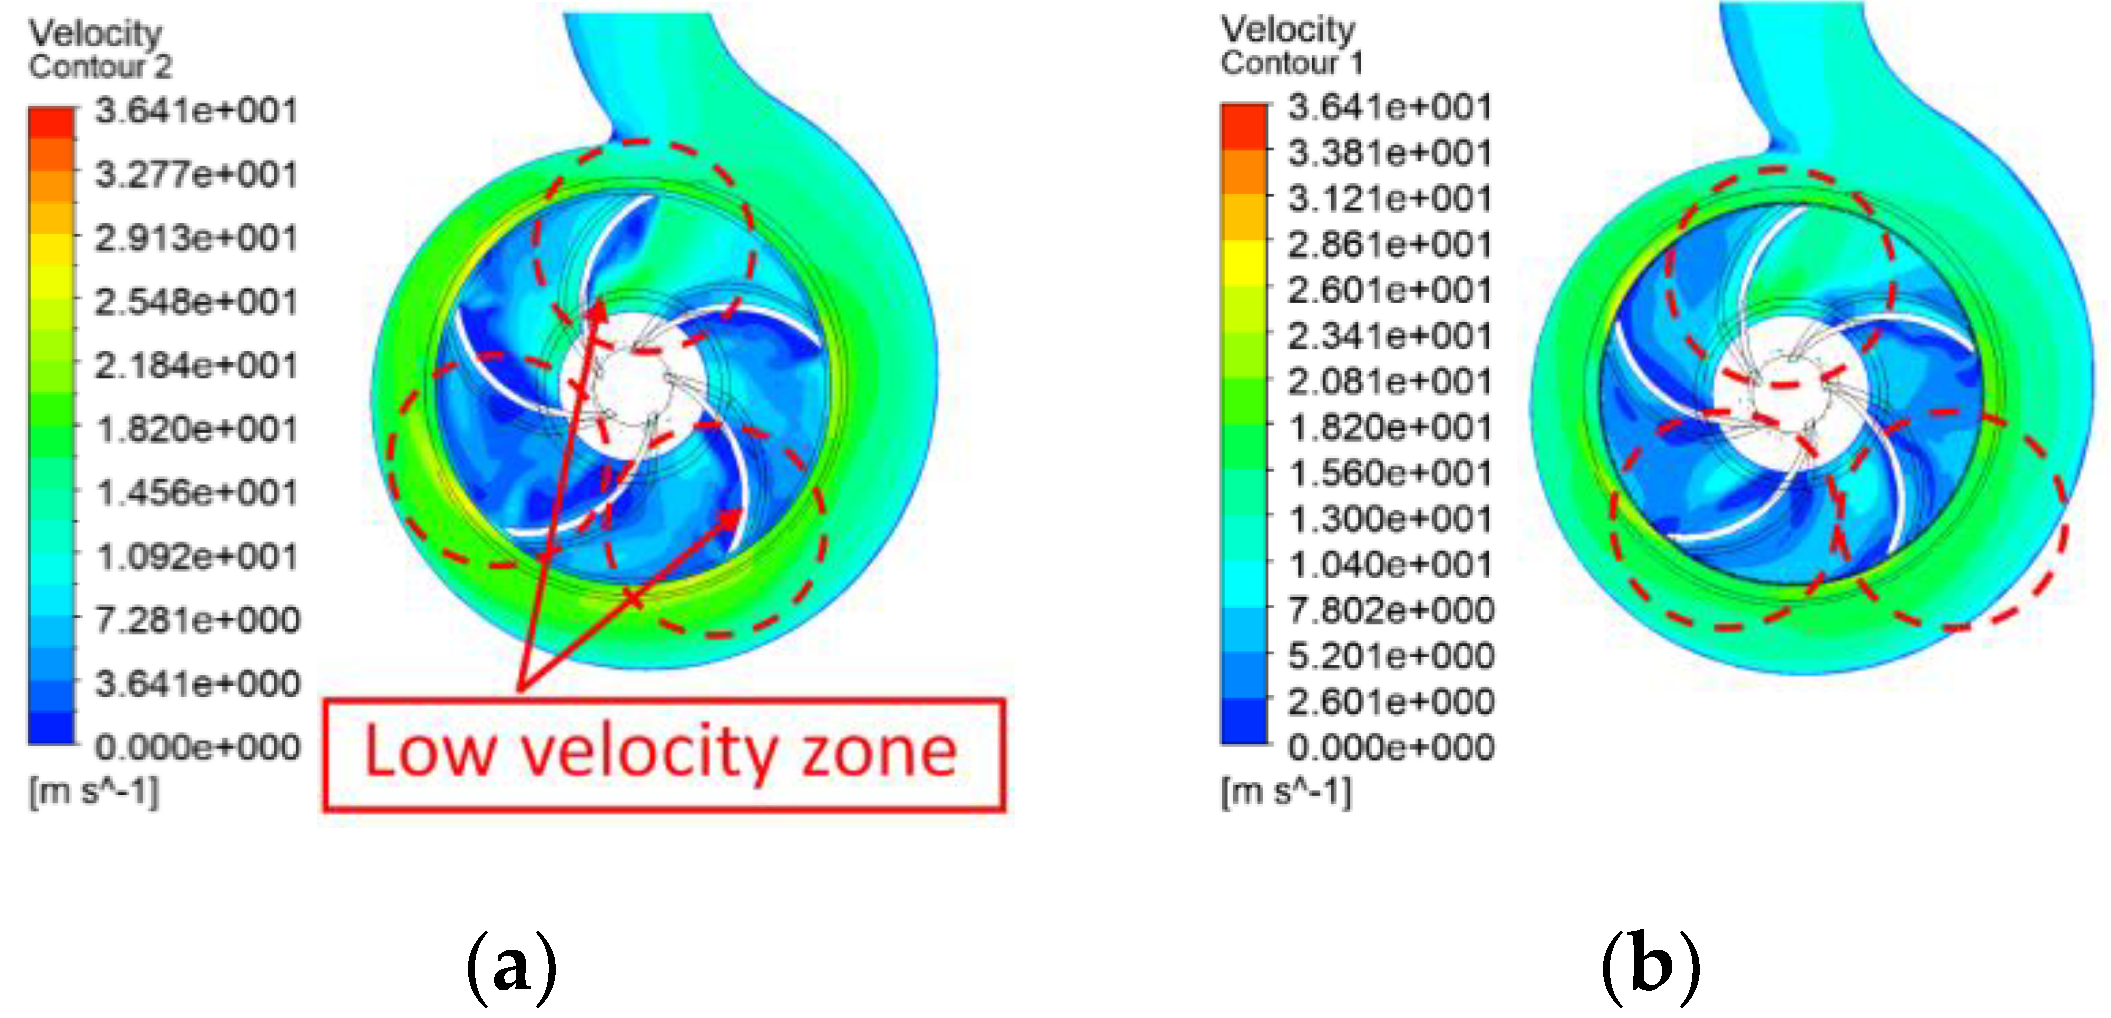
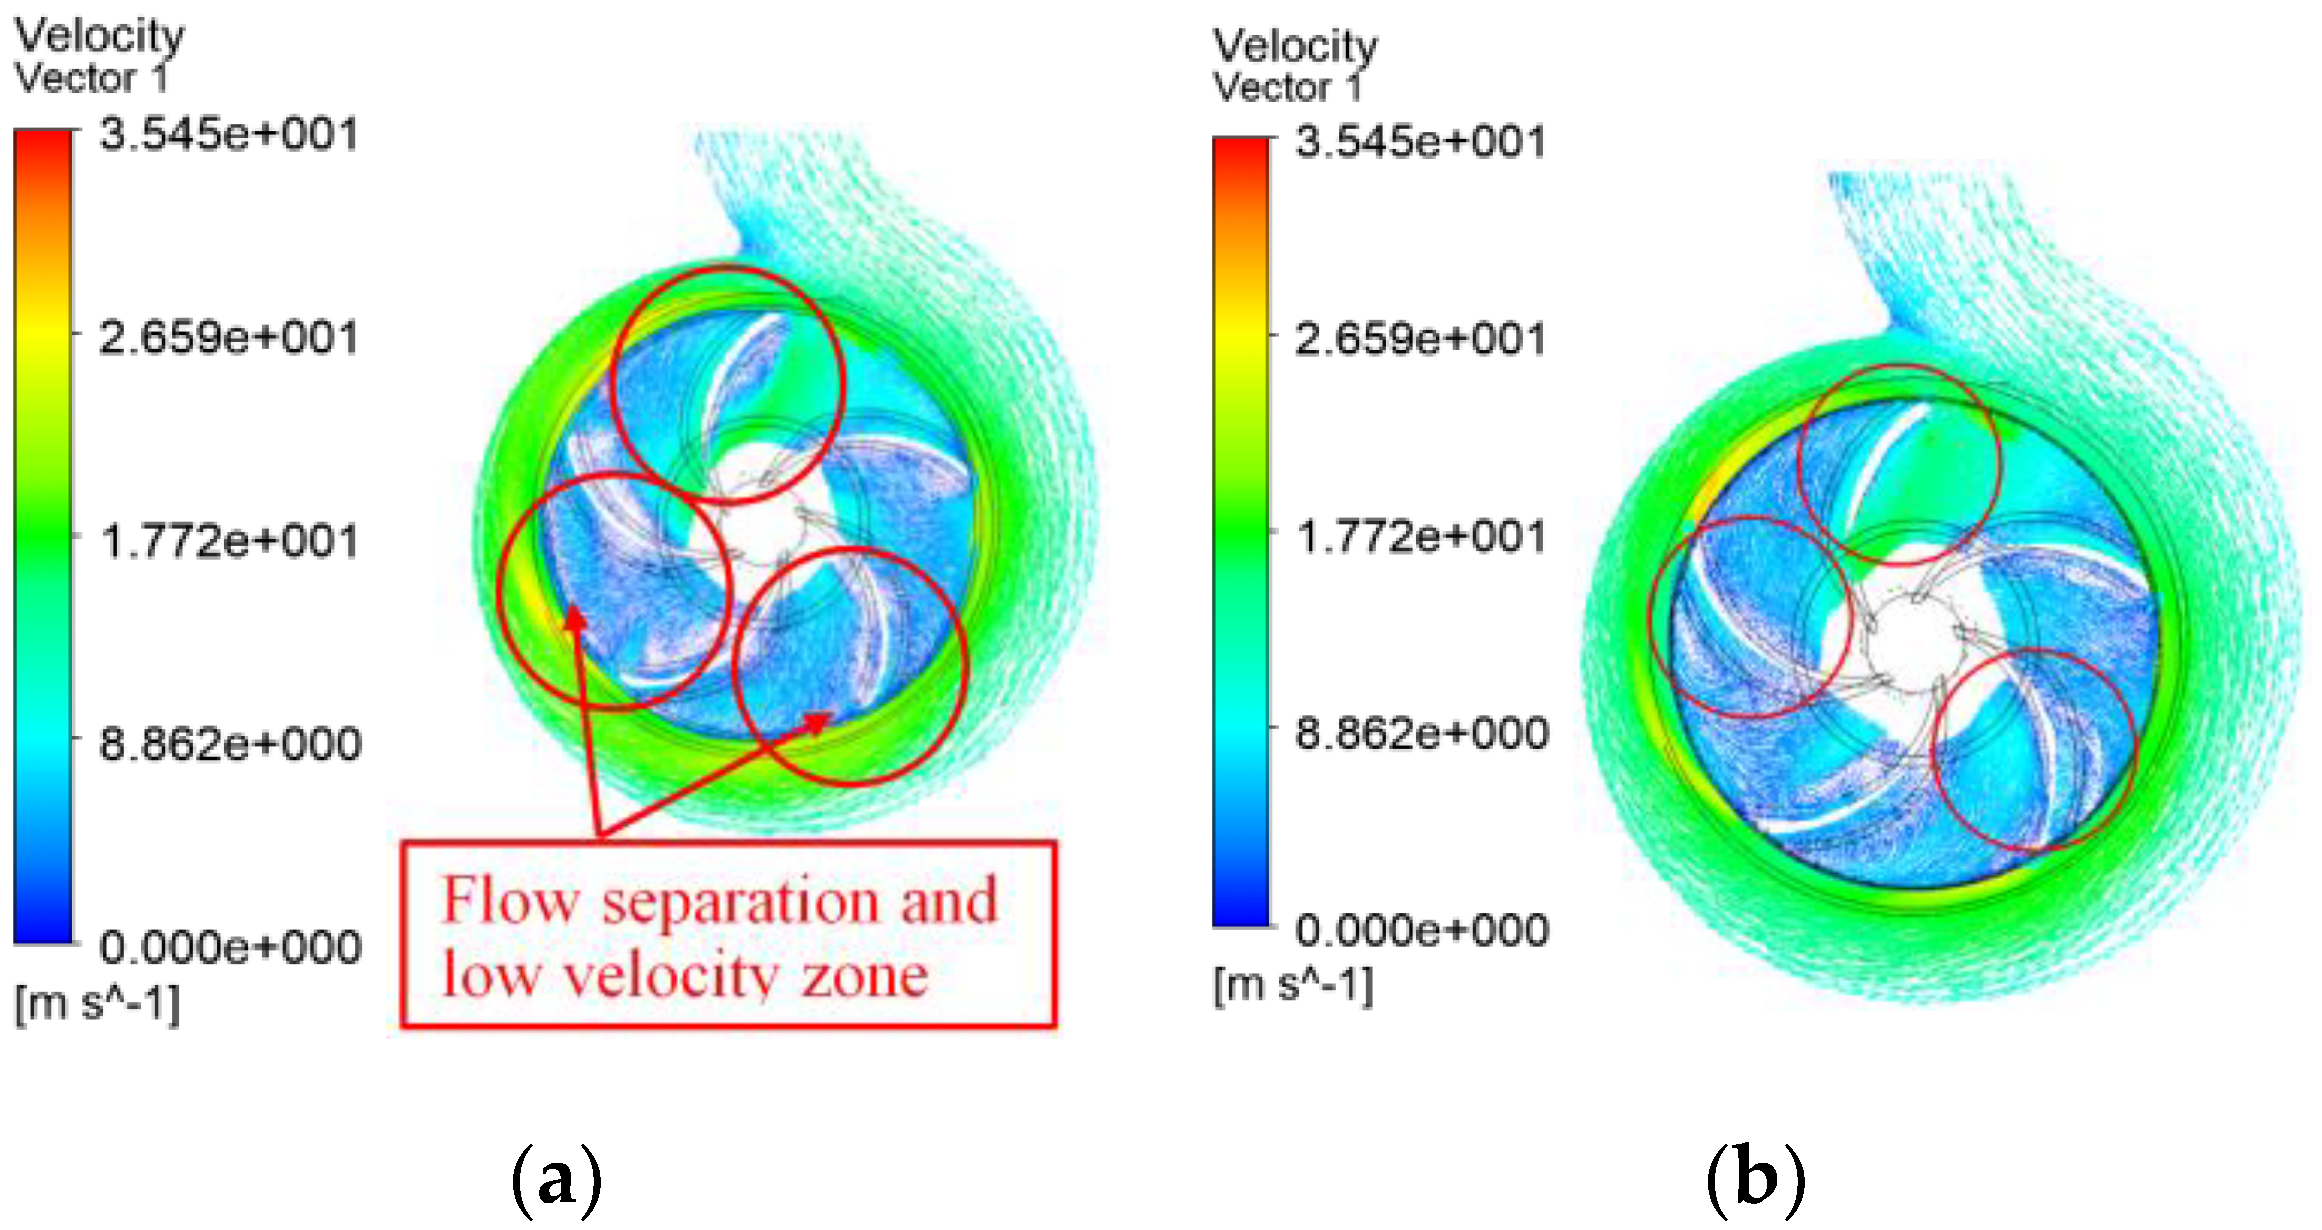
Similar to the pressure distribution at 1250 rpm, when the rated speed is 1500 rpm, the flow obstruction at the inlet of the impeller is also reduced after modification. As shown in Figure 15, the pressure in the whole inlet pipe becomes lower. It can be observed in Figure 16 that the velocity distribution between each blade is almost improved. Compared with the original model, the velocity distribution after impeller rounding is more uniform. Figure 17 shows that the flow separation regions behind the blade are relatively large at 1500 rpm because of the faster rotating speed, and this situation has been significantly reduced after modification.
Table 6 compares the results of numerical analysis of three different rotating speeds. It can be seen that, as the rotational speed increases, the flow required to achieve best efficiency point (BEP) also increases. At the rotating speed of 1500 rpm, the efficiency improvement range is the greatest. It can be increased by 0.44~0.89% in the whole flow range, and the highest efficiency can reach 76.18%. The reason for the higher efficiency increase at higher speeds is that the flow obstruction at the inlet of the original model impeller is also higher, so the improvement is more obvious after the modification.
5. Conclusions
In this study, the effect of the optimization method ‘Impeller rounding’ on PAT was simulated by CFD numerical analysis. Simulation results show that impeller rounding has improved the efficiency of PAT, and, through the observation of the internal flow region, the reason for the performance improvement has been analyzed. First, compared with the original model, the efficiency of the rounded impeller PAT is improved under all test conditions. In addition, the increase is more obvious at higher rotating speeds. This shows that impeller rounding is very beneficial for the common PAT with small diameter and high rotating speed.
The reason for the increase in efficiency is that, in terms of shaft power, the head is reduced in almost all operating conditions. In addition, when both the shaft power and the head are reduced, the head is reduced more, which leads to an increase in efficiency. The reduced flow obstruction at the entrance of the modified impeller is the main reason for the head drop, which shows that water passes better when passing through the rounded impeller. It can be observed from the visualization results that the pressure distribution inside the rounded impeller is more uniform, and the wakes and secondary flow are also reduced. CFD and flow visualization results have important reference significance for the study of the effect of impeller rounding on PATs.
Author Contributions
Conceptualization, H.Y.; methodology, H.Y. and J.D.; software, L.Z. and H.X.; validation, L.Z.; analysis, L.Z.; investigation, L.Z. and J.D.; resources, H.Y. and J.D.; writing—review and editing, L.Z., H.X. and F.D.; visualization, L.Z.; supervision, H.Y. and J.D.; project administration, H.Y. All authors have read and agreed to the published version of the manuscript.
Funding
This research was funded by Natural Science Foundation of Shandong Province (grant No. ZR2019MEE102) and the key research and development projects of Shandong Province (grant No. 2018GNC112007).
Institutional Review Board Statement
Not applicable.
Informed Consent Statement
Not applicable.
Data Availability Statement
Not applicable.
Conflicts of Interest
The authors declare no conflict of interest.
References
- Tao, W.; Fanyu, K.; Yuyang, H.; Sunsheng, Y. Researching status of centrifugal pump as turbine. J. Drain. Irrig. Mach. Eng. 2013, 31, 674–680. [Google Scholar]
- Chapallaz, J.M.; Eichenberger, P.; Fischer, G. Manual on Pumps Used as Turbines; Vieweg: Braunchweig, Germany, 1992; Volume 11, ISBN 3-528-02069-5. [Google Scholar]
- Wollerstrand, J. A turbine-driven circulation pump in a district heating substation. In Proceedings of the 22th International Conference on Efficiency, Cost, Optimization Simulation and Environmental Impact of Energy, Foz Do Iguazu, Parana, Brazil, 31 August–3 September 2009. [Google Scholar]
- Jain, S.V.; Patel, R. Investigations on pump running in turbine mode: A review of the state-of-the-art. Renew. Sustain. Energy Rev. 2014, 30, 841–868. [Google Scholar] [CrossRef]
- Dariusz, B.; Tomasz, W. Energy-recovery pressure-reducer in district heating system. Water 2018, 10, 787. [Google Scholar]
- Fontana, N.; Giugni, M.; Portolano, D. Losses Reduction and Energy Production in Water-Distribution Networks. J. Water Resour. Plan. Manag. 2012, 138, 237–244. [Google Scholar] [CrossRef]
- Derakhshan, S.; Nourbakhsh, A. Experimental study of characteristic curves of centrifugal pumps working as turbines in different specific speeds. Exp. Therm. Fluid Sci. 2008, 32, 800–807. [Google Scholar] [CrossRef]
- Chen, F.; Bi, H.; Ahn, S.H.; Mao, Z.; Luo, Y.; Wang, Z. Investigation on Dynamic Stresses of Pump-Turbine Runner during Start Up in Turbine Mode. Processes 2021, 9, 499. [Google Scholar] [CrossRef]
- Shah, S.; Jain, S.; Patel, R.; Lakhera, V. CFD for Centrifugal Pumps: A Review of the State-of-the-Art. Procedia Eng. 2013, 51, 715–720. [Google Scholar] [CrossRef] [Green Version]
- Yang, S.S.; Kong, F.Y.; Qu, X.Y.; Jiang, W.M. Influence of blade number on the performance and pressure pulsations in a pump used as a turbine. J. Fluids Eng. Trans. ASME 2012, 134, 124503. [Google Scholar] [CrossRef]
- Yang, S.S.; Kong, F.Y.; Jiang, W.M.; Qu, X.Y. Effects of impeller trimming influencing pump as turbine. Comput. Fluids 2012, 67, 72–78. [Google Scholar] [CrossRef]
- Singh, P.; Kshirsagar, J.T.; Caglar, S.; Nestmann, F. Experimental and Computational Studies of the Effect of ‘Casing Eye Rib’ on the Swirl Flow at the Exit of a Pump as Turbine. Heat Transf. Summer Conf. 2004, 46911, 85–93. [Google Scholar] [CrossRef]
- Yang, S.S.; Kong, F.Y.; Chen, H.; Su, X.H. Effects of blade wrap angle influencing a pump as turbine. J. Fluids Eng. 2012, 134, 061102. [Google Scholar] [CrossRef]
- Sun-Sheng, Y.; Fan-Yu, K.; Jian-Hui, F.; Ling, X. Numerical Research on Effects of Splitter Blades to the Influence of Pump as Turbine. Int. J. Rotating Mach. 2012, 2012, 1–9. [Google Scholar] [CrossRef] [Green Version]
- Patel, V.; Jain, S.; Motwani, K.; Patel, R. Numerical Optimization of Guide Vanes and Reducer in Pump Running in Turbine Mode. Procedia Eng. 2013, 51, 797–802. [Google Scholar] [CrossRef]
- Zeng, C.; Xiao, Y.; Luo, Y.; Zhang, J.; Wang, Z.; Fan, H.; Ahn, S.H. Soohwang, Hydraulic performance prediction of a prototype four-nozzle Pelton turbine by entire flow path simulation. Renew. Energy 2018, 125, 270–282. [Google Scholar] [CrossRef]
- Zeng, C.; Xiao, Y.; Xu, W.; Wu, T.; Zhang, J.; Wang, Z.; Luo, Y. Numerical analysis of Pelton nozzle jet flow behavior consid-ering elbow pipe. IOP Conf. 2016, 49, 022005. [Google Scholar]
- Sengpanich, K.; Bohez, E.L.; Thongkruer, P.; Sakulphan, K. New mode to operate centrifugal pump as impulse turbine. Renew. Energy 2019, 140, 983–993. [Google Scholar] [CrossRef]
- Wang, X.; Kuang, K.; Wu, Z.; Yang, J. Numerical Simulation of Axial Vortex in a Centrifugal Pump as Turbine with S-Blade Impeller. Processes 2020, 8, 1192. [Google Scholar] [CrossRef]
- Doshi, A.; Channiwala, S.; Singh, P. Inlet impeller rounding in pumps as turbines: An experimental study to investigate the relative effects of blade and shroud rounding. Exp. Therm. Fluid Sci. 2017, 82, 333–348. [Google Scholar] [CrossRef]
- Singh, P.; Nestmann, F. Internal hydraulic analysis of impeller rounding in centrifugal pumps as turbines. Exp. Therm. Fluid Sci. 2011, 35, 121–134. [Google Scholar] [CrossRef]
- Wang, T.; Kong, F.; Xia, B.; Bai, Y.; Wang, C. The method for determining blade inlet angle of special impeller using in turbine mode of centrifugal pump as turbine. Renew. Energy 2017, 109, 518–528. [Google Scholar] [CrossRef]
- Yang, J.H.; Ma, J.X.; Zhang, R.H.; Wang, C.L. Influence of blade tip rounding on performance of axial flow pump. J. Lanzhou Univ. Technol. 2007, 5, 062011. [Google Scholar]
- Ji, B.; Luo, X.; Wu, Y.; Peng, X.; Xu, H. Partially-Averaged Navier- Stokes method with modified k-∊model for cavitating flow around a marine propeller in a non-uniform wake. Int. J. Heat Mass Transf. 2012, 55, 6582–6588. [Google Scholar] [CrossRef]
- Singh, P.; Nestmann, F. An optimization routine on a prediction and selection model for the turbine operation of centrifugal pumps. Exp. Therm. Fluid Sci. 2010, 34, 152–164. [Google Scholar] [CrossRef]
- Derakhshan, S.; Mohammadi, B.; Nourbakhsh, A. Efficiency Improvement of Centrifugal Reverse Pumps. J. Fluids Eng. 2009, 131, 021103. [Google Scholar] [CrossRef]
- Liu, M.; Tan, L.; Cao, S. Theoretical model of energy performance prediction and BEP determination for centrifugal pump as turbine. Energy 2019, 172, 712–773. [Google Scholar] [CrossRef]
Figure 1.
Design of impeller rounding. (a) Section of the impeller front view; (b) section of the impeller side view.
Figure 1.
Design of impeller rounding. (a) Section of the impeller front view; (b) section of the impeller side view.

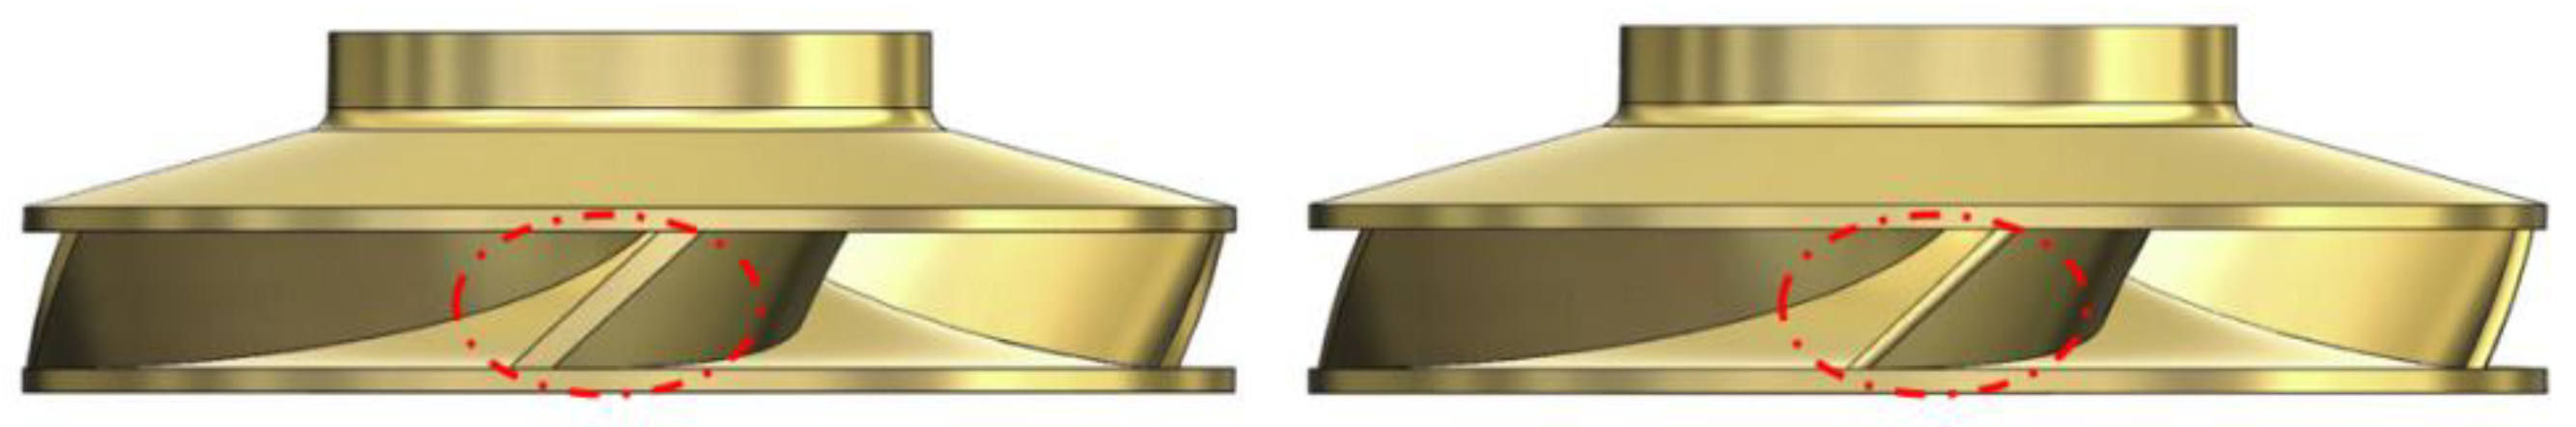
Figure 2.
Physical picture of rounded blades.

Figure 3.
Velocity triangles in a radial flow PAT.

Figure 4.
Single-stage centrifugal pump. (a) Pump modes; (b) pump as turbine (PAT) modes.

Figure 5.
Model comparison before and after impeller rounding. (a) Original impeller; (b) rounded impeller and roundness details of the impeller (t = blade thickness, R = radius of blade rounding).
Figure 5.
Model comparison before and after impeller rounding. (a) Original impeller; (b) rounded impeller and roundness details of the impeller (t = blade thickness, R = radius of blade rounding).

Figure 6.
Flow region, with (1) impeller; (2) volute; (3) case; (4) inlet pipe; and (5) outlet pipe.
Figure 6.
Flow region, with (1) impeller; (2) volute; (3) case; (4) inlet pipe; and (5) outlet pipe.

Figure 7.
Grid generation.

Figure 8.
Reynolds number versus efficiency curves at 1000 rpm, 1250 rpm, and 1500 rpm.

Figure 9.
Pressure contours of flow region at 1000 rpm. (a) Original model; (b) rounded model.

Figure 10.
Velocity contours of flow region at 1000 rpm. (a) Original model; (b) rounded model.

Figure 11.
Velocity vector of flow region at 1000 rpm. (a) Original model; (b) rounded model.

Figure 12.
Pressure contours of flow region at 1250 rpm. (a) Original model; (b) rounded model.

Figure 13.
Velocity contours of flow region at 1250 rpm. (a) Original model; (b) rounded model.

Figure 14.
Velocity vector of flow region at 1250 rpm. (a) Original model; (b) rounded model.

Figure 15.
Pressure contours of flow region at 1500 rpm. (a) Original model; (b) rounded model.

Figure 16.
Velocity contours of flow region at 1500 rpm. (a) Original model; (b) rounded model.

Figure 17.
Velocity vector of flow region at 1500 rpm. (a) Original model; (b) rounded model.


Table 1.
Design specifications of the pump.
| Technical Date | Value |
|---|---|
| Drive frequency | 50 Hz |
| Head (50 HZ) | 3.5–236.0 (m) |
| Volume flow rate (50 HZ) | 1.0–1400.0 (m³/h) |
| Inlet diameter | 122 mm |
| Outlet diameter | 98 mm |
| Impeller diameter | 265 mm |
Table 2.
Boundary conditions setting in FLUENT 18.2.
| Setting | Value |
|---|---|
| Solver time type | Steady-state |
| Turbulence | Standard k–ε |
| Inlet/Outlet boundary conditions | Mass flow inlet/Pressure outlet |
| Fluid | Water at 25 °C |
| Wall surface roughness | 50 μm |
| Rotating speed | 1000/1250/1500 rpm |
| Velocity inlet | 60–420 m³/h |
| Pressure outlet | 0 (pascal) |
Table 3.
Comparison of PAT without rounding and with rounding at 1000 rpm.
| Q (m3/h) | Without Rounding | Rounding | ||||
|---|---|---|---|---|---|---|
| H (m) | P (kw) | η (%) | H (m) | P (kw) | η (%) | |
| 60 | 9.83 | 0.2019 | 12.56 | 10.361 | 0.2287 | 13.50 |
| 80 | 11.2812 | 1.1415 | 46.42 | 11.8349 | 1.2307 | 47.70 |
| 100 | 11.965 | 1.8332 | 56.23 | 11.6438 | 1.7818 | 56.98 |
| 120 | 13.082 | 2.6397 | 61.71 | 13.4999 | 2.733 | 61.91 |
| 140 | 14.5442 | 3.8839 | 69.98 | 14.7318 | 3.9407 | 70.12 |
| 160 | 16.9317 | 5.4671 | 74.06 | 15.5056 | 5.0245 | 74.32 |
| 180 | 19.114 | 6.9806 | 74.46 | 18.5965 | 6.8341 | 74.92 |
| 200 | 22.4477 | 8.947 | 73.13 | 21.93 | 8.8396 | 73.96 |
| 220 | 25.6434 | 11.1377 | 72.45 | 24.3713 | 10.7814 | 73.79 |
| 240 | 28.9768 | 13.3715 | 70.56 | 28.6529 | 13.3132 | 71.11 |
| 260 | 32.4854 | 15.8629 | 68.92 | 31.9428 | 15.7037 | 69.39 |
| 280 | 36.5428 | 18.6659 | 66.95 | 35.7226 | 18.2794 | 67.06 |
| 300 | 41.6563 | 21.7556 | 63.88 | 41.2021 | 21.5468 | 63.97 |
| 320 | 46.4731 | 24.8855 | 61.41 | 45.1378 | 24.3364 | 61.83 |
Table 4.
Comparison of PAT without rounding and with rounding at 1250 rpm.
| Q (m3/h) | Without Rounding | Rounding | ||||
|---|---|---|---|---|---|---|
| H (m) | P (kw) | η (%) | H (m) | P (kw) | η (%) | |
| 120 | 19.3315 | 3.5146 | 55.60 | 18.0108 | 3.3454 | 56.80 |
| 140 | 20.3896 | 4.8420 | 62.25 | 19.7405 | 4.7793 | 63.46 |
| 160 | 21.2765 | 6.2997 | 67.91 | 21.4139 | 6.4902 | 69.51 |
| 180 | 23.8628 | 8.5007 | 72.62 | 23.0566 | 8.2440 | 72.90 |
| 200 | 26.4193 | 10.6708 | 74.11 | 24.1433 | 9.8171 | 74.61 |
| 220 | 29.8528 | 13.4570 | 75.19 | 27.3191 | 12.3824 | 75.69 |
| 240 | 33.4636 | 16.2056 | 74.05 | 31.8450 | 15.5947 | 74.88 |
| 260 | 37.1550 | 19.2492 | 73.12 | 35.0798 | 18.5844 | 74.77 |
| 280 | 41.4197 | 22.8381 | 72.26 | 39.9254 | 22.4938 | 73.84 |
| 300 | 45.5048 | 26.3338 | 70.79 | 45.1439 | 26.6248 | 72.14 |
| 320 | 49.4518 | 30.0714 | 69.74 | 50.7606 | 31.1321 | 70.33 |
| 340 | 54.7270 | 34.2188 | 67.48 | 55.8011 | 35.3044 | 68.29 |
| 360 | 61.0967 | 39.3360 | 65.63 | 61.8888 | 40.1731 | 66.17 |
| 380 | 66.3067 | 43.6898 | 63.63 | 67.1740 | 44.4389 | 63.89 |
Table 5.
Comparison of PAT without rounding and with rounding at 1500 rpm.
| Q (m3/h) | Without Rounding | Rounding | ||||
|---|---|---|---|---|---|---|
| H (m) | P (kw) | η (%) | H (m) | P (kw) | η (%) | |
| 140 | 27.5423 | 5.2786 | 50.23 | 26.4767 | 5.1833 | 51.32 |
| 160 | 28.7504 | 7.1728 | 57.22 | 27.5217 | 7.3473 | 61.23 |
| 180 | 30.2620 | 9.1407 | 61.58 | 29.4502 | 9.6145 | 66.56 |
| 200 | 32.8152 | 12.4138 | 69.41 | 32.5245 | 12.4322 | 70.14 |
| 220 | 34.9326 | 15.3793 | 73.43 | 33.0137 | 14.6274 | 73.91 |
| 240 | 38.7810 | 18.9444 | 74.69 | 36.4279 | 17.8738 | 75.02 |
| 260 | 43.7248 | 23.2935 | 74.85 | 43.5453 | 23.5025 | 76.18 |
| 280 | 48.7248 | 27.6203 | 74.29 | 45.6454 | 26.0049 | 74.67 |
| 300 | 53.2446 | 32.0101 | 73.58 | 19.0400 | 29.7292 | 74.16 |
| 320 | 57.8008 | 37.0037 | 73.42 | 53.0145 | 34.4437 | 74.51 |
| 340 | 63.1306 | 41.6520 | 71.21 | 58.4540 | 39.5959 | 73.11 |
| 360 | 67.8808 | 46.8442 | 70.35 | 65.9331 | 46.1689 | 71.38 |
| 380 | 74.0258 | 52.7897 | 68.87 | 71.9595 | 52.0598 | 69.87 |
| 400 | 80.1115 | 59.1668 | 67.76 | 78.6554 | 58.5042 | 68.25 |
| 420 | 87.1470 | 67.8808 | 66.04 | 83.9208 | 63.9698 | 66.60 |
Table 6.
Comparison of simulation results at different rotating speed.
| Setting | 1000 rpm | 1250 rpm | 1500 rpm |
|---|---|---|---|
| Flow rate at BEP | 180 m3/h | 220 m3/h | 260 m3/h |
| Efficiency at BEP | 74.92% | 75.69% | 76.18% |
| Increased Efficiency | 0.2~1.34% | 0.26~1.65% | 0.33~4.98% |
Publisher’s Note: MDPI stays neutral with regard to jurisdictional claims in published maps and institutional affiliations. |
© 2021 by the authors. Licensee MDPI, Basel, Switzerland. This article is an open access article distributed under the terms and conditions of the Creative Commons Attribution (CC BY) license (https://creativecommons.org/licenses/by/4.0/).
Share and Cite
MDPI and ACS Style
Yang, H.; Zhu, L.; Xue, H.; Duan, J.; Deng, F. A Numerical Analysis of the Effect of Impeller Rounding on Centrifugal Pump as Turbine. Processes 2021, 9, 1673. https://0-doi-org.brum.beds.ac.uk/10.3390/pr9091673
AMA Style
Yang H, Zhu L, Xue H, Duan J, Deng F. A Numerical Analysis of the Effect of Impeller Rounding on Centrifugal Pump as Turbine. Processes. 2021; 9(9):1673. https://0-doi-org.brum.beds.ac.uk/10.3390/pr9091673
Chicago/Turabian StyleYang, Hualin, Lingli Zhu, Hao Xue, Junyong Duan, and Fang Deng. 2021. "A Numerical Analysis of the Effect of Impeller Rounding on Centrifugal Pump as Turbine" Processes 9, no. 9: 1673. https://0-doi-org.brum.beds.ac.uk/10.3390/pr9091673
Note that from the first issue of 2016, this journal uses article numbers instead of page numbers. See further details here.