Article

Investigation on the Interactive Effects between Temperature and Chemical Composition of Organic Wastes on Anaerobic Co-Digestion Performance

1
College of Agronomy, Northwest A&F University, Yangling 712100, China
2
Shaanxi Engineering Research Center of Circular Agriculture, Yangling 712100, China
*
Author to whom correspondence should be addressed.
Submission received: 3 August 2021 / Revised: 10 September 2021 / Accepted: 10 September 2021 / Published: 20 September 2021
(This article belongs to the Topic Anaerobic Digestion Processes)

Abstract

:
Synergistic effects among different chemical components under the anaerobic co-digestion (AcoD) process played an important role in improving its performance, which might be affected by the digesting temperature. The results showed that the actual methane production (AMP) and gasification rate (GR) of 50% lipid content were the highest, and the carbohydrate and protein content should be adjusted according to the temperature. Under mesophilic conditions, the M1 reactor with high protein content (carbohydrate–lipid–protein ratio, CLP = 20:50:30) had the highest AMP of 552.02 mL/g VS and GR of 74.72%. However, as the temperature increased, the high protein content produced high levels of ammonia nitrogen (AN) and free ammonia (FA), which formed a certain degree of ammonia inhibition, resulting in lower AMP and GR. Under thermophilic conditions, the low protein T2 reactor (CLP = 40:50:10) had the highest AMP and GR at 485.45 mL/g VS and 67.18%. In addition, the M1 and T2 reactors had the highest microbial diversity, which promoted substrate degradation and methane production. In the M1 reactor, acetoclastic metabolism is the main methanogenic pathway, while in the T2 reactor changes to hydrogenotrophic metabolism. Therefore, understanding the synergistic effect between temperature and chemical compositions was an effective way to improve the AcoD effect.

1. Introduction

According to statistics, the total amount of biomass resources available for energy in China was about 460 million tonnes of standard coal every year, and, due to the development of urbanization, about 80–100 million tonnes of food waste (FW) was produced every year, most of which was directly buried, causing great harm to the environment [1,2]. Anaerobic digestion (AD) is a renewable energy production technology, which can recover FW energy in the form of biogas [3]. However, biogas production is affected by FW nutrients, especially the contents of carbohydrates, proteins, and lipids. Carbohydrates and proteins can be rapidly degraded to methane, but the methane potential is relatively low, while lipids show the highest methane potential, but the biodegradation is slow and the lag time is long [4,5]. It has been found that high levels of carbohydrates might rapidly accumulate volatile fatty acids (VFA), resulting in systematic acidification and inhibition of methane production, while high levels of lipids and proteins tend to accumulate ammonia, hydrogen sulfide, and long-chain fatty acids (LCFAs), leading to AD failure [6,7]. Thus, AcoD of different substrates could ensure the chemical composition balance and promote biogas yield.
Compared with mono-digestion of the same substrate, the biogas yield of AcoD could be improved by 13–176% [8]. AcoD could balance the nutrients of substrates, accelerate the growth of micro-organisms, and improve the buffering and metabolic efficiency of the system [9,10]. However, in most studies involving AcoD, different wastes were usually mixed according to their VS ratios in the reactor; however, the chemical compositions of wastes in different studies were extremely different due to their different sources, which generally led to varied results of optimized ratios of wastes with the best AcoD performance. For example, when the mixing ratio of pig manure and food waste was 40:60, the methane production was the highest [11], while Hubenov et al. showed that the optimal mixing ratio was 70:30, which could maximize the methane production [12]. Organic wastes are mainly composed of carbohydrates, proteins, and lipids, which play a synergistic role in the AcoD process and were conducive to methane production and organics degradation [13]. Therefore, substrate mixing based on chemical compositions can eliminate chemical composition differences between substrates from different sources. However, till now, there was no widely accepted standard for how to mix these chemical compositions under AcoD conditions.
Temperature was a key factor affecting AD, which affected substrate conversion and methane production by regulating the activities of enzymes and coenzymes. The increase in temperature could promote the growth and metabolism of bacteria and increase the production of methane, but it will also accumulate free ammonia, thus inhibiting the activity of micro-organisms [14]. Earlier studies focused on AcoD efficiency at mesophilic and thermophilic conditions [15], and even under hyperthermophilic conditions [16], and some results were contradictory. Even for the same study, the optimal ratio of organic wastes under AcoD was different at different temperatures. Montañés et al. [17] found that the best mixing ratio of beet pulp mixed with sewage sludge at mesophilic conditions was 25:75, but 75:25 under thermophilic conditions [18]. Thus, in our previous study, we demonstrate an interactive effect between C/N ratio and temperature on AcoD of three agricultural wastes [19]. Shi et al. [15] investigated the process stability and microbial community structure shifts for AcoD of FW and wheat straw under thermophilic and mesophilic conditions, but provided little about the interaction between temperature and chemical composition. Therefore, understanding the relationship between chemical compositions and operating conditions can contribute to obtaining more accurate and appropriate mixing ratios of organic wastes consistent with varied reactors [20,21].
AD was a process of organic degradation and methanogenesis mediated by the synergy of diverse micro-organisms, which could be divided into four stages: hydrolysis, acidogenesis, acetogenesis, and methanogenesis [22]. In the AD process, organic matter, such as proteins, carbohydrates, and lipids, were converted into acetic acid, hydrogen, and carbon dioxide by hydrolytic bacteria and acidogenic bacteria, and then further utilized by methanogens to produce methane [23]. The growth rate of micro-organisms depended mainly on the organic composition of the substrate, and temperature also affected the growth and metabolism of micro-organisms, especially methanogens [24]. It was found that Firmicutes was the dominant phylum of both mesophilic and thermophilic AD, Bacteroidetes and Methanosaeta were dominant in mesophilic AD, and Thermotogae, Methanothermobacter, and Methanoculleus were dominant in thermophilic AD [25].
This work aimed to investigate how the chemical compositions and temperature affected the AD performance from the perspective of process stability and microbial community structures. FW was rich in carbohydrates, proteins, and lipids, respectively, which were selected as raw materials and mixed with serial ratios to obtain substrates with different chemical compositions. Batch experiments were conducted under mesophilic (35 °C) and thermophilic (55 °C) conditions. Bio-methane production and operation parameters during the digestion process and the microbial communities in the final digestion reactors were investigated to reveal the interactive effects of chemical compositions and temperature on AcoD performance.

2. Materials and Methods

2.1. Substrates and Inoculum

The substrate was collected from the daily food waste of the canteen of Northwest A&F University and classified into cooked rice, waste pork, and plant oil. After grinding with a home electric meat grinder (Bear), the substrate was stored at −20 °C. The inoculum was obtained from the normal biogas digester of Modern Animal Husbandry Co., Ltd. (Baoji, China), and the fermentation material was cow dung. Before inoculation, the inoculum was cultured in the laboratory for 7 days at 35 °C and 55 °C, respectively. Cooked rice, waste pork, and plant oil were used as the representative raw materials of carbohydrates, proteins, and lipids, respectively. These substrates’ properties are shown in Table 1.

2.2. Experimental Device

The experimental device was a typical drainage and gas collection device, which consisted of a fermentation device, gas collecting device, and temperature control device. The 1 L glass conical bottles were used as fermentation tanks and gas collecting bottles, rubber plugs and glass tubes were used to connect and seal all parts of the device, and 2.5 L plastic bottles were used as water collecting bottles. The biogas produced by the AD was stored in gas collecting bottles through the glass tube, and the water in the gas collecting bottles was discharged into the 2.5 L plastic bottle by the glass tube; then, the volume of water in the plastic bottles was determined by the measuring cylinder, that is, the volume of biogas in the collecting cylinder. The fermentation tanks were placed in the constant temperature water tank, and the fermentation temperature was displayed and controlled by a temperature controller and relay. The fluctuation ranges of the fermentation temperature were ±1 °C.

2.3. Experimental Design

According to substrate properties (Table 1), a single component was carried out with 10% as the gradient, and the threshold values of carbohydrates, fats, and proteins were 40%, 60%, and 30%, respectively. At 35 °C and 55 °C, based on the threshold of a single component, four different CLP ratios were set, as shown in Table 2, labeled as M1, M2, M3, M4 and T1, T2, T3, T4.
The fermentation tanks were 1 L conical flasks, the working volume was 700 mL, and substrate concentration was 25 g VS/L; the mixing ratio of substrate and the inoculum was 2:1 (based on VS), and was then purged with nitrogen for 3 min to ensure an anaerobic environment. All tests were set up with three replicates and blank controls, without pH correction or nutrient addition, to analyze the adaptability of biomass to substrate [26,27]. The final AMP value of the substrate was the cumulative methane production of the sample minus the cumulative methane production of the blank control.
TS and VS content of the mixed substrates were measured before fermentation. The reactor was shaken by hand at an interval of 12 h, and the biogas production and methane content were measured at an interval of 24 h. Samples of 9 mL were collected on days 1, 4, 7, 12, 18, 25, and 40 to measure fermentation parameters, such as pH, VFA, and ammonia nitrogen. Based on the data of gas production and stability parameters, the most effective replicate of the three replicates (day 40) was selected for microbial community measurement.

2.4. Analytical Methods

The biogas production was measured by a drainage and gas collection method, and methane content and pH value were measured by Portable Infrared Biogas Analyzer (Gasboard-3200Plus) and Rex Laboratory pH meter (PHS-25), respectively. TS, VS, VFA, and AN were measured according to The APHA Standard Methods (1995). Carbohydrates, proteins, and lipids were measured by Ebner and Labatut methods.
The GR and theoretical methane production (TMP) were calculated according to Formulas (1) and (2) [7]:
Gasification   rate   ( GR ) = AMP   TMP     ×   100 %
TMP   ( mL / g   VS ) = 1014   Lipids + 415   Carbohydrates + 496   Proteins
We selected the best replicate for analysis based on cumulative methane production and only measured the microbial communities of 8 screened samples. The microbial community and structure were sequenced using 16s RNA 454 high-throughput sequencing from Personal Biotechnology Co., Ltd., Shanghai, China. The universal bacterial primers were 338F (5′-ACTCCTACGGGGAGCAGCA-3′) and 806R (5′-GGACTACHVGGGTWTCTAAT-3′); the common archaeal primers were 524F (5′-TGYCAGCCGCCGCGGTAA-3′) and 958R (5′-YCCGGCGTTGAVTCCAATT-3′). OUT was based on the Greengenes database (http://greengenes.secondgenome.com/ (accessed on 27 July 2019)) and Silva databases (http://www.arb-silva.de (accessed on 27 July 2019)), with 97% sequence similarity as the dividing threshold.

3. Results and Discussion

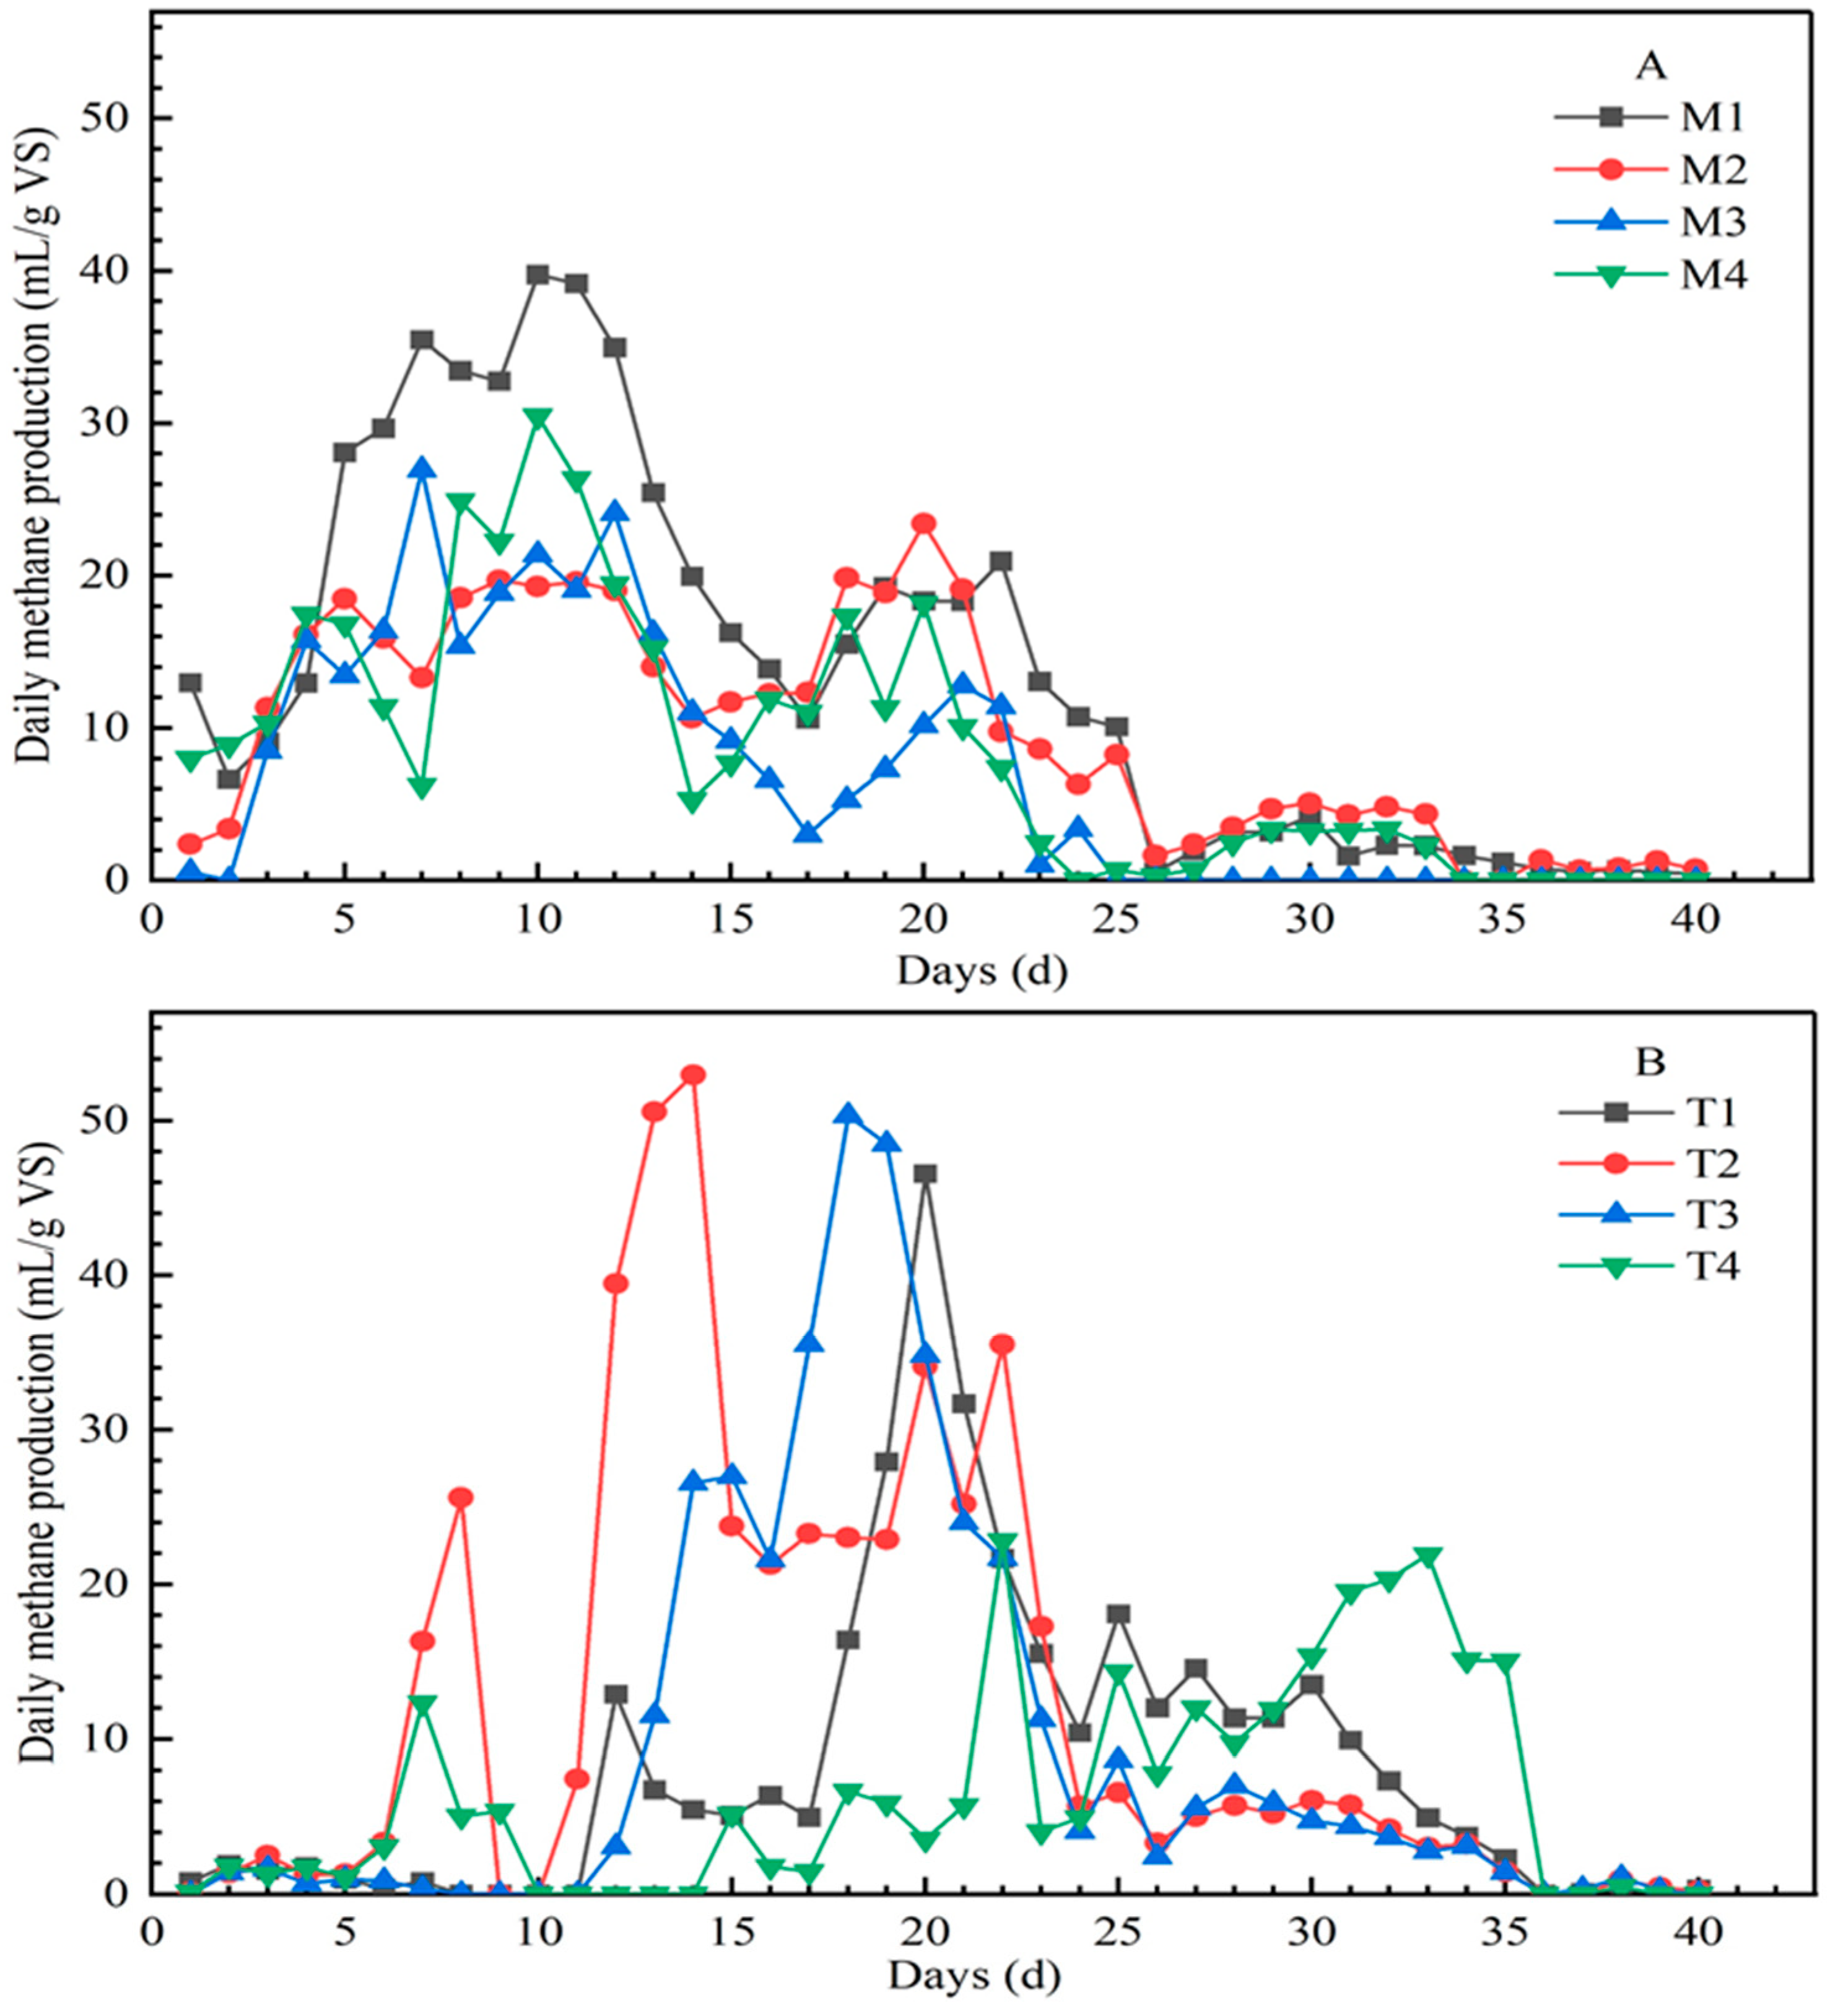
3.1. CH4 Production during AcoD Process

Temperature was crucial for the performance of the AD process. There were obvious differences in daily methane production under mesophilic and thermophilic conditions in Figure 1. At 35 °C, the daily methane production showed two obvious peaks, which appeared at days 7–12 and days 18–22. In addition, the maximum daily methane production was 39.74 mL/g VS, 23.41 mL/g VS, 26.94 mL/g VS, and 30.45 mL/g VS for M1, M2, M3, and M4, respectively. However, at 55 °C, the highest methane production appeared at day 20, 14, 18, and 33 for T1, T2, T3, and T4, which was 46.56 mL/g VS, 52.96 mL/g VS, 50.32 mL/g VS, and 22.80 mL/g VS, respectively; compared with the same set under 35 °C conditions, the peak value was significantly increased and the peak period was significantly delayed. Except for T4, the peak values of daily methane in the other three groups were all higher than those in the mesophilic condition, especially for T2 and T3, which were nearly two times higher than M2 and M3.
The trend of AMP and GR was different under mesophilic and thermophilic conditions, from high to low, which were M1, M2, M4, M3 and T2, T3, T1, T4, respectively. Besides temperature, the proportion of organic matter also affected the AD process. M1 of low carbohydrate and high protein under 35 °C showed the highest AMP and GR of 552.02 mL/g VS and 74.72% (Table 3). Under 55 °C, the highest AMP and GR occurred at T2 of high carbohydrate and low protein, with values of 485.45 mL/g VS and 67.18%, respectively, which were lower than the highest values under 35 °C. This indicates that the proportions of the optimum organic components in AD were different at different temperatures.

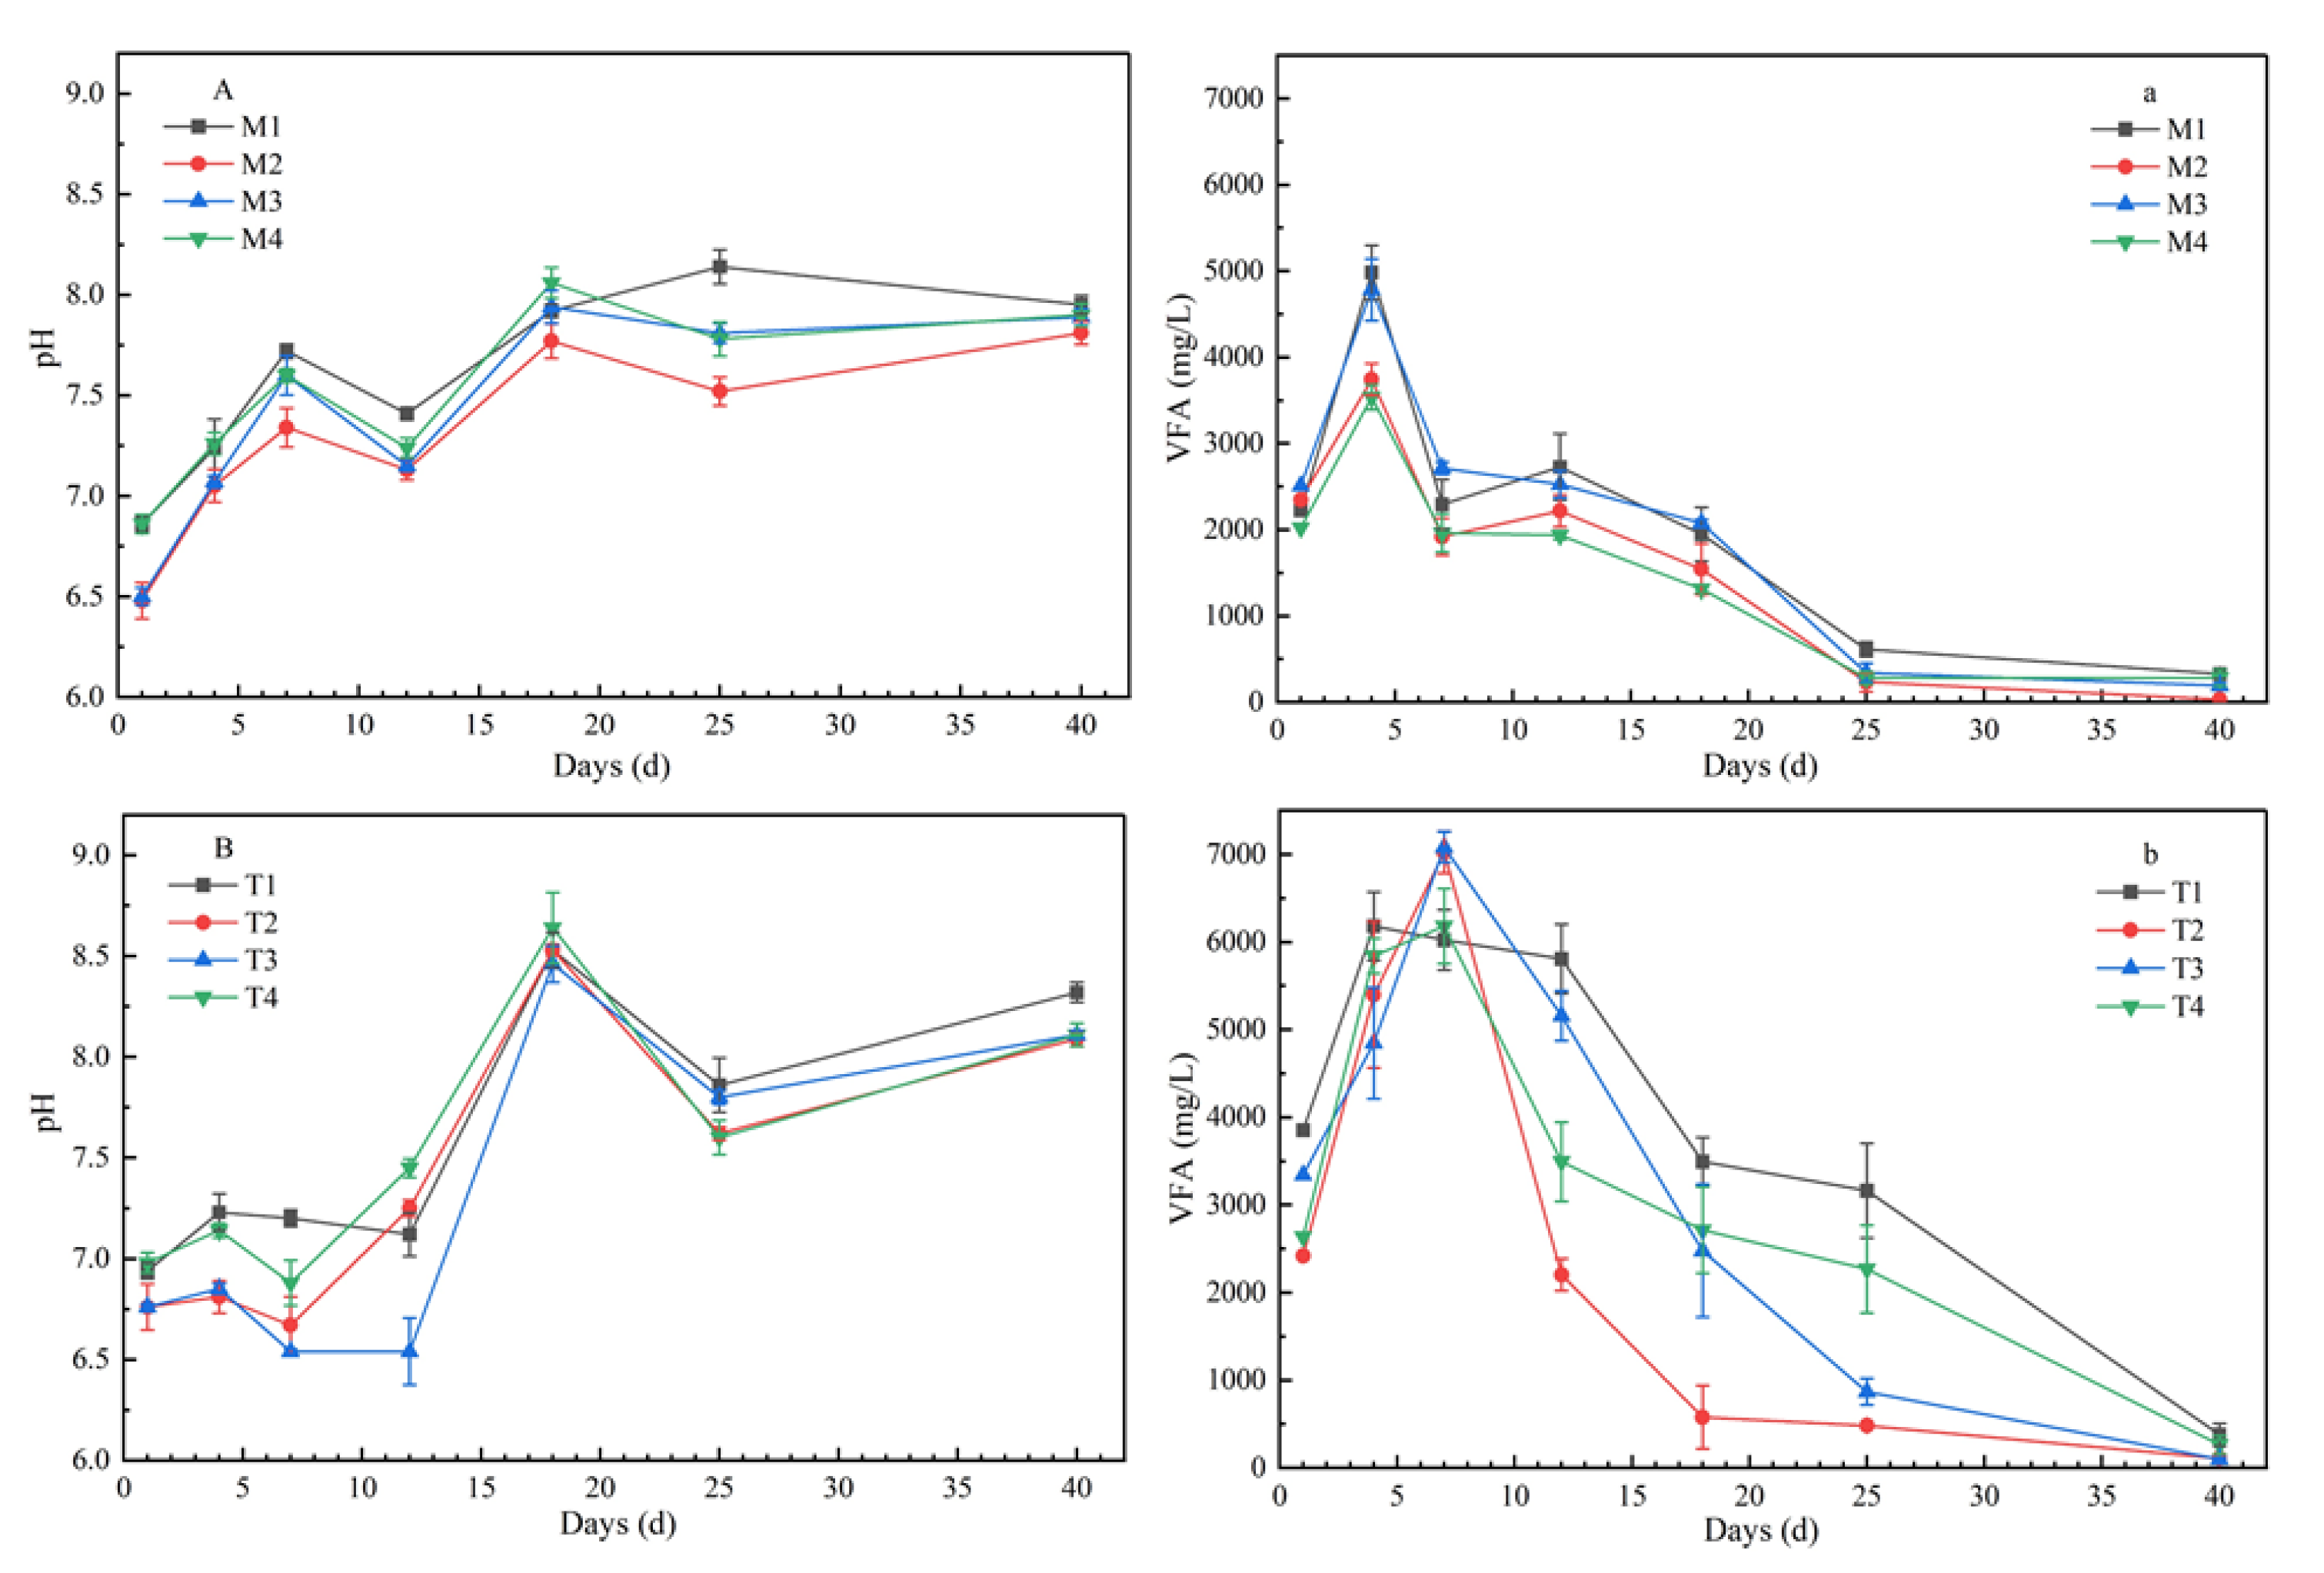
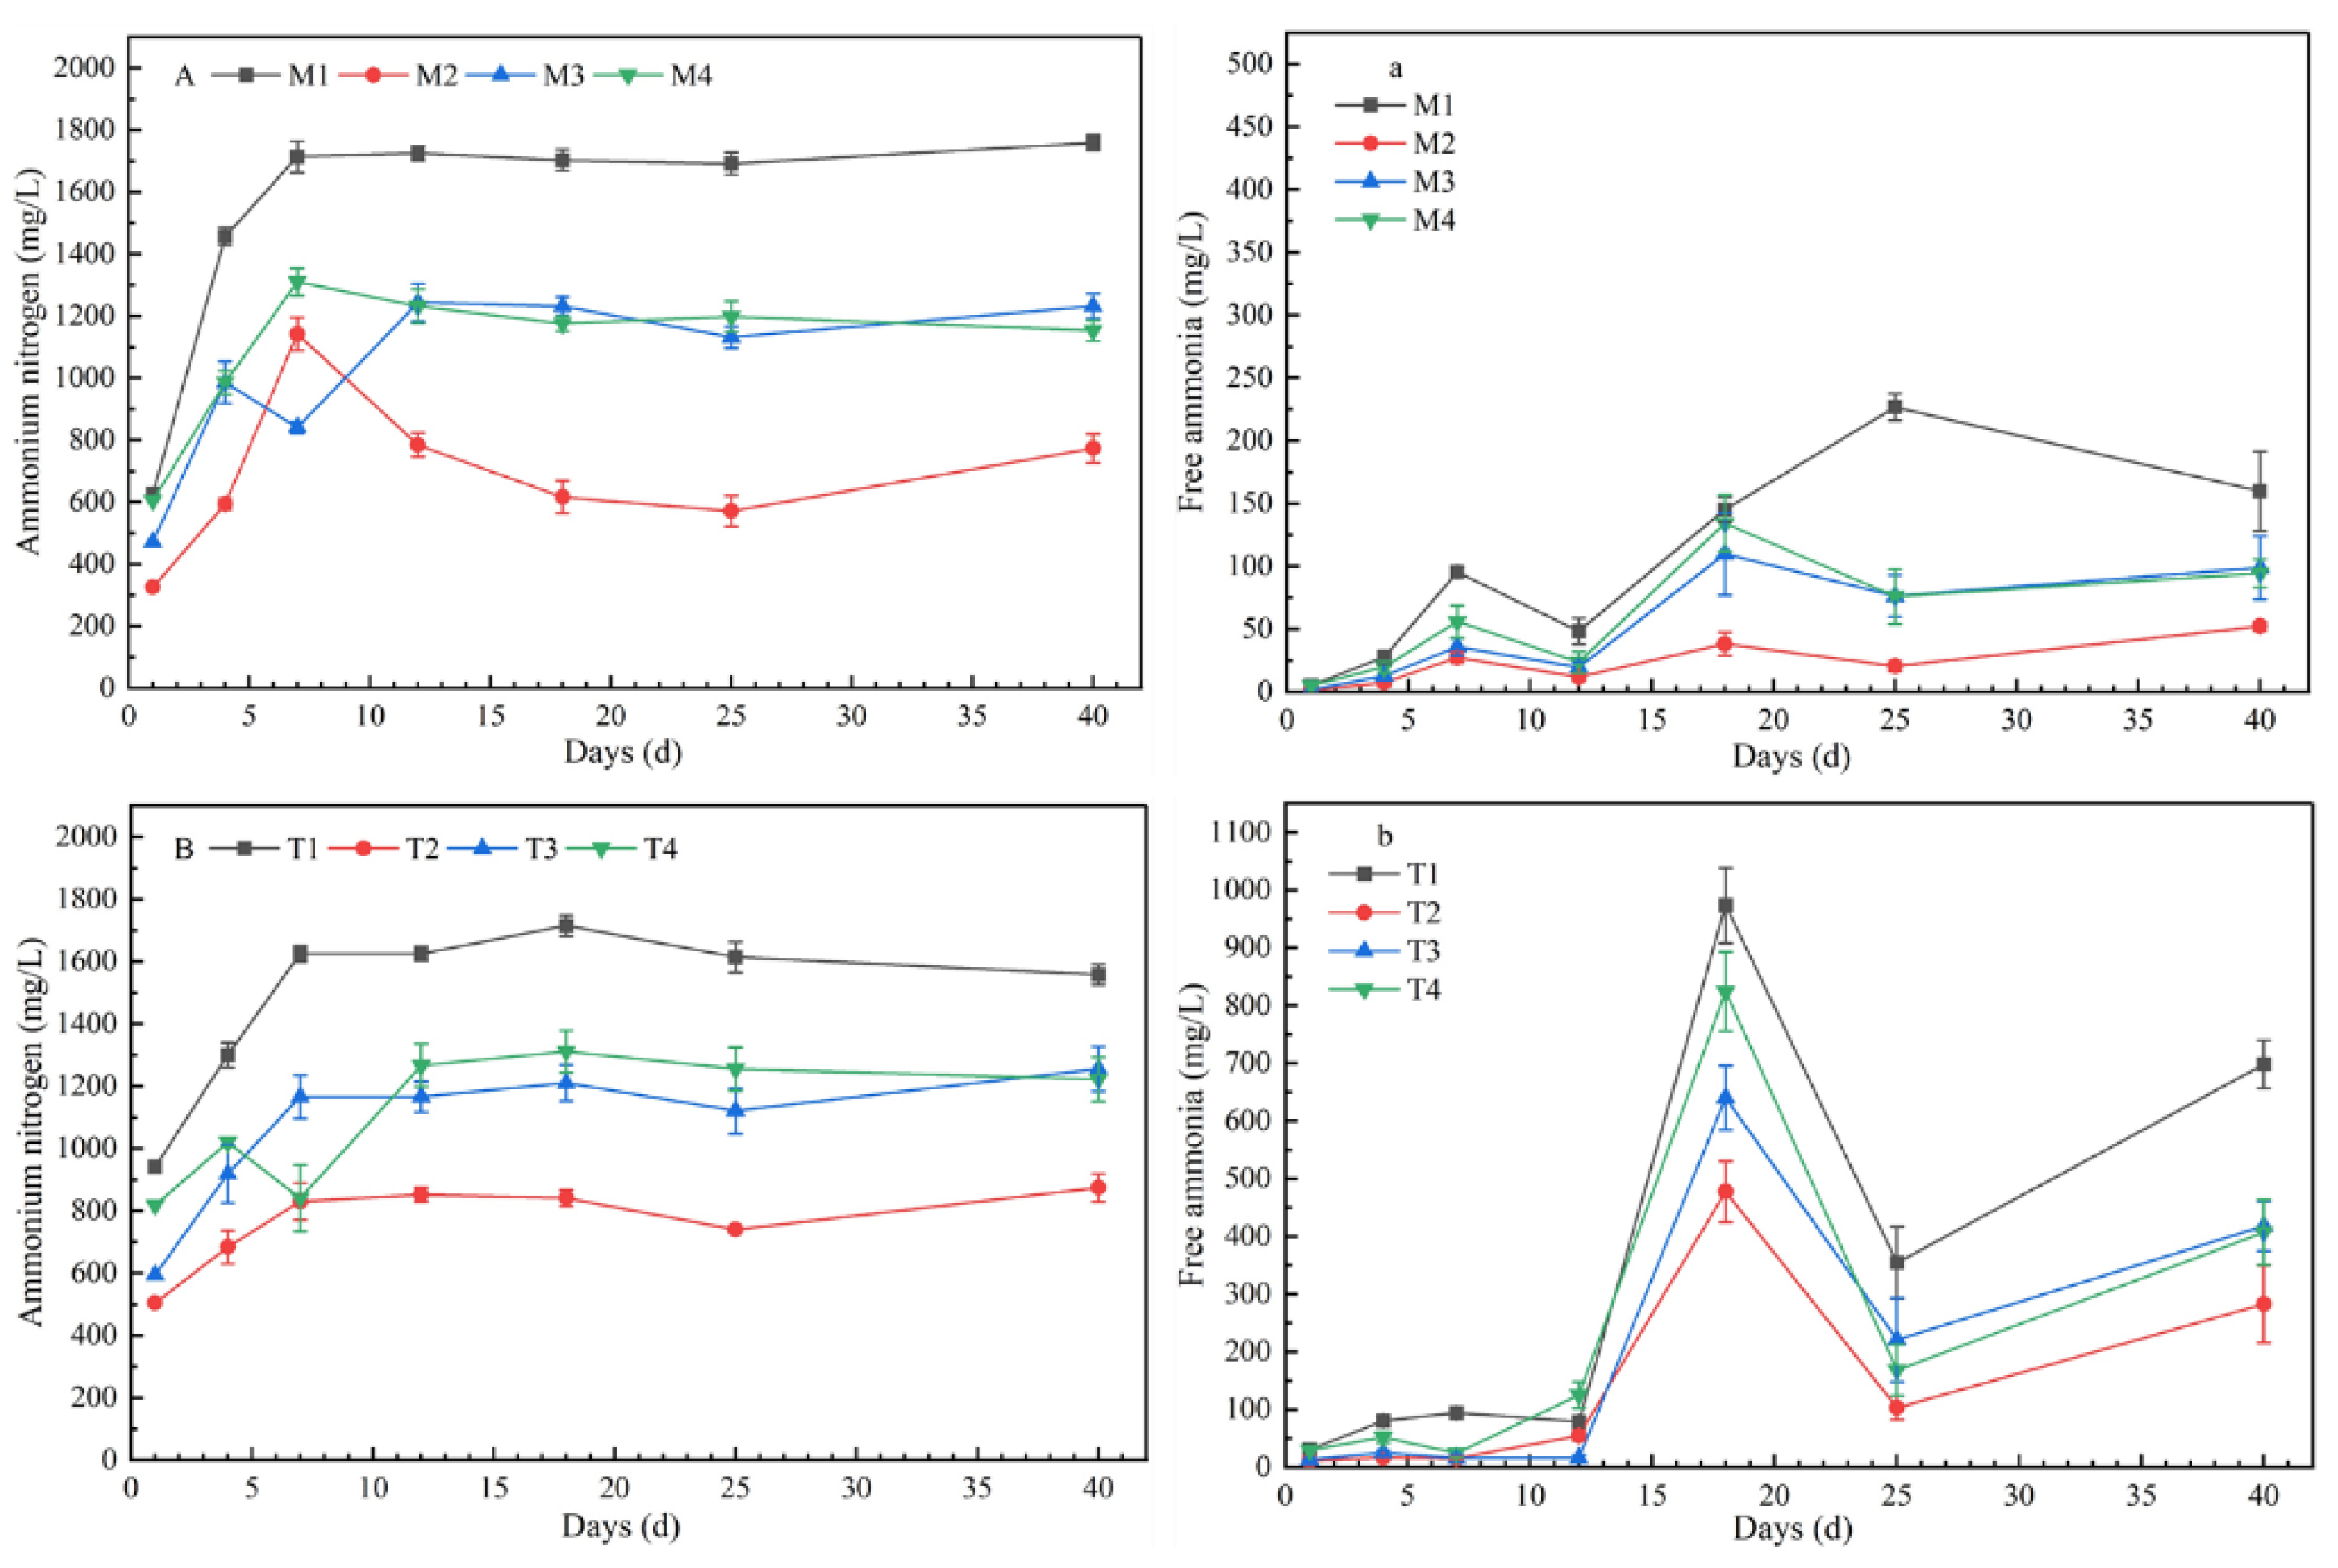
3.2. Chemical Parameters during AcoD Process

VFA concentrations showed a trend of increasing first and then decreasing (Figure 2). Under mesophilic conditions, the VFA concentrations increased rapidly at the beginning of the digestion process, reached the highest level at day 4, and then decreased rapidly, with the peak values of 4982.5 mg/L, 3742.5 mg/L, 4782.5 mg/L, and 3537.5 mg/L, respectively. Under the thermophilic conditions, the peak of VFA concentrations on the seventh day were later than those under mesophilic conditions, but the peak values were significantly higher, at 6182.5 mg/L, 7022.5 mg/L, 7082.5 mg/L, and 6182.5 mg/L, respectively. During the whole digestion process, the VFA levels were always higher under thermophilic conditions than under mesophilic conditions, except for the CLP ratio of 40:40:20. In the AcoD process, pH showed a fluctuating trend, which increased at first, then decreased, and then increased with fermentation time (Figure 2). The pH values of all samples increased gradually at 35 °C, and ranged from 6.48 to 8.14. However, for the treatments under 55 °C, the pH changed more dramatically; pH kept relatively stable values before day 7, and then increased sharply to peak values of around 8.5 at day 18. In terms of organic components, the values of M2 and T3 with higher carbohydrate content were the lowest, while those of M1 and T4 with higher protein content were the highest.
All sets showed a similar fluctuation trend in AN content. At the initial stage of fermentation, due to the hydrolysis of protein, the concentrations of AN showed an upward trend, and the range of change tended to be flat in the middle and late stages of fermentation (Figure 3). The concentrations of AN (p < 0.01) and FA (p < 0.05) were significantly different with different chemical composition of substrates. The concentration of AN and FA reached the maximum at CLP = 20:50:30, and reached the lowest concentration at CLP = 40:50:10. The variation trends of AN among different chemical components were similar between 35 °C and 55 °C; however, there were significant differences in FA. At 35 °C, the peak values of FA concentrations in M1–M4 were 226.7 mg/L, 38.17 mg/L, 109.71 mg/L, and 134.25 mg/L, respectively. With increasing temperature, the concentrations of FA increased and the peak values of T1–T4 were 973.64 mg/L, 477.27 mg/L, 640.00 mg/L, and 824.15 mg/L, respectively.

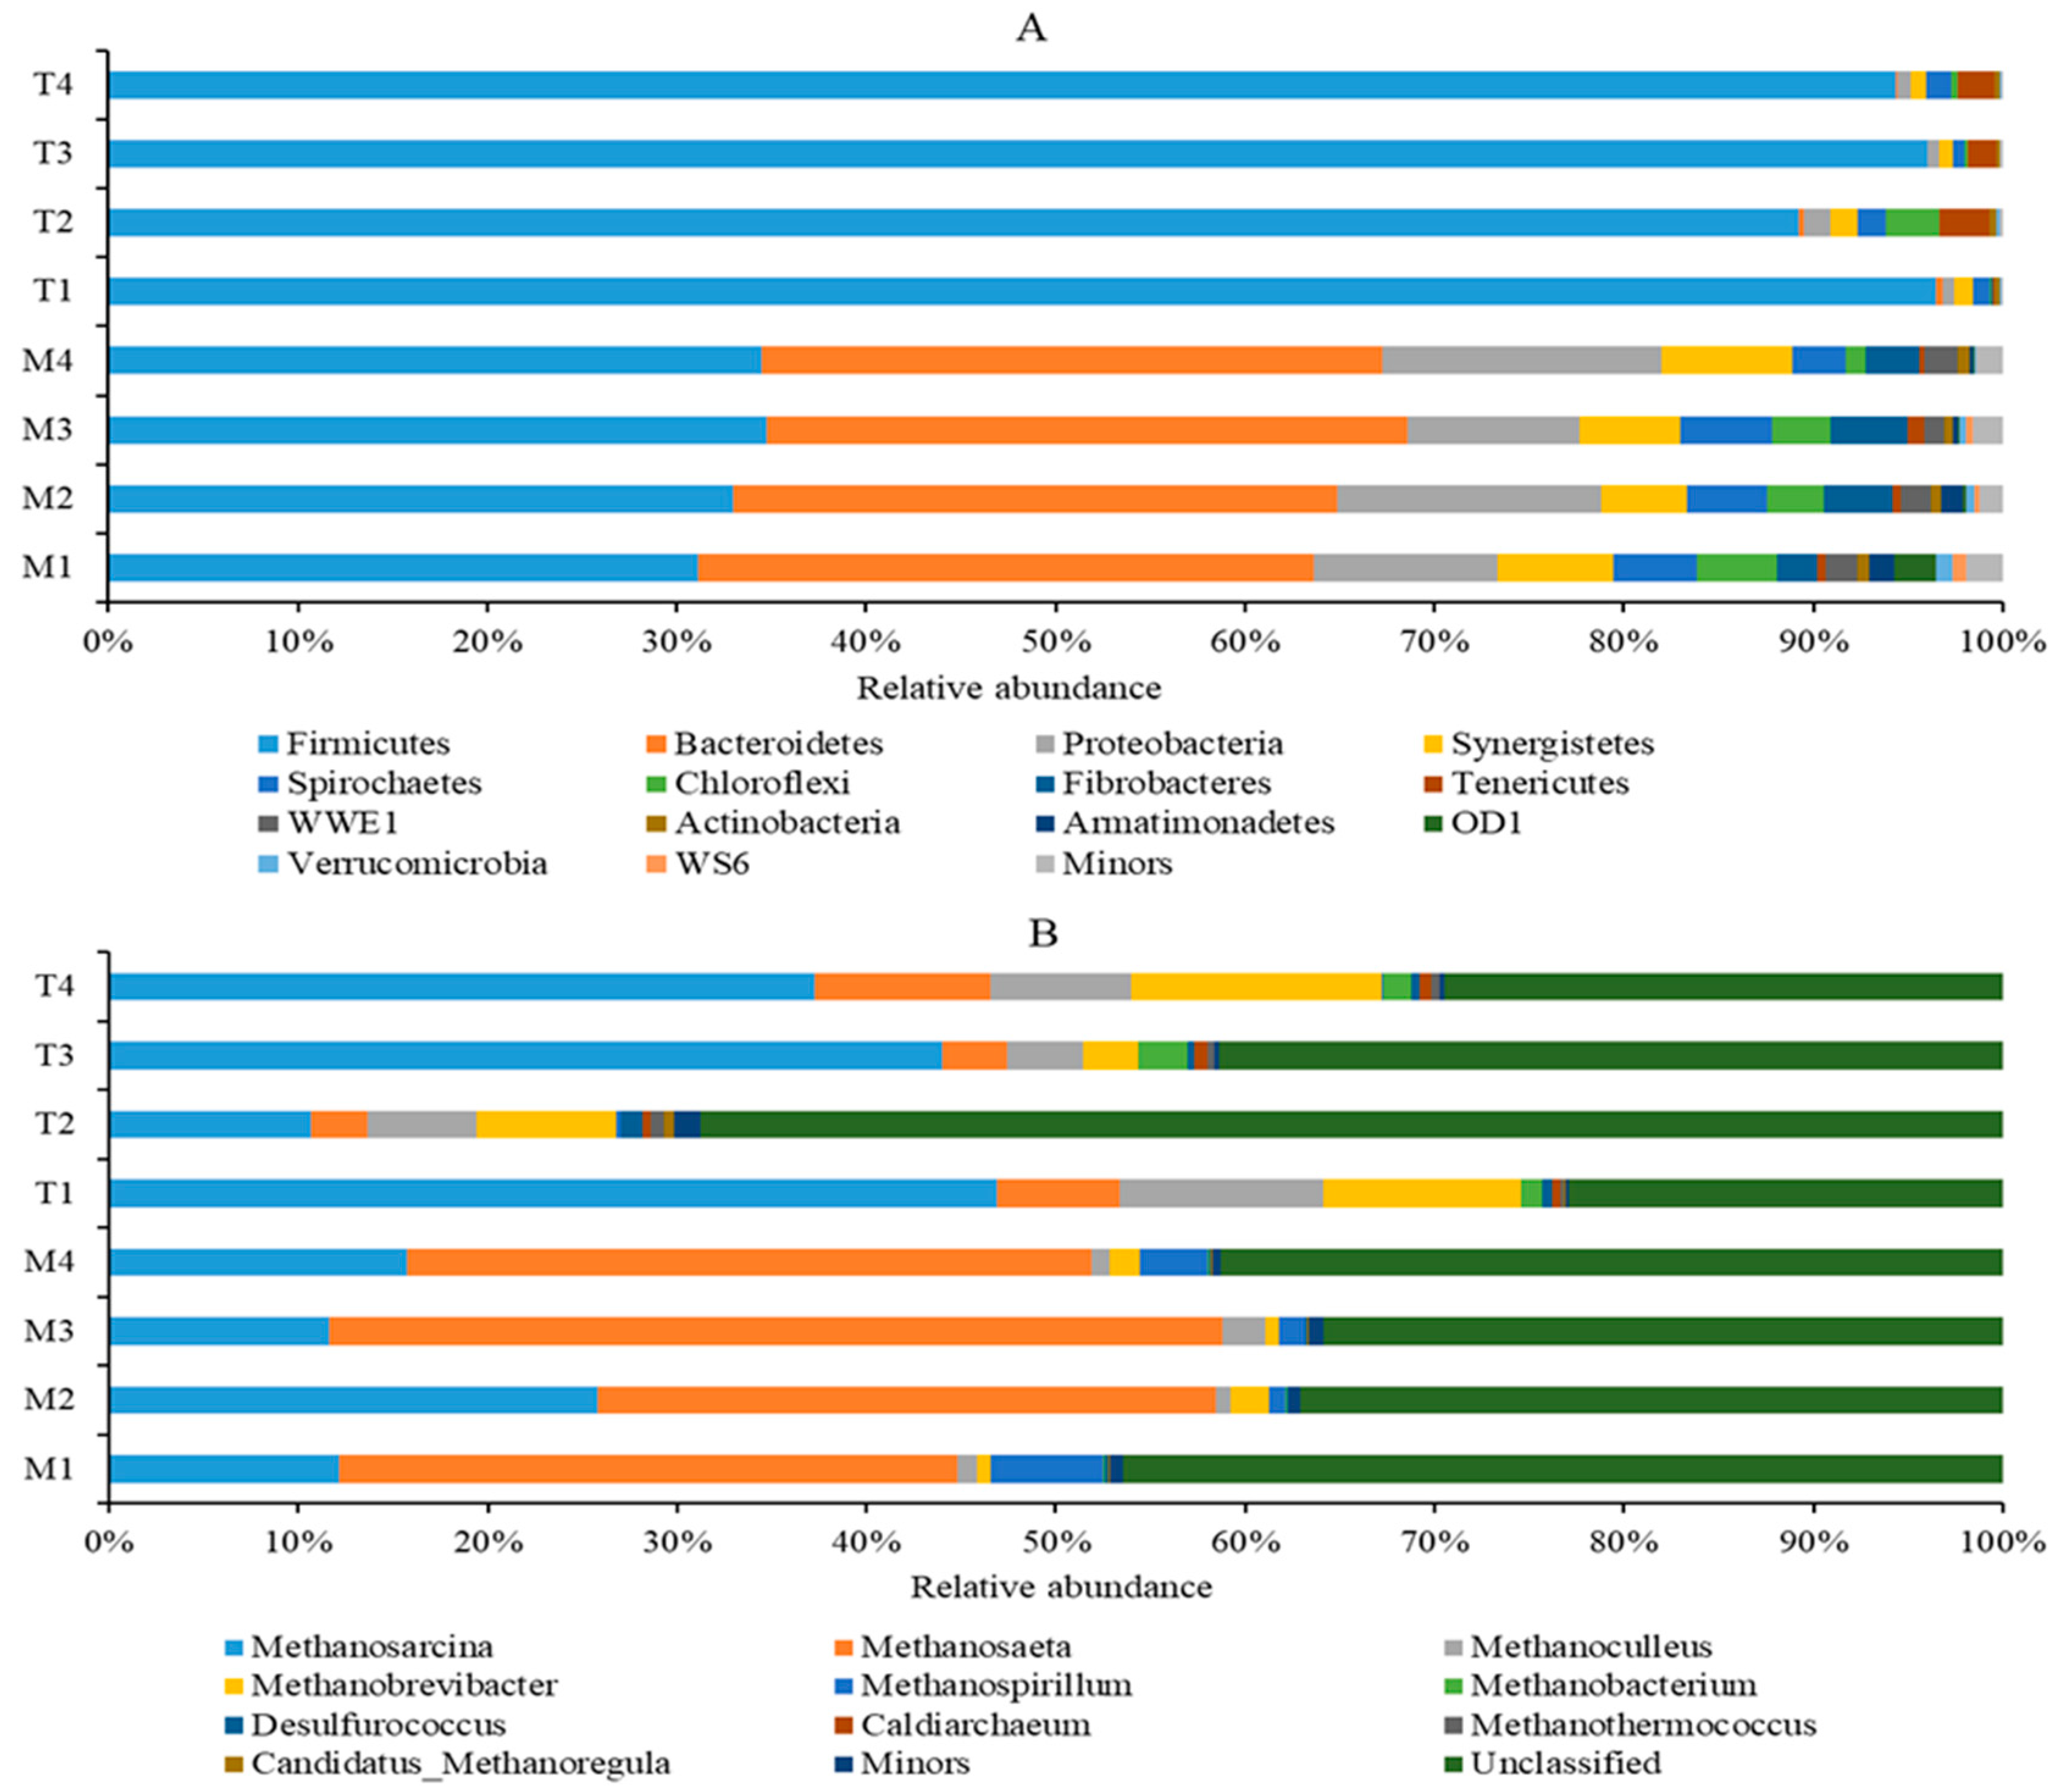
3.3. Microbial Community

First, the quantitative insights into microbial ecology (QIIME) software was used to identify and eliminate suspicious sequences, and a total of 383,347 bacterial sequences and 444,654 archaeal sequences were obtained by statistical analysis of eight samples. Then, these sequences were clustered into operational taxonomic units (OTUs) with 97% similarity, resulting in 2684 bacterial OTUs and 2507 archaeal OTUs. The relative abundances (RA) of bacteria and archaeal communities for different sets are provided in Figure 4. The bacterial OTUs were further classified into 35 phyla. At the phylum level, the most abundant bacteria were Firmicutes (31.10–34.80%), Bacteroidetes (31.86–33.76%), Proteobacteria (9.13–14.75%), Synergistetes (4.51–6.68%), and Spirochaetes (2.89–4.85%) in reactors under 35 °C. However, it is interesting to note that Firmicutes played the dominant role in reactors under 55 °C, with the RA of 96.50%, 89.22%, 96.00%, and 94.32% for T1 to T4, respectively.
The archaeal OTUs were divided into three phyla, Euryarchaeota (51.08~87.66%), Crenarchaeota (12.17~48.56%), and Parvarchaeota (0~0.1%). The unclassified genera of archaea accounted for a large proportion. Under mesophilic conditions, the unclassified genera of M1, M2, M3, and M4 accounted for 46.49%, 37.10%, 35.85%, and 41.27%, respectively; under thermophilic conditions, the value of T1, T2, T3, and T4 accounted for 22.93%, 68.75%, 41.41%, and 29.46%, respectively. At the genus level, under mesophilic conditions, the most dominant genera of methanogenic archaea were Methanosaeta and Methanosarcina; among them, Methanosaeta accounts for the highest proportion, accounting for 32.66%, 32.63%, 47.17%, and 36.07% in the M1, M2, M3, and M4 reactors, respectively (Figure 4B). Under thermophilic conditions, Methanosarcina was the predominant methanogen archaea, accounting for 46.85%, 10.71%, 43.97%, and 37.24% in the T1, T2, T3, and T4 reactors, respectively. In order to better understand the dynamics of microbial communities, the sequencing data should be interpreted at a subdivision level.
Simpson and Shannon indexes reflected community diversity, and the greater these values were, the higher the microbial diversity. In this study, the diversity of the bacterial community was higher than that of the Archaea community (in Table 4). M1 and T2 had the highest microbial community diversity. Except for T2 reactor, the microbial community diversity of mesophilic reactors was higher than that of thermophilic reactors. Beta diversity was concerned with microbial similarities between communities, and the similarity of microbial communities was high between treatments with similar distance in the co-ordinate system. Principal component analysis (PCA) was conducted based on the RA of microbial OTUs (Figure 5) and the results indicated that, compared with chemical components, the effects of temperature treatment on the microbial community were more significant. In addition, the differences between M1 and other treatments were significant, and T2 was isolated from other treatments.
Because of the differences in carbohydrates, proteins, and lipids content, the methane productions were significantly different. Under mesophilic conditions, the optimal organic component mixing ratio is M1 (CLP = 20:50:30), indicating that high levels of lipids and protein, but lower carbohydrates were more suitable for fermentation at mesophilic conditions, which was consistent with research by Luca Alibardi [28]. With the temperature changes, the optimal ratio of organic components changed significantly. Under thermophilic conditions, the optimal organic component mixing ratio was T2 (CLP = 40:50:10), which implied a high content of carbohydrates and lipids, but lower content of proteins had better fermentation. The common characteristic of both was high content of lipids. The TMP of carbohydrate, protein, and lipid were 415, 496, and 1014 mL/g VS [29]. This indicated that lipids had higher TMP compared to carbohydrates and proteins, which explained that the high lipid reactors (M1, T2) in this study had the highest methane production. The methane potential of lipid-rich raw materials was higher than that of carbohydrate- and protein-rich materials, but the reactor with the highest lipid content did not achieve the highest methane production in this experiment. Although lipids had high methane potential, they were harder to decompose and, therefore, lipid content was too high to make the fermentation system difficult to degrade; low VFA content leads to low methane production under mesophilic conditions. Therefore, the lipid content must be maintained at an appropriate level, the content was too high to reduce methane production. Yifei Sun [30] found that, when lipid content was below 60%, AD reactors operated stably, but AD reactors failed to operate when lipid content was greater than 65%; in this study, the methane production of the reactor with the highest lipid content was not good, which was basically consistent with this result.
Although the lipid content was the same, the corresponding optimal proportions of other ingredients were different under mesophilic and thermophilic conditions. Under mesophilic conditions, high-protein and low-carbohydrate reactors had good CH4 production. Proteins provided the necessary buffering capacity for the fermentation system and essential nutrients for the construction of microbial cell structures. Appropriate ammonia concentration could not only provide nutrients for micro-organisms, but also enhance the buffer capacity in AD. The more protein in the substrate, the faster the micro-organisms grow and the more acid was consumed [31]. In the optimal proportion (M1), the VFA content was highest in the initial fermentation stage, and the pH value was the highest throughout the fermentation compared with the other three ratios, demonstrating that the whole micro-organism system rapidly consumed VFA without acid inhibition. However, high AN causes ammonia inhibition, which was one of the main reasons reported for AD failure [32,33,34]. Under the thermophilic conditions, the AMP and GR of T2 with low protein content were higher, because the ammonia nitrogen level and inhibition degree of low protein content was low, which led to the highest VFA transformation degree. With the increase in temperature, the FA content (p < 0.01) increases significantly. Therefore, the protein content should be reduced under thermophilic conditions to prevent ammonia inhibition. Xue et al. [31] studied the interactive effects of chemical compositions of FW during AcoD under thermophilic conditions, and found that 40% carbohydrate, 50% lipid, and 10% protein composition held a higher AMP of 497.44 mL/g VS and GR of 65.09% compared with other groups, which was consistent with our findings.
The micro-organisms involved in AD metabolism could be divided into four types: hydrolytic fermentation bacteria, homoacetogenic bacteria, acetoclastic methanogens, and hydrogenotrophic methanogens [35,36]. Firmicutes, Bacteroidetes, and Proteobacteria were classified as hydrolytic fermentation bacteria. Firmicutes was a homoacetogenic bacterium that degraded various substrates to produce VFAs, Proteobacteria could effectively utilize glucose and LCFAs, Bacteroidetes was involved in the degradation of protein or nitrogen-containing substances to generate VFAs and ammonium, and Synergistetes played a key role in the stages of acid, acetic acid, and salicylic acid production [35,36,37]. Firmicutes, Bacteroidetes, Proteobacteria, and Synergistetes were the dominant bacteria under mesophilic conditions, while only Firmicutes was the dominant bacteria under thermophilic conditions. There was no significant difference in bacterial community between chemical compositions, while temperature was positively correlated with RA of Firmicutes (p < 0.01), and negatively correlated with RA of Bacteroidetes (p < 0.01), Proteobacteria (p < 0.01), and Synergistetes (p < 0.01). Under thermophilic conditions, the concentrations of VFAs were higher and the consumption rates were lower, which might be related to the high RA of Firmicutes. The results showed that the RA of Firmicutes was positively correlated with the peak concentrations of VFAs (p = 0.002719 < 0.05). Compared with thermophilic AD, the mesophilic digestion system had richer hydrolytic fermentation bacteria, which could better balance the competition among micro-organisms, improve the degradation rate of substrate and the utilization rate of VFAs, and show better digestion performance.
A balance between acidogenic bacteria and methanogens was essential for a stable AD system. Methanogens could be roughly divided into two types, namely, acetoclastic methanogens and hydrogenotrophic methanogens [31]. Methanosarcina was a mixotrophic methanogen, capable of metabolizing hydrogen, acetic acid, and methyl compounds, with a high growth rate and stronger tolerance to pH mutation and high concentration of VFAs; Methanosaeta was an obligate acetoclastic methanogen; Methanoculleus and Methanobrevibacter were forced hydrogenotrophic methanogens [38,39,40]. In mesophilic reactors, the acetoclastic methanogen of Methanosaeta (32.63~47.17%) and mixotrophic methanogen of Methanosarcina (11.59~25.80%) were the dominant methanogens, indicating that acetoclastic metabolism was the main methanogenic pathway. However, the RA of the hydrogenotrophic methanogens was significantly increased (p < 0.01), and Methanosaeta was significantly reduced (p < 0.01) in thermophilic reactors, indicating that the dominant methane-producing pathway was transformed into hydrogenotrophic metabolism, which was consistent with previous studies [41,42,43]. Hydrogenotrophic and acetoclastic methanogens in the T2 reactor were 13.09% and 13.66%, respectively, which could better alleviate the competition between the substrates of the two metabolic pathways and ensure the efficient and stable operation of the AD system. However, AMP and GR of the T2 treatment were lower than those of the M1 treatment, which might be due to the higher microbial diversity of the M1 reactor and which could better balance acidogenic bacteria and methanogens, thus promoting VFA consumption and methane production. Tianjie Ao et al. compared the microbial community structure of mesophilic and thermophilic AD of vegetable waste, and the results showed that temperature could greatly change the methanogenic pathway and that the methanogenic pathway might be converted from the acetoclastic metabolism pathway in the mesophilic conditions to the hydrogenotrophic metabolism pathway in the thermophilic conditions, which was consistent with our results.

4. Conclusions

The results showed that 50% lipid content had the highest AMP and CR, while carbohydrate and protein content needed to be adjusted with temperature change. Under mesophilic conditions, the maximum AMP of M1 (CLP = 20:50:30) was 552.02 mL/g VS, and high protein content could promote microbial growth and enhance the buffering capacity of the system, while, under thermophilic conditions, the maximum AMP of T2 (CLP = 40:50:10) was 485.45 mL/g VS, the substrate degradation rate increased with temperature increase, and the low protein content of 10% could reduce ammonia inhibition. In addition, the analysis of the microbial community showed that the microbial diversity was higher under mesophilic conditions, which could better maintain the balance between acidogenic bacteria and methanogens, thereby promoting organic waste conversion and methane production.
Based on the CLP ratio study, the experimental error caused by the difference in the chemical composition of different raw materials was eliminated, and the universality of the test results was enhanced. The interaction of CLP composition and temperature enhanced the adaptability of substrates to the environment. In this study, the optimal mixing ratio of FW was based on CLP ratio and temperature, which provided a data reference for determining the optimal process conditions of large-scale biogas projects. However, there were certain differences between the laboratory-scale batch tests and the biogas projects, and continuous fermentation test of CSTR might be added later to enhance the practicality of the test results. In addition, temperature was only one of the environmental factors affecting AD, and the comprehensive effect between other environmental factors and substrates should be further considered to determine the optimal AcoD process conditions.

Author Contributions

Conceptualization and writing, S.Z.; review and editing, J.S. and X.W.; methodology, S.Z. and Y.W.; software, S.Z., C.S. and Z.S.; validation, S.Z. and R.W.; supervision, Y.F. and G.R.; funding acquisition, G.Y. and X.W. All authors have read and agreed to the published version of the manuscript.

Funding

This research was funded by National Natural Science Foundation of China (41871205), Scientific research plan projects of Shaanxi province (2020SF-356), Science and Technology Plan Project of Xi’an (20NYYF0008), Innovation Capability Support Plan project of Shaanxi Province (2019PT-13), Youth Talent Cultivation Program Funding of Northwest A&F University, Special Research for Rural Vitalization Strategy (Z1090219062), Shaanxi Engineering Research Center of Circular Agriculture (2019HBGC-13).

Institutional Review Board Statement

Not applicable.

Informed Consent Statement

Not applicable.

Data Availability Statement

Not applicable.

Conflicts of Interest

The authors declare that they have no known competing financial interest or personal relationships that could have appeared to influence the work reported in this paper.

Abbreviations

AD, anaerobic digestion; AcoD, anaerobic co-digestion; FW, food waste; TS, total solids; VS, volatile solids; CLP, carbohydrate-lipid-protein; TMP, theoretical methane production; AMP, actual methane production; GR, gasification rate; VFA, volatile fatty acid; LCFAs, long-chain fatty acids; AN, ammonia nitrogen; FA, free ammonia; QIIME, quantitative insights into microbial ecology; OTU, operational taxonomic unit; RA, relative abundances; PCA, principal component analysis.

References

  1. Kang, X.; Liu, Y. Chemically enhanced primary sludge as an anaerobic co-digestion additive for biogas production from food waste. Processes 2019, 7, 709. [Google Scholar] [CrossRef] [Green Version]
  2. Song, J.; Wang, Y.; Zhang, S.; Song, Y.; Xue, S.; Liu, L.; Lvy, X.; Wang, X.; Yang, G. Coupling biochar with anaerobic digestion in a circular economy perspective: A promising way to promote sustainable energy, environment and agriculture development in China. Renew. Sustain. Energy Rev. 2021, 144, 110973. [Google Scholar] [CrossRef]
  3. Pramanik, S.K.; Suja, F.B.; Porhemmat, M.; Pramanik, B.K. Performance and kinetic model of a single-stage anaerobic digestion system operated at different successive operating stages for the treatment of food waste. Processes 2019, 7, 600. [Google Scholar] [CrossRef] [Green Version]
  4. Xu, F.; Li, Y.; Ge, X.; Yang, L.; Li, Y. Anaerobic digestion of food waste—Challenges and opportunities. Bioresour. Technol. 2018, 247, 1047–1058. [Google Scholar] [CrossRef] [PubMed]
  5. Jin, C.; Sun, S.; Yang, D.; Sheng, W.; Ma, Y.; He, W.; Li, G. Anaerobic digestion: An alternative resource treatment option for food waste in China. Sci. Total Environ. 2021, 779, 146397. [Google Scholar] [CrossRef]
  6. Wang, X.; Yang, G.; Li, F.; Feng, Y.; Ren, G.; Han, X. Evaluation of two statistical methods for optimizing the feeding composition in anaerobic co-digestion: Mixture design and central composite design. Bioresour. Technol. 2013, 131, 172–178. [Google Scholar] [CrossRef] [PubMed]
  7. Xue, S.; Wang, Y.; Lyu, X.; Zhao, N.; Song, J.; Wang, X.; Yang, G. Interactive effects of carbohydrate, lipid, protein composition and carbon/nitrogen ratio on biogas production of different food wastes. Bioresour. Technol. 2020, 312, 123566. [Google Scholar] [CrossRef]
  8. Chow, W.L.; Chong, S.; Lim, J.W.; Chan, Y.L.; Chong, M.F.; Tiong, T.J.; Chin, J.K.; Pan, G.-T. Anaerobic co-digestion of wastewater sludge: A review of potential co-substrates and operating factors for improved methane yield. Processes 2020, 8, 39. [Google Scholar] [CrossRef] [Green Version]
  9. Hagos, K.; Zong, J.; Li, D.; Liu, C. Anaerobic co-digestion process for biogas production: Progress, challenges and perspectives. Renew. Sustain. Energy Rev. 2017, 76, 1485–1496. [Google Scholar] [CrossRef]
  10. Hoelzle, R.D.; Virdis, B.; Batstone, D.J. Regulation mechanisms in mixed and pure culture microbial fermentation. Biotechnol. Bioeng. 2014, 111, 2139–2154. [Google Scholar] [CrossRef]
  11. Cardenas-Cleves, L.M.; Marmolejo-Rebellon, L.F.; Torres-Lozada, P. Improvement of the biochemical methane potential of food waste by means of anaerobic co-digestion with swine manure. Braz. J. Chem. Eng. 2018, 35, 1219–1229. [Google Scholar] [CrossRef]
  12. Hubenov, V.N.; Mihaylova, S.N.; Simeonov, S. Anaerobic co-digestion of waste fruits and vegetables and swine manure in a pilot-scale bioreactor. Bulg. Chem. Commun. 2015, 47, 788–792. [Google Scholar]
  13. Li, L.; Peng, X.; Wang, X.; Wu, D. Anaerobic digestion of food waste: A review focusing on process stability. Bioresour. Technol. 2018, 248, 20–28. [Google Scholar] [CrossRef] [PubMed]
  14. Chew, K.R.; Leong, H.Y.; Khoo, K.S.; Vo, D.-V.N.; Anjum, H.; Chang, C.-K.; Show, P.L. Effects of anaerobic digestion of food waste on biogas production and environmental impacts: A review. Environ. Chem. Lett. 2021, 19, 2921–2939. [Google Scholar] [CrossRef]
  15. Shi, X.; Guo, X.; Zuo, J.; Wang, J.; Zhang, M. A comparative study of thermophilic and mesophilic anaerobic co-digestion of food waste and wheat straw: Process stability and microbial community structure shifts. Waste Manag. 2018, 75, 261–269. [Google Scholar] [CrossRef]
  16. Lee, M.; Hidaka, T.; Hagiwara, W.; Tsuno, H. Comparative performance and microbial diversity of hyperthermophilic and thermophilic co-digestion of kitchen garbage and excess sludge. Bioresour. Technol. 2009, 100, 578–585. [Google Scholar] [CrossRef]
  17. Montanes, R.; Solera, R.; Perez, M. Anaerobic co-digestion of sewage sludge and sugar beet pulp lixiviation in batch reactors: Effect of temperature. Bioresour. Technol. 2015, 180, 177–184. [Google Scholar] [CrossRef]
  18. Gu, J.; Liu, R.; Cheng, Y.; Stanisavljevic, N.; Li, L.; Peng, X.; Wang, X. Anaerobic co-digestion of food waste and sewage sludge under mesophilic and thermophilic conditions: Focusing on synergistic effects on methane production. Bioresour. Technol. 2020, 301, 7. [Google Scholar] [CrossRef]
  19. Wang, X.; Lu, X.; Li, F.; Yang, G. Effects of temperature and carbon-nitrogen (c/n) ratio on the performance of anaerobic co-digestion of dairy manure, chicken manure and rice straw: Focusing on ammonia inhibition. PLoS ONE 2014, 9, e97265. [Google Scholar] [CrossRef] [Green Version]
  20. De Vrieze, J.; Verstraete, W. Perspectives for microbial community composition in anaerobic digestion: From abundance and activity to connectivity. Environ. Microbiol. 2016, 18, 2797–2809. [Google Scholar] [CrossRef] [PubMed]
  21. Li, L.; He, Q.; Ma, Y.; Wang, X.; Peng, X. A mesophilic anaerobic digester for treating food waste: Process stability and microbial community analysis using pyrosequencing. Microb. Cell Factories 2016, 15, 65. [Google Scholar] [CrossRef] [PubMed] [Green Version]
  22. Kirkegaard, R.H.; McIlroy, S.J.; Kristensen, J.M.; Nierychlo, M.; Karst, S.M.; Dueholm, M.S.; Albertsen, M.; Nielsen, P.H. The impact of immigration on microbial community composition in full-scale anaerobic digesters. Sci. Rep. 2017, 7, 9343. [Google Scholar] [CrossRef] [PubMed]
  23. Zhou, J.; Zhang, H.; Liu, J.; Gong, L.; Yang, X.; Zuo, T.; Wang, J.; You, W.; Jia, Q.; Wang, L. Effects of Fe3O4 nanoparticles on anaerobic digestion enzymes and microbial community of sludge. Environ. Technol. 2021, in press. [Google Scholar] [CrossRef]
  24. Rabii, A.; Aldin, S.; Dahman, Y.; Elbeshbishy, E. A review on anaerobic co-digestion with a focus on the microbial populations and the effect of multi-stage digester configuration. Energies 2019, 12, 1106. [Google Scholar] [CrossRef] [Green Version]
  25. Wang, P.; Wang, H.; Qiu, Y.; Ren, L. Microbial characteristics in anaerobic digestion process of food waste for methane production-A review. Bioresour. Technol. 2018, 248, 29–36. [Google Scholar] [CrossRef]
  26. Mainardis, M.; Cabbai, V.; Zannier, G.; Visintini, D.; Goi, D. Characterization and bmp tests of liquid substrates for high-rate anaerobic digestion. Chem. Biochem. Eng. Q. 2017, 31, 509–518. [Google Scholar] [CrossRef]
  27. Mainardis, M.; Flaibani, S.; Mazzolini, F.; Peressotti, A. Techno-economic analysis of anaerobic digestion implementation in small Italian breweries and evaluation of biochar and granular activated carbon addition effect on methane yield. J. Environ. Chem. Eng. 2019, 7, 103184. [Google Scholar] [CrossRef]
  28. Alibardi, L.; Cossu, R. Composition variability of the organic fraction of municipal solid waste and effects on hydrogen and methane production potentials. Waste Manag. 2015, 36, 147–155. [Google Scholar] [CrossRef] [PubMed]
  29. Angelidaki, I.; Sanders, W. Assessment of the anaerobic biodegradability of macropollutants. Rev. Environ. Sci. Biotechnol. 2004, 3, 117–129. [Google Scholar] [CrossRef]
  30. Sun, Y.F.; Wang, D.; Yan, J.; Quiao, W.; Wang, W.; Zhu, T. Effects of lipid concentration on anaerobic co-digestion of municipal biomass wastes. Waste Manag. 2014, 34, 1025–1034. [Google Scholar] [CrossRef]
  31. Xue, S.R.; Zhao, N.; Song, J.H.; Wang, X. Interactive effects of chemical composition of food waste during anaerobic co-digestion under thermophilic temperature. Sustainability 2019, 11, 2933. [Google Scholar] [CrossRef] [Green Version]
  32. Loganath, R.; Senophiyah-Mary, J. Critical review on the necessity of bioelectricity generation from slaughterhouse industry waste and wastewater using different anaerobic digestion reactors. Renew. Sustain. Energy Rev. 2020, 134, 110360. [Google Scholar] [CrossRef]
  33. Sanjaya, E.H.; Cheng, H.; Li, Y.Y. Mesophilic methane fermentation performance and ammonia inhibition of fish processing wastewater treatment using a self-agitated anaerobic baffled reactor. Bioresour. Technol. 2020, 313, 123644. [Google Scholar] [CrossRef] [PubMed]
  34. Sung, S.; Liu, T. Ammonia inhibition on thermophilic anaerobic digestion. Chemosphere 2003, 53, 43–52. [Google Scholar] [CrossRef]
  35. Peng, X.; Zhang, S.; Li, L.; Zhao, X. Long-term high-solids anaerobic digestion of food waste: Effects of ammonia on process performance and microbial community. Bioresour. Technol. 2018, 262, 148–158. [Google Scholar] [CrossRef]
  36. Ros, M.; Filho, J.d.S.O.; Perez Murcia, M.D.; Dolores, M.; Bustamante, M.A.; Moral, R.; Coll, M.D.; Lopez, S.-T.; Ana, B.; Pascual, J.A. Mesophilic anaerobic digestion of pig slurry and fruit and vegetable waste: Dissection of the microbial community structure. J. Clean. Prod. 2017, 156, 757–765. [Google Scholar] [CrossRef]
  37. Carballa, M.; Regueiro, L.; Lema, J.M. Microbial management of anaerobic digestion: Exploiting the microbiome-functionality nexus. Curr. Opin. Biotechnol. 2015, 33, 103–111. [Google Scholar] [CrossRef]
  38. Amha, Y.M.; Sinha, P.; Lagman, J.; Gregori, M. Elucidating microbial community adaptation to anaerobic co-digestion of fats, oils, and grease and food waste. Water Res. 2017, 123, 277–289. [Google Scholar] [CrossRef]
  39. Mu, H.; Zhao, C.; Zhao, Y.; Li, Y.; Hua, D.; Zhang, X.; Xu, H. Enhanced methane production by semi-continuous mesophilic co-digestion of potato waste and cabbage waste: Performance and microbial characteristics analysis. Bioresour. Technol. 2017, 236, 68–76. [Google Scholar] [CrossRef]
  40. Yuan, H.P.; Chen, Y.; Dai, X.H.; Zhu, N. Kinetics and microbial community analysis of sludge anaerobic digestion based on micro-direct current treatment under different initial ph values. Energy 2016, 116, 677–686. [Google Scholar] [CrossRef]
  41. Ao, T.; Xie, Z.; Zhou, P.; Liu, X.; Wan, L.; Li, D. Comparison of microbial community structures between mesophilic and thermophilic anaerobic digestion of vegetable waste. Bioprocess. Biosyst. Eng. 2021, 44, 1201–1214. [Google Scholar] [CrossRef]
  42. Chen, H.; Huang, R.; Wu, J.; Zhang, W.; Han, Y.; Xiao, B.; Wang, D.; Zhou, Y.; Liu, B.; Yu, G. Biohythane production and microbial characteristics of two alternating mesophilic and thermophilic two-stage anaerobic co-digesters fed with rice straw and pig manure. Bioresour. Technol. 2021, 320, 124303. [Google Scholar] [CrossRef] [PubMed]
  43. Liu, R.; Gong, H.; Xu, Y.; Cai, C.; Hua, Y.; Li, L.; Dai, L.; Dai, X. The transition temperature (42 °C) from mesophilic to thermophilic micro-organisms enhances biomethane potential of corn stover. Sci. Total Environ. 2021, 759, 143549. [Google Scholar] [CrossRef]
Figure 1. Daily methane production from different mixtures of substrates under mesophilic conditions (A) and thermophilic conditions (B) (note: the data were the mean of three repetitions).
Processes 09 01682 g001
Figure 2. Profiles of volatile fatty acid (VFA) concentration and pH value variation of co-digestion under mesophilic conditions (a,A) and thermophilic conditions (b,B) (note: the data were the mean of three repetitions, and error bars indicate standard deviation. a and A represent VFA concentration and pH value at mesophilic conditions, b and B represent VFA concentration and pH value at thermophilic conditions.).
Processes 09 01682 g002
Figure 3. Concentrations of ammonium nitrogen (AN) and free ammonia (FA) under mesophilic conditions (A,a) and thermophilic conditions (B,b) (note: the data were the mean of three repetitions, and error bars indicated standard deviation. A and a represent concentrations of AN and FA at mesophilic conditions, B and b represent concentrations of AN and FA at thermophilic conditions.).
Processes 09 01682 g003
Figure 4. Microbial profiles of the bacterial genera (A) and the archaeal genera (B) (only bacterial and archaeal genera with relative abundance of ≥0.5% in at least one digester are presented; the rest were classified as others; all other unidentified were included in unclassified).
Processes 09 01682 g004
Figure 5. Principal component analysis (PCA) of bacterial (A) and archaeal (B) operational taxonomic unit (OTU) distribution generated by 16S rRNA gene sequencing.
Processes 09 01682 g005
Table 1. Characteristics of substrates.
ParametersCRWPPOInoculum
TS (%)42.81 ± 0.7227.20 ± 0.4999.96 ± 0.014.48 ± 0.34
VS (%)97.63 ± 1.0995.23 ± 0.5399.85 ± 0.122.21 ± 0.15
TN (% VS)1.10 ± 0.637.14 ± 0.66--
TOC (% VS)46.80 ± 0.1953.22 ± 1.6560.71 ± 1.15-
Carbohydrate (% VS)92.24 ± 0.181.43 ± 1.14--
Protein (% VS)7.13 ± 1.0246.00 ± 0.95--
Lipid (% VS)0.72 ± 0.9946.62 ± 1.3100-
Ash (% TS)2.40 ± 0.114.71 ± 0.070.19 ± 0.0597.83 ± 0.19
Note: CR, cooked rice; WP, waste pork; PO, plant oil; TS, total solid content; VS, volatile solid content; TN, total nitrogen; TOC, total organic carbon.
Table 2. Different mixtures of substrates.
35 °C55 °CCarbohydrate (% VS)Lipid (% VS)Protein (% VS)C/N
M1T120503011.51
M2T240501033.18
M3T340402016.33
M4T420602017.64
Table 3. Gasification rate (GR) and actual methane production (AMP) under mesophilic conditions and thermophilic conditions (note: the data were the mean of three repetitions with standard deviation).
SampleAMP (mL/g VS)TMP (mL/g VS)GR (%)
M1552.02 ± 61.09738.874.72 ± 8.27
M2387.50 ± 55.43722.653.63 ± 7.67
M3277.60 ± 26.71670.841.38 ± 3.98
M4339.74 ± 47.11790.642.97 ± 5.96
T1329.81 ± 26.12738.844.64 ± 3.54
T2485.45 ± 47.44722.667.18 ± 6.57
T3377.12 ± 18.98670.856.22 ± 2.83
T4257.47 ± 41.80790.632.57 ± 5.29
Table 4. Microbial diversity indexes of the microbial community.
SampleM1M2M3M4T1T2T3T4
BacterialOTUs331347353331344321327330
Simpson0.970.970.970.970.960.980.960.96
Shannon6.846.696.726.626.196.786.326.27
ArchaealOTUs310251309279331363310354
Simpson0.910.870.830.870.790.970.770.86
Shannon5.324.694.494.624.296.733.804.87
Publisher’s Note: MDPI stays neutral with regard to jurisdictional claims in published maps and institutional affiliations.

