Article

Numerical Study on Flow and Release Characteristics of Gas Extinguishing Agent under Different Filling Pressure and Amount Conditions

School of Chemistry and Chemical Engineering, Nanjing University of Science and Technology, Nanjing 210094, China
*
Author to whom correspondence should be addressed.
Submission received: 16 August 2021 / Revised: 14 September 2021 / Accepted: 18 September 2021 / Published: 20 September 2021

Abstract

:
The fire-extinguishing system is an indispensable fire-protection facility on the aircraft. In order to guide weight reduction of the aircraft’s fixed gas fire-extinguishing system by improving its release efficiency, so as to improve fuel economy and reduce carbon emissions, the influence of filling pressures and filling amounts on the release efficiency of gas extinguishing agent along pipelines were studied based on numerical simulations. The release process of the fire-extinguishing system was analyzed. The effects of the filling pressure and filling amount of Halon 1301 agent on the release characteristics, such as release time, mass flow rate, and gasification ratio, were studied. Results show that the release process can be divided into three major phases, which are firstly the initial rapid filling of the pipeline, secondly the concentrated release of the liquid extinguishing agent, and thirdly the gas ejection along the pipeline. The second phase can also be subdivided into two stages: the outflow of the liquid extinguishing agent from the bottle, and the release of the residual liquid extinguishing agent along the pipeline. The release characteristics of the fire-extinguishing agent were obviously affected by the filling pressures and filling amounts. When the filling pressure was relatively low (2.832 MPa), increasing the filling pressure can significantly increase the mass flow rate, shorten the release time, and reduce the gasification ratio of the extinguishing agent during the release processes. Under the same filling pressure, with the increase of the filling amount of the extinguishing agent, the release times and the gasification ratio showed a linear increase trend, while the average mass flow rates showed a linear decrease trend.

1. Introduction

Fire is one of the main factors that threaten aircraft safety. Since passengers cannot escape from the aircraft during flight, the fire-extinguishing system has become an indispensable fixed firefighting facility [1], and its fire-extinguishing performance is extremely demanding. Especially for commercial aircraft, in addition to high fire safety requirements, there are strict requirements for fuel economy. According to statistics, air travel carbon emissions accounted for 11% of transportation emissions as early as 2010, and the proportion is still increasing [2]. In the context of global energy conservation and emission reduction, in order to promote the healthy and sustainable development of the aviation industry, many countries in the world have made various energy-conservation and emission-reduction plans for the aviation industry to save costs and improve operational efficiency and profitability [3,4]. This means that energy saving has become an important factor in aircraft design, and reducing the weight of the aircraft itself is one of the most effective means [5]. Notably, the performance of fire-extinguishing systems is closely related to the filling conditions of fire extinguishers [6,7,8,9]. Reasonable design of fire-extinguishing systems can reduce the amount of fire-extinguishing agent and reduce the pressure requirement of fire-extinguishing system on the premise of ensuring the fire safety of aircraft, so as to realize the purpose of weight reduction of aircraft. Therefore, studying the influence of filling conditions on the flow and release characteristics in the pipeline, which can provide a theoretical basis for the optimization design of aircraft fire-extinguishing system and aircraft weight reduction, has important practical value.
Some attention was devoted to the flow characteristics of the gas fire-extinguishing system, such as the pipeline flow and spatial diffusion. As early as 1976, Williamson [10] carried out a study on the pressure drop and flow characteristics of the Halon 1301 flow in pipelines. The results showed that the rate of pressure drop was heavily dependent on the percent of agent in the pipeline, and the ratio of pipe volume to agent volume had a substantial effect on the average flow rate. Tuzla et al. [11] developed a calculation program for single-phase and two-phase flow characteristics of fire-extinguishing agent in the pipeline based on multiphase flow model, and realized the accurate calculation of pressure drop and flow rate of fire-extinguishing agent in pipe flow process. Kim et al. [12] employed FLUENT software to simulate the flow characteristics of Halon 1301 in the pipeline of aircraft fire-extinguishing system, and analyzed the influence of rupture surface area and pipeline diameter on the mass fraction of fire-extinguishing agent. It was found that the Halon mass fraction at the end of the pipeline was much sensitive to the rupture surface area, which was mainly due to the obvious resistance increase induced by the decrease of rupture surface area. Moreover, the mass fraction of the Halon discharged from the outlet of the pipe was significantly affected by the diameter of the pipeline, which increased with the increase of the diameter. Clegg et al. [13] presented an original methodology to quantify the flexibility of the gas network, which was achieved by using both steady-state and transient gas analyses. Ekhtiari et al. [14] provided a novel method to solve gas flow equations through a network under steady-state conditions, which could be applied as a reliable fast method to model various conditions in a gas network. Lu et al. [6] employed ASPEN HYSYS software to study the effects of pipe diameter, inlet temperature and pressure on the pressure and temperature changes of liquid CO2 in the pipeline under the condition of large height difference, and they analyzed the internal relationship between the phase-change rate and the flow rate. It was found that the phase transition rate in the pipeline was seriously affected by the transporting flow rate. When the transporting flow rate was larger than the maximum safe transporting flow rate, the liquid CO2 would undergo phase change dramatically, which would lead to a sudden drop in temperature and pressure. Xiao et al. [15] investigated the transient behavior of liquid CO2 decompression during pipeline transportation with the ANSYS FLUENT software. It was found that the evaporation coefficient had a significant impact on the transition behavior of CO2 decompression, while the condensation coefficient made no difference. Moreover, the phase transition of liquid CO2 was significantly affected by the flow velocity.
In recent years, there have been some studies on the flow and diffusion characteristics of fire-extinguishing agents in the aircraft cabin. Niu et al. [16] numerically studied the distribution of the concentration of fire-extinguishing agent in helicopter nacelle by FDS (Fire Dynamics Simulator), and they analyzed the characteristics of the concentration in the cabin under different mass flow rates. Based on FDS, Ma et al. [17] simulated the concentration distribution of gas fire-extinguishing agent in the high-speed ventilation flow field. In their study, the flow of the fire-extinguishing agent was simplified as trapezoidal change. The obvious diffusion differences in different release modes of fire extinguishers were discussed. Using the lumped parameter approach method, Kurokawa et al. [18] calculated the variation of Halon volumetric concentration, Halon and air mass fluxes and the cargo compartment pressure with time in the aircraft cargo compartment. In their study, the flow rate of extinguishing agent was also simplified as a ladder shape, and the time of Halon concentration to achieve the fire suppressant value in the cabin was predicted by ignoring the heterogeneity of spatial concentration. Kim et al. [19] adopted CFD software to study the influence of temperature on the retention time of IG541 extinguishing agent in the protected space. Due to the influence of thermal effect, the species diffusion was accelerated with the increase of temperature, resulting in the shortening of the retention time of the extinguishing agent. By using DBI (Diffuse Back-Light Illumination) and Schlieren optical techniques, Payri et al. [7] measured the spatial dispersion characteristics of water and Novec 1230 sprayed through two different types of nozzles, and analyzed the influence of nozzle structure on the spatial atomization and motion diffusion of extinguishing agents.
It is noteworthy that the filling conditions have an important influence on the mass flow rate, duration and phase transition rate of the fire-extinguishing agent flowing in the pipeline, which further affects the diffusion and concentration distribution of the extinguishing agent in the protected space, so as to affect the fire prevention efficiency of the extinguishing system. However, the influence of filling conditions on the flow and release characteristics of extinguishing agent in pipe has received little attention in previous studies. In addition, it is a considerably complex gas–liquid two-phase flow that the fire-extinguishing bottle releases extinguishing agent into the pipeline, which process is unsteady. The transient variation characteristics (mass flow rate, flow velocity, volume fraction, etc.) of liquid and gas phase extinguishing agents in the flow process are extremely important, but these characteristics are much difficult to be accurately quantitatively characterized by experiments. However, numerical simulation can well address this deficiency.
Therefore, in order to deeply understand the flow characteristics and internal mechanisms of the fire-extinguishing agent released into the pipeline by the fire-extinguishing bottle, so as to guide the optimization design of the aircraft fire-extinguishing system and promote the reasonable weight reduction of the aircraft, a simplified pipeline simulation model of the fire-extinguishing system was established, and its accuracy was verified by the experimental results. Based on this model, the flow and release process of the extinguishing agent along the pipeline were analyzed, focusing on the changes of liquid and gaseous extinguishing agents in the flow process. The influence of the initial filling pressure and the filling amount of the fire-extinguishing agent on the release duration, mass flow rate and gasification ratio of the extinguishing agent were studied.

2. Numerical and Experiment Setup

2.1. Governing Equations and Boundary Conditions

A three-dimensional unsteady model was developed with ANSYS FLUENT, as shown in Figure 1a, to study the release characteristics of Halon 1301 in the fire-extinguishing system. As shown in Figure 1b, the unstructured grid was divided by the Robust (Octree) method, and the mesh type was tetrahedral/mixed. In order to reduce the gradients of physical parameters in the iterative calculations and improve the stability and accuracy of the solution, meshes were refined in the wall area, the pipe connection area, the pipe diameter change area, and the pipe outlet area.
According to Williamson’s [10] experimental observation, the Halon 1301 and nitrogen flow in the pipeline is a gas–liquid dispersed bubble flow, and the bubble diameter is less than 0.01 inches. Therefore, in this study, the gas–liquid two-phase flow process was simulated by the mixture model. The flow process of Halon in the pipeline was regarded as a gas–liquid homogeneous and balanced multiphase flow. Each phase shared the same pressure and velocity field, and the slip velocity between phases was ignored. The governing equations describing the flow in the mixture model are presented as follows [20]:
Continuity equation:
t ( ρ m ) + · ( ρ m v m ) = 0
Momentum equation:
t ( ρ m v m ) + · ( ρ m v m 2 ) = P + · [ μ m ( v m + v m T ) ] + ρ m g + F + · ( k = 1 n α k ρ k v d r , k 2 )
Energy equation:
t k = 1 n ( α k ρ k E k ) + · k = 1 n ( α k v k ( ρ k E k + P ) ) = · ( k e f f T ) + S E
Volume fraction of discrete phase P:
t ( α p ρ p ) + · ( α p ρ p v m ) = S M
In the formulas, v m = k = 1 n α k ρ k v k ρ m represents the average mass velocity; ρ m = k = 1 n α k ρ k is the mixed density; F is a body force; v d r , k is the drift velocity for secondary phase k . P is the pressure; μ m = k = 1 n α k μ k + μ t , m represents the mixed viscosity; μ t , m is the vortex viscosity of mixed turbulence; E k = h k P ρ k + v k 2 2 represents the internal energy; k e f f = k = 1 n α k ( k k + k t ) is the effective thermal conductivity; α k is the volume fraction of k phase; n is the number of phases; S E denotes the source term, it includes any other volumetric heat sources. S M = m ˙ v l m ˙ l v represents the interphase mass transfer rate. Previous studies have shown that the Realizable k-ε model has good applicability for the numerical simulation of dense-phase gas-releases [21,22]. Therefore, the turbulence model was set as the Realizable k-ε model in this study. Moreover, the near wall region adopted a scalable wall function approach.

2.2. Phase Transition Model

Karathanassis [23] compared the molecular motion theory (Hertz–Knudsen equation), the thermodynamic equilibrium theory, the bubble dynamics method and the semi-empirical correlation for the fast boiling correction. When simulating the compressible flow of nozzle and high-pressure pipeline, it was found that the molecular motion theory method could obtain high accuracy. Since high pressures still occur in the pipeline in the release process of fire-extinguishing agent from the fire-extinguishing bottle into the pipeline, the present work employed the Hertz–Knudsen equation to describe the flow process of the extinguishing agent in the pipe. According to Schepper’s study [24], by combining the Hertz–Knudsen equation with the Clapeyron–Clausius equation, the evaporation and condensation processes were described as Equations (5) and (6), respectively.
The evaporation process ( T > T s a t ) can be expressed as follows:
m ˙ l v = r e α l ρ l T T s a t T s a t
The condensation process ( T < T s a t ) can be expressed as follows:
m ˙ v l = r c α v ρ v T T s a t T s a t
In the formulas, T s a t represents the saturation temperature of the medium, and r e and r c are the time relaxation factors to adjust the rate of phase transition. The values of r e and r c have significant influence on the accuracy of numerical simulation. Large r e and r c will lead to convergence problems, while small r e and r c will make the simulation results deviate from reality. In this paper, the values of r e and r c were both set to 100 according to Fang et al. [25].

2.3. Numerical Methodology

In order to simulate the two-phase flow process of Halon 1301 driven by nitrogen in the pipeline, unstructured grids were constructed throughout the structure, using ICEM CFD software. Figure 2 shows the curves of the pressure of the extinguishing bottle with the cell numbers of 104,806 and 224,948. As can be seen from the figure that the simulation results under the two different cell numbers are almost consistent. However, the solution time of the latter was about twice than that of the former. Considering the calculation cost and grid sensitivity, the calculation domain was divided into 104,806 cells in this study. The phase-change model was accomplished by using a User-Defined Function (UDF). The end of the pipe was set as the pressure outlet boundary condition, and its value was set as 0 Pa (gauge pressure). The rest of the pipe were set as wall boundary conditions. The initial filling pressure of the extinguishing bottle was set by using the Patch function in FLUENT software. The “SIMPLEC” algorithm was used for the treatment of the pressure–velocity coupling. The density and momentum terms were discretized with the second order upwind scheme, and the “PRESTO!” scheme was applied for the interpolation of the pressure term. For the transient formulation, second order implicit scheme was chosen for iteration convergence of the residuals. In the calculation process, the initial time step was set to be 1 × 10⁻⁴ s, and the time step after convergence was set to be 2 × 10⁻⁴ s. The convergence criterion of the energy equation was set to be 1 × 10⁻⁶, and the convergence criteria of the other equations were all set to be 1 × 10⁻³. The simulation was carried out by using a computer with an Intel Xeon E5-2670 CPU and took about 21 h to solve one case.

2.4. Verification of Simulation Model

In order to verify the accuracy of the calculation results, an experimental device consistent with the calculation model was built to carry out the release experiment of the extinguishing agent. As shown in Figure 3, the extinguishing bottle was connected to the valve inlet through a rectangular pipe, and the valve outlet was connected to a straight pipe. The fire-extinguishing bottle was made of 316 L stainless steel with a volume of about 1.4 L. Two pressure transmitters with the range of 0~5 MPa and the precision of ±0.04% were installed to record the pressure changes during release, one was installed on the top of the vessel for the real-time measurement of the vessel pressure, and the other was installed near the end of the pipeline for the measurement of pipe outlet pressure.
In the experiment, the fire-extinguishing bottle was vacuumed firstly, and then 1.195 kg Halon 1301 extinguishing agent was filled into it. Next, nitrogen was slowly filled into the vessel to increase its pressure to 4.832 MPa. Then, it was kept at room temperature for 1 h, so that the extinguishing agent and nitrogen were fully dissolved. Finally, the valve was opened to test the release and flow characteristics of the extinguishing agent.
Figure 4 shows the comparison between the simulation results and the experimental results of the vessel pressure during the release. It can be seen that the simulation results of the vessel pressure are in good agreement with the experimental results, and the trend of the two pressure curves is consistent, indicating that the simulation model established in this paper is reliable. Therefore, it was used to carry out the subsequent simulation of the release and flow process of the extinguishing agent in the pipeline under different filling conditions.

2.5. Design of Simulation Conditions

The filling pressure usually has a great influence on the flow and release characteristics of fire-extinguishing agent. In order to study its influence law, three groups of comparative tests were carried out under the same filling temperature and filling amount of the agent by changing the filling pressure of nitrogen in the vessel. The initial state parameters of the vessel are shown in Table 1. The volume percentages of the extinguishing agent and nitrogen in the gas and liquid phases were calculated according to the Dalton theorem and the Antoine equation. Dalton’s law and Antoine equation are shown as Equations (7) and (8), respectively.
P t o t a l = P i
l n P s a t = A + B / T
In the formulas, P t o t a l represents the total pressure of the mixed gas; P i denotes the partial pressure of component i ; P s a t represents the saturation pressure; T denotes the environment temperature; and A and B are constants.
In order to reveal the influence of the filling amount on the flow and release characteristics of the extinguishing agent, this paper carried out five sets of comparative experiments with different filling amounts under the same filling temperature and filling pressure. The initial state of the vessel is presented in Table 2. The volume percentages of the extinguishing agent and nitrogen in the gas and liquid phases were also calculated according to the Dalton theorem and the Antoine equation.

3. Results and Discussion

3.1. Release Process Analysis

The typical curves of the volume fraction and mass flow rate of each constituent at the pipe outlet of the fire-extinguishing system are presented in Figure 5a,b, respectively. It can be clearly seen from these two figures that the release process of the extinguishing agent presents three obvious stages. Firstly, at the beginning of the release, the extinguishing agent quickly filled into the pipeline, and violent phase transition occurred during the filling process, which promoted the exhaust of nitrogen in the pipeline. Secondly, after the pipeline was filled with liquid 1301 agent, the Halon 1301 agent was released continuously and intensively at the outlet of the pipe for a period of time. At first, it was mainly the liquid 1301 agent. As the release continued, the volume proportion and mass flow rate of the liquid 1301 agent decreased continuously, and the volume proportion of the gaseous 1301 agent increased at first and then decreased, while its mass flow rate increased continuously. This indicates that the Halon 1301 agent had been continuously undergoing the gasification phase transition in the pipe. Finally, after the release of the liquid 1301 agent, only the Halon 1301 vapor and nitrogen were released from the outlet of the pipeline, the mass flow rate of them decreased continuously until the end of the release. In addition, it can be seen from Figure 5b that the liquid mass flow rate of the extinguishing agent was much larger than that of the gaseous one during Phase II, and most of the extinguishing agents were released at this phase.
Figure 6 shows the pressure curves at the exit of the fire-extinguishing bottle (P1), the turning point of the pipeline (P2), the middle of the straight pipe (P3) and the end of the pipeline (P4) during the release of the extinguishing agent. Each curve shows the characteristics of the abovementioned three phases. In addition, in Phase I, as shown by the green ellipse in the figure, the pressure at P1 and P2 decreased suddenly and then increased significantly once the valve was opened. The initial pressure drop may be mainly due to a super saturation effect in which the liquid in the container did not boil immediately. By comparing Figure 5 and Figure 6, it can be seen that there is a significant peak in the volume fraction and mass flow rate curves of the Halon 1301 vapor in Phase I, indicating that the Halon 1301 agent underwent a sharp short-term gasification phase transition, which may be one of the internal reasons for the occurrence of the pressure rebound.
Figure 7 shows a cloud diagram of the volume fraction distribution of the liquid 1301 at different moments during the release process of the fire-extinguishing agent. The color in the figure from blue to red corresponds to the value of the volume fraction of the liquid 1301 agent from small to large, respectively. It can be clearly seen from the diagram that the extinguishing agent first flowed into the pipeline in the form of liquid, then gradually transited into the gas–liquid two-phase flow, and finally transformed into pure gas-phase flow. In summary, the release process of the extinguishing agent can be divided into three stages: initial rapid filling of the pipeline, liquid-based concentrated release, and residual gas release along the pipeline, which is consistent with the results of the previous phase division. The following discussion will focus on the relatively stable phase of the liquid-based concentrated release.

3.2. Effects of Filling Pressure on the Flow Characteristics

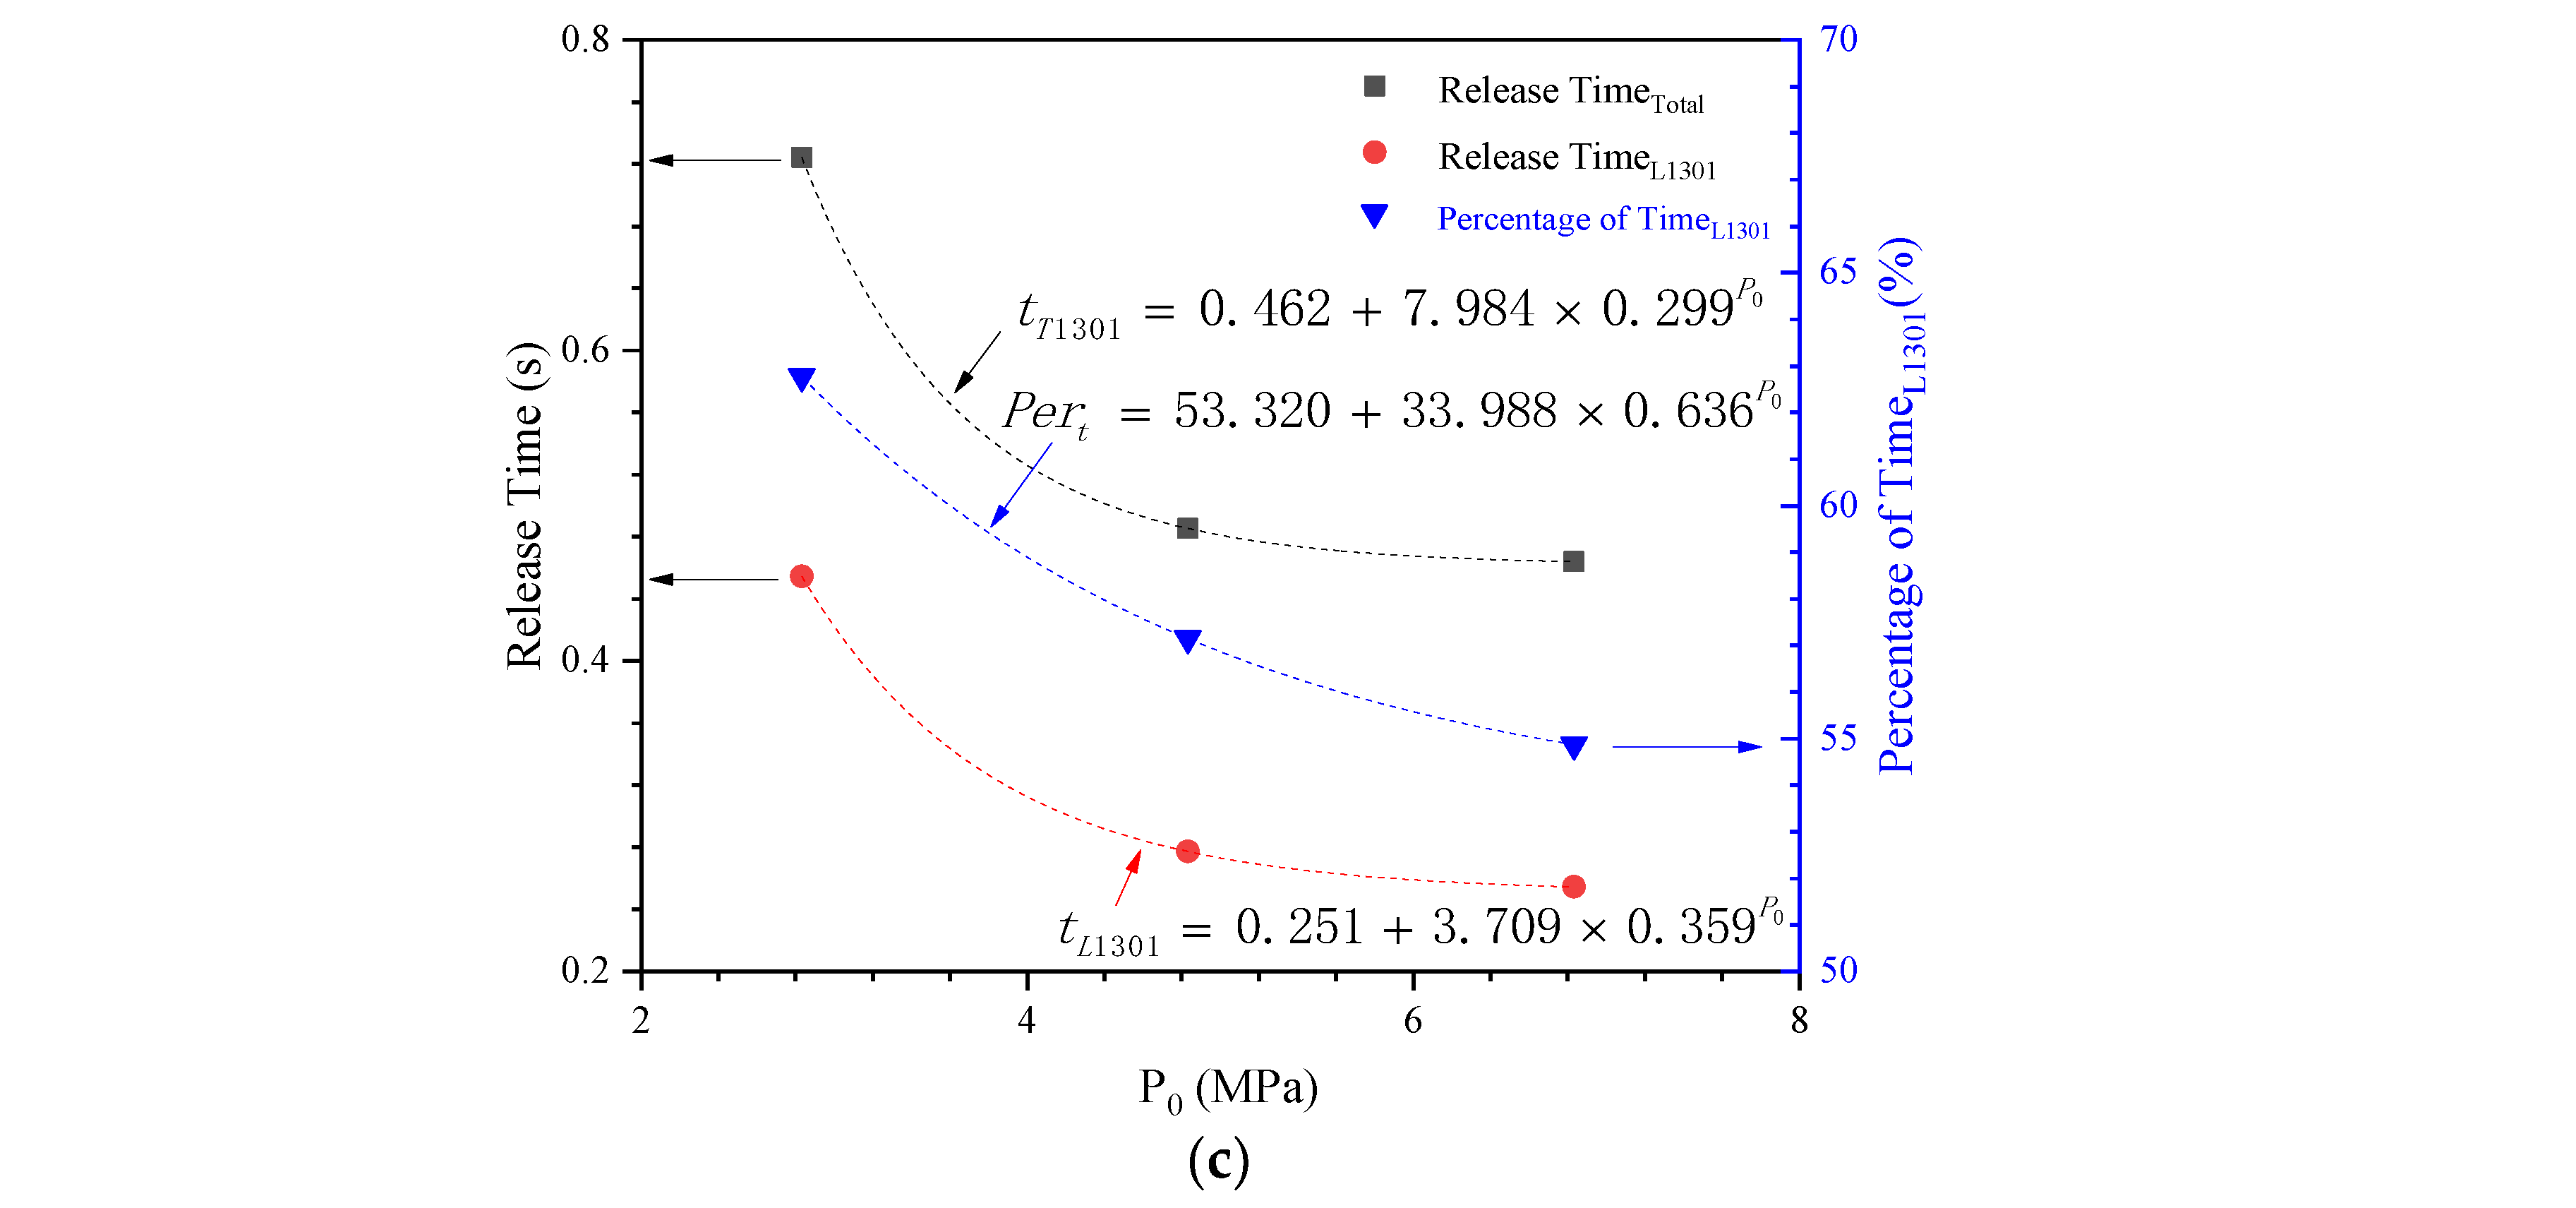
3.2.1. Effects of Filling Pressure on the Release Time

The release duration of the extinguishing agent is an important indicator to measure the performance of the fire-extinguishing system. The length of the release time directly affects the temporal and spatial distribution characteristics of the extinguishing agent in the protected space. It can be seen from the release process of the extinguishing agent in the previous section that the concentrated release of the extinguishing agent mainly corresponds to Phase II, and its duration is an important manifestation of the release rate of the extinguishing agent.
Figure 8a shows the pressure curves of the extinguishing bottle under different filling pressures. It can be seen from the figure that under the conditions of the same filling amount and filling temperature, the total release duration decreased with the increase of the filling pressure. Moreover, the pressure of the extinguishing bottle at the early release stage increased with the increase of the filling pressure. From the curve of the pressure drop rate of the extinguishing bottle presented in Figure 8b, it can be seen that the pressure drop rate increased with the increase of the filling pressure, and the drop rate showed a trend of rapid decrease first, then a slight increase, and finally a gradual decrease. In fact, the peak position of the pressure drop rate curve corresponds to the moment when the liquid extinguishing agent is released, and the corresponding relationship between the pressure change of the extinguishing bottle and the flow process will be analyzed in the next section.
In order to compare the release time of the extinguishing agent under different filling pressures, as shown in Figure 8c, the duration of the liquid extinguishing agent ( t L 1301 ) , the total release time of the extinguishing agent ( t T 1301 ) , and the percentage of the liquid extinguishing agent release time to the total release time ( P e r t ) were plotted against the filling pressure. It can be seen from the figure that the release time of the liquid extinguishing agent, the total release time of the extinguishing agent and the proportion of the duration of the liquid extinguishing agent in the total release time all decreased significantly with the increase of the filling pressure, and the three parameters all showed an exponential trend. The fitting results are shown in Equations (9)–(11), respectively, which means that at the same temperature and fire-extinguishing dose, increasing the amount of nitrogen and thus increasing the filling pressure is conducive to the rapid release of the liquid extinguishing agents. When the filling pressure was relatively low, increasing the filling pressure of driving gas had a significant effect on the release duration of the extinguishing agent. Meanwhile, with the increase of the filling pressure, further increasing the amount of the driving gas had a limited effect on shortening the duration of the extinguishing agent.
Combined the aforementioned analysis on the extinguishing agent release process in Section 3.1, it can be inferred that increasing the initial filling pressure can not only accelerate the filling process of the pipeline in Phase I and increase the flow rate of the extinguishing agent in Phase II, but also maintain high pressures in the pipe, thereby reducing the gasification rate of the extinguishing agent to facilitate its rapid flow. Due to the critical pressure of the phase transformation of the extinguishing agent, when the pressure in the pipe was higher than its critical pressure, further increasing the filling pressure had a limited influence on the gasification rate of the extinguishing agent, and therefore had a limited influence on its release time.
t L 1301 = 0.251 + 3.709 × 0.359 P 0
t T 1301 = 0.462 + 7.984 × 0.299 P 0
P e r t = 53.320 + 33.988 × 0.636 P 0
where t L 1301 and t T 1301 denote the release time of the liquid extinguishing agent (s) and the total release time of the extinguishing agent (s), respectively; P e r t represents the percentage of the release duration of the liquid extinguishing agent to the total release time (%); and P0 represents the filling pressure of the extinguishing bottle (MPa).

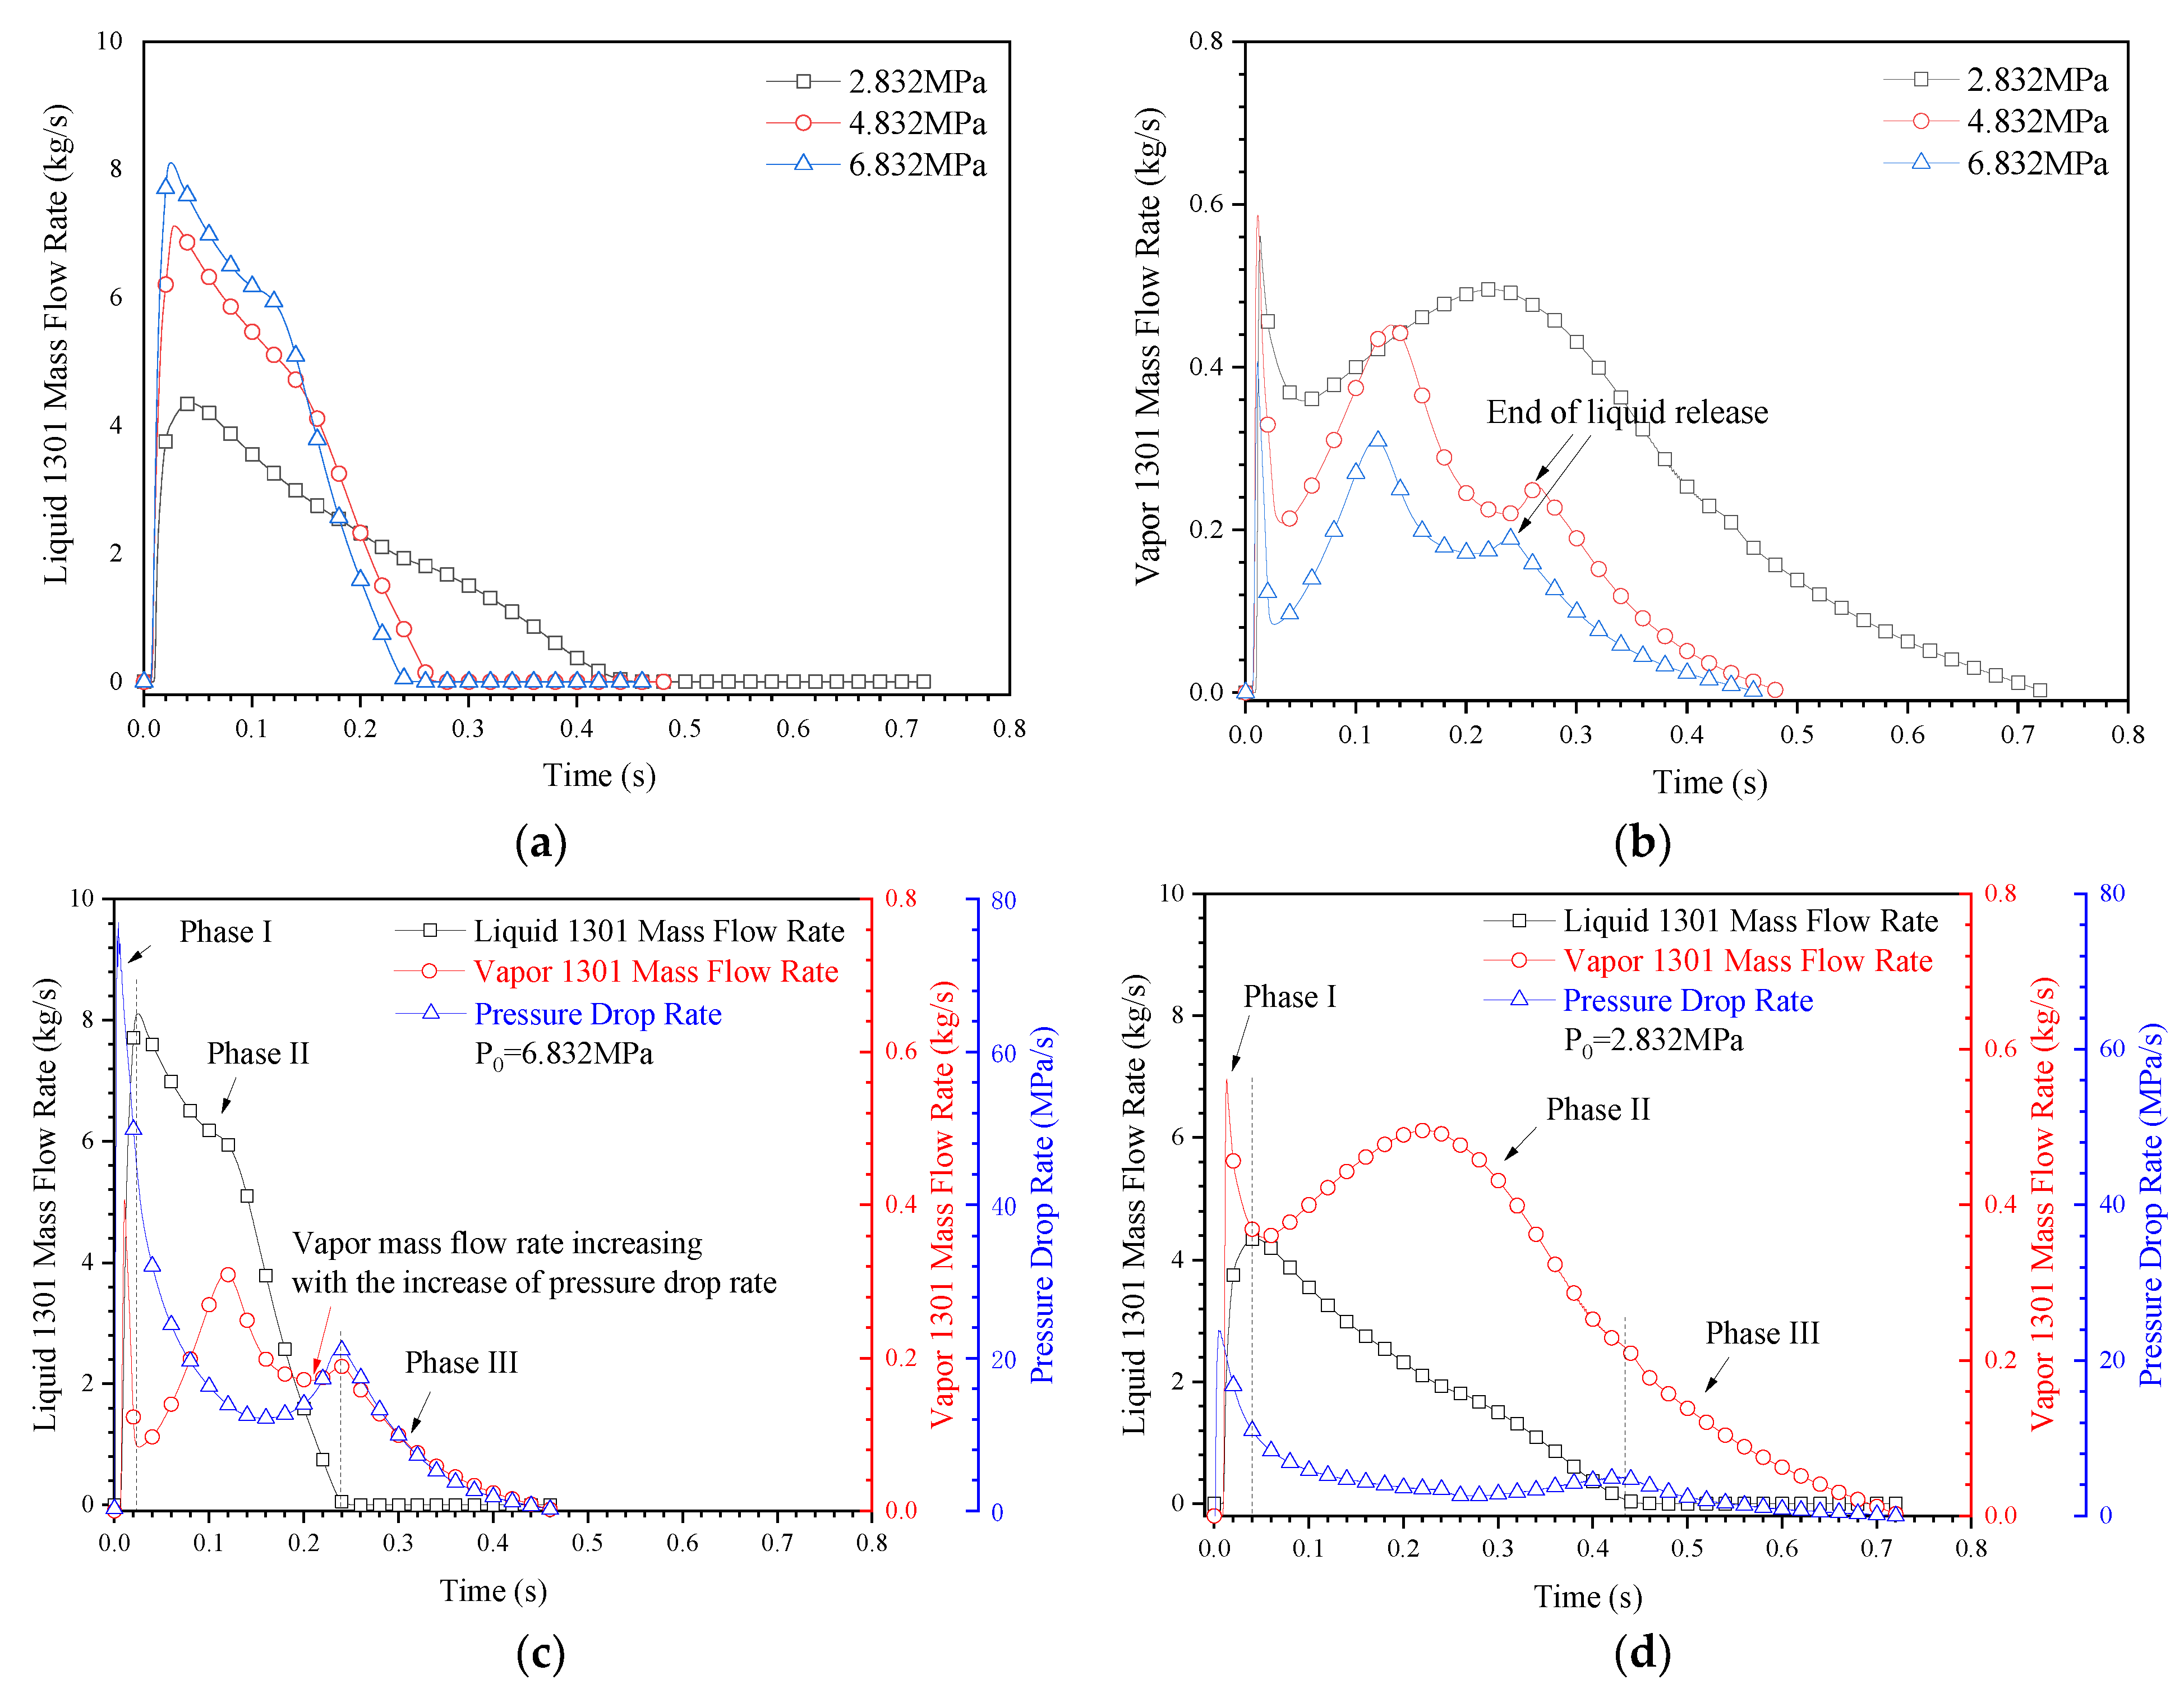
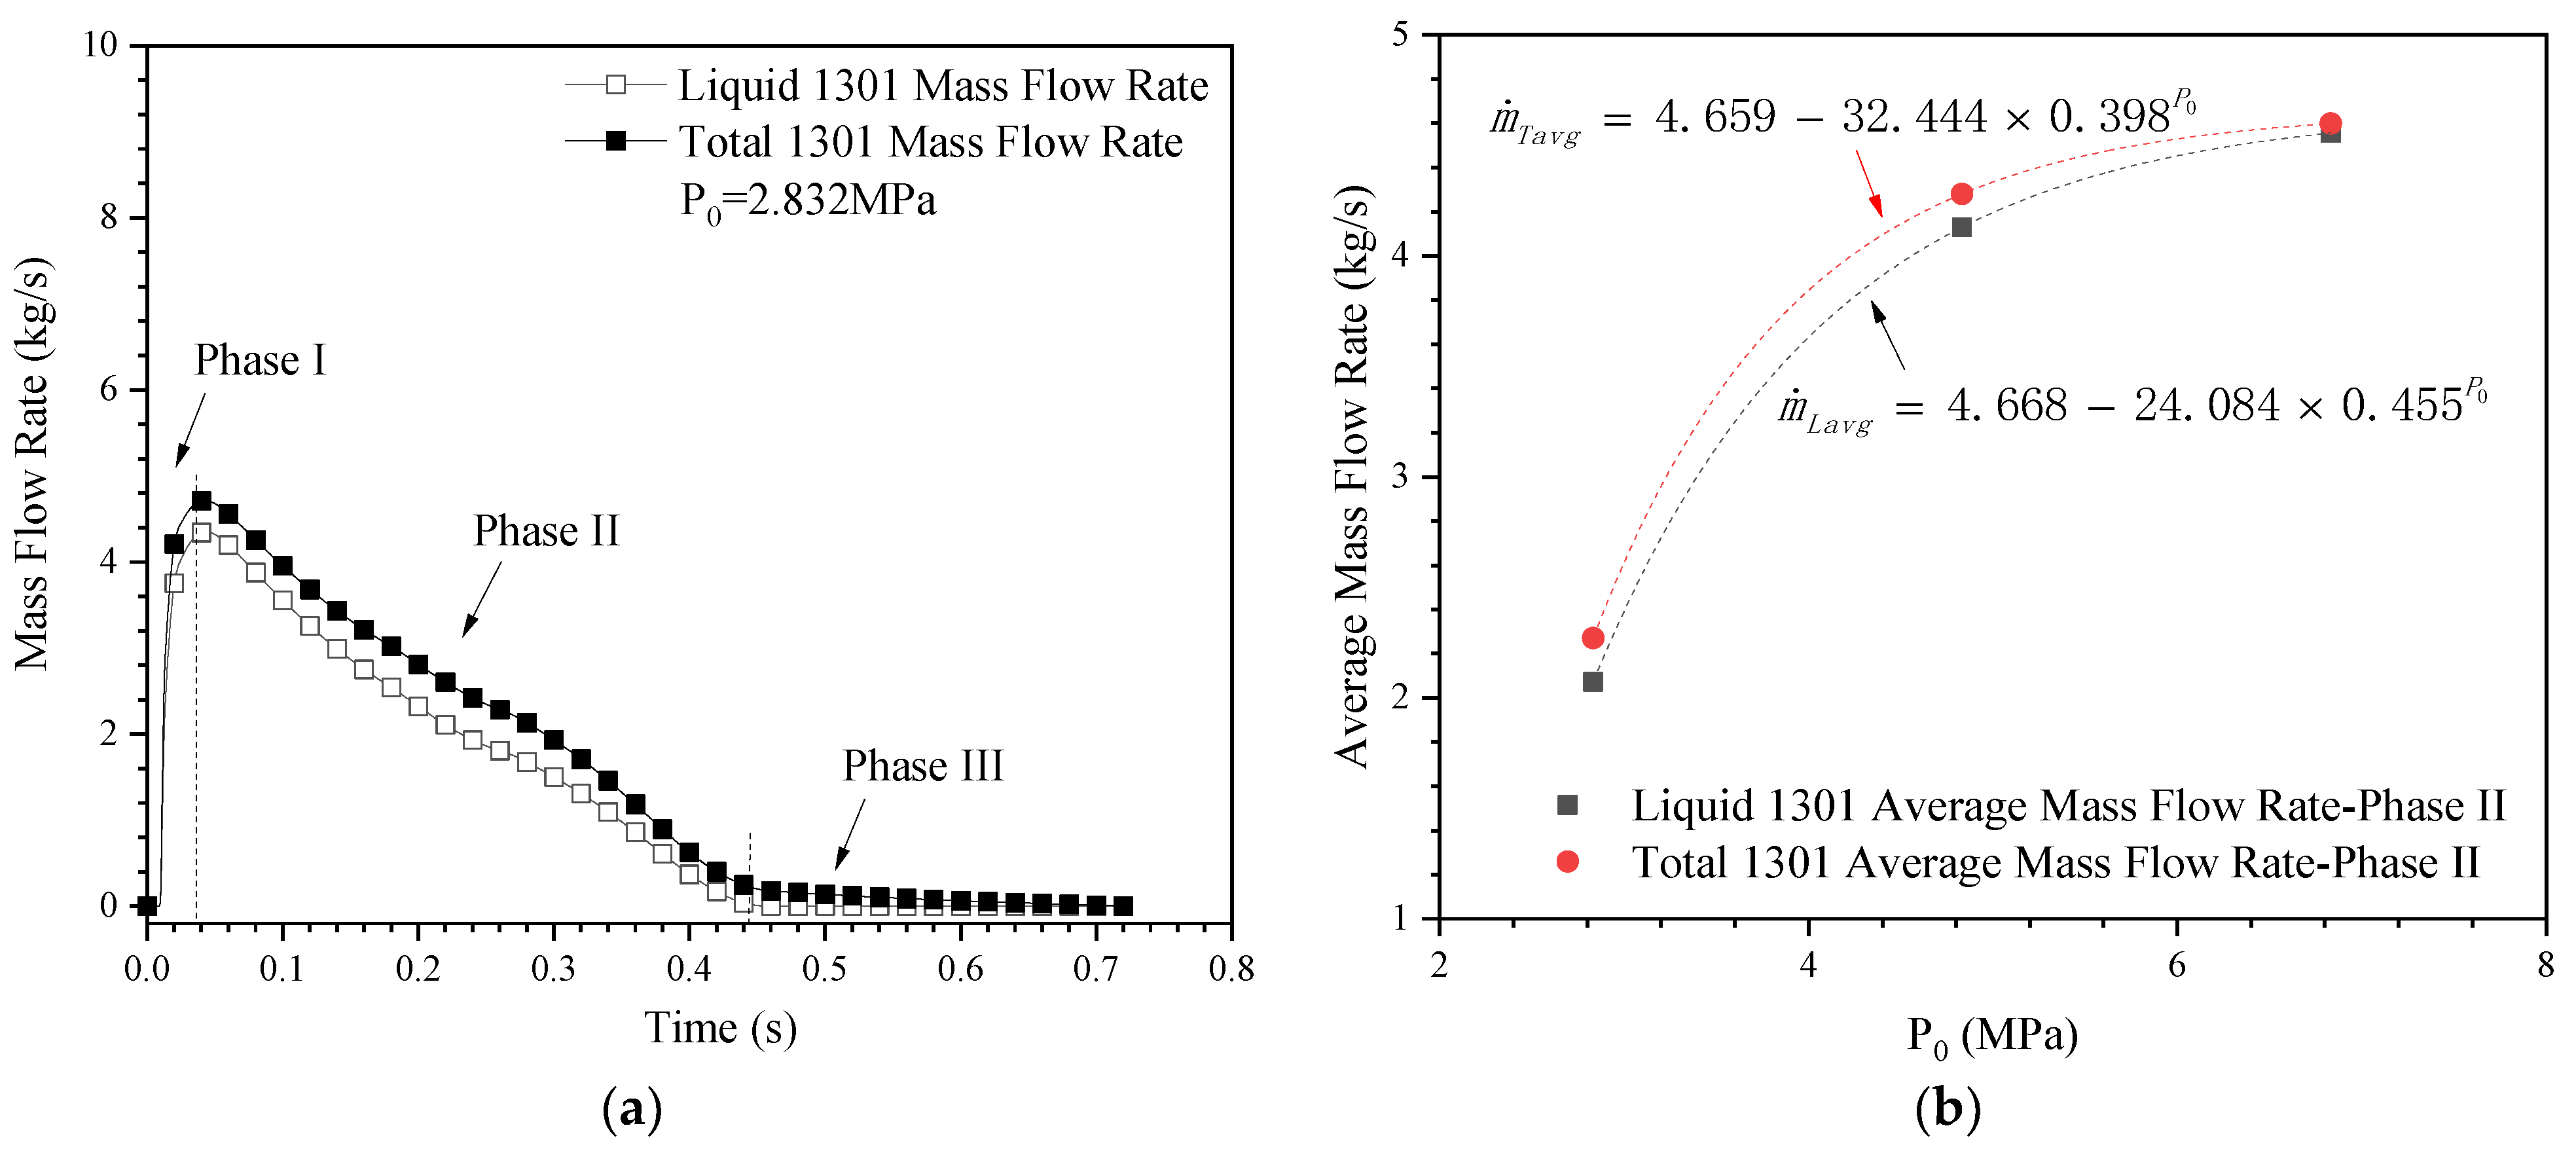
3.2.2. Effects of Filling Pressure on the Mass Flow Rate

Mass flow rate is one of the important parameters to measure the release rate of fire-extinguishing agent, which directly reflects the amount of fire-extinguishing agent released to the protected space per unit time, and has a vital influence on the establishment of fire-extinguishing concentration in the protected space. Since there is a significant phase change in the release process of Halon 1301 agent in the pipeline, the phase change in the flow process not only affects the release rate, but also affects its flow and diffusion characteristics in the protected space. Therefore, it is necessary to study the variations of the liquid and gaseous mass flow rates of the extinguishing agent during the flow.
Figure 9a,b illustrate the mass flow rate curves of the liquid and gaseous extinguishing agents at the outlet of the pipeline under different filling pressures, respectively. It can be seen from these two figures that with the increase of the filling pressure, the peak mass flow rate of the liquid extinguishing agent at the outlet of the pipeline increased significantly, and the release duration of the liquid extinguishing agent decreased obviously; while the peak mass flow rate of the gaseous extinguishing agent and its release duration both decreased significantly. In addition, at the positions shown by arrows in Figure 9b, when the filling pressure was relatively high (4.832 and 6.832 MPa), the mass flow rate of the gaseous extinguishing agent increased gradually near the release end of the liquid extinguishing agent, indicating that the gasification phase transition rate of the extinguishing agent increased at this stage.
In order to further analyze the change of the gasification rate of the extinguishing agent during the release process, the mass flow rate of the liquid extinguishing agent, the mass flow rate of the gaseous extinguishing agent and the pressure drop rate of the extinguishing bottle were compared when the filling pressure was 6.832 and 2.832 MPa, as shown in Figure 9c,d. From these two figures, it can be seen that the release process of the extinguishing agent also presents three obvious phases: the liquid extinguishing agent quickly filled the pipeline first, followed by the rapid release of the extinguishing agent dominated by the liquid agents and accompanied by the gasification phase transition; and, finally, the remaining extinguishing agent vapor and the nitrogen released along the pipeline, as is consistent with the stage division shown in Figure 5 in Section 3.1. Moreover, the mass flow rate of the gaseous extinguishing agent was far less than that of the liquid extinguishing agent throughout the release process.
In Phase I, an obvious peak of the mass flow rate of the gaseous extinguishing agent occurred. It was mainly due to the rapid release of the liquid extinguishing agent into the pipeline, and the rapid pressure drop at the front of the liquid stream, which caused the liquid extinguishing agent to boil and vaporize rapidly.
In Phase II, the released extinguishing agent was mainly liquid. It can be seen from Figure 9c,d that the variations of the mass flow rate of the extinguishing agent under different filling pressures were considerably different. When the filling pressure was 2.832 MPa, the mass flow rate of the liquid extinguishing agent decreased approximately linearly with time, and there was only one peak appearing in the mass flow rate curve of the gaseous extinguishing agent at this stage, and the pressure drop rate of the extinguishing bottle changed slightly during the whole stage. However, when the filling pressure was 6.832 MPa, the mass flow rate of the liquid extinguishing agent decreased approximately linearly with two different slopes, and there were two peaks appearing in the mass flow rate curve of the gaseous extinguishing agent at this stage. In the first half stage, the mass flow rate of the liquid extinguishing agent decreased at a relatively small rate. At this stage, the mass flow rate of the gaseous extinguishing agent increased approximately linearly. In the remained half stage, the mass flow rate of the liquid extinguishing agent decreased rapidly to zero, and at this stage, the mass flow rate of the gaseous extinguishing agent decreased first and then increased slightly, and the pressure drop rate of the extinguishing bottle also decreased first and then increased. It can be speculated that the first half stage was mainly the process of nitrogen expansion promoting the stable release of the liquid extinguishing agent from the extinguishing bottle. Due to the continuous decrease of the pressure of the extinguishing bottle, the gasification rate of the extinguishing agent increased during the flow process, and the mass flow rate of the gaseous extinguishing agent at the outlet increased gradually. The remained half stage mainly corresponded to the process of nitrogen promoting the release of the residual extinguishing agent in the pipe when the liquid extinguishing agent in the extinguishing bottle was depleted. During this process, the pressure drop rate of the extinguishing bottle increased significantly, which led to the increase of the gasification rate of the extinguishing agent, and thus the mass flow rate of the gaseous extinguishing agent at the pipe outlet increased slightly (as shown by the red arrow in Figure 9c). In addition, it can be seen from the pressure curves of the extinguishing bottle shown in Figure 8a that the pressure of the extinguishing bottle increased with the increase of the filling pressure throughout Phase II, which led to the increase of the boiling point of the extinguishing agent and the decrease of its superheat degree. Therefore, the gasification rate of the extinguishing agent in the flow process also decreased, which may be the main reason for the large differences in the mass flow rate of the gaseous extinguishing agent at the pipe outlet under different filling pressures.
In Phase III, as the liquid extinguishing agents had been released, only nitrogen and the extinguishing agent vapor were released through the pipeline. At this stage, the flow in the pipeline was a single-phase gas flow, and the mass flow rate of the gaseous extinguishing agent and the pressure drop rate of the extinguishing bottle decreased monotonously.
In order to compare the differences between the liquid mass flow rate and the total mass flow rate of the extinguishing agent, the case with the maximum gaseous mass flow rate in this section was taken as an example, and the variation curves of the mass flow rates with time were shown in Figure 10a. It can be seen from the diagram that the liquid mass flow rate of the extinguishing agent was close to the total mass flow rate throughout the release process, and the variation trend of the two parameters was relatively consistent, which also showed that the release of the extinguishing agent was still dominated by the liquid agent under this unfavorable filling pressure. Considering that the fire-extinguishing agent was mainly released in Phase II, in order to compare the release rate of the extinguishing agent under different filling pressures, a comparison between the average liquid mass flow rate ( m ˙ L a v g ) at this stage and that of the total mass flow rate ( m ˙ T a v g ) were plotted, as shown in Figure 10b. It can be seen from the figure that m ˙ L a v g and m ˙ T a v g increased with the increase of the filling pressure, which can be fitted by the exponential function. The fitting results are shown as Equations (12) and (13), respectively. In addition, the difference between m ˙ L a v g and m ˙ T a v g decreased with the increase of the filling pressure. In summary, the increase of the filling pressure can effectively increase the release rate of the extinguishing agent and reduce its vaporization rate in Phase II, which is not only conducive to the rapid release of the extinguishing agent, but also conducive to its heat absorption through the gasification in the protected space.
m ˙ L avg = 4.668 24.084 × 0.455 P 0
m ˙ T avg = 4.659 32.444 × 0.398 P 0
where m ˙ L a v g represents the average mass flow rate of the liquid extinguishing agent in Phase II (kg/s), m ˙ T a v g denotes the total mass flow rate of the extinguishing agent in Phase II (kg/s), and P 0 represents the filling pressure of the extinguishing bottle (MPs).

3.2.3. Effects of Filling Pressure on the Gasification Percentage

Gasification phase transition from liquid to gas occurs in the flow of the extinguishing agent in the pipe, which not only affects the transport efficiency along the pipeline and then affects its mass flow rate and release time, but also affects its heat absorption performance based on the gasification phase transition in the protected space. Therefore, it is necessary to study the gasification characteristics of the extinguishing agent under different filling pressures.
Figure 11a shows the comparison curves between the flow velocity at the end of the pipe and the total mass flow rate of the extinguishing agent under the same filling pressure. It can be seen from the figure that in Phase II, with the release of the extinguishing agents, the total mass flow rate decreased gradually, while the flow velocity at the outlet of the pipeline increased slowly first and then increased rapidly. This indicates that the average nominal density of the extinguishing agent in the pipe decreased continuously. Combined with the volume fraction of each substance presented in Figure 5a, it can be seen that this stage was a complex mixed flow of liquid extinguishing agent, gaseous extinguishing agent and driving nitrogen. In the first half stage of Phase II, the volume proportion of the liquid extinguishing agent decreased, while the volume proportion of the gaseous extinguishing agent increased. This indicates that the gasification rate of the extinguishing agent in the pipe increased. In addition, since the volume proportion of the liquid extinguishing agent in the pipe was still high, the flow velocity at the end of the pipe increased slowly at this stage. In the remained half stage of Phase II, the volume fractions of the liquid and gaseous extinguishing agent decreased significantly, while the volume fraction of the driving nitrogen increased rapidly. This indicates that this stage was the mixed release process of the nitrogen and the gas–liquid mixed extinguishing agents. At this stage, due to the rapid decrease of the volume fraction of the liquid extinguishing agent, the flow velocity at the end of the pipe increased rapidly.
Figure 11b shows the curves of the gasification rate of the extinguishing agent at the central position (P3) of the pipeline under different filling pressures. It can be seen from the figure that the gasification rate of the extinguishing agent in the pipe decreased significantly with the increase of the filling pressure. Combined with Figure 8a, it can be seen that the pressure of the extinguishing bottle during Phase II increased with the increase of the initial filling pressure. It can be inferred that the high pressure in Phase II can effectively reduce the superheat degree of the extinguishing agent, thus greatly reducing the gasification rate of the liquid extinguishing agent in the flow process. In addition, it can be seen from Figure 11b that, especially when the filling pressure was relatively low (2.832 MPa), the gasification rate of the extinguishing agent in the pipe decreased significantly with the increase of the filling pressure, but when the filling pressure was relatively high (4.832 MPa), the gasification rate did not change significantly with the further increase of the filling pressure. This shows that the phase-change characteristics of the extinguishing agent in the flow process should be considered when designing the fire-extinguishing system, and a reasonable filling pressure can effectively improve the flow efficiency of the extinguishing agent in the pipe.
Figure 12 shows the variation of the percentage of the gaseous mass in the total mass of the extinguishing agent discharged from the pipeline with filling pressures. It can be seen from the figure that the mass percentage of the extinguishing agent vaporized in the pipe decreased with the increase of the filling pressure. It can be fitted by the exponential function as shown in Equation (14). It shows that under the condition of the same filling temperature and filling amount, increasing the filling pressure to increase the pressure during the release process can effectively reduce the gasification amount of the extinguishing agent in the flow process, which is beneficial to its rapid transportation in the pipeline and to its heat absorption through the gasification in the protected space.
P e r g a s = 7.933 + 80.494 × 0.541 P 0
where P e r g a s represents the mass percentage of the vaporized extinguishing agent during the pipe flow (%), and P 0 denotes the filling pressure of the extinguishing bottle (MPa).

3.3. Effects of Filling Amount on the Flow Characteristics

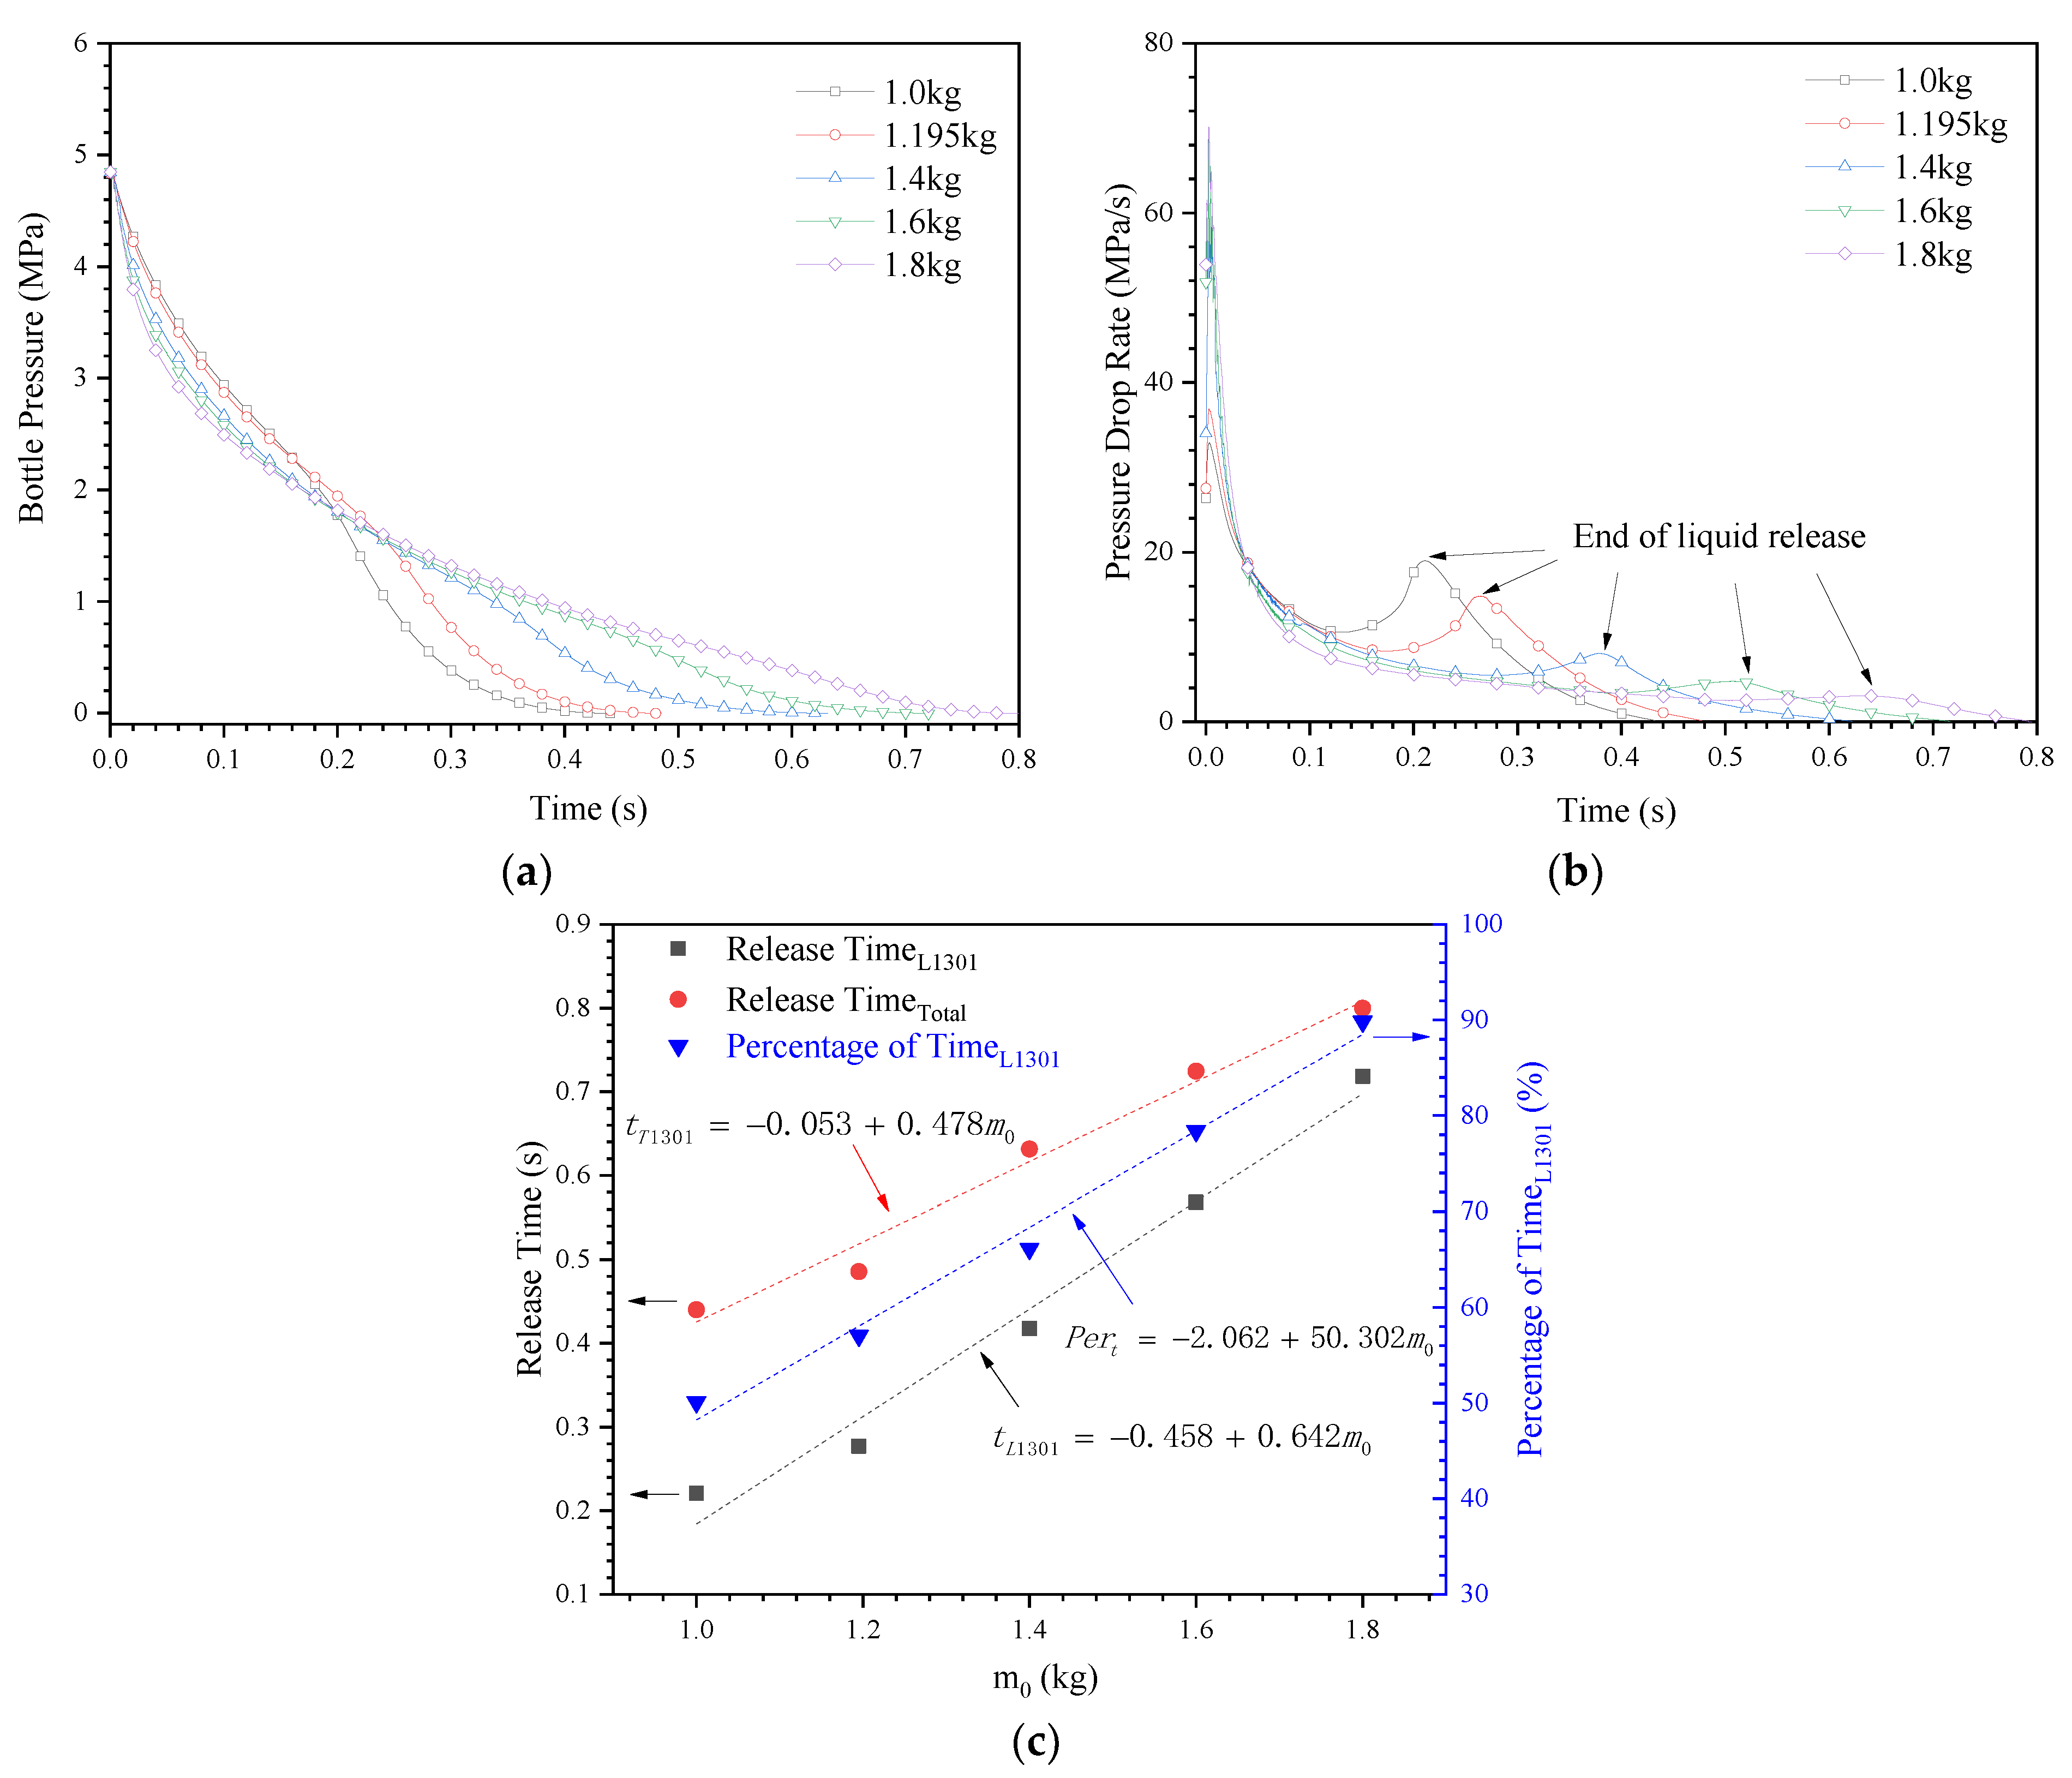
3.3.1. Effects of Filling Amount on the Release Time

Figure 13a,b shows the curves of pressure and pressure drop rate of the extinguishing bottle with time under different filling amounts of the extinguishing agent. It can be seen from Figure 13a that the release duration of the extinguishing bottle increased with the increase of the filling amount. As shown by the arrows in Figure 13b, the second peak of the pressure drop rate (based on the analysis in Section 3.2.1, it corresponds to the end of the liquid extinguishing agent release) was delayed and decreased with the increase of the filling amount. This shows that the duration of Phase II increased with the increase of the filling amount, and the conversion process between Phase II and Phase III tended to be smooth. In addition, it can be seen from Figure 13b that the pressure drop rate of the extinguishing bottle at the beginning of the release increased significantly with the increase of the filling amount. This is mainly due to the fact that when the volume of the extinguishing bottle was constant, the space occupied by the driving gas decreased with the increase of the filling amount. This made the driving ability reduced significantly, resulting in a sharp decline in the pressure of the extinguishing bottle at the beginning of the release. As shown in Figure 13b, the peak pressure drop rate in the case of 1.8 kg extinguishing agent was about twice than that of 1.0 kg. It can be expected that the increase of the pressure drop rate will inevitably have a great impact on the gasification rate of the extinguishing agent.
Figure 13c shows the liquid release time of the extinguishing agent ( t L 1301 ) , the total release time of the extinguishing agent ( t T 1301 ) , and the percentage of the liquid release time to the total release time ( P e r t ) under different filling amounts. It can be seen from the figure that these three parameters all increased with the increase of the filling amount. They can be fitted with linear functions, and the fitting results are shown in Equations (15)–(17), respectively. It can be predicted that this was not only related to the increase in the amount of the extinguishing agent to be released, but also to the decrease in the amount of nitrogen in the extinguishing bottle, which will reduce the release rate of the extinguishing agent.
t L 1301 = 0.458 + 0.642 m 0
t T 1301 = 0.053 + 0.478 m 0
P e r t = 2.062 + 50.302 m 0
where t L 1301 and t T 1301 denote the release time of liquid extinguishing agent (s) and the total release time of extinguishing agent (s), respectively; P e r t represents the percentage of the release duration of the liquid extinguishing agent to the total release time ( % ) ; and   m 0 represents the initial filling amount of the extinguishing agent (kg).

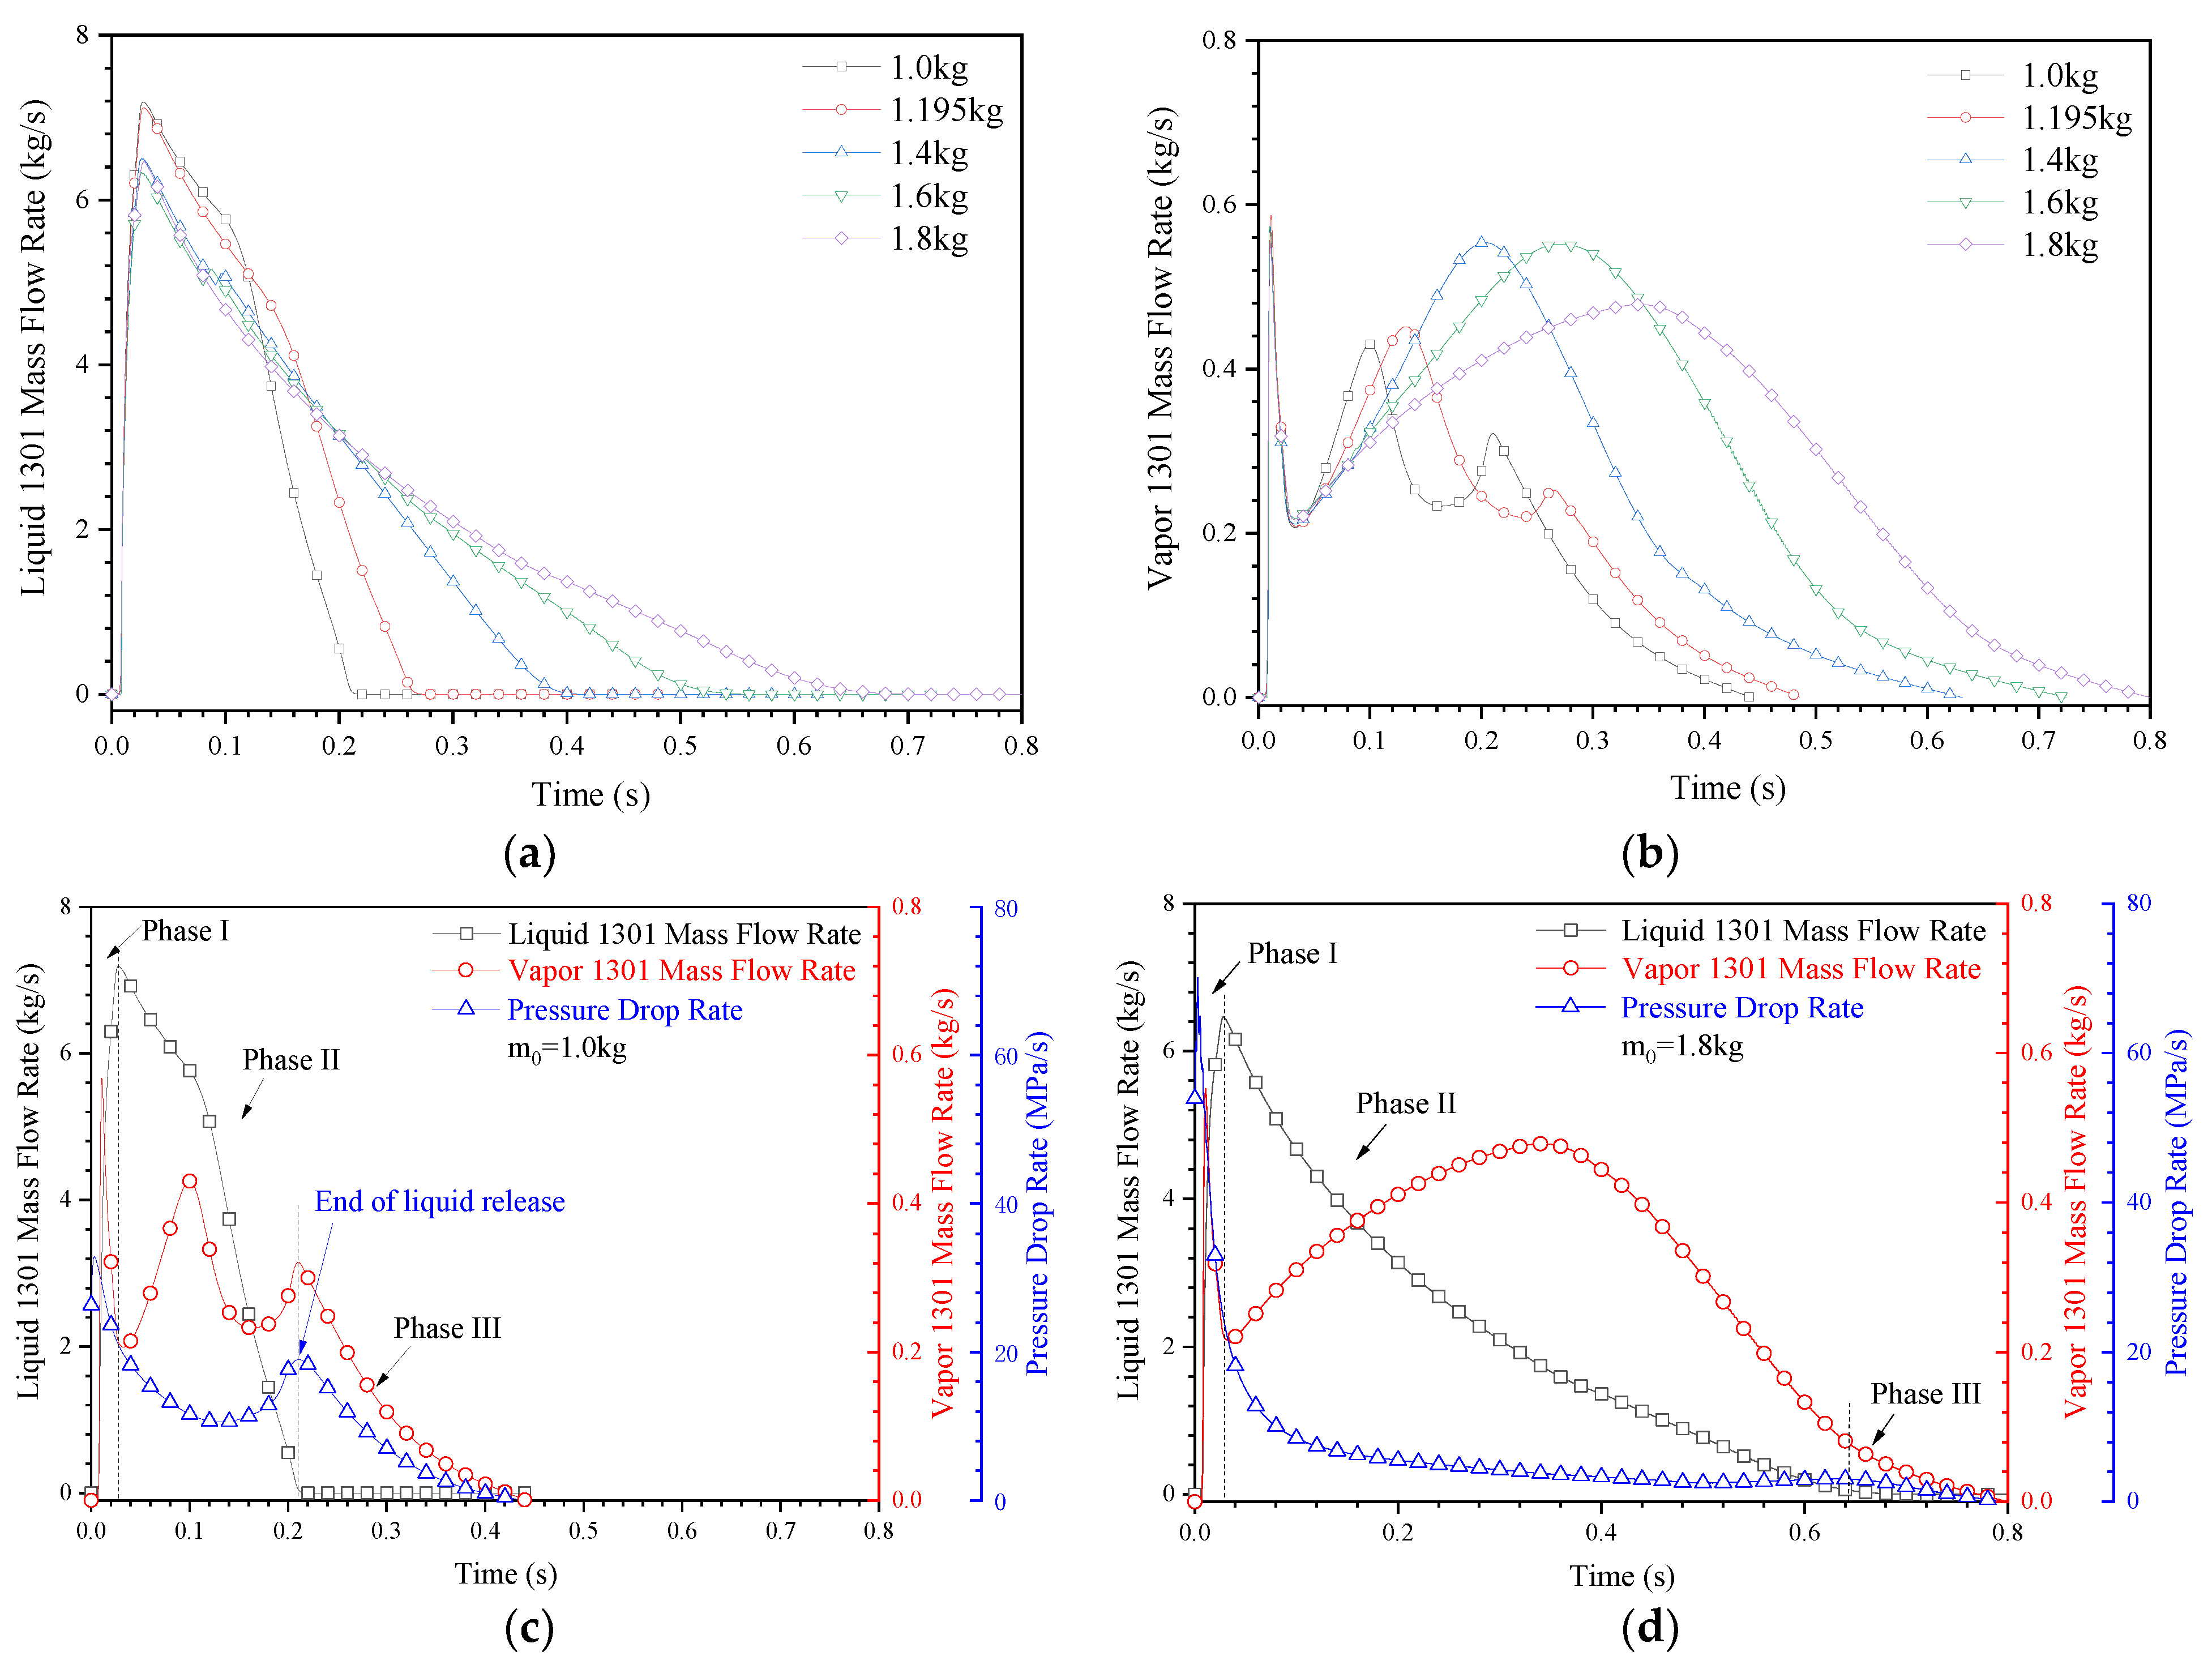
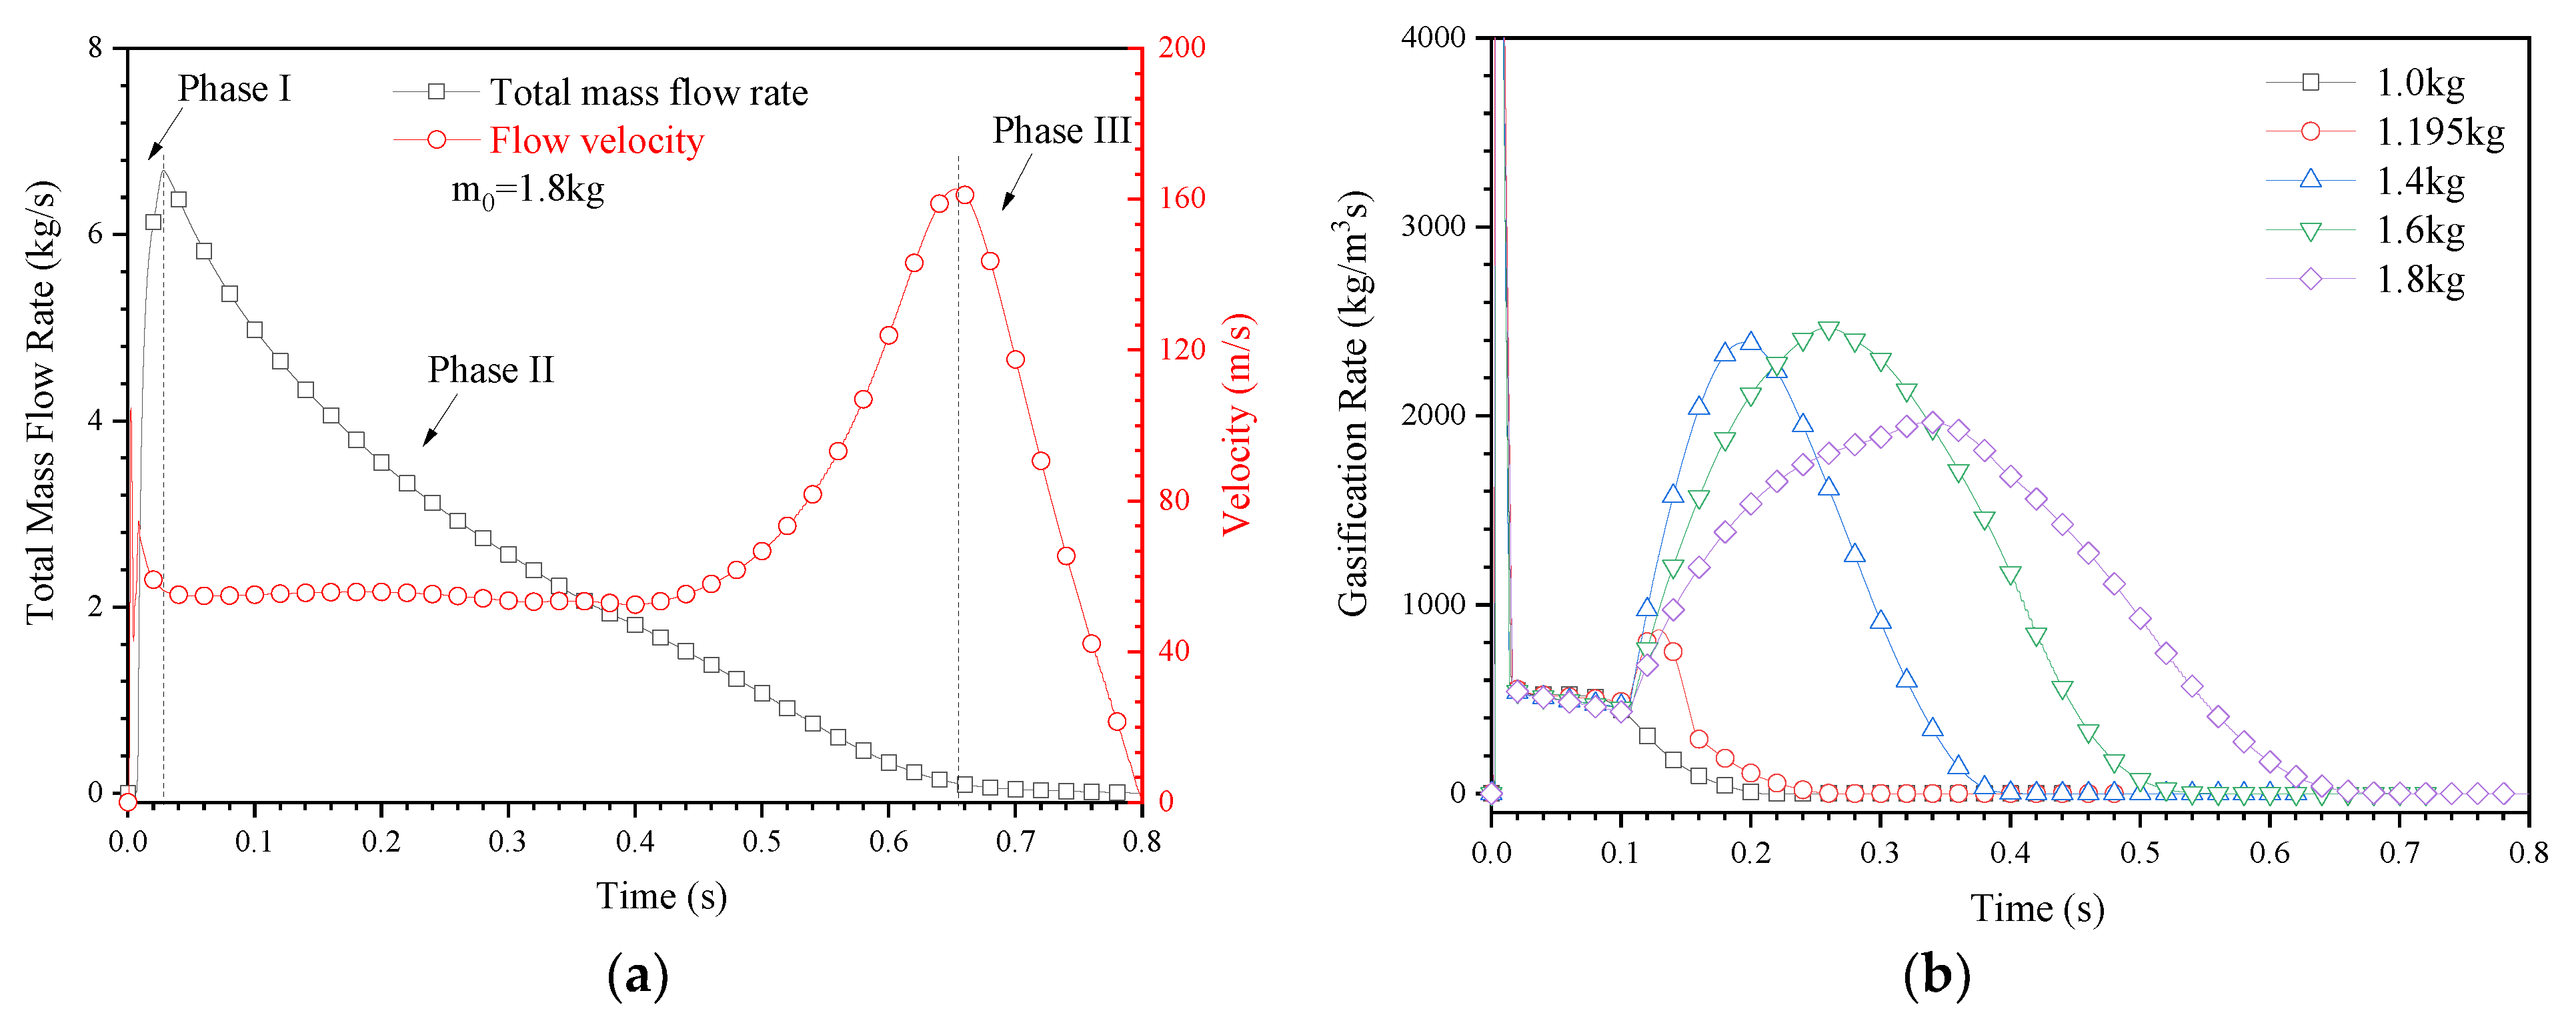
3.3.2. Effects of Filling Amount on the Mass Flow Rate

Figure 14a,b shows the mass flow curves of the liquid and gaseous extinguishing agent at the pipe outlet under different filling amounts of the extinguishing agent. It can be seen from the two figures that the release duration of the liquid and gaseous extinguishing agents increased significantly with the increase of the filling amount. Moreover, when the filling amount of the extinguishing agent was relatively small (e.g., 1.0 and 1.195 kg), the peak value of the mass flow rate of the liquid extinguishing agent was significantly larger than that of other larger filling amounts in this section, and the Phase II can be clearly divided into two stages according to the mass flow rate of the liquid extinguishing agent, and there were two peaks occurring in the mass flow rate curve of the gaseous extinguishing agent in Phase II, which is similar to the phenomenon observed in Section 3.2.2. However, when the filling amount of the extinguishing agent was relatively large (e.g., 1.4, 1.6, and 1.8 kg), the mass flow rate of the liquid extinguishing agent tended to be flat in Phase II, and there was only one peak occurring in the mass flow rate curve of the gaseous extinguishing agent, and the width of the peak increased with the increase of the filling amount.
In order to further reveal the reasons for the aforementioned differences about the liquid and gaseous mass flow rates under different filling amounts, the liquid and gaseous mass flow rates and the pressure drop rate in the cases of 1.0 and 1.8 kg filling amounts were compared. The results are presented in Figure 14c,d, respectively. It can be seen from Figure 14c that in Phase II, the pressure drop rate of the extinguishing bottle decreased first and then increased obviously when the filling amount was 1.0 kg, and the inflection point of the pressure drop rate (as shown by the blue arrow) was consistent with that of the gaseous and liquid mass flow rate, indicating that the conversion from the gas–liquid two-phase flow to the gas-phase single-phase flow was very fast. However, when the filling amount was 1.8 kg, as shown in Figure 14d, the pressure drop rate of the extinguishing bottle decreased monotonously, and there was no obvious aforementioned inflection point of the pressure drop rate, which should be due to the smooth transition of the gas–liquid two-phase flow to the gas-phase single-phase flow. In addition, it can be found from the comparison between Figure 14c,d that there are significant differences in the average values of the pressure drop rate under diffident filling amounts. The average pressure drop rate in the cases of 1.0 and 1.8 kg filling amounts were 13.62 MPa/s2 and 5.14 MPa/s2 respectively; that is, the average pressure drop rate of the former case was about 2.6 times than that of the latter case. Moreover, it can be seen from Table 2 that, under the conditions of 1.0 and 1.8 kg filling amount, the percentage of gas volume to the volume of the extinguishing bottle was 54.93% and 18.88%, respectively; that is, the amount of driving gas for the former condition was about three times than that of the latter condition. However, it can be seen from the pressure curves shown in Figure 13a that the difference between the pressures of the extinguishing bottle under different filling amounts in Phase II was small, and the maximum difference was only about 0.5 MPa. It can be speculated that when the filling amount was large, the extinguishing agent undergone continuous and intense gasification during Phase II, which to some extent compensated for the deficiency of the nitrogen driving capability.
Figure 15a shows the curves of the liquid and total mass flow rate of the extinguishing agent under the maximum filling amount of the extinguishing agent in this paper. It can be seen from the figure that these two curves were close throughout the release process, and the maximum difference between them was about 0.48 kg/s. It shows that, even under the condition of the maximum filling amount in this study, the release of the extinguishing agent was still dominated by the liquid extinguishing agent. Figure 15b shows the comparison of the liquid and total average mass flow rate of the extinguishing agent in Phase II under different filling amounts. It can be seen from the figure that the two parameters decreased with the increase of the filling amount. They can be fitted by the linear functions, and the fitting results are shown in Equations (18) and (19), respectively.
m ˙ L a v g = 7.186 2.884 m 0
m ˙ T a v g = 7.675 3.044 m 0
where represents the average mass flow rate of the liquid extinguishing agent in Phase II (kg/s), m ˙ T a v g denotes the total mass flow rate of the extinguishing agent in Phase II (kg/s), and m 0 represents the initial filling amount of the extinguishing agent (kg).

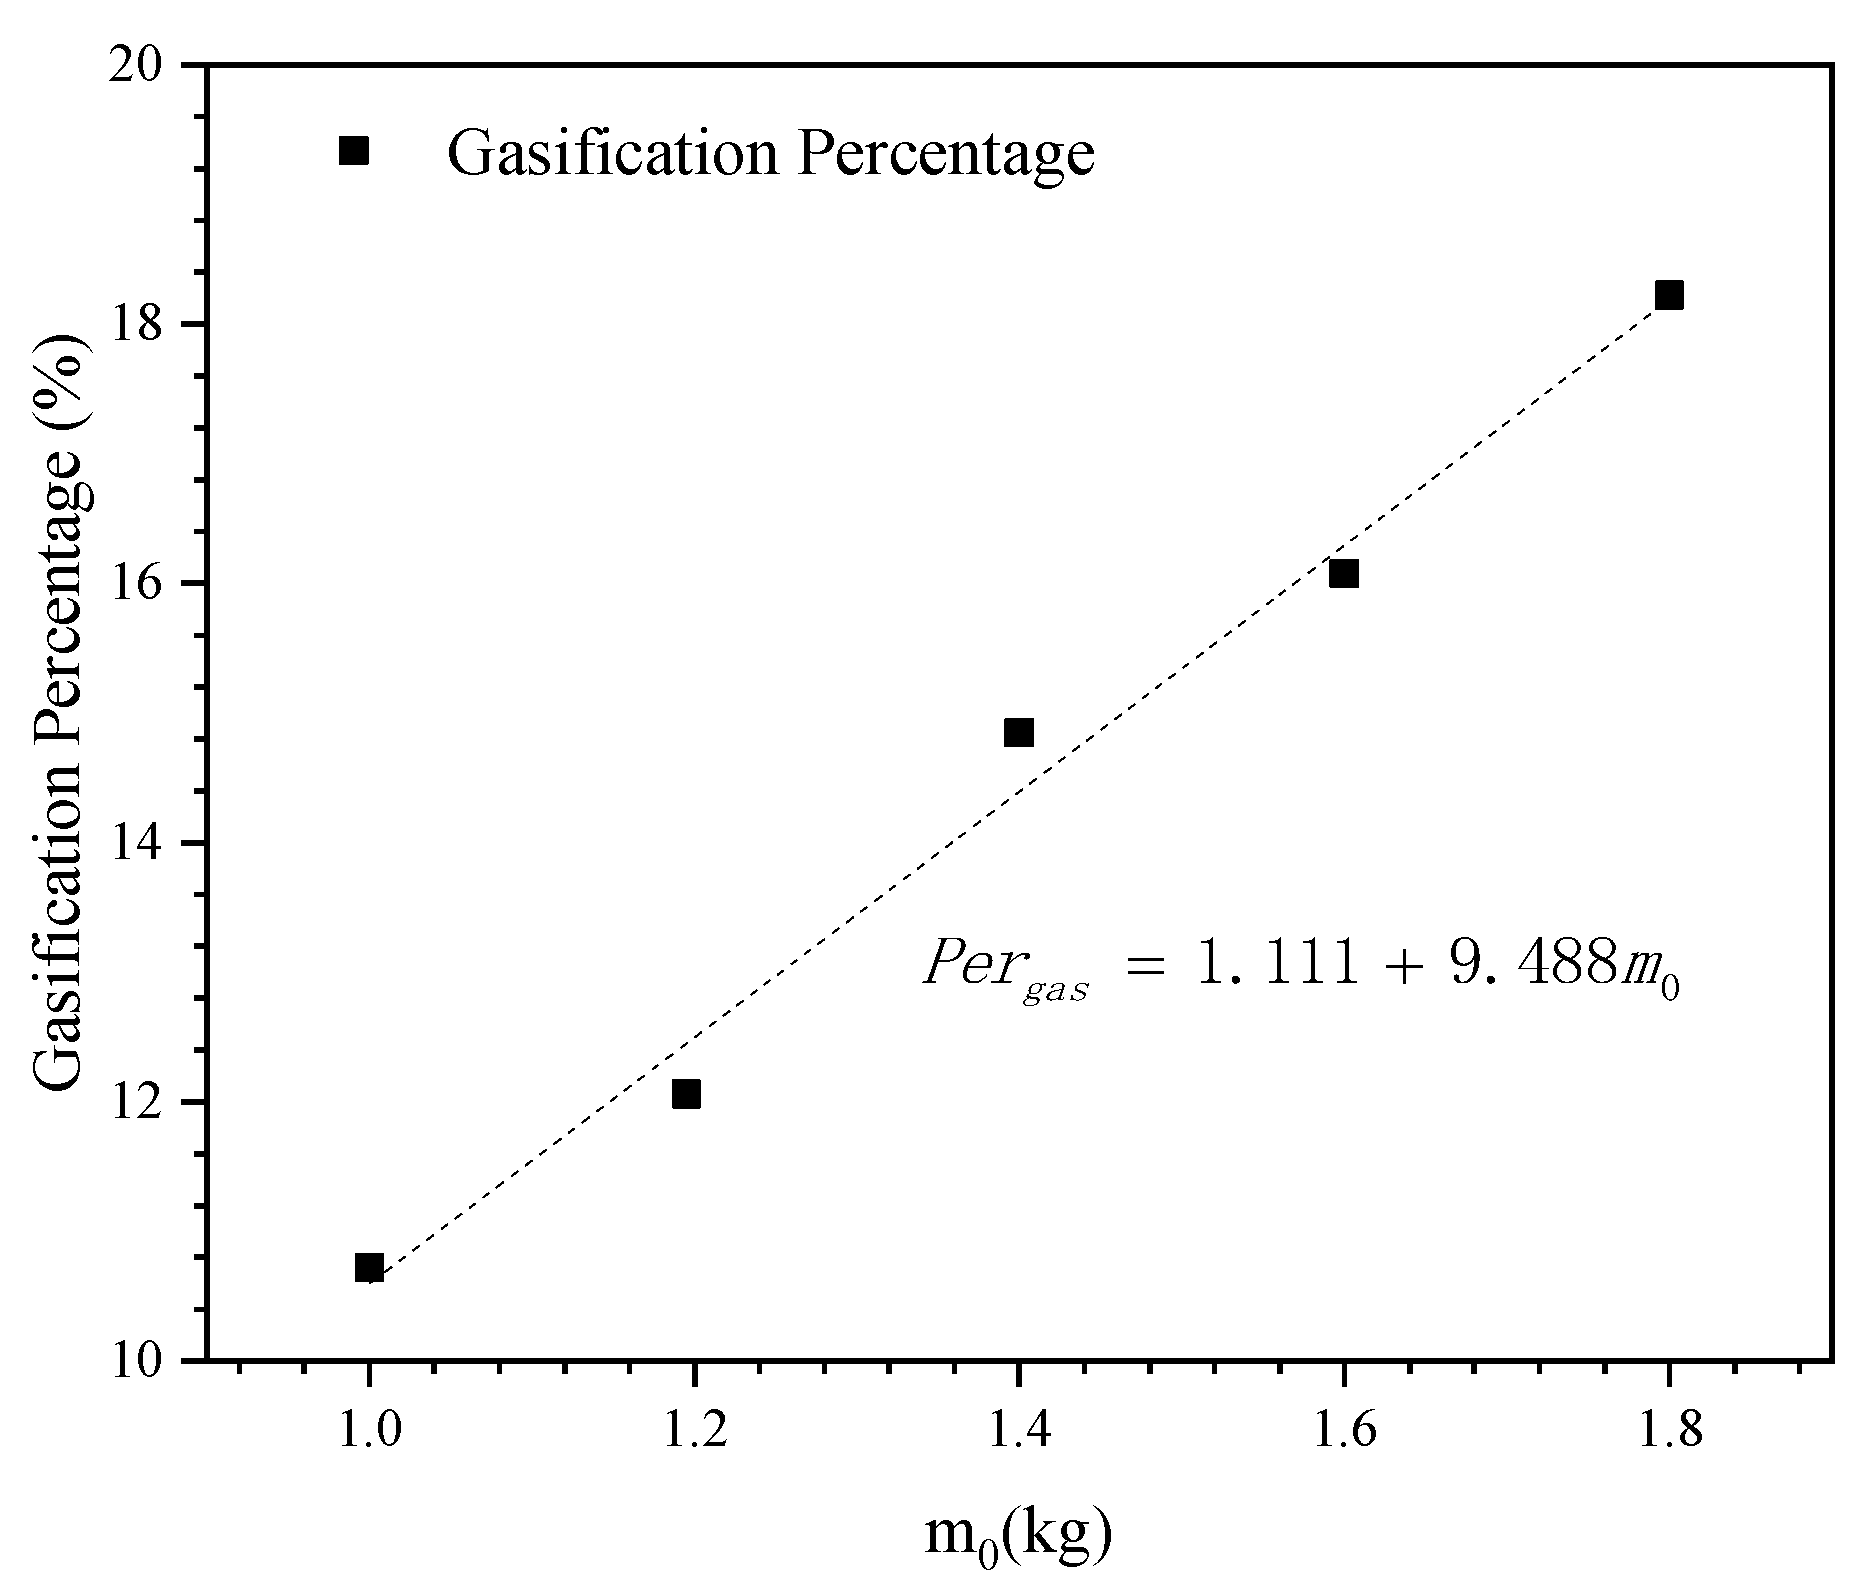
3.3.3. Effects of Filling Amount on the Gasification Percentage

Figure 16a shows the curves of the flow velocity and the total mass flow rate of the extinguishing agent at the outlet of the pipe under the condition of 1.8 kg filling amount. It can be seen from the figure that in Phase II, the total mass flow rate decreased with the release of the extinguishing agents, and the flow velocity at the pipe outlet remained stable for a long period in the early stage of this phase, and then the flow velocity rapidly increased to the peak and then rapidly decreased. According to the analysis in Section 3.2.3, the aforementioned stable flow process was mainly due to the expansion of nitrogen to promote the flow of the extinguishing agent, and the subsequent rapid increase mainly corresponded to the release of the extinguishing agent carried by the nitrogen. It can also be seen from the comparison between the total mass flow rate and the flow velocity that average nominal density of the extinguishing agent in the pipe decreased monotonously with time in Phase II, indicating that even in the previous stable flow process, the extinguishing agent was still undergoing the significant gasification phase transition.
Figure 16b shows the curves of the gasification rate of the extinguishing agent in the middle of the pipeline (P3) under different filling amounts. It can be seen from the figure that with the increase of the filling amount, the peak value of the gasification rate in the pipeline first increased significantly and then decreased slightly, while the gasification duration was significantly prolonged, indicating that the gasification amount of the extinguishing agent increased with the increase of the filling amount.
Figure 17 shows the variation of the percentage of the gaseous mass to the total mass of the extinguishing agent discharged from the pipeline with the filling amount. It can be seen from the figure that the percentage increased with the increase of the filling amount. It can be fitted by the linear function, and the fitting result is shown in Equation (20). In summary, under the same filling temperature and pressure conditions, increasing the filling amount of the extinguishing agent will significantly increase its gasification ratio during the flow process, which will significantly reduce its release rate.
P e r g a s = 1.111 + 9.488 m 0
where P e r g a s represents the mass percentage of vaporized extinguishing agent during the pipe flow (%), and m 0 represents the initial filling amount of the extinguishing agent (kg).

4. Conclusions

In order to provide guidance to the weight reduction of the aircraft-fixed gas fire-extinguishing system by improving its release efficiency, the flow characteristics of the extinguishing agent were studied. The major results and conclusions are summarized as follows.
  • The release process of Halon 1301 along the pipeline can be divided into three phases: rapid filling of the pipeline, concentrated release of liquid-based extinguishing agent, and gas release along the pipeline, and there is obvious gasification phase transition in the first two phases.
  • With the increase of the filling pressure, the gasification ratio of the extinguishing agent decreases, and the release duration of the liquid extinguishing agent and the total release time of the extinguishing agent are shortened. On the contrary, the average mass flow rate of the extinguishing agent increases monotonously.
  • Under the same filling pressure, the gasification ratio of the extinguishing agent, the release duration of the liquid extinguishing agent and the total release time of the extinguishing agent increase with the increase of the filling amount of the extinguishing agent, while the average mass flow rate of the extinguishing agent decreases with the increase of the filling amount of the extinguishing agent.

Author Contributions

Conceptualization, Q.L.; methodology, Z.Z. and Q.L.; validation, Q.L., H.G. and R.C.; resources, R.P. and Q.L.; data curation, Z.Z. and Q.L.; writing—original draft preparation, Q.L.; writing—review and editing, H.G., Q.L. and R.C.; visualization, Q.L.; supervision, R.C. and R.P.; project administration, Q.L.; funding acquisition, R.C. and R.P. All authors have read and agreed to the published version of the manuscript.

Funding

This research was funded by National Natural Science Foundation of China (No.51806106) and Natural Science Foundation of Jiangsu Province, China (No. BK20170838).

Institutional Review Board Statement

Not applicable.

Informed Consent Statement

Not applicable.

Data Availability Statement

The data will be made available on request from the corresponding author.

Conflicts of Interest

The authors declare no conflict of interest. The funders had no role in the design of the study; in the collection, analyses, or interpretation of data; in the writing of the manuscript; or in the decision to publish the results.

Nomenclature

P pressure, MPa
P 0 filling pressure of the extinguishing bottle (MPa)
P e r t percentage of the release time of the liquid extinguishing agent to the total release time of the extinguishing agent (%)
P e r g a s mass percentage of vaporized extinguishing agent during the pipe flow (%)
T temperature (K)
T s a t saturation temperature (K)
v m average mass velocity (m/s)
v d r , k drift velocity for secondary phase k (m/s)
F force vector (N)
g gravitational acceleration (m/s2)
E k internal energy (J)
k e f f effective thermal conductivity (W/(m∙K))
r e , r c time relaxation factors to adjust the rate of phase transition (dimensionless)
t L 1301 release time of the liquid extinguishing agent (s)
t T 1301 total release time of the extinguishing agent (s)
m ˙ L a v g average mass flow rate of the liquid extinguishing agent in Phase II (kg/s)
m ˙ T a v g total mass flow rate of the extinguishing agent in Phase II (kg/s)
m 0 initial filling amount of the extinguishing agent (kg/s)
Greek Letters
ρ m mixed density (kg/m3)
ρ k density of k phase (kg/m3)
μ m mixed viscosity (Pa∙s)
μ k viscosity of k phase (Pa∙s)
μ t , m vortex viscosity of mixed turbulence (Pa∙s)
α k volume fraction of k phase (dimensionless)
Subscripts
m Mixture
k phase number
d r Drift
i number of components
l Liquid
v Vapor
s a t Saturation

References

  1. Hariram, S.S. Fire Protection on Airplanes. SAE Int. J. Aerosp. 2005. [Google Scholar] [CrossRef]
  2. Csereklyei, Z.; Stern, D.I. Flying More Efficiently: Joint Impacts of Fuel Prices, Capital Costs and Fleet Size on Airline Fleet Fuel Economy. Ecol. Econ. 2020, 175, 106714. [Google Scholar] [CrossRef]
  3. Lyon, D.; Francis, G. Managing New Zealand’s airports in the face of commercial challenges. J. Air Transp. Manag. 2006, 12, 220–226. [Google Scholar] [CrossRef]
  4. Mayor, K.; Tol, R.S.J. The impact of the EU–US Open Skies agreement on international travel and carbon dioxide emissions. J. Air Transp. Manag. 2008, 14, 1–7. [Google Scholar] [CrossRef] [Green Version]
  5. Tsai, W.-H.; Chang, Y.-C.; Lin, S.-J.; Chen, H.-C.; Chu, P.-Y. A green approach to the weight reduction of aircraft cabins. J. Air Transp. Manag. 2014, 40, 65–77. [Google Scholar] [CrossRef]
  6. Lu, W.; Hu, H.; Qi, G. Effect of Pipe Diameter and Inlet Parameters on Liquid CO2 Flow in Transportation by Pipeline with Large Height Difference. Processes 2019, 7, 756. [Google Scholar] [CrossRef] [Green Version]
  7. Payri, R.; Gimeno, J.; Martí-Aldaraví, P.; Carvallo, C. Parametrical study of the dispersion of an alternative fire suppression agent through a real-size extinguisher system nozzle under realistic aircraft cargo cabin conditions. Process Saf. Environ Prot. 2020, 141, 110–122. [Google Scholar] [CrossRef]
  8. Liu, G.; Hao, Z.; Wang, Y.; Ren, W. Research on the Dynamic Responses of Simply Supported Horizontal Pipes Conveying Gas-Liquid Two-Phase Slug Flow. Processes 2021, 9, 83. [Google Scholar] [CrossRef]
  9. Pham, L.H.H.P.; Rusli, R. A review of experimental and modelling methods for accidental release behaviour of high-pressurised CO2 pipelines at atmospheric environment. Process. Saf. Environ. Prot. 2016, 104, 48–84. [Google Scholar] [CrossRef]
  10. Williamson, H.V. Halon 1301 flow in pipelines. Fire Technol. 1976, 12, 18–32. [Google Scholar] [CrossRef]
  11. Tuzla, K.; Palmer, T.; Chen, J.; Sundaram, R.; Yeung, W.-S. Development of Computer Program for Fire Suppressant Fluid Flow; Institute of Thermo-Fluid Engineering & Science, Lehigh University: Bethlehem, PA, USA, 1998; p. 66. [Google Scholar]
  12. Kim, J.; Baek, B.; Lee, J. Numerical analysis of flow characteristics of fire extinguishing agents in aircraft fire extinguishing systems. J. Mech. Sci. Technol. 2009, 23, 1877–1884. [Google Scholar] [CrossRef]
  13. Clegg, S.; Mancarella, P. Integrated Electrical and Gas Network Flexibility Assessment in Low-Carbon Multi-Energy Systems. IEEE Trans. Sustain. Energy 2016, 7, 718–731. [Google Scholar] [CrossRef]
  14. Ekhtiari, A.; Dassios, I.; Liu, M.; Syron, E. A Novel Approach to Model a Gas Network. Appl. Sci. 2019, 9, 1047. [Google Scholar] [CrossRef] [Green Version]
  15. Xiao, C.; Lu, Z.; Yan, L.; Wang, J.; Yao, S. Effects of Flow Velocity on Transient Behaviour of Liquid CO2 Decompression during Pipeline Transportation. Processes 2021, 9, 192. [Google Scholar] [CrossRef]
  16. Niu, X.; Xie, Y.; Hasemi, Y. Analysis of Fire Spread and Fire Extinguishing Agent Distribution in Nacelle of Helicopter under No-ventilation Condition. Procedia Eng. 2013, 62, 1073–1080. [Google Scholar] [CrossRef] [Green Version]
  17. Ma, X.; Zhao, L.; Li, Y.; Li, D.; Fu, J.; Han, Y.; Qin, J. Numerical Simulation of Distribution of Discharged Gas Fire Extinguishing Agent in High Velocity Flow Field. Adv. Mater. Res. 2013, 718–720, 1786–1791. [Google Scholar] [CrossRef]
  18. Kurokawa, F.Y.; de Andrade, C.R.; Zaparoli, E.L. Modeling of aircraft fire suppression system by the lumped parameter approach. Aircr. Eng. Aerosp. Technol. 2016, 88, 535–539. [Google Scholar] [CrossRef]
  19. Kim, G.; Cha, J.-H.; Lee, H.-J. Numerical study on the effect of temperature in the retention time of an inert agent. Fire Saf. J. 2020, 115, 103004. [Google Scholar] [CrossRef]
  20. Fluent Corporation. Fluent Help Documents; Fluent Corporation: Canonsburg, PA, USA, 2015. [Google Scholar]
  21. Kheirkhah Gildeh, H.; Mohammadian, A.; Nistor, I.; Qiblawey, H. Numerical modeling of 30° and 45° inclined dense turbulent jets in stationary ambient. Environ. Fluid Mech. 2014, 15, 537–562. [Google Scholar] [CrossRef]
  22. Moen, A.; Mauri, L.; Narasimhamurthy, V.D. Comparison of k-ε models in gaseous release and dispersion simulations using the CFD code FLACS. Process Saf. Environ. Prot. 2019, 130, 306–316. [Google Scholar] [CrossRef]
  23. Karathanassis, I.K.; Koukouvinis, P.; Gavaises, M. Comparative evaluation of phase-change mechanisms for the prediction of flashing flows. Int. J. Multiph. Flow 2017, 95, 257–270. [Google Scholar] [CrossRef] [Green Version]
  24. De Schepper, S.C.K.; Heynderickx, G.J.; Marin, G.B. Modeling the evaporation of a hydrocarbon feedstock in the convection section of a steam cracker. Comput. Chem. Eng. 2009, 33, 122–132. [Google Scholar] [CrossRef]
  25. Fang, C.; David, M.; Rogacs, A.; Goodson, K. Volume of Fluid Simulation of Boiling Two-Phase Flow in a Vapor-Venting Microchannel. Front. Heat Mass Transf. 2010, 1. [Google Scholar] [CrossRef]
Figure 1. Model of fire-extinguishing system: (a) physical model and (b) diagram of grids.
Processes 09 01683 g001
Figure 2. Comparison of bottle pressure under different cell numbers.
Processes 09 01683 g002
Figure 3. Diagram of the experimental device.
Processes 09 01683 g003
Figure 4. Comparison of numerical and experimental results of vessel pressure during release.
Processes 09 01683 g004
Figure 5. Variation curves of each component at the pipeline outlet: (a) volume fractions and (b) mass flow rates.
Processes 09 01683 g005
Figure 6. Pressure curves at different positions.
Processes 09 01683 g006
Figure 7. Volume fraction distribution of the liquid 1301 agent at different moments.
Processes 09 01683 g007
Figure 8. Bottle pressure and release time under different filling pressures: (a) bottle pressures; (b) bottle pressure-drop rates; (c) release times and percentages of liquid-release duration.
Processes 09 01683 g008aProcesses 09 01683 g008b
Figure 9. Mass flow rates of extinguishing agent under different filling pressures: (a) liquid mass flow rates; (b) vapor mass flow rates; (c) mass flow rate and pressure drop rate under 6.832 MPa; (d) mass flow rate and pressure drop rate under 2.832 MPa.
Processes 09 01683 g009
Figure 10. Comparison of mass flow rate of the extinguishing agent: (a) variation of liquid and total mass flow rates; (b) variation of average mass flow rate with the filling pressure.
Processes 09 01683 g010
Figure 11. Diagram of flow velocity and gasification rate: (a) comparison of flow velocity with total mass flow rate; (b) variations of gasification rate under different filling pressures.
Processes 09 01683 g011
Figure 12. Variation of gasification ratio of extinguishing agent under different filling pressures.
Processes 09 01683 g012
Figure 13. Bottle pressure and release time under different filling amounts: (a) bottle pressures; (b) bottle pressure-drop rate; (c) release time and liquid time percentage.
Processes 09 01683 g013
Figure 14. Mass flow rates of the extinguishing agent under different filling amounts: (a) liquid mass flow rates; (b) vapor mass flow rates; (c) mass flow rate and pressure drop rate under 1.0 kg; (d) mass flow rate and pressure drop rate under 1.8 kg.
Processes 09 01683 g014
Figure 15. Comparison of mass flow rate of extinguishing agent: (a) variation of liquid and total mass flow rates; (b) variation of average mass flow rate with filling pressure.
Processes 09 01683 g015
Figure 16. Diagram of flow velocity and gasification rate: (a) comparison of flow velocity and total mass flow rate; (b) variation of gasification rate under different filling amounts.
Processes 09 01683 g016
Figure 17. Variation of gasification ratio of extinguishing agent under different filling amounts.
Processes 09 01683 g017
Table 1. Initial state of the extinguishing bottle under different filling pressures.
Filling Pressure
/MPa
Filling Temperature
/K
Filling Amount
/kg
Gas Volume Fraction/%volLiquid Volume Fraction/%vol
1301N21301N2
2.832294.251.19562.5237.4897.922.08
4.832294.251.19547.2152.7994.905.10
6.832294.251.19540.6659.3491.668.34
Table 2. Initial state of the extinguishing bottle under different filling amounts.
Filling Pressure
/MPa
Filling Temperature
/K
Filling Amount
/kg
Volume Ratio of Gas/%volGas Volume Fraction/%volLiquid Volume Fraction/%vol
1301N21301N2
4.832294.251.054.9347.2152.7994.95.1
4.832294.251.19546.1547.2152.7994.95.1
4.832294.251.436.9147.2152.7994.95.1
4.832294.251.627.9047.2152.7994.95.1
4.832294.251.818.8847.2152.7994.95.1
Publisher’s Note: MDPI stays neutral with regard to jurisdictional claims in published maps and institutional affiliations.

