Analysis of Monoclonal Antibodies by Capillary Electrophoresis: Sample Preparation, Separation, and Detection


Institut des Biomolécules Max Mousseron (IBMM), UMR 5247-CNRS-UM-ENSCM, Université de Montpellier, 34093 Montpellier, France
*
Author to whom correspondence should be addressed.
Separations 2021, 8(1), 4; https://0-doi-org.brum.beds.ac.uk/10.3390/separations8010004
Submission received: 23 October 2020
/
Revised: 10 December 2020
/
Accepted: 23 December 2020
/
Published: 4 January 2021
(This article belongs to the Special Issue Electrophoretic Methodologies for Protein Analysis)
Abstract
:Therapeutic monoclonal antibodies (mAbs) are dominating the biopharmaceutical field due to the fact of their high specificity in the treatment of diverse diseases. Nevertheless, mAbs are very complex glycoproteins exhibiting several macro- and microheterogeneities that may affect their safety, quality, and efficacy. This complexity is very challenging for mAbs development, formulation, and quality control. To tackle the quality issue, a combination of multiple analytical approaches is necessary. In this perspective, capillary electrophoresis has gained considerable interest over the last decade due to the fact of its complementary features to chromatographic approaches. This review provides an overview of the strategies of mAbs and derivatives analysis by capillary electrophoresis hyphenated to ultraviolet, fluorescence, and mass spectrometry detection. The main sample preparation approaches used for mAb analytical characterization (i.e., intact, middle-up/down, and bottom-up) are detailed. The different electrophoretic modes used as well as integrated analysis approaches (sample preparation and separation) are critically discussed.
1. Introduction
Therapeutic monoclonal antibodies (mAbs) target specifically antigens and have proven their efficacy in many human diseases, especially autoimmune diseases (rheumatoid arthritis, lupus, psoriasis, inflammatory bowel diseases), cancers (breast, lung, colorectal, and hematological cancers). Their humanization has greatly enhanced their biocompatibility and decreased their side effects such as immunogenicity. The clinical success of mAbs has expanded their application domain to other pathologies such as infectious, migraine, asthma, and hereditary diseases [1]. Approximately 80 mAbs have been approved by the Food and Drug Administration (FDA) and European Medicines Agency (EMA) [2,3], which constitute the most important class of biopharmaceuticals. Monoclonal antibodies accounted for $150 billion in total sales in 2019, and they are expected to double in profit by 2025 [3].
Monoclonal antibodies are highly complex glycoproteins from the immunoglobulin G class with a large molecular weight (MW ≈ 150 kDa). They consist of two light chains (LC, MW ≈ 25 kDa) and two heavy chains (HC, MW ≈ 50 kDa) of polypeptides linked together by inter-chain disulfide bonds and non-covalent interactions (Figure 1). Intra-chain disulfide bonds form constant and variable domains in the polypeptide chains [4]. Variable domains comprise complementarity determining regions (CDRs) that are considered as signature peptides responsible for antigen-binding specificity [5]. The constant region is characteristic for a given immunoglobulin class (IgG, IgM, IgA, and IgE) or subclass (IgG1, IgG2, IgG4). Monoclonal antibodies are the products of a long manufacturing process wherein many post-translational modifications (PTMs) occur on the polypeptides chains like N-terminal pyroglutamate formation, C-terminal lysine truncation, and glycosylation, adding another level of complexity [6]. Biantennary glycans are linked to an asparagine residue in the heavy chain and some mAbs possess several glycosylation sites on HCs and LCs such as cetuximab [7]. These N-glycans are highly heterogeneous and affect the anti-inflammatory properties of mAbs resumed on the following effector functions: antibody dependent cell-mediated cytotoxicity (ADCC) and complement dependent cytotoxicity (CDC) [8]. Other enzymatic, physical, and chemical modifications can occur during the manufacturing steps of mAbs. These modifications may cause micro-variations in size and/or charge (e.g., asparagine deamidation, pyroglutamate formation, methionine oxidation, C-terminal clipping, and cysteine-related modifications) or promote macro-variations such as denaturation, fragmentation or aggregation [6,9]. The majority of micro-heterogeneities are considered critical quality attributes (CQAs) because they may alter the pharmacokinetic and pharmacodynamic properties of mAbs such as half lifetime, antigen binding, anti-inflammatory property, or increase their immunogenicity [10,11]. The International Conference on Harmonization (ICH), FDA, and EMA guidelines as well as pharmacopeia monographs require the physicochemical characterization of micro-heterogeneities and the evaluation of their impact on the quality, efficacy, and safety of mAbs [12].
The high complexity (large size with several microheterogeneities) of mAbs poses a great analytical challenge. Indeed, a panel of analytical techniques is used for the physicochemical characterization of mAbs (chromatography, electrophoresis, mass spectrometry (MS), and spectroscopic techniques) at different levels: (i) the protein level following the intact and middle-up/down approaches; (ii) the peptide level following the bottom-up approach [13]. Among them, capillary electrophoresis (CE) has gained considerable interest due to the fact of its high resolution and efficiency of separation of mAbs and derivatives [14,15]. It has found many applications in the physicochemical characterization of mAbs and mAbs derivatives including peptide mapping, site-specific characterization, glycosylation profiling, charge and size heterogeneity assessment, impurities analysis, such as host cell proteins (HCPs), biosimilarity assessment, and stability determination [14]. Capillary electrophoresis has proven its ability for the determination of drug-loaded distribution and drug-to-antibody ratio (DAR) for antibody–drug conjugates (ADC). Additionally, CE is adapted for the integration of sample preparation and chemical/enzymatic reactions with separation and detection.
In this review, analytical considerations for sample preparation, separation modes, and detection are pointed out. First, the sample preparation required for each approach is detailed (i.e., bottom-up, middle-up, intact, released glycans, and derivatization). Then, the analyses of mAbs by the different CE modes (i.e., capillary zone electrophoresis, capillary gel electrophoresis, capillary isoelectric focusing, and micellar electrokinetic capillary chromatography) are discussed. Analytical conditions, specific sample preparation requirements, methods optimization, identification with MS, miniaturization, and automation were also considered.
2. Sample Preparation of Monoclonal Antibodies
2.1. Analytical Considerations
Sample preparation is an intricate part of the development of mAbs characterization methods whatever the used analytical technique. Careful consideration of the physicochemical properties of the mAbs samples as well as the CE mode used is required. Monoclonal antibodies formulations usually contain mAbs at high concentrations (10 to 100 g/L), buffers (e.g., phosphate, citrate, acetate), salts (e.g., sodium chloride), and excipients (e.g., sucrose, trehalose, polysorbate 80) at relatively high concentrations [16]. These latter components ensure the stability of the formulation [17].
Such as any biological, mAbs solutions are stored as aliquots at −20 °C. Freeze–thawing may induce aggregation, oxidation, hydrolysis, and pH changes that directly affect mAb stability [18,19]. Consequently, specific considerations have to be taken into account, including the selection of containers, pretreatment, freezing process, freeze–thaw cycles, and concentration of solutions. It is recommended to store mAbs solutions without any dilution or reconstitution in a buffer solution.
As high concentrations of mAbs, salts, excipients, and buffers may affect analytical performance. Consequently, sample preparation involves a dilution of mAb solution followed or not by desalting. Monoclonal antibodies are usually diluted to 0.2–2 g/L in water or appropriate buffer in the case of sample preparation with enzymatic digestion (e.g., phosphate, NaCl, acetate, bicarbonate) [20]. Salts in mAbs are a source of peak broadening, resolution decrease, and joule heating in CE [21], ion suppression and adduct formation in MS [22]. A desalting step is usually added for salt or proteolysis buffer removal. Buffer exchange with centrifugal filters and elution in resin columns are the two main methods used for desalting.
From an analytical point of view, dilution and desalting may decrease detection sensitivity, especially for minor species and impurities. Moreover, dilution/desalting may alter mAbs stability [18]. The characteristics of mAb solution after dilution/desalting (composition, ionic strength, pH, temperature, and mAbs concentration) affect the solubility, isoelectric point (pI), hydrodynamic radius, micro-heterogeneities, and higher-order structure of mAbs [23]. Otherwise, each sample preparation step is critical and may induce changes related to the exposure of mAbs to novel conditions and influence analysis outcomes. As a consequence, the effect of the conditions of sample preparation should be evaluated carefully to conduct a confident characterization of mAbs. Other considerations relatives to specific approaches, electrophoretic techniques, and MS are discussed below.
2.2. Sample Preparation Approaches
Monoclonal antibodies are characterized following intact, middle-up, bottom-up, and released N-glycans approaches that are schematically depicted in Figure 2. The sample preparation required is thoroughly discussed in this section.
2.2.1. Intact and Top-Down
Sample preparation for intact and top-down approaches is the simplest. It includes fewer steps (dilution ± desalting) and presents a low risk to introduce modifications as the sample is not exposed to high temperature. It allows the determination of the exact molecular weight of mAbs and the quick assessment of certain microheterogeneities such as glycosylation.
This approach can be associated with carboxypeptidase B (CP-B) digestion to remove C-terminal lysine and deglycosylation to reduce the complexity and facilitate data interpretation by eliminating some sources of heterogeneity [24].
Derivatization reactions are often performed to enhance the sensitivity of capillary zone electrophoresis (CZE) and capillary gel electrophoresis (CGE) methods and allow the detection of low abundant variants. The choice of labeling reagent for the analyses of charge variants of intact mAbs must take into account several requirements that have been summarized by Han et al. [25]: (i) the reactive groups that can be engaged in the derivatization reaction should be commonly present in the mAb; (ii) the conjugation should not have a significant effect on the charge and size of charge variants; (iii) the fluorescent reagent should have effective absorption and emission according to instrument specifications.
Derivatization reactions are performed under adequate pH, buffer composition, ratio dye/substrate, temperature, and incubation time. The Cy5 NHS-ester has been used for the derivatization of intact mAbs; it provides selective derivatization of N-terminus and ε-amino groups of lysine residues. It replaces the intrinsic positive charge of lysine residues after conjugation. It has enhanced the detection of minor charge variants by a microchip CZE system [25]. The 5-carboxy tetramethyl rhodamine succinimidyl ester (5-TAMRA.SE) is another fluorescent dye adapted with CGE-sodium dodecyl sulfate (SDS) analyses. It increases the molecular weight by 413 Da [26]. The excess removal and inclusion of other steps, such as alkylation, should be evaluated.
2.2.2. Middle-Up/Down
The middle-up approach is performed with a less complicated sample preparation than bottom-up and more accurate MS characterization than the intact approach. Otherwise, it offers a site-specific characterization of mAbs and complementary information with intact and bottom-up approaches. It involves the analysis of mAbs subunits, which are generated in different ways:
Enzymatic Digestion
Enzymatic digestion is performed using enzymes from bacteria with high specificity for a single cleavage site. The digestion is generally performed at pH 6–8 and 37 °C in various buffers (e.g., phosphate, ammonium bicarbonate, tris-HCl) [20]. Papain, IgdE (IgG-degrading enzyme from Streptococcus suis), Kgp (lysine-specific gingipain), and SpeB (Streptococcal cysteine proteinase) cleave over the hinge region, yielding F(ab) (MW ≈ 50 kDa) and Fc (MW ≈ 50 kDa) subunits [27]. The Kgp is active under mild reducing conditions (2 mM cysteine), whereas SpeB is active under reducing conditions [28]. The IdeS (Immunoglobulin G degrading enzyme from Streptococcus pyrogenes) cleaves under the hinge region of mAbs to obtain F(ab)2 (MW ≈ 100 kDa) and Fc/2 (MW ≈ 25 kDa) subunits [29]. It is the most popular for the characterization of mAbs by CE due to the fact of its fast and efficient enzymatic activity.
Reduction
Partial reduction of disulfide bonds resulting in HC (MW ≈ 50 kDa) and LC (MW ≈ 25 kDa) chains. Reducing agents such as dithiothreitol (DTT), tris(2-carboxyethyl)phosphine (TCEP), and 2-mercaptoethanol (2-ME) are commonly used for mAbs reduction. Dithiothreitol is the most used reducing agent for mAbs reduction [19]. It is active at neutral conditions (pH 6 to 8) and widely used because the reaction can be quenched by acidification. Tris(2-carboxyethyl)phosphine is odorless, less susceptible to oxidation, active under wide pH range (pH 2 to 8), and unreactive towards other functional groups of proteins [30]. The reduction is usually performed with a concentration ranging from 5 to 100 mM of reducing reagent under heating (25–90 °C) for 10 to 60 min.
Multiple Reactions
Enzymatic digestion and reduction (IdeS digestion followed by disulfide bonds reduction with DTT or TCEP, SpeB digestion under reducing conditions). This approach is used to decrease the complexity of mAbs subunits and enhance electrospray ionization by reducing their molecular weight yielding the subunits (LC, Fd, and Fc/2, MW ≈ 25 kDa). As the IdeS enzyme does not contain disulfide bonds [31], the digestion and reduction steps can be combined without affecting the IdeS structure and activity. This combination decreases the time required for incubation and makes the sample preparation more straightforward. Combined or successive digestions with two enzymes such as IgdE and IdeS. This strategy allows hinge region isolation as well as disulfide bridges and free thiol investigation [32].
2.2.3. Bottom-Up
Therapeutic mAbs are frequently analyzed by the bottom-up approach. It is the conventional approach used to determine the primary structure, PTMs and degradation sites. Monoclonal antibodies are enzymatically digested into peptides within the range ~500−4000 Da. The resulting peptides are submitted to peptide mapping by peptide mass fingerprinting or peptide fragment fingerprinting using a separative technique followed by MS or tandem MS [33,34].
Sample preparation is the key of efficient peptide mapping. It involves long steps of sample processing that take a considerable amount of time. It comprises pretreatment steps to render cleavage sites accessible to enzyme followed by digestion (Figure 2). Many factors are taken into account for sample preparation: digestion efficiency, compatibility of reagents with the separation technique conditions and MS detection, and control of the matrix effects. The majority of prior research at the bottom-up level has applied the following steps as depicted in Figure 2.
Denaturation
The first step is denaturation with a chaotropic reagent or surfactant to solubilize the mAbs:
- -
- Urea destabilizes mAbs by the formation of hydrogen bonds [35]. However, it decomposes into isocyanic acid with time and heat, causing mAbs carbamylation that induces mass artifacts of 43 Da [36]. Carbamylation depends on temperature, incubation time, and pH. It can be minimized by using a buffer containing ammonium ions [37];
- -
- -
- RapiGest® (sodium 3-((2-methyl-2-undecyl-1,3-dioxolan-4-yl)methoxyl)-1-propane sulfonate) is an efficient surfactant compatible with different enzymes. It is also compatible with MS analysis due to the fact of its acid-labile character [40]. It causes protein unfolding and is cleaved by adding formic acid at the end of digestion. Consequently, it does not interfere with electrophoretic separation and MS detection.
Reduction and Alkylation
In the second step, disulfide bonds are completely broken by a reduction step. There is a panel of reducing agents: DTT, TCEP, 2-mercaptoethanol (2-ME), and tris(3-hydroxypropyl)phosphine (THPP) [41]. Dithiothreitol is the most used reducing agent for mAbs reduction [27]. Ethylenediaminetetraacetic acid (EDTA) is sometimes added to prevent undesired methionine oxidation during the reduction step [39]. Denaturation and reduction steps can be combined to decrease the overall incubation time of the pretreatment step [36].
After reduction, alkylation is usually performed with iodoacetamide or iodoacetic acid in the dark. The alkylating reagent is added in excess to block the free thiols and prevent disulfide bonds reformation. This step is not necessary when accelerated digestion is performed [42]. Differential alkylation of free cysteine residues is a strategy to measure free thiol levels. It comprises two alkylation steps with two distinct alkylating reagents; first, free thiols are alkylated under denaturing conditions. This step is followed by mAbs reduction and alkylation of reduced cysteines. This strategy allows accurate quantitation of free thiols by peptide mapping. Differential alkylation is usually performed with a maleimide alkylating reagent at acidic pH to avoid artificial free thiol formation or disulfide scrambling [43]. Alkylation with iodoacetamide is sometimes quenched by adding an excess of DTT to avoid overalkylation [44].
Digestion
In-solution digestion is most frequently performed by trypsin, a highly specific serine protease cleaving at the C-terminal side of the basic residues lysine and arginine, except when followed by proline. Trypsin is widely used because of its availability and low cost [45,46]. Lysyl endopeptidase C (Lys-C) is an alkaline protease that cleaves specifically at the carboxyl side of lysine [45,47]. Other enzymes, such as pepsin [48] and glut-C [49], are less used.
The digestion efficiency is highly dependent on sample preparation factors, including enzyme specificity, buffer pH, buffer composition, ratio enzyme/substrate, incubation time, temperature, sample properties. It is determined from the sequence coverage and the levels of missed-cleavages, non-specific cleavages, and enzyme autolysis. Modified and stabilized enzymes have been developed to increase the digestion efficiency and decrease enzyme autolysis, like modified trypsin by reductive methylation. The choice of digestion buffer is highly critical. Its composition and pH influence the enzyme activity. For tryptic and Lys-C digestion, tris-HCl and ammonium bicarbonate are commonly used at pH around 8.0 [27]. It also affects the level of some PTMs of the analyzed antibody. For example, ammonium bicarbonate is known to increase the deamidation of asparagine [50]. The presence of calcium in the digestion buffer enhances the trypsin stability and activity [51]. The conditions of effective digestion (pH 7.0–9.0 and overnight incubation at 37 °C) usually induce unwanted or artificial modifications. For example, asparagine deamidation, methionine oxidation, and release of sialic acids are promoted by elevated temperature and long incubation time [52]. Multiple enzymatic digestions with a combination or successive use of proteases have been proposed to achieve maximal sequence coverage (e.g., tryptic and Lys C digestions combination) [53]. Digestions with trypsin and Lys-C are usually ended by adding formic acid, trifluoroacetic acid, or an excess of reducing agent to prevent the over-digestion of mAbs or the autodigestion of trypsin.
Different strategies were proposed to limit the artificial modifications occurring during sample preparation like the implementation of the digestion in enriched 18O water to differentiate artificial deamidation [54,55] and digestion with low pH resistant Lys-C [56]. Accelerated digestion procedures were also suggested to minimize artifacts and decrease incubation time like microwave-assisted digestion, pressure cycling technology (PCT) assisted tryptic digestion [57], and infrared radiation assisted digestion [51]. Automated procedures have also been suggested to decrease the time and reactants required for sample preparation. Many immobilized trypsin-based microreactors have been developed in columns [58,59] or in-capillaries [60]. Other straightforward strategies have been proposed to accelerate the tryptic digestion, avoid reagent waste and realize fully automated analyses: electrophoretically mediated microanalysis (EMMA) [61] and transverse diffusion of laminar flow profile (TDLFP) [62].
2.2.4. Released N-glycans
Deglycosylation
N-glycans are generally released using an endoglycosidase peptide N4-(N-acetyl-b-glucosaminyl) asparagine amidase (PNGase-F). It cleaves N-glycans (high mannose, hybrid and complex oligosaccharides) between N-acetylglucosamine (GN) and asparagine residues of mAbs.
Deglycosylation should consider the possible loss of labile residues, such as sialic acid, especially for the longer incubation times and high temperatures required for PNGase-F digestion [63]. Endoglycosidase EndoS1 and EndoS2 release N-glycans by cleaving the β-1,4 linkage between the two (GN) [64]. These bacterial enzymes exhibit fast reactions, but the first (GN) in the core N-linked glycan is left attached to the glycosylation site; its fucosylation cannot be studied at the glycan level. The combination of EndoS and IdeS digestion allows the determination of fucosylation by MS [65].
N-glycan Labeling
Analyses of released N-glycans require a derivatization step with a fluorescent label. Derivatization is applied to enhance electrophoretic separation by introducing a negative charge to the neutral glycans and detection by fluorescence as they do not absorb in UV. The derivatization is a reductive amination reaction that involves a labeling reagent containing an amine group and a reducing reagent. 1-Aminopyrene-3,6,8-trisulfonic acid (APTS) is the most used fluorophore. 2-Amino-naphthalene trisulfonic acid (ANTS) and 2-aminobenzoic acid (2-AA) are adapted for electrophoretic methods but are less used. Sodium cyanoborohydride is a toxic catalyzer widely used for reduction. 2-Picoline borane has been proposed as a non-toxic alternative reagent [66]. The labeling step is followed by a purification step to remove the labeling reagent excess and concentrate the sample. The solid-phase extraction method is generally used for purification [67].
The sample preparation of N-glycans is complicated and time-consuming. Varadi et al. used magnetic beads to develop a fast automated sample preparation method. After the deglycosylation step, carboxy-coated magnetic beads were added to the sample to capture released glycans. They introduced acetic acid as a catalyst and a high APTS concentration to enhance labeling efficiency [68]. Szigeti et al. described the method improvement above to perform ultrafast, large scale, and fully automated sample preparation [69].
N-glycan Sequencing
Different exoglycosidases (α or β-mannosidase, α-fucosidase, β-galactosidase, and neuraminidase) are used to confirm the identity of released glycans without the need for MS [70].
3. Capillary Electrophoresis Analyses
Capillary electrophoresis has found different applications in the development and quality control of monoclonal antibodies. Capillary electrophoresis is considered as a powerful technique for biomolecule analysis as well as sample preparation as it offers the possibility to implement all analysis steps in an automated manner. It also presents complementary and alternative features to liquid chromatography. Technical and analytical considerations required for each CE mode from sample preparation to analysis conditions are critically discussed.
3.1. Capillary Zone Electrophoresis (CZE)
3.1.1. Technical Considerations
Capillary zone electrophoresis is the most used CE mode for mAbs analysis, as its separation mode based on charge to hydrodynamic ratio allows the analysis of mAbs at different levels (intact, middle-up, and bottom-up) with high resolution and efficiency. Capillary zone electrophoresis is a cost-effective technique with high flexibility. Thanks to the absence of the stationary phase, it is adapted with sample preparation (in-line preconcentration, in-line digestion, aqueous solvent, enzymes, temperature control), electrophoretic separation (denaturing or native conditions), and on-line detection (UV, LIF, MS) [14]. It is well suited for the investigation of charge and size heterogeneities of mAbs.
- Capillary coating
Adsorption of analytes to the capillary wall is a major issue that affects the performance of CZE analyses. It alters analyses repeatability, peaks efficiencies, and causes a loss of mAbs [71]. Dynamic coating with polymers such as cellulose derivatives (hydroxypropyl methylcellulose (HPMC) or hydroxypropyl cellulose (HPC)), polyethylene oxide (PEO), or polyamines such as triethylenetetramine (TETA) are adsorbed reversibly to the capillary wall and are usually used as additives to the background electrolyte (BGE) to avoid adsorption, modulate EOF and improve analyses repeatability. These coatings were successfully used in several publications to achieve high-resolution charge variants separation at the intact level and mAbs mixtures [72,73]. However, dynamic coatings are not appropriate in coupling CZE with MS because they cause high background signals, ion suppression, and ion source contamination [74]. Permanent coatings are well suited for their high stability; they are adsorbed irreversibly or covalently bonded to the capillary wall. Neutral coatings, such as linear polyacrylamide (LPA) [75], polyvinyl alcohol (PVA) and positively charged coatings, such as cross-linked polyethyleneimine (c-PEI), 1-(4-iodobutyl) 4-aza-1-azoniabicyclo [2,2,2] octane iodide (M7C4I), are commonly used for the analyses of mAbs [76].
- MS-based detection modes
Capillary zone electrophoresis is commonly coupled to on-line optical detector (UV, (LIF)) and/or MS to allow structural characterization. Electrospray mass spectrometry (ESI-MS) with sheath liquid or sheathless interfaces is the main MS system used for mAbs characterization. The interfaces developed to ensure a closed electrical circuit and stable electrospray have been reviewed in several papers [77,78,79,80,81]. The sheath liquid interface uses a coaxial sheath-liquid that mixes with the CZE effluent. It is generally composed of a mixture of aqueous solution and organic modifier (e.g., methanol, isopropanol) to enhance ionization efficiency. This interface suffers from suction and dilution effects that can affect the resolution of separation and detection sensitivity [82]. A nano-sheath flow interface has been proposed with several setups to deal with these drawbacks [83]. The sheathless interface consists of a porous tip at the capillary outlet connected with a conductive liquid reservoir. It undergoes a low flow rate, zero dilution effect, and is the most used for mAbs characterization due to the fact of its better sensitivity and selectivity than previous interfaces [84,85]. ESI requires volatile solutions and is incompatible with salts presence that causes adducts formation and ion suppression [86].
Off-line coupling with MALDI-MS has also been developed by a direct collection and deposition of separated fractions of the sample, followed by matrix deposition [87]. This approach has the advantage of tolerating the presence of salts in the sample and BGE, but has a limited resolution that can compromise the confident characterization of micro-heterogeneities at the intact and middle-up levels [24].
3.1.2. CZE Analyses
Sample preparation, choice of BGE conditions (nature, pH, and ionic strength), and capillary surface are key elements for successful CZE analyses. The choice of the pH should consider the mAb or subunits solubility together with the capillary coating stability as well as the detection type in the case of hyphenation with MS. The most used analysis conditions for CZE analysis are briefly presented in Table 1. Capillary zone electrophoresis characterization of mAbs can be performed either at the intact, middle-up or bottom-up level:
Intact and Middle-Up Approaches
Intact and middle-up characterization provides complementary information to the bottom-up approaches and could be considered as alternatives for fast characterization of certain microheterogenities like glycosylation and charge heterogeneity at the protein level. Intact mAbs analyses are usually followed by middle-up analyses to get high resolution of MS spectra and allow site-specific characterization. The flexibility of CZE allows the performance of analyses under wide conditions (denaturing or native conditions).
- Analyses under non-compatible conditions with MS detectionCapillary zone electrophoresis-UV is frequently used to evaluate charge heterogeneity of several mAbs at the intact and middle-up levels in routine analyses [73,88,89]. An intercompany study has demonstrated its high performance for analyses of a broad range of mAb pI and its suitability for good manufacturing practice (GMP) environment [88]. A comparative study revealed its higher performance on the separation of charge variants over cIEF [90]. He et al. showed that the charge differences between variants are pH dependent and their separation occurs at pH closer to the pI of mAbs. Furthermore, mAbs have a limited solubility at pH around their pI and tend to precipitate [91]. Consequently, the pH of the BGE and the sample buffer should be chosen carefully.6-Aminocaproic acid-based BGE is a standard BGE for mAbs analyses with CZE–UV due to the fact of its zwitterionic properties and low conductivity [92,93]. It is often used at high ionic strength to lower EOF and enhance separation resolution [73]. 6-Aminocaproic acid/citric acid at lower ionic strength provided a high resolution of separation and peak efficiencies for analyses of infliximab subunits after IdeS digestion [94]. Additives can be added in the sample buffer or BGE to enhance peak shape or resolution. Urea was added to BGE to partially separate disulfide isomers of an IgG2 mAb [95]. Several studies reported the optimization of BGE composition. Suba et al. used a “two-phase-four-step” approach for rapid optimization of BGE (6-aminocaproic acid, TETA, and HPMC) for analyses of intact and papain digested mAb samples [96]. Moritz et al. applied the design of experiments approach (DoE) for the optimization of analysis conditions. The impact of several parameters of BGE, including TETA concentration, pH value, polymer additive (HPC versus HPMC), and other additives (butanolamine and acetonitrile) were investigated [97].Despite its high performance and cost-effectiveness, CZE–UV does not allow the identification of separated peaks. The conditions above cannot be used in CE–ESI–MS as 6-aminocaproic acid-based BGEs are not volatiles. A heart-cut CZE–CZE–MS system was developed to perform separation and quantitation of charge variants by 6-aminocaproic acid-based CZE–UV by the first dimension and acetic acid-based CZE–MS to establish their identities and modifications [92]. Asymmetric conditions of BGE have been developed to characterize digested cetuximab with IdeS by off-line CZE–UV coupled to MALDI-MS via a fraction collection platform [98,99]. Inlet BGE was based on 6-aminocaproic acid/acetic acid; outlet BGE was based on ammonium acetate to allow good crystallization of collected fractions in the matrix 2,5-dihydroxybenzoic acid in 0.1% trifluoroacetic acid/acetonitrile (TFA/ACN; 30/70, v/v) deposited on the MALDI plate. The developed conditions allowed the separation of F(ab)2 glycoforms with NGNA residue [24,99].
- Analyses under MS-compatible conditionsThe CZE–ESI–MS system requires the use of volatile solutions and is incompatible with the presence of salts that would cause adduct formation and ion suppression. As a consequence, the choice of the sample matrix and BGE is pretty limited for CZE–ESI–MS. Acetic acid, formic acid, and ammonium acetate are typical for the analyses of mAbs in CZE–ESI–MS.
- ○
- Denaturing conditionsDenaturing conditions of sample buffer and BGE cause the mAbs unfolding and dissociate non-covalent interactions. Consequently, ESI efficiency is enhanced (an increase of charge state) and proper investigation of microheterogeneities is done.Samples are sometimes prepared in denaturing solutions that consist in aqueous solutions of acid and organic solvent such as acetonitrile, methanol, and isopropanol to reduce sample zone conductivity and enhance the resolution of separation. The presence of reduced mAbs in an aqueous solution of 35% acetic acid/50% acetonitrile (v/v) favored sample stacking and allowed the injection of 7% of the capillary volume [100]. A 0.2% acetic acid/10% isopropanol (v/v) aqueous solution was used as a sample buffer and BGE for analyses of different intact mAbs and an ADC in a microfluidic system coupled to MS. The results allowed the characterization of partially separated charge variants as clipping of C-terminal lysine and their related glycoforms. In addition to these pieces of information, the drug-to-antibody ratio was determined after full CZE separation of the ADC charge variants [93,101]. In another study, an aqueous solution of 15% acetic acid/15% acetonitrile (v/v) was used as a sample buffer for high resolution of separation of subunits of reduced, digested, digested-reduced mAb as well as their characterization with sheath-liquid CZE–MS and neutral coating [102].Acidic BGE (pH < 3) is often used to separate variants or subunits of mAbs and enhance ESI efficiency. Acetic acid is used instead of formic acid for CZE separations due to its very low conductivity that avoid joule heating [103]. Additives such as organic solvents are sometimes used to enhance variants solubility and decrease hydrophobic interactions between them [97]. Acetic acid BGE was used to perform sheathless CE–MS with a neutral coating to perform separation and assignment of intact nanobodies and their deamidated and truncated forms at the C-terminal tag. Moreover, isomeric deamidated products were efficiently separated. The heterogeneity of intact and IdeS digested mAbs (trastuzumab, infliximab, and ustekinumab) was also investigated. The F(ab)2 and Fc/2 fragments were highly resolved and partial separation of Fc/2 charge variants was obtained [75]. Georgetti et al. optimized the composition of sample buffer and % of acetic acid BGE. Intact or digested mAbs were prepared in an aqueous solution of 1% formic acid/30% methanol (v/v) after desalting and 3% acetic acid was used as BGE. These conditions allowed the partial separation of charge variants, di-glycosylated, and mono-glycosylated forms of different intact mAbs. In addition, complete or partial separation and characterization were achieved for IdeS digestion products, IdeS digestion followed by reduction products as well as their variants with positively charged coating [104,105]. Belov et al. performed high resolution separation of charge variants, deamidated forms, sialylated, and non-sialylated glycoforms with MS/MS confirmation at the middle-down level. Even bi-, mono- and non-glycosylated forms of a mAb were separated at the intact level using 0.2% formic acid/10% isopropanol (v/v) BGE and M7C4I coating [76]. Nevertheless, unwanted modifications of microvariations can be induced by the exposure of mAbs to these conditions, such as loss of sialic acid of N-glycans, which is considered as a critical quality attribute [106,107].
- ○
- Non-denaturing conditionsAmmonium acetate is the core sample buffer and BGE for native or near-native CZE-ESI-MS characterization (pH 5.0–7.0). It preserves non-covalent interactions and conformational heterogeneity of mAbs due to the fact of its volatility. Francois et al. characterized the Fc/2 dimers formed by non-covalent interactions by CE–MS [24]. They used ammonium acetate as a sample buffer for sheathless CE–MS infusion of collected fractions after CZE separation. Said et al. performed a sheathless CE–MS infusion to estimate the drug load distribution and the drug-to-antibody ratio (DAR) of intact ADC (bretuximab-vedotin) as well as its subunits after IdeS digestion by sheathless CE–MS [108]. Dadouch et al. used ammonium acetate both as BGE and proteolysis buffer for in-line middle-up analyses of infliximab because of its compatibility with IdeS digestion. They implemented the in-line methodology with TDLFP mixing and simplified procedure using plug–plug mode for reactants injection and temperature control. The methodology provided complete in-line digestion and separation, a significant decrease in reactant consumption and digestion time, and higher peak efficiency comparing with the off-line assay. The digestion products and Fc/2 dimers were identified by sheathless CE–MS [94]. Carillo et al. achieved partial separation of charge variants of trastuzumab and bevacizumab by µCE–ESI–MS with ammonium acetate/DMSO BGE analyses. Charge variants profiles were determined and related glycoforms, particularly sialylated N-glycans, were identified and relatively quantitated with high accuracy and sensitivity [109]. Ammonium acetate has also been employed for the assessment of mAbs stability and aggregate formation. Belov et al. characterized non-covalent dimeric aggregates, their glycosylation profile and the glycan pairing of intact trastuzumab [110]. Minh et al. studied the unfolding and aggregation of stressed infliximab. Folded and unfolded infliximab were partially separated. They investigated infliximab dimers formation and attributed its formation to the interaction between unfolded infliximab molecules via F(ab) regions [111]. Characterization of mAbs by CE–ESI–MS under native conditions is still challenging due to the spray generation with pressure in the case of neutral coating or electroosmotic flow in the case of positively charged coating that compromises the separation efficiency.Intact and middle-up approaches can be followed by MS/MS analyses referred to top-down and middle-down to confirm results. These approaches allow mAbs sequencing by direct fragmentation of intact mAbs or mAbs subunits in ion source decay or higher collision energy dissociation cell of mass spectrometers [76,99]. As a consequence, they are powerful alternative approaches to the bottom-up approach to avoid sample preparation artifacts. However, it is still challenging to get complete sequence coverage due to the following technical issues: (i) the decrease of MS sensitivity with the increase of the molecular weight of analytes that affects the fragmentation efficiency and (ii) sophisticated mass spectrometers with high resolution are required [112].
Bottom-Up
Peptide mapping is the method of choice for the extensive characterization of mAbs (amino-acid sequence, post-translational modifications, and degradations). It requires complete separation of peptides and complete sequence coverage. The RPLC-MS does not often provide complete coverage due to the loss of small hydrophilic peptides in the void volume and the strong column interactions with the large hydrophobic peptides [85]. The complementarity of CZE-MS to RPLC-MS has been demonstrated to recover a maximum of peptides [113].
The sequence coverage depends highly on sample preparation. Gahoual et al. conducted the tryptic digestion protocol of trastuzumab with RapiGest® surfactant [114]. Resulted data demonstrated complete digestion without missed cleavages allowing full characterization of mAbs sequence and microvariations in a single run using sheathless CZE–MS. The strategy was also applied for confident biosimilarity assessment [115] and validation of N-glycosylation profiling [116]. Said et al. adapted the tryptic digestion protocol of mAbs to an ADC (brentuximab-vedotin) following the study of Janin-Bussat et al. [117]. The tryptic digestion was preceded by IdeS digestion. Organic solvents (acetonitrile, isopropanol) were added to the sample before and after tryptic digestion to enhance drug-conjugated peptides (highly hydrophobic peptides) solubility and ensure their MS detection. The sample preparation procedure allowed the successful detection of monomethyl auristatin E (MMAE)-conjugated peptides [108].
The low sample volume/quantity injected into the capillary has a detrimental effect on peptides detection sensitivity and sequence coverage. Transient isotachophoresis (t-ITP) is the conventional method for bottom-up analyses by CZE–ESI–MS that overcomes this drawback. It allows on-line preconcentration by increasing sample loading without affecting separation efficiency [118]. It is performed by preparing the peptides obtained from tryptic digestion in the leading electrolyte and conducting separation with (10% v/v) acetic acid BGE. Gahoual et al. reported increased sample loading capacity to 25% of total capillary volume in an uncoated capillary [114]. Heemskerk et al. reported increased sample loading capacity to 37% of the total volume of a neutral coated capillary [119]. Moreover, the t-ITP CZE–ESI–MS method provides high resolution of separation with acetic acid BGE and high sensitivity allowing full detection of peptides including (i) small and hydrophilic peptides which are not characterized by RPLC-MS [85]; (ii) glycopeptides (glycosylation site, separation of glycopeptides and their quantification) [34,116]; (iii) intact and modified peptides such as peptides with deamidated asparagines, oxidized methionines and pyroglutamate formation [34,115]; (iv) peptides isomers such as peptides with aspartate isomers [120] and glycopeptides with sialic acid isomers [121]; (v) conjugated peptides comprising different drug payload [108].
Improved performance of detection of large and hydrophobic peptides could be reached by tunning the BGE composition. Dada et al. have reported the use of modified BGE (15–20% of N,N-dimethylacetamide DMA or N,N-dimethylformamide DMF in 20% acetic acid) to enhance the separation resolution and ionization of large and hydrophobic peptides [122]. In a subsequent study, a supercharging agent (m-nitrobenzoyl alcohol) was added in the modified BGE for the peptide mapping of an ADC. The recovery of conjugated peptides was increased to 70% [123]. Otherwise, high resolution of separation prevents competition during the ionization process and allows precise relative quantitation of modified and unmodified peptides, glycopeptides, and conjugated peptides. This is relevant for in-depth characterization of multi-quality attributes in quality control and biosimilarity assessment.
The bottom-up approach involves high reactants consumption, long time, and multistep sample preparation that induce artifacts on the characterization of some critical quality attributes such as the increase of methionine oxidation, deamidation of asparagine residues, and aspartate isomerization [52,124]. In-capillary tryptic digestion has been proposed by Ladner et al. as a promising strategy to decrease time and reactants consumption using transverse diffusion of laminar flow profiles (TDLFP) [62,125,126]. Analyses were performed using the sandwich mode for reactants and proteolysis buffer injection.
Released N-glycans
CZE is useful for the determination of N-glycosylation profiles at the intact, middle-up, and bottom-up levels, as mentioned previously. It is also recommended for the analyses of released glycans with LIF or MS detection. However, the analysis of released glycans involves additional sample preparation steps (release of N-glycans, fluorescent labeling) [127] and does not provide information about glycosylation sites. CZE, coupled to LIF or MS detection, presents attractive features for the comprehensive and confident characterization of N-glycosylation. Its orthogonal selectivity to hydrophilic interaction liquid chromatography (HILIC) has been demonstrated [128]. The on-line CE-LIF-MS system offers a complete N-glycans characterization, allowing accurate quantitation by LIF and accurate identification by MS [106].
CZE provides excellent separation of labeled N-glycans that lead to suppression of ionization competition [129]. Its usefulness has been demonstrated for the separation and detection of minor N-glycans such as N-glycolylneuraminic acid galactose residues involved in immunogenicity [130].
The development of several fast and sensitive methods for the analysis of released N-glycans was reported. Bunz et al. used an alkaline BGE composed of 6-aminocaproic acid and ammonia in water/methanol 30:70 (v/v) solution for sheath liquid CE-MS. Baseline separations of APTS labeled N-glycans, their isomers and native glycans were achieved. Thus, the labeling reaction efficiency was determined through the quantitation of unlabeled glycans. The method was applied to 2-Aminonaphthylsulfonic acid (2-ANSA) labeled glycans. Analyses showed decreased separation resolution and increased ionization efficiency comparing with APTS labeled glycans analyses [131]. In a subsequent study, sheath liquid CE-MS conditions using neutral coating and acidic BGE based on 6-aminocaproic acid/acetic acid were optimized. The developed conditions implied lower ionization efficiency than alkaline conditions [132].
Ammonium buffers are dominant in glycan separation [133]. Szabo et al. developed a fast CZE-LIF method for the separation of labeled N-glycans by adding boric acid and linear polyacrylamide to ammonium acetate BGE, which improved the selectivity and resolution of N-glycans mixture. The method allowed the separation of all fucosylated and afucosylated positional isomers and different high mannose N-glycans species [134]. Teal™ labeled N-glycans were analyzed by sheath liquid CE-MS with ammonium hydroxide BGE. The addition of acetonitrile and isopropanol to ammonium hydroxide enhanced the CE-MS performance and allowed sample separation of native and labeled glycans. The Teal™ dye provided comparable LIF, MS sensitivity to APTS dye and better reactivity than APTS dye. The method was valuable for on-line identification and quantitation of N-linked glycans [135].
In another study, Varadi et al. employed 12/13C stable isotopes of 2-AA to perform twoplex relative quantitation of released glycans [136]. They optimized the ammonium acetate pH to maintain 2-AA deprotonated to separate glycans. The CZE–MS showed high selectivity in the differentiation of the isotopologues of 2-AA and separation of position and linkage-specific isomers. The method was applied for the comparative study of different lots of cetuximab and its subunits after IdeS digestion with less technical variation and subjectivity. The authors performed N-glycans sequencing of released glycans with sheath liquid CZE–MS. Digested N-glycans with different exoglycosidases were separated, permitting the determination of fucosylation, galactosylation, and sialylation degrees. Moreover, minor complex glycans species and isobaric species were separated and identified [137].
A promising automated strategy has been described for the analyses of APTS labeled N-glycans and their on-line sequencing. High resolution and high peak efficiencies were obtained in a capillary filled with thermally tunable phospholipids mixture (1,2-dimyristoyl-sn-glycero-3-phosphocholine (DMPC) and 1,2-dihexanoyl-sn-glycero-3-phosphocholine (DHPC)) without need for neutral coating [138,139]. In-capillary sequencing of glycans was performed with single or multiple exoglycosidases. Enzymes were injected hydrodynamically and labeled N-glycans sample was injected electrokinetically to gain the first enzyme plug. When multiple enzymes were used for sequencing (neuraminidase, b1-4 galactosidase, and b-N-acetylglucosaminidase), 2-hydroxy-3-morpholino- propanesulfonic acid (MOPS) spacer buffer was injected between each plug to prevent carryover. Consecutive incubations were performed after injection and migration of the products to the subsequent plug. Sequencing with single and multiple enzymes allowed the identification of terminal glycan residues and the determination of their abundance without the need for MS [139].
In a recent work, Joob et al. reported the first analysis of APTS labeled N-glycans by CZE hyphenated to drift tube ion mobility-mass spectrometry (DTIM-MS). The separated N-glycans were further separated by DTIM-MS. The study revealed the presence of isomeric forms including different linkages and/or gas-phase conformers [140].
Related Products Impurities
Capillary zone electrophoresis was also applied to analyze related process impurities, especially host cell proteins (HCP) at the bottom-up level. In analyses of low abundance impurities, the sample preparation is usually initiated by mAbs depletion to enhance the detection. Nevertheless, this step is time-consuming and may induce loss of proteins. Indeed, Zhang et al. demonstrated that fractions of peptides are not identified in the case of the analyzed sample with or without depletion and concluded that the combination of the two approaches recovers the maximum of identified peptides [141]. Zhu et al. reported the analyses of HCP. mAbs were depleted using protein A/L columns, then HCPs were digested with trypsin and isotopic-labeled peptides were incorporated in the sample prepared in 0.05% formic acid with 25% acetonitrile solution to allow stacking before analysis by CZE–ESI–MS/MS with 0.1% formic acid BGE [142]. They also developed a CZE–MS/MS method for the quantification of HCP impurities at 100 ppm level by performing analyses without mAbs depletion. Optimized dynamic pH junction using 5% acetic acid BGE and ammonium bicarbonate pH 8.0 as sample buffer was applied for on-line preconcentration. Results were consistent with RPLC-MS/MS data [143].
3.2. Capillary Gel Electrophoresis (CGE)
Capillary gel electrophoresis is an interesting tool for the characterization of size heterogeneities during process development and quality control. It allows the investigation of mAb stability and purity (fragmentation, elongation or truncation of N terminus of mature mAb, aggregation) as well as N-glycans [146,147,148,149]. Capillary gel electrophoresis analyses are performed in a capillary filled with a sieving matrix as a separation medium. The sieving matrix is commercially available as kits. It comprises a linear or branched polymer (polyacrylamide, PEG, polyethylene oxide, or dextran). The sieving matrix can include high ionic strength of buffer or dynamic coating to suppress EOF. It may also contain additives such as glycerol to enhance the resolution of separation [150].
Capillary gel electrophoresis analyses of mAbs and ADCs are performed under denaturing conditions with surfactants, mostly sodium dodecyl sulfate (SDS) under reducing or non-reducing conditions. Denaturation is always performed by preparing the mAb in a sample buffer (borate, citrate, or phosphate buffer) containing (SDS) and incubated at high temperature (65 or 70°C) for a few minutes. It is a transposition of SDS-PAGE in the capillary format [147,151]. The separation occurs according to the hydrodynamic radius of denatured proteins [152]. Alternatively, sodium hexadecyl sulfate (SHS) can be used to enhance resolution [153]. The denaturation parameters are optimized to get complete denaturation and consistent results with other orthogonal techniques such as size exclusion chromatography [154].
3.2.1. Non-Reduced CGE-SDS
Non-reduced CGE-SDS is used for the determination of product and process-related impurities. For example, it was used to investigate the fragmentation induced by host cell proteases [155], disulfide bonds reduction and re-oxidation [156,157]. It is useful for the identification and quantification of low (LMW) and high (HMW) molecular weight impurities and provides orthogonal information to size exclusion chromatography about covalent aggregates [150]. It is also useful for optimizing sample preparation protocols as reduction and digestion (e.g., IdeS, IgdE).
Denaturation affects the stability of mAbs and increases the fragmentation level in the case of non-reduced CGE-SDS. Alkylation of free thiols cysteine is required to avoid disulfide bonds scrambling and LC release. It is recommended to achieve alkylation at pH higher than 7.0 where protonated thiols are predominant [151]. Furthermore, incomplete denaturation may result in interfering peaks of non-denatured mAbs. Lacher et al. observed incomplete denaturation of mAbs with glycosylated F(ab) when using a standard protocol [150]. This is likely due to the decrease of mAb hydrophobicity caused by glycans, resulting in less easy complexation with SDS. Guo et al. optimized the conditions of denaturation and showed that complete denaturation resulted in partial separation of IgG2 disulfide bonds isomers [158]. Therefore, it is strongly recommended to optimize denaturation conditions for each analyzed mAb to avoid mAb-specific issues.
3.2.2. Reduced CGE-SDS
Reduced CGE–SDS is applied for the quantification and assignment of LMW, HMW, and non-glycosylated species [150,159]. Sample preparation is performed by adding a reducing agent, such as β-mercaptoethanol or DTT with SDS-buffer to a mAb sample, in order to break inter-chain disulfide bonds. Reducing agents do not have a substantial impact on mAbs purity and adequate conditions with denaturation are easily determined. The sample preparation procedure is sometimes preceded by or combined with a fluorescent labeling step to enhance the detection of impurities such as non-glycosylated mAbs and fragmented mAbs [26,160]. However, the effect of denaturation and reduction conditions on labeling should be investigated when labeling is integrated into sample preparation. Indeed, Szekrényes et al. showed that alkylation with iodoacetamide has no impact on labeling efficiency, while the reduction with DTT and 2-ME lowered the labeling efficiency with Chromeo P503 fluorophore [160]. Deglycosylation can also be performed before or with the denaturation step when appropriate. It facilitates the peak assignment of non-glycosylated mAbs impurities. The desalting step of sample solutions with a high salt amount could be essential because salts interfere with electrokinetic injection and reduce the injected amount of sample [152].
Denaturation conditions, SDS sample buffer pH and concentration, as well as alkylating agent concentration, have to be carefully investigated to avoid artifacts (e.g., increasing the fragmentation level) [151,154]. Even auto-sampling and storage conditions have to be considered [152]. Smith et al. used a DoE approach to evaluate the effect of these critical factors: heating time and temperature of denaturation and reduction, mAb concentration, sample buffer volume, and DTT concentration (for reduced CGE–SDS). Sample buffer volume, incubation time, and temperature were found to significantly affect the purity results of two mAbs under reducing or non-reducing conditions [161].
Internal standards with adequate molecular weight or commercialized protein mixtures are usually used to allow MW calculation from migration time, quantification, and mitigation of fluctuations related to analysis conditions [162]. Several observations have reported an inconsistent correlation of migration time with the molecular weight. For instance, unexpected results were observed in recent studies. The identification of separated LCs of a bispecific antibody by a bi-dimensional system showed high MW for the first migrating LC than the second one [163]. In another study, fractions of separated subunits by CGE–SDS were collected and analyzed by RPLC-MS. This discrepancy has been observed between different subunits of mAb (F(ab), LC dimer, LC and HC) [164]. This may be explained by the complexity of mAbs molecules. Therefore, the peak assignment in CGE–SDS through migration time may be biased.
3.2.3. Coupling with MS
Mass spectrometry allows the exact identification of separated peaks and fragmentation sites by complementary approaches. However, the CGE–SDS is incompatible with MS due to high ion suppression caused by the sieving matrix components. Some efforts have been made to eliminate interference sources. Hernandez et al. tested different in-capillary strategies for CZE–MS to remove SDS from antibodies samples treated with SDS before MS detection: transient isotachophoresis, injections of pre-plugs and post-plugs of organic solvents, stripping agents (cyclodextrins) or cationic surfactants [165]. The use of cetyltrimethylammonium bromide (CTAB), and methanol provided good results and increased the MS signal intensity above 94%. Römer et al. used an adapted SDS-removal strategy to a bi-dimensional heart-cut CGE–SDS/CZE–MS system to identify different mAbs subunits and impurities [163]. They applied the methodology to a bispecific antibody having two different LCs. The SDS buffer composition was optimized by adding propanol as an organic modifier to allow the separation of LC chains by the first dimension (CGE–SDS). Then, the CZE dimension allowed their detection by MS due to the fact of its compatibility.
3.2.4. CGE Analyses of Released N-glycans
Capillary gel electrophoresis is a fast and cost-effective technique for the identification and relative quantification of glycans, which are crucial in quality control and biosimilarity assessment [166]. A matrix based on linear polymers included in a BGE is used to separate labeled glycans according to their charge to size ratio under suppressed EOF [70]. Resolution is highly influenced by matrix viscosity [160]. Thus, temperature optimization is an important option to get a high resolution of separation. The reproducibility of sample preparation and CGE–LIF analysis of APTS-labeled N-glycans was demonstrated through interlaboratory study [160]. Reusch et al. used a fast reductive amination with ANTS. The method provided similar results to the reference method HILIC (2-AB) and good performance of analysis for sialylated species. Nevertheless, the G0-N structure was not separated from other N-glycans species [167]. Moreover, CGE–LIF allows the separation of labeled glycans from the fluorescent dye excess [133] and the removal of dye excess is required when the electrokinetic injection is applied [63].
N-glycans are identified by their migration time calibration with standards and determination of their glucose unit (GU) values or glycan sequencing [70,168]. CGE analyses of labeled N-glycans with ANTS allowed to determine GU values of 25 glycans to generate a database of ANTS-labeled N-glycans. The GU values were verified by analyses of released glycans from human IgG and a glycoprotein. Multi-capillary gel electrophoresis is useful for high throughput analysis of fluorophore-labeled N-glycans to build a new glucose unit database [169].
Migration time shifts between samples, peak distortions, stretching and compression of CGE electropherograms may complicate the analyses of datasets and affect the identification and quantification of glycans. The co-injection of bracketing standards (that do not interfere with the migration of glycans) is applied to evaluate precision and determine the glucose unit values that allow glycans identification [63]. Additionally, there exists a panel of software for data processing and alignment, namely, glyXalign, dynamic time warping, correlation optimized warping, Peak Alignment by Genetic Algorithm, Peak Alignment using Reduced Set mapping and alignDE [170].
A summary of sample preparation and examples of reactants used as well as analytical conditions for mAbs and glycans analyses is presented in Table 2.
3.3. Capillary Isoelectric Focusing (cIEF)
Capillary isoelectric focusing has become the method of choice for the characterization of mAbs charge variants as it takes into account the global charge of the mAbs during separation [174]. It allows the determination of the apparent pI of mAbs, levels of acidic, main, and basic mAbs variants as well as impurities [175,176]. Analyses are carried out by preparing a sample matrix filling the capillary that typically includes: mAb solution, carrier ampholytes, additives, and pI markers. This step is followed by a focusing step with an applied voltage to establish a pH gradient inside a neutral coated capillary (e.g., fluorocarbon, PVA, dynamic coating), resulting in the separation of mAb variants according to their pI. For single-point detection, a chemical or pressure mobilization towards the UV detection window is applied. Imaged cIEF (icIEF) offers more straightforward detection and enhanced resolution due to the absence of mobilization step [177]. Coupling cIEF with MS provides even more in-depth characterization. Nevertheless, it remains problematic due to the high concentrations and non-volatility of ampholytes and additives as well as the dilution effect of the sheath liquid interface for some instrumentation [178].
Sample preparation is a crucial step in the development of cIEF methods. Thus, specific attention is given to the choice of the sample matrix components (pI, carrier ampholytes composition) and their concentrations during methods development.
The pI markers are standard substances synthetic-based peptides with known pI values. They are required for accurate determination of apparent pI of mAbs. The pI markers range should be consistent with the pI of mAbs charge variants to guarantee accurate pI values [179]. Small synthetic molecules have been used as pI markers for their broad pH range, good UV absorbance, accessibility and to avoid precipitation and adsorption issues [180].
Carrier ampholytes are essential ingredients in the sample matrix as they generate the pH gradient and determines the selectivity and the resolution of separations. They consist of a mixture of polyamino-carboxylic acids having different pI and high buffering capacity near their pI. Carrier ampholytes formulations are commercialized by various companies such as Sigma–Aldrich, GE Healthcare, ProteinSimple, and Sciex. The pH range of ampholytes has to be chosen carefully regarding the pI of the analyzed mAbs. A combination of broad and narrow pH range of carrier ampholytes in an optimized ratio is often used to reach a linear pH gradient and enhance separation resolution [180,181].
Cellulose derivatives are used as viscosity enhancers to stabilize the pH gradient and dynamic coating to lower EOF and protein adsorption [182]. Methylcellulose is often used in the sample matrix. However, it can affect the charge-based separation of charge variants due to its sieving effect. Glycerol is an alternative additive. It has several advantageous properties, such as providing a linear pH gradient, stabilizing focused proteins and reducing their adsorption accordingly. Moreover, it presents low conductivity and it is suitable for hyphenation with MS [183]. It has been used for the characterization of different mAbs at the intact level as well as cetuximab at the middle-up level by cIEF coupled to MS via an electrokinetically pumped sheath-flow nanospray [184,185]. Sharper peaks and high resolution were obtained. Interferences with MS detection were avoided by using acetonitrile in the sheath liquid to break hydrogen bonds of glycerol with mAbs. It is worth noting that these conditions allowed for the first time the separation of F(ab)2 acidic variants differing only by one NGNA residue and successful investigation of charge heterogeneity sources such as deamidation [186].
Additives like surfactants and denaturants are commonly used to minimize precipitation and aggregation of mAbs after focusing. Urea is the most commonly used. Several studies reported optimized and validated methods using urea at high concentration in the sample matrix (1 to 5 M) to achieve the best resolution of charge variants separation and reproducibility at the intact level [181,182,186]. Besides, urea was used at a concentration of 8 M to enhance the solubility of HC and LC of reduced mAb in cIEF analysis [187]. Urea was used to dissociate non-covalent interactions and allow the separation of subunits resulted from reduction or IdeS digestion followed by reduction treatment [188]. In a comparative study of the originator and generic rituximab from different markets, urea was used to perform the separation of LC, Fd, and Fc/2 subunits under denaturing conditions after Spe-B digestion, CP-B treatment, or degradation treatment of samples [189]. Sucrose is another common additive. It has been used in combination with urea to ensure the solubility and prevent aggregation of mAb after focusing [182]. Nonetheless, the denaturing effect of urea causes shifts of apparent pI [190,191]. The pI shifts may also be induced by protein carbamylation by isocyanic acid derived from urea [37]. Even partial denaturation may be the origin of misleading observations like peak splitting, peak splicing, and repeatability issues [180,192].
Different strategies have been developed to alleviate problems related to the use of urea. For example, several studies reported cIEF analyses without urea in the sample matrix with a high separation resolution [179,180,193]. In another study, formamide was used instead of urea for the analysis of a fusion protein to enhance its stability. As a consequence, a basic peak resulting from the carbamylation of the fusion protein disappeared. Then, the method was applied successfully to various mAbs [194]. Zhang et al. conducted icIEF analyses of mAbs under native conditions (without urea). They combined the non-detergent sulfobetaine and taurine in the matrix formula to achieve high resolution and repeatability [192]. They also demonstrated the positive effect of this combination on mAbs and pH gradient stability through a robustness study.
The mAbs sample matrix contains a certain amount of salt that may affect the pH gradient, matrix viscosity, EOF, mAbs stability, separation resolution, migration time, and peak shapes. He et al. showed that icIEF separation was affected by a high concentration of salts [182]. They recommended the optimization of salt amount following the mAb formulation composition due to the significant differences in the nature and concentration of salts present in mAbs formulations. Suba et al. performed analyses of non-desalted mAb without adding salts in the sample matrix [180]. In another study, Zhang et al. showed that the desalted sample analyses resulted in increased migration time and incomplete focusing. The presence of salts at a concentration of 30–35 mM of non-desalted mAb provided better results [189].
Spacers or stabilizers are added in the sample matrix to avoid sample loss into the capillary ends and bidirectional isotachophoresis phenomenon that leads to the pH gradient instability [181]. Their pIs are higher or lower than the pH range of the ampholytes used. A cathodic stabilizer (arginine, pI 10.7) is also used to prevent the focusing of basic compounds behind the detection window. Cao et al. observed an enhanced peak signal by increasing arginine concentration due to its compressing effect of the pH gradient [195]. However, several cIEF methods were performed without arginine or iminodiacetic acid and reported good results [171,182,184,189].
Additives related to mAbs reconstitution may also affect cIEF analyses. For example, Demirdilek et al. studied the stability of reconstituted mAbs in dextrose bags [196]. They demonstrated that the presence of dextrose diluted to 5% (w/v) in the sample matrix as an additive produced an acidic shift that was compensated by basic shift induced by the addition of 2 M urea.
Hence, a large panel of parameters influences the analyses by cIEF. Thus, DoE approach was applied in several studies. Maeda et al. reported the use of the DoE approach to optimize the composition of the sample solution (ampholyte, HPMC, urea, arginine, diaminoacetic acid, and pI markers). Then, the optimized method was applied to the analysis of an ADC gemtuzumab-ozogamicin. The study demonstrated the presence of 13 charge variants and the decrease of pI of deglycosylated ADC [197]. Kahle et al. applied the DoE approach to optimize cIEF method for the analysis of NIST mAb. The study indicated that the related sample preparation factors (concentration and ratio of pharmalyte 8–10.5 and pH 3–10, L-arginine concentration, and urea concentration) significantly impact separation resolution and peak positions and counts. All the studied factors affected the apparent pI except L-arginine [198]. The conventional cIEF was successfully miniaturized into a microfluidic IEF system. It provided comparable performance in terms of resolution and precision and ultrafast charge heterogeneity assessment [199]. Mack et al. developed an online icIEF system with MS-compatible conditions to characterize charge variants [200].
Sample matrix formulas and analysis conditions from publications treating the development of cIEF methodologies for mAbs, ADCs and fusion proteins characterization with UV or MS detection are summarized in Table 3.
3.4. Micellar Electrokinetic Capillary Chromatography (MEKC)
Micellar electrokinetic capillary chromatography (MEKC) is less used for mAbs analysis due to the fact of its low reproducibility. It consists of the formation of mAbs–micell complexes to perform the separation. Micellar electrokinetic capillary chromatography was evaluated for a mAbs charge heterogeneity study [90]. It provided good separation efficiency and short analysis time but low reproducibility. Micellar electrokinetic capillary chromatography was used for mAb variants separation. Kats et al. demonstrated that the separation was based on differences in the exposure of mAbs structural elements to the solvent [202]. MEKC was also evaluated for glycans analysis. Feng et al. demonstrated the relevance of MEKC for analyses of small and highly sialylated glycans and its orthogonality with CZE [133].
4. Conclusions
Capillary electrophoresis has become a powerful technique for mAbs analyses at different steps of their development from clone selection to batch release. It allows extensive characterization of mAbs from the peptide (bottom-up) to the protein (intact and middle-up) level as well as N-glycans. Capillary electrophoresis is a powerful, cost-effective, and eco-friendly technique. The different CE modes are well adapted with mAbs analysis. The CZE mode is the most used due to its simplicity and flexibility regarding analysis conditions (denaturing or native conditions, MS-compatible or not). Coupled to MS, CZE provides a comprehensive physicochemical characterization of mAbs: peptide mapping, site-specific characterization, charge heterogeneity assessment, glycosylation profiling, and impurities analysis. In addition, CZE offers attractive features for miniaturization, sample preparation automation and its integration with separation and detection. Both CGE and MEKC are relevant techniques for size heterogeneity assessment and glycans analysis. Capillary isoelectric focusing is considered as the reference technique for pI determination and charge variants profiling. Additionally, mAbs analyses were implemented successfully with microfluidic devices. The reduction of sample preparation complexity, analyses with native CE–ESI–MS, the coupling of originally non MS-compatible modes of CE to MS and bi-dimensional methods with orthogonal techniques to get more reliable information is the next step for substantial investigation of mAbs.
Author Contributions
Conceptualization, M.D., Y.L., and C.P.; investigation, M.D.; resources, M.D.; writing—original draft preparation, M.D.; writing—review and editing, Y.L. and C.P.; supervision, C.P. and Y.L. project administration, C.P. All authors have read and agreed to the published version of the manuscript.
Funding
This research received no external funding.
Acknowledgments
The Algerian Ministry of Higher Education and Scientific Research (MESRS) for the scholarship of excellence of Meriem DADOUCH.
Conflicts of Interest
The authors declare no conflict of interest.
References
- Bouzid, K.; Bedairia, N.; Marty, M. Anticorps monoclonaux thérapeutiques en cancérologie. Pathol. Biol. 2012, 60, 223–228. [Google Scholar] [CrossRef] [PubMed]
- Tsumoto, K.; Isozaki, Y.; Yagami, H.; Tomita, M. Future perspectives of therapeutic monoclonal antibodies. Immunotherapy. 2019, 11, 119–127. [Google Scholar] [CrossRef] [PubMed]
- Lu, R.M.; Hwang, Y.C.; Liu, I.J.; Lee, C.C.; Tsai, H.Z.; Li, H.J.; Wu, H.C. Development of therapeutic antibodies for the treatment of diseases. J. Biomed. Sci. 2020, 27, 1–30. [Google Scholar] [CrossRef] [PubMed]
- Davis, J.D.; Deng, R.; Boswell, C.A.; Zhang, Y.; Li, J.; Fielder, P.; Joshi, A.; Kenkare-Mitra, S. Monoclonal Antibodies: From Structure to Therapeutic Application. In Pharmaceutical Biotechnology; Springer: New York, NY, USA, 2013; pp. 143–178. [Google Scholar]
- Todoroki, K.; Yamada, T.; Mizuno, H.; Toyo’oka, T. Current Mass Spectrometric Tools for the Bioanalyses of Therapeutic Monoclonal Antibodies and Antibody-Drug Conjugates. Anal. Sci. 2018, 34, 397–406. [Google Scholar] [CrossRef] [PubMed] [Green Version]
- Xu, Y.; Wang, D.; Mason, B.; Rossomando, T.; Li, N.; Liu, D.; Cheung, J.K.; Xu, W.; Raghava, S.; Katiyar, A.; et al. Structure, heterogeneity and developability assessment of therapeutic antibodies. MAbs 2019, 11, 239–264. [Google Scholar] [CrossRef] [Green Version]
- Ayoub, D.; Jabs, W.; Resemann, A.; Evers, W.; Evans, C.; Main, L.; Baessmann, C.; Wagner-Rousset, E.; Suckau, D.; Beck, A. Correct primary structure assessment and extensive glyco-profiling of cetuximab by a combination of intact, middle-up, middle-down and bottom-up ESI and MALDI mass spectrometry techniques. MAbs 2013, 5, 699–710. [Google Scholar] [CrossRef] [Green Version]
- Cymer, F.; Beck, H.; Rohde, A.; Reusch, D. Therapeutic monoclonal antibody N-glycosylation—Structure, function and therapeutic potential. Biologicals 2018, 52, 1–11. [Google Scholar] [CrossRef]
- Beck, A.; Liu, H. Macro- and Micro-Heterogeneity of Natural and Recombinant IgG Antibodies. Antibodies 2019, 8, 18. [Google Scholar] [CrossRef] [Green Version]
- Torkashvand, F.; Vaziri, B. Main quality attributes of monoclonal antibodies and effect of cell culture components. Iran. Biomed. J. 2017, 21, 131–141. [Google Scholar] [CrossRef]
- Geigert, J.; Geigert, J. Quality Attributes of a Biopharmaceutical. In The Challenge of CMC Regulatory Compliance for Biopharmaceuticals; Springer International Publishing: Berlin/Heidelberg, Germany, 2019; pp. 311–329. [Google Scholar]
- Parr, M.K.; Montacir, O.; Montacir, H. Physicochemical characterization of biopharmaceuticals. J. Pharm. Biomed. Anal. 2016, 130, 366–389. [Google Scholar] [CrossRef]
- Fekete, S.; Gassner, A.L.; Rudaz, S.; Schappler, J.; Guillarme, D. Analytical strategies for the characterization of therapeutic monoclonal antibodies. TrAC Trends Anal. Chem. 2013, 42, 74–83. [Google Scholar] [CrossRef]
- Gahoual, R.; Beck, A.; Leize-Wagner, E.; François, Y.-N. Cutting-edge capillary electrophoresis characterization of monoclonal antibodies and related products. J. Chromatogr. B 2016, 1032, 61–78. [Google Scholar] [CrossRef] [PubMed] [Green Version]
- Lechner, A.; Giorgetti, J.; Gahoual, R.; Beck, A.; Leize-Wagner, E.; François, Y.N. Insights from capillary electrophoresis approaches for characterization of monoclonal antibodies and antibody drug conjugates in the period 2016–2018. J. Chromatogr. B 2019, 1122–1123, 1–17. [Google Scholar] [CrossRef] [PubMed] [Green Version]
- Hebbi, V.; Chattopadhyay, S.; Rathore, A.S. High performance liquid chromatography (HPLC) based direct and simultaneous estimation of excipients in biopharmaceutical products. J. Chromatogr. B 2019, 1117, 118–126. [Google Scholar] [CrossRef] [PubMed]
- Falconer, R.J. Advances in liquid formulations of parenteral therapeutic proteins. Biotechnol. Adv. 2019, 37, 107412–107421. [Google Scholar] [CrossRef]
- Le Basle, Y.; Chennell, P.; Tokhadze, N.; Astier, A.; Sautou, V. Physicochemical Stability of Monoclonal Antibodies: A Review. J. Pharm. Sci. 2019, 109, 169–190. [Google Scholar] [CrossRef] [PubMed] [Green Version]
- Authelin, J.-R.; Rodrigues, M.A.; Tchessalov, S.; Singh, S.; McCoy, T.; Wang, S.; Shalaev, E. Freezing of biologicals revisited: Scale, stability, excipients, and degradation stresses. J. Pharm. Sci. 2020, 109, 44–61. [Google Scholar] [CrossRef]
- Bobaly, B.; D’Atri, V.; Goyon, A.; Colas, O.; Beck, A.; Fekete, S.; Guillarme, D. Protocols for the analytical characterization of therapeutic monoclonal antibodies. II—Enzymatic and chemical sample preparation. J. Chromatogr. B 2017, 1060, 325–335. [Google Scholar] [CrossRef]
- Beckers, J.L.; Boč Ek, P. The preparation of background electrolytes in capillary zone electrophoresis: Golden rules and pitfalls. Electrophoresis. 2003, 24, 518–535. [Google Scholar] [CrossRef]
- Chen, Y.; Mori, M.; Pastusek, A.C.; Schug, K.A.; Dasgupta, P.K. On-Line Electrodialytic Salt Removal in Electrospray Ionization Mass Spectrometry of Proteins. Anal. Chem. 2011, 83, 1015–1021. [Google Scholar] [CrossRef]
- Shire, S.J.; Shahrokh, Z.; Liu, J. Challenges in the development of high protein concentration formulations. J. Pharm. Sci. 2004, 93, 1390–1402. [Google Scholar] [CrossRef] [PubMed]
- François, Y.-N.; Biacchi, M.; Said, N.; Renard, C.; Beck, A.; Gahoual, R.; Leize-Wagner, E. Characterization of cetuximab Fc/2 dimers by off-line CZE-MS. Anal. Chim. Acta 2016, 908, 168–176. [Google Scholar] [CrossRef] [PubMed] [Green Version]
- Han, H.; Livingston, E.; Chen, X. High Throughput Profiling of Charge Heterogeneity in Antibodies by Microchip Electrophoresis. Anal. Chem. 2011, 83, 8184–8191. [Google Scholar] [CrossRef] [PubMed]
- Oscar, S.-S.; Brandon, T.; Sarah, D.; Monica, P.; Alex, S.; Ma, S. Optimization and Validation of a Quantitative Capillary Electrophoresis Sodium Dodecyl Sulfate Method for Quality Control and Stability Monitoring of Monoclonal Antibodies. Anal. Chem. 2006, 78, 6583–6594. [Google Scholar] [CrossRef]
- Goyon, A.; D’Atri, V.; Bobaly, B.; Wagner-Rousset, E.; Beck, A.; Fekete, S.; Guillarme, D. Protocols for the analytical characterization of therapeutic monoclonal antibodies. I—Non-denaturing chromatographic techniques. J. Chromatogr. B 2017, 1058, 73–84. [Google Scholar] [CrossRef]
- Sjögren, J.; Andersson, L.; Mejàre, M.; Olsson, F. Generating and purifying Fab fragments from human and mouse IgG using the bacterial enzymes IdeS, SpeB and Kgp. In Methods in Molecular Biology; Humana Press Inc.: Totowa, NJ, USA, 2017; Volume 1535, pp. 319–329. [Google Scholar]
- Sjögren, J.; Olsson, F.; Beck, A. Rapid and improved characterization of therapeutic antibodies and antibody related products using IdeS digestion and subunit analysis. Analyst 2016, 141, 3114–3125. [Google Scholar] [CrossRef] [PubMed]
- Domkin, V.; Chabes, A. Phosphines are ribonucleotide reductase reductants that act via C-terminal cysteines similar to thioredoxins and glutaredoxins. Sci. Rep. 2015, 4, 5539. [Google Scholar] [CrossRef] [Green Version]
- Wenig, K.; Chatwell, L.; von Pawel-Rammingen, U.; Björck, L.; Huber, R.; Sondermann, P. Structure of the streptococcal endopeptidase IdeS, a cysteine proteinase with strict specificity for IgG. Proc. Natl. Acad. Sci. USA 2004, 101, 17371–17376. [Google Scholar] [CrossRef] [Green Version]
- Faid, V.; Leblanc, Y.; Bihoreau, N.; Chevreux, G. Middle-up analysis of monoclonal antibodies after combined IgdE and IdeS hinge proteolysis: Investigation of free sulfhydryls. J. Pharm. Biomed. Anal. 2018, 149, 541–546. [Google Scholar] [CrossRef]
- Thiede, B.; Höhenwarter, W.; Krah, A.; Mattow, J.; Schmid, M.; Schmidt, F.; Jungblut, P.R. Peptide mass fingerprinting. Methods 2005, 35, 237–247. [Google Scholar] [CrossRef]
- Gahoual, R.; Burr, A.; Busnel, J.-M.; Kuhn, L.; Hammann, P.; Beck, A.; François, Y.-N.; Leize-Wagner, E. Rapid and multi-level characterization of trastuzumab using sheathless capillary electrophoresis-tandem mass spectrometry. MAbs 2013, 5, 479–490. [Google Scholar] [CrossRef] [Green Version]
- Lim, W.K.; Rösgen, J.; Englander, S.W. Urea, but not guanidinium, destabilizes proteins by forming hydrogen bonds to the peptide group. Proc. Natl. Acad. Sci. USA 2009, 106, 2595–2600. [Google Scholar] [CrossRef] [Green Version]
- Dick, L.W.; Mahon, D.; Qiu, D.; Cheng, K.C. Peptide mapping of therapeutic monoclonal antibodies: Improvements for increased speed and fewer artifacts. J. Chromatogr. B 2009, 877, 230–236. [Google Scholar] [CrossRef]
- Sun, S.; Zhou, J.Y.; Yang, W.; Zhang, H. Inhibition of protein carbamylation in urea solution using ammonium-containing buffers. Anal. Biochem. 2014, 446, 76–81. [Google Scholar] [CrossRef] [Green Version]
- Pace, C.N.; Grimsley, G.R.; Scholtz, J.M. Denaturation of Proteins by Urea and Guanidine Hydrochloride. In Protein Science Encyclopedia; Wiley-VCH Verlag GmbH & Co. KGaA: Weinheim, Germany, 2008. [Google Scholar]
- Mouchahoir, T.; Schiel, J.E. Development of an LC-MS/MS peptide mapping protocol for the NISTmAb. Anal. Bioanal. Chem. 2018, 410, 2111–2126. [Google Scholar] [CrossRef] [Green Version]
- Yu, Y.-Q.; Gilar, M.; Lee, P.J.; Bouvier, E.S.P.; Gebler, J.C. Enzyme-Friendly, Mass Spectrometry-Compatible Surfactant for In-Solution Enzymatic Digestion of Proteins. Anal. Chem. 2003, 75, 6023–6028. [Google Scholar] [CrossRef]
- McNulty, J.; Krishnamoorthy, V.; Amoroso, D.; Moser, M. Tris(3-hydroxypropyl)phosphine (THPP): A mild, air-stable reagent for the rapid, reductive cleavage of small-molecule disulfides. Bioorganic Med. Chem. Lett. 2015, 25, 4114–4117. [Google Scholar] [CrossRef]
- Huang, H.Z.; Nichols, A.; Liu, D. Direct Identification and Quantification of Aspartyl Succinimide in an IgG2 mAb by RapiGest Assisted Digestion. Anal. Chem. 2009, 81, 1686–1692. [Google Scholar] [CrossRef]
- Cheng, Y.; Chen, M.T.; Patterson, L.C.; Yu, X.C.; Zhang, Y.T.; Burgess, B.L.; Chen, Y. Domain-specific free thiol variant characterization of an IgG1 by reversed-phase high-performance liquid chromatography mass spectrometry. Anal. Biochem. 2017, 519, 8–14. [Google Scholar] [CrossRef]
- Rebecchi, K.R.; Go, E.P.; Xu, L.; Woodin, C.L.; Mure, M.; Desaire, H. Protein Sequence Coverage and Post-Translational Modifications Analysis of Recombinant Glycoproteins: Application to the Characterization of Human Lysyl Oxidase. Anal. Chem. 2011, 83, 8484–8491. [Google Scholar] [CrossRef] [Green Version]
- Huhn, C.; Selman, M.H.J.; Ruhaak, L.R.; Deelder, A.M.; Wuhrer, M. IgG glycosylation analysis. Proteomics 2009, 9, 882–913. [Google Scholar] [CrossRef] [PubMed]
- Switzar, L.; Giera, M.; Niessen, W.M.A. Protein Digestion: An Overview of the Available Techniques and Recent Developments. J. Proteome Res. 2013, 12, 1067–1077. [Google Scholar] [CrossRef]
- Dada, O.O.; Rao, R.; Jones, N.; Jaya, N.; Salas-Solano, O. Comparison of SEC and CE-SDS methods for monitoring hinge fragmentation in IgG1 monoclonal antibodies. J. Pharm. Biomed. Anal. 2017, 145, 91–97. [Google Scholar] [CrossRef]
- Beck, A.; Diemer, H.; Ayoub, D.; Debaene, F.; Wagner-Rousset, E.; Carapito, C.; Van Dorsselaer, A.; Sanglier-Cianférani, S. Analytical characterization of biosimilar antibodies and Fc-fusion proteins. TrAC Trends Anal. Chem. 2013, 48, 81–95. [Google Scholar] [CrossRef]
- Hansen, K.; Szarka, S.; Escoffier, E.; Berthet, A.; Venet, J.; Collet-Brose, J.; Hepburn, S.; Wright, M.; Wheller, R.; Nelson, R.; et al. Glu-C, an alternative digestive enzyme for the quantitative LC-MS/MS analysis of an IgG-based antibody biotherapeutic. Bioanalysis 2018, 10, 997–1007. [Google Scholar] [CrossRef] [PubMed]
- Kori, Y.; Patel, R.; Neill, A.; Liu, H. A conventional procedure to reduce Asn deamidation artifacts during trypsin peptide mapping. J. Chromatogr. B 2016, 1009–1010, 107–113. [Google Scholar] [CrossRef] [PubMed]
- Kolsrud, H.; Malerod, H.; Ray, S.; Reubsaet, L.; Lundanes, E.; Greibrokk, T. A Critical Review of Trypsin Digestion for LC-MS Based Proteomics. In Integrative Proteomics; InTech: Aalesund, Norway, 2012. [Google Scholar] [CrossRef] [Green Version]
- Wang, Y.; Li, X.; Liu, Y.H.; Richardson, D.; Li, H.; Shameem, M.; Yang, X. Simultaneous monitoring of oxidation, deamidation, isomerization, and glycosylation of monoclonal antibodies by liquid chromatography-mass spectrometry method with ultrafast tryptic digestion. MAbs 2016, 8, 1477–1486. [Google Scholar] [CrossRef] [Green Version]
- Du, Y.; Wang, F.; May, K.; Xu, W.; Liu, H. LC-MS analysis of glycopeptides of recombinant monoclonal antibodies by a rapid digestion procedure. J. Chromatogr. B 2012, 907, 87–93. [Google Scholar] [CrossRef]
- Gaza-Bulseco, G.; Li, B.; Bulseco, A.; Liu, H. Method to Differentiate Asn Deamidation That Occurred Prior to and during Sample Preparation of a Monoclonal Antibody. Anal. Chem. 2008, 80, 9491–9498. [Google Scholar] [CrossRef]
- Li, X.; Cournoyer, J.J.; Lin, C.; O’Connor, P.B. Use of 18O Labels to Monitor Deamidation during Protein and Peptide Sample Processing. J. Am. Soc. Mass Spectrom. 2008, 19, 855–864. [Google Scholar] [CrossRef] [Green Version]
- Cao, M.; Xu, W.; Niu, B.; Kabundi, I.; Luo, H.; Prophet, M.; Chen, W.; Liu, D.; Saveliev, S.V.; Urh, M.; et al. An Automated and Qualified Platform Method for Site-Specific Succinimide and Deamidation Quantitation Using Low-pH Peptide Mapping. J. Pharm. Sci. 2019, 108, 3540–3549. [Google Scholar] [CrossRef] [Green Version]
- Jiang, P.; Li, F.; Ding, J. Development of an efficient LC-MS peptide mapping method using accelerated sample preparation for monoclonal antibodies. J. Chromatogr. B 2020, 1137, 121895. [Google Scholar] [CrossRef]
- Cingöz, A.; Hugon-Chapuis, F.; Pichon, V. Evaluation of various immobilized enzymatic microreactors coupled on-line with liquid chromatography and mass spectrometry detection for quantitative analysis of cytochrome c. J. Chromatogr. A 2008, 1209, 95–103. [Google Scholar] [CrossRef]
- Goyon, A.; Dai, L.; Chen, T.; Wei, B.; Yang, F.; Andersen, N.; Kopf, R.; Leiss, M.; Mølhøj, M.; Guillarme, D.; et al. From proof of concept to the routine use of an automated and robust multi-dimensional liquid chromatography mass spectrometry workflow applied for the charge variant characterization of therapeutic antibodies. J. Chromatogr. A 2019, 1615, 460740. [Google Scholar] [CrossRef]
- Yin, Z.; Zhao, W.; Tian, M.; Zhang, Q.; Guo, L.; Yang, L. A capillary electrophoresis-based immobilized enzyme reactor using graphene oxide as a support via layer by layer electrostatic assembly. Analyst 2014, 139, 1973–1979. [Google Scholar] [CrossRef]
- Zeisbergerová, M.; Adámková, A.; Glatz, Z. Integration of on-line protein digestion by trypsin in CZE by means of electrophoretically mediated microanalysis. Electrophoresis 2009, 30, 2378–2384. [Google Scholar] [CrossRef]
- Ladner, Y.; Mas, S.; Coussot, G.; Bartley, K.; Montels, J.; Morel, J.; Perrin, C. Integrated microreactor for enzymatic reaction automation: An easy step toward the quality control of monoclonal antibodies. J. Chromatogr. A 2017, 1528, 83–90. [Google Scholar] [CrossRef]
- Guttman, A. Capillary electrophoresis in the N-glycosylation analysis of biopharmaceuticals. TrAC Trends Anal. Chem. 2013, 48, 132–143. [Google Scholar] [CrossRef] [Green Version]
- Sjögren, J.; Cosgrave, E.F.J.; Allhorn, M.; Nordgren, M.; Björk, S.; Olsson, F.; Fredriksson, S.; Collin, M. EndoS and EndoS2 hydrolyze Fc-glycans on therapeutic antibodies with different glycoform selectivity and can be used for rapid quantification of high-mannose glycans. Glycobiology 2015, 25, 1053–1063. [Google Scholar] [CrossRef] [Green Version]
- Henninot, A.; Terrier, A.; Charton, J.; Urbain, R.; Fontayne, A.; Deprez, B.; Beghyn, T. Characterization of monoclonal antibodies by a fast and easy liquid chromatography-mass spectrometry time-of-flight analysis on culture supernatant. Anal. Biochem. 2015, 491, 52–54. [Google Scholar] [CrossRef]
- Ruhaak, L.R.; Zauner, G.; Huhn, C.; Bruggink, C.; Deelder, A.M.; Wuhrer, M. Glycan labeling strategies and their use in identification and quantification. Anal. Bioanal. Chem. 2010, 397, 3457–3481. [Google Scholar] [CrossRef] [Green Version]
- Danyluk, H.J.; Shum, L.K.; Zandberg, W.F. A rapid procedure for the purification of 8-aminopyrene trisulfonate (APTS)-labeled glycans for capillary electrophoresis (CE)-based enzyme assays. In Methods in Molecular Biology; Humana Press Inc.: Totowa, NJ, USA, 2017; Volume 1588, pp. 223–236. [Google Scholar]
- Váradi, C.; Lew, C.; Guttman, A. Rapid magnetic bead based sample preparation for automated and high throughput N-glycan analysis of therapeutic antibodies. Anal. Chem. 2014, 86, 5682–5687. [Google Scholar] [CrossRef]
- Szigeti, M.; Lew, C.; Roby, K.; Guttman, A. Fully Automated Sample Preparation for Ultrafast N-Glycosylation Analysis of Antibody Therapeutics. J. Lab. Autom. 2016, 21, 281–286. [Google Scholar] [CrossRef] [Green Version]
- Lu, G.; Crihfield, C.L.; Gattu, S.; Veltri, L.M.; Holland, L.A. Capillary Electrophoresis Separations of Glycans. Chem. Rev. 2018, 118, 7867–7885. [Google Scholar] [CrossRef] [Green Version]
- Staub, A.; Guillarme, D.; Schappler, J.; Veuthey, J.-L.; Rudaz, S. Intact protein analysis in the biopharmaceutical field. J. Pharm. Biomed. Anal. 2011, 55, 810–822. [Google Scholar] [CrossRef]
- Shi, Y.; Li, Z.; Qiao, Y.; Lin, J. Development and validation of a rapid capillary zone electrophoresis method for determining charge variants of mAb. J. Chromatogr. B 2012, 906, 63–68. [Google Scholar] [CrossRef]
- Goyon, A.; Francois, Y.N.; Colas, O.; Beck, A.; Veuthey, J.L.; Guillarme, D. High-resolution separation of monoclonal antibodies mixtures and their charge variants by an alternative and generic CZE method. Electrophoresis 2018, 39, 2083–2090. [Google Scholar] [CrossRef]
- Nguyen, T.T.T.N.; Petersen, N.J.; Rand, K.D. A simple sheathless CE-MS interface with a sub-micrometer electrical contact fracture for sensitive analysis of peptide and protein samples. Anal. Chim. Acta 2016, 936, 157–167. [Google Scholar] [CrossRef]
- Haselberg, R.; De Vijlder, T.; Heukers, R.; Smit, M.J.; Romijn, E.P.; Somsen, G.W.; Domínguez-Vega, E. Heterogeneity assessment of antibody-derived therapeutics at the intact and middle-up level by low-flow sheathless capillary electrophoresis-mass spectrometry. Anal. Chim. Acta 2018, 1044, 181–190. [Google Scholar] [CrossRef]
- Belov, A.M.; Zang, L.; Sebastiano, R.; Santos, M.R.; Bush, D.R.; Karger, B.L.; Ivanov, A.R. Complementary middle-down and intact monoclonal antibody proteoform characterization by capillary zone electrophoresis—mass spectrometry. Electrophoresis 2018, 39, 2069–2082. [Google Scholar] [CrossRef]
- Maxwell, E.J.; Chen, D.D.Y. Twenty years of interface development for capillary electrophoresis–electrospray ionization–mass spectrometry. Anal. Chim. Acta 2008, 627, 25–33. [Google Scholar] [CrossRef]
- Ramautar, R.; Heemskerk, A.A.M.; Hensbergen, P.J.; Deelder, A.M.; Busnel, J.-M.; Mayboroda, O.A. CE–MS for proteomics: Advances in interface development and application. J. Proteomics 2012, 75, 3814–3828. [Google Scholar] [CrossRef]
- Heemskerk, A.A.M.; Deelder, A.M.; Mayboroda, O.A. CE-ESI-MS for bottom-up proteomics: Advances in separation, interfacing and applications. Mass Spectrom. Rev. 2016, 35, 259–271. [Google Scholar] [CrossRef]
- Kawai, T. Focusing Review Recent Studies on Online Sample Preconcentration Methods in Capillary Electrophoresis Coupled with Mass Spectrometry. Chromatography 2017, 38, 1–8. [Google Scholar] [CrossRef] [Green Version]
- Gahoual, R.; Leize-Wagner, E.; Houzé, P.; François, Y.N. Revealing the potential of capillary electrophoresis/mass spectrometry: The tipping point. Rapid Commun. Mass Spectrom. 2019, 33, 11–19. [Google Scholar] [CrossRef] [Green Version]
- Mokaddem, M.; Gareil, P.; Belgaied, J.-E.; Varenne, A. A new insight into suction and dilution effects in capillary electrophoresis coupled to mass spectrometry via an electrospray ionization interface. Part I-Suction effect. Electrophoresis 2008, 29, 1957–1964. [Google Scholar] [CrossRef]
- Höcker, O.; Montealegre, C.; Neusüß, C. Characterization of a nanoflow sheath liquid interface and comparison to a sheath liquid and a sheathless porous-tip interface for CE-ESI-MS in positive and negative ionization. Anal. Bioanal. Chem. 2018, 410, 5265–5275. [Google Scholar] [CrossRef]
- Gahoual, R.; Busnel, J.-M.; Wolff, P.; François, Y.N.; Leize-Wagner, E. Novel sheathless CE-MS interface as an original and powerful infusion platform for nanoESI study: From intact proteins to high molecular mass noncovalent complexes. Anal. Bioanal. Chem. 2014, 406, 1029–1038. [Google Scholar] [CrossRef]
- Whitmore, C.D.; Gennaro, L.A. Capillary electrophoresis-mass spectrometry methods for tryptic peptide mapping of therapeutic antibodies. Electrophoresis 2012, 33, 1550–1556. [Google Scholar] [CrossRef]
- Metwally, H.; McAllister, R.G.; Konermann, L. Exploring the Mechanism of Salt-Induced Signal Suppression in Protein Electrospray Mass Spectrometry Using Experiments and Molecular Dynamics Simulations. Anal. Chem. 2015, 87, 2434–2442. [Google Scholar] [CrossRef]
- Biacchi, M.; Bhajun, R.; Saïd, N.; Beck, A.; François, Y.N.; Leize-Wagner, E. Analysis of monoclonal antibody by a novel CE-UV/MALDI-MS interface. Electrophoresis 2014, 35, 2986–2995. [Google Scholar] [CrossRef] [Green Version]
- Moritz, B.; Schnaible, V.; Kiessig, S.; Heyne, A.; Wild, M.; Finkler, C.; Christians, S.; Mueller, K.; Zhang, L.; Furuya, K.; et al. Evaluation of capillary zone electrophoresis for charge heterogeneity testing of monoclonal antibodies. J. Chromatogr. B 2015, 983–984, 101–110. [Google Scholar] [CrossRef] [PubMed]
- Espinosa- de la Garza, C.E.; Perdomo-Abúndez, F.C.; Padilla-Calderón, J.; Uribe-Wiechers, J.M.; Pérez, N.O.; Flores-Ortiz, L.F.; Medina-Rivero, E. Analysis of recombinant monoclonal antibodies by capillary zone electrophoresis. Electrophoresis 2013, 34, 1133–1140. [Google Scholar] [CrossRef]
- Kahle, J.; Zagst, H.; Wiesner, R.; Wätzig, H. Comparative charge-based separation study with various capillary electrophoresis (CE) modes and cation exchange chromatography (CEX) for the analysis of monoclonal antibodies. J. Pharm. Biomed. Anal. 2019, 147, 460–470. [Google Scholar] [CrossRef] [PubMed]
- He, Y.; Isele, C.; Hou, W.; Ruesch, M. Rapid analysis of charge variants of monoclonal antibodies with capillary zone electrophoresis in dynamically coated fused-silica capillary. J. Sep. Sci. 2011, 34, 548–555. [Google Scholar] [CrossRef]
- Jooß, K.; Hühner, J.; Kiessig, S.; Moritz, B.; Neusüß, C. Two-dimensional capillary zone electrophoresis-mass spectrometry for the characterization of intact monoclonal antibody charge variants, including deamidation products. Anal. Bioanal. Chem. 2017, 409, 6057–6067. [Google Scholar] [CrossRef]
- Redman, E.A.; Batz, N.G.; Mellors, J.S.; Ramsey, J.M. Integrated Microfluidic Capillary Electrophoresis-Electrospray Ionization Devices with Online MS Detection for the Separation and Characterization of Intact Monoclonal Antibody Variants. Anal. Chem. 2015, 87, 2264–2272. [Google Scholar] [CrossRef]
- Dadouch, M.; Ladner, Y.; Bich, C.; Larroque, M.; Larroque, C.; Morel, J.; Bonnet, P.A.; Perrin, C. An in-line enzymatic microreactor for the middle-up analysis of monoclonal antibodies by capillary electrophoresis. Analyst 2020, 145, 1759–1767. [Google Scholar] [CrossRef]
- Henley, W.H.; He, Y.; Mellors, J.S.; Batz, N.G.; Ramsey, J.M.; Jorgenson, J.W. High resolution separations of charge variants and disulfide isomers of monoclonal antibodies and antibody drug conjugates using ultra-high voltage capillary electrophoresis with high electric field strength. J. Chromatogr. A 2017, 1523, 72–79. [Google Scholar] [CrossRef]
- Suba, D.; Urbányi, Z.; Salgó, A. Method development and qualification of capillary zone electrophoresis for investigation of therapeutic monoclonal antibody quality. J. Chromatogr. B 2016, 1032, 224–229. [Google Scholar] [CrossRef]
- Moritz, B.; Locatelli, V.; Niess, M.; Bathke, A.; Kiessig, S.; Entler, B.; Finkler, C.; Wegele, H.; Stracke, J. Optimization of capillary zone electrophoresis for charge heterogeneity testing of biopharmaceuticals using enhanced method development principles. Electrophoresis 2017, 38, 3136–3146. [Google Scholar] [CrossRef] [PubMed] [Green Version]
- Biacchi, M.; Gahoual, R.; Said, N.; Beck, A.; Leize-Wagner, E.; François, Y.-N. Glycoform Separation and Characterization of Cetuximab Variants by Middle-up Off-Line Capillary Zone Electrophoresis-UV/Electrospray Ionization-MS. Anal. Chem. 2015, 87, 6240–6250. [Google Scholar] [CrossRef] [PubMed] [Green Version]
- Biacchi, M.; Said, N.; Beck, A.; Leize-Wagner, E.; François, Y.-N. Top-down and middle-down approach by fraction collection enrichment using off-line capillary electrophoresis—mass spectrometry coupling: Application to monoclonal antibody Fc/2 charge variants. J. Chromatogr. A 2017, 1498, 120–127. [Google Scholar] [CrossRef] [PubMed] [Green Version]
- Zhao, Y.; Sun, L.; Knierman, M.D.; Dovichi, N.J. Fast separation and analysis of reduced monoclonal antibodies with capillary zone electrophoresis coupled to mass spectrometry. Talanta 2016, 148, 529–533. [Google Scholar] [CrossRef]
- Redman, E.A.; Mellors, J.S.; Starkey, J.A.; Ramsey, J.M. Characterization of Intact Antibody Drug Conjugate Variants Using Microfluidic Capillary Electrophoresis-Mass Spectrometry. Anal. Chem. 2016, 88, 2220–2226. [Google Scholar] [CrossRef]
- Han, M.; Rock, B.M.; Pearson, J.T.; Rock, D.A. Intact mass analysis of monoclonal antibodies by capillary electrophoresis—Mass spectrometry. J. Chromatogr. B 2016, 1011, 24–32. [Google Scholar] [CrossRef]
- Zhao, Y.; Sun, L.; Champion, M.M.; Knierman, M.D.; Dovichi, N.J. Capillary Zone Electrophoresis–Electrospray Ionization-Tandem Mass Spectrometry for Top-Down Characterization of the Mycobacterium marinum Secretome. Anal. Chem. 2014, 86, 4873–4878. [Google Scholar] [CrossRef]
- Giorgetti, J.; Lechner, A.; Del Nero, E.; Beck, A.; François, Y.N.; Leize-Wagner, E. Intact monoclonal antibodies separation and analysis by sheathless capillary electrophoresis-mass spectrometry. Eur. J. Mass Spectrom. 2019, 25, 324–332. [Google Scholar] [CrossRef] [Green Version]
- Giorgetti, J.; Beck, A.; Leize-Wagner, E.; François, Y.N. Combination of intact, middle-up and bottom-up levels to characterize 7 therapeutic monoclonal antibodies by capillary electrophoresis—Mass spectrometry. J. Pharm. Biomed. Anal. 2020, 182, 113107. [Google Scholar] [CrossRef] [Green Version]
- Gennaro, L.A.; Salas-Solano, O. On-Line CE−LIF−MS Technology for the Direct Characterization of N-Linked Glycans from Therapeutic Antibodies. Anal. Chem. 2008, 80, 3838–3845. [Google Scholar] [CrossRef]
- Ambrogelly, A.; Gozo, S.; Katiyar, A.; Dellatore, S.; Kune, Y.; Bhat, R.; Sun, J.; Li, N.; Wang, D.; Nowak, C.; et al. Analytical comparability study of recombinant monoclonal antibody therapeutics. MAbs 2018, 10, 513–538. [Google Scholar] [CrossRef] [PubMed]
- Said, N.; Gahoual, R.; Kuhn, L.; Beck, A.; François, Y.-N.; Leize-Wagner, E. Structural characterization of antibody drug conjugate by a combination of intact, middle-up and bottom-up techniques using sheathless capillary electrophoresis—Tandem mass spectrometry as nanoESI infusion platform and separation method. Anal. Chim. Acta 2016, 918, 50–59. [Google Scholar] [CrossRef] [PubMed] [Green Version]
- Carillo, S.; Jakes, C.; Bones, J. In-depth analysis of monoclonal antibodies using microfluidic capillary electrophoresis and native mass spectrometry. J. Pharm. Biomed. Anal. 2020, 185, 113218. [Google Scholar] [CrossRef] [PubMed]
- Belov, A.M.; Viner, R.; Santos, M.R.; Horn, D.M.; Bern, M.; Karger, B.L.; Ivanov, A.R. Analysis of Proteins, Protein Complexes, and Organellar Proteomes Using Sheathless Capillary Zone Electrophoresis—Native Mass Spectrometry. J. Am. Soc. Mass Spectrom. 2017, 28, 2614–2634. [Google Scholar] [CrossRef] [PubMed]
- Le-Minh, V.; Tran, N.T.; Makky, A.; Rosilio, V.; Taverna, M.; Smadja, C. Capillary zone electrophoresis-native mass spectrometry for the quality control of intact therapeutic monoclonal antibodies. J. Chromatogr. A 2019, 1601, 375–384. [Google Scholar] [CrossRef]
- Zhang, H.; Ge, Y. Comprehensive analysis of protein modifications by top-down mass spectrometry. Circ. Cardiovasc. Genet. 2011, 4, 711. [Google Scholar] [CrossRef] [PubMed]
- Gennaro, L.A.; Salas-Solano, O.; Ma, S. Capillary electrophoresis–mass spectrometry as a characterization tool for therapeutic proteins. Anal. Biochem. 2006, 355, 249–258. [Google Scholar] [CrossRef]
- Gahoual, R.; Busnel, J.-M.; Beck, A.; François, Y.-N.; Leize-Wagner, E. Full Antibody Primary Structure and Microvariant Characterization in a Single Injection Using Transient Isotachophoresis and Sheathless Capillary Electrophoresis–Tandem Mass Spectrometry. Anal. Chem. 2014, 86, 9074–9081. [Google Scholar] [CrossRef] [Green Version]
- Gahoual, R.; Biacchi, M.; Chicher, J.; Kuhn, L.; Hammann, P.; Beck, A.; Leize-Wagner, E.; François, Y.N. Monoclonal antibodies biosimilarity assessment using transient isotachophoresis capillary zone electrophoresis-tandem mass spectrometry. MAbs 2014, 6, 1464–1473. [Google Scholar] [CrossRef] [Green Version]
- Giorgetti, J.; D’Atri, V.; Canonge, J.; Lechner, A.; Guillarme, D.; Colas, O.; Wagner-Rousset, E.; Beck, A.; Leize-Wagner, E.; François, Y.-N. Monoclonal antibody N-glycosylation profiling using capillary electrophoresis—Mass spectrometry: Assessment and method validation. Talanta 2018, 178, 530–537. [Google Scholar] [CrossRef] [Green Version]
- Janin-Bussat, M.-C.; Dillenbourg, M.; Corvaia, N.; Beck, A.; Klinguer-Hamour, C. Characterization of antibody drug conjugate positional isomers at cysteine residues by peptide mapping LC-MS analysis. J. Chromatogr. B 2015, 981–982, 9–13. [Google Scholar] [CrossRef] [PubMed]
- Štěpánová, S.; Kašička, V. Recent applications of capillary electromigration methods to separation and analysis of proteins. Anal. Chim. Acta 2016, 933, 23–42. [Google Scholar] [CrossRef] [PubMed]
- Heemskerk, A.A.M.; Wuhrer, M.; Busnel, J.-M.; Koeleman, C.A.M.; Selman, M.H.J.; Vidarsson, G.; Kapur, R.; Schoenmaker, B.; Derks, R.J.E.; Deelder, A.M.; et al. Coupling porous sheathless interface MS with transient-ITP in neutral capillaries for improved sensitivity in glycopeptide analysis. Electrophoresis 2013, 34, 383–387. [Google Scholar] [CrossRef] [PubMed]
- Gahoual, R.; Beck, A.; François, Y.-N.; Leize-Wagner, E. Independent highly sensitive characterization of asparagine deamidation and aspartic acid isomerization by sheathless CZE-ESI-MS/MS. J. Mass Spectrom. 2016, 51, 150–158. [Google Scholar] [CrossRef] [Green Version]
- Kammeijer, G.S.M.; Jansen, B.C.; Kohler, I.; Heemskerk, A.A.M.; Mayboroda, O.A.; Hensbergen, P.J.; Schappler, J.; Wuhrer, M. Sialic acid linkage differentiation of glycopeptides using capillary electrophoresis—Electrospray ionization—Mass spectrometry. Sci. Rep. 2017, 7, 3733. [Google Scholar] [CrossRef]
- Dada, O.O.; Zhao, Y.; Jaya, N.; Salas-Solano, O. High-Resolution Capillary Zone Electrophoresis with Mass Spectrometry Peptide Mapping of Therapeutic Proteins: Improved Separation with Mixed Aqueous–Aprotic Dipolar Solvents (N, N-Dimethylacetamide and N, N-Dimethylformamide) as the Background Electrolyte. Anal. Chem. 2017, 89, 11227–11235. [Google Scholar] [CrossRef]
- Dada, O.O.; Zhao, Y.; Jaya, N.; Salas-Solano, O. High-Resolution Capillary Zone Electrophoresis with Mass Spectrometry Peptide Mapping of Therapeutic Proteins: Peptide Recovery and Post-translational Modification Analysis in Monoclonal Antibodies and Antibody-Drug Conjugates. Anal. Chem. 2017, 89, 11236–11242. [Google Scholar] [CrossRef]
- Bongers, J.; Cummings, J.J.; Ebert, M.B.; Federici, M.M.; Gledhill, L.; Gulati, D.; Hilliard, G.M.; Jones, B.H.; Lee, K.R.; Mozdzanowski, J.; et al. Validation of a peptide mapping method for a therapeutic monoclonal antibody: What could we possibly learn about a method we have run 100 times? J. Pharm. Biomed. Anal. 2000, 21, 1099–1128. [Google Scholar] [CrossRef]
- Krylova, S.M.; Okhonin, V.; Krylov, S.N. Transverse diffusion of laminar flow profiles—A generic method for mixing reactants in capillary microreactor. J. Sep. Sci. 2009, 32, 742–756. [Google Scholar] [CrossRef]
- Ladner, Y.; Mas, S.; Coussot, G.; Montels, J.; Perrin, C. In-line tryptic digestion of therapeutic molecules by capillary electrophoresis with temperature control. Talanta 2019, 193, 146–151. [Google Scholar] [CrossRef]
- Zhang, L.; Luo, S.; Zhang, B. Glycan analysis of therapeutic glycoproteins. MAbs 2016, 8, 205–215. [Google Scholar] [CrossRef] [PubMed] [Green Version]
- Mittermayr, S.; Bones, J.; Guttman, A. Unraveling the glyco-puzzle: Glycan structure identification by capillary electrophoresis. Anal. Chem. 2013, 85, 4228–4238. [Google Scholar] [CrossRef] [PubMed] [Green Version]
- Wang, Y.; Santos, M.; Guttman, A. Comparative core fucosylation analysis of some major therapeutic antibody N-glycans by direct infusion ESI-MS and CE-LIF detection. J. Sep. Sci. 2013, 36, 2862–2867. [Google Scholar] [CrossRef] [PubMed]
- Maeda, E.; Kita, S.; Kinoshita, M.; Urakami, K.; Hayakawa, T.; Kakehi, K. Analysis of nonhuman N-glycans as the minor constituents in recombinant monoclonal antibody pharmaceuticals. Anal. Chem. 2012, 84, 2373–2379. [Google Scholar] [CrossRef]
- Bunz, S.C.; Cutillo, F.; Neusüß, C. Analysis of native and APTS-labeled N-glycans by capillary electrophoresis/time-of-flight mass spectrometry. Anal. Bioanal. Chem. 2013, 405, 8277–8284. [Google Scholar] [CrossRef] [PubMed]
- Bunz, S.-C.; Rapp, E.; Neusüss, C. Capillary Electrophoresis/Mass Spectrometry of APTS-Labeled Glycans for the Identification of Unknown Glycan Species in Capillary Electrophoresis/Laser-Induced Fluorescence Systems. Anal. Chem. 2013, 85, 10218–10224. [Google Scholar] [CrossRef] [PubMed]
- Feng, H.; Su, M.; Rifai, F.N.; Li, P.; Li, S.F.Y. Parallel analysis and orthogonal identification of N-glycans with different capillary electrophoresis mechanisms. Anal. Chim. Acta 2017, 953, 79–86. [Google Scholar] [CrossRef] [PubMed]
- Szabo, Z.; Guttman, A.; Bones, J.; Karger, B.L. Rapid high-resolution characterization of functionally important monoclonal antibody N -glycans by capillary electrophoresis. Anal. Chem. 2011, 83, 5329–5336. [Google Scholar] [CrossRef] [Green Version]
- Khan, S.; Liu, J.; Szabo, Z.; Kunnummal, B.; Han, X.; Ouyang, Y.; Linhardt, R.J.; Xia, Q. On-line capillary electrophoresis/laser-induced fluorescence/mass spectrometry analysis of glycans labeled with TealTM fluorescent dye using an electrokinetic sheath liquid pump-based nanospray ion source. Rapid Commun. Mass Spectrom. 2018, 32, 882–888. [Google Scholar] [CrossRef]
- Váradi, C.; Mittermayr, S.; Millán-Martín, S.; Bones, J. Quantitative twoplex glycan analysis using 12C6 and 13C6 stable isotope 2-aminobenzoic acid labelling and capillary electrophoresis mass spectrometry. Anal. Bioanal. Chem. 2016, 408, 8691–8700. [Google Scholar] [CrossRef]
- Váradi, C.; Jakes, C.; Bones, J. Analysis of Cetuximab N-Glycosylation using Multiple Fractionation Methods and Capillary Electrophoresis Mass Spectrometry. J. Pharm. Biomed. Anal. 2019, 182, 113035. [Google Scholar] [CrossRef] [PubMed]
- Luo, R.; Archer-Hartmann, S.A.; Holland, L.A. Transformable capillary electrophoresis for oligosaccharide separations using phospholipid additives. Anal. Chem. 2010, 82, 1228–1233. [Google Scholar] [CrossRef]
- Archer-Hartmann, S.A.; Crihfield, C.L.; Holland, L.A. Online enzymatic sequencing of glycans from Trastuzumab by phospholipid-assisted capillary electrophoresis. Electrophoresis 2011, 32, 3491–3498. [Google Scholar] [CrossRef] [PubMed]
- Jooß, K.; Meckelmann, S.W.; Klein, J.; Schmitz, O.J.; Neusüß, C. Capillary zone electrophoresis coupled to drift tube ion mobility-mass spectrometry for the analysis of native and APTS-labeled N-glycans. Anal. Bioanal. Chem. 2019, 411, 6255–6264. [Google Scholar] [CrossRef] [PubMed]
- Zhang, Z.; Albanetti, T.; Linkous, T.; Larkin, C.J.; Schoner, R.; McGivney, J.B.; Dovichi, N.J. Comprehensive analysis of host cell impurities in monoclonal antibodies with improved sensitivity by capillary zone electrophoresis mass spectrometry. Electrophoresis 2017, 38, 401–407. [Google Scholar] [CrossRef] [PubMed]
- Zhu, G.; Sun, L.; Linkous, T.; Kernaghan, D.; Mcgivney, J.B.; Dovichi, N.J. Absolute quantitation of host cell proteins in recombinant human monoclonal antibodies with an automated CZE-ESI-MS/MS system. Electrophoresis 2014, 35, 1448–1452. [Google Scholar] [CrossRef] [PubMed]
- Zhu, G.; Sun, L.; Heidbrink-Thompson, J.; Kuntumalla, S.; Lin, H.Y.; Larkin, C.J.; Mcgivney, J.B.; Dovichi, N.J. Capillary zone electrophoresis tandem mass spectrometry detects low concentration host cell impurities in monoclonal antibodies. Electrophoresis 2016, 37, 616–622. [Google Scholar] [CrossRef] [Green Version]
- Zhong, X.; Chen, Z.; Snovida, S.; Liu, Y.; Rogers, J.C.; Li, L. Capillary Electrophoresis-Electrospray Ionization-Mass Spectrometry for Quantitative Analysis of Glycans Labeled with Multiplex Carbonyl-Reactive Tandem Mass Tags. Anal. Chem. 2015, 87, 6527–6534. [Google Scholar] [CrossRef]
- Huhn, C.; Ruhaak, L.R.; Mannhardt, J.; Wuhrer, M.; Neusüß, C.; Deelder, A.M.; Meyer, H. Alignment of laser-induced fluorescence and mass spectrometric detection traces using electrophoretic mobility scaling in CE-LIF-MS of labeled N-glycans. Electrophoresis 2012, 33, 563–566. [Google Scholar] [CrossRef]
- Szekrényes, Á.; Park, S.A.S.; Santos, M.; Lew, C.; Jones, A.; Haxo, T.; Kimzey, M.; Pourkaveh, S.; Szabó, Z.; Sosic, Z.; et al. Multi-site N-glycan mapping study 1: Capillary electrophoresis—Laser induced fluorescence. MAbs 2016, 8, 56–64. [Google Scholar] [CrossRef] [Green Version]
- Rustandi, R.R.; Washabaugh, M.W.; Wang, Y. Applications of CE SDS gel in development of biopharmaceutical antibody-based products. Electrophoresis 2008, 29, 3612–3620. [Google Scholar] [CrossRef] [PubMed]
- Kotia, R.B.; Raghani, A.R. Analysis of monoclonal antibody product heterogeneity resulting from alternate cleavage sites of signal peptide. Anal. Biochem. 2010, 399, 190–195. [Google Scholar] [CrossRef] [PubMed]
- Lacher, N.A.; Roberts, R.K.; He, Y.; Cargill, H.; Kearns, K.M.; Holovics, H.; Ruesch, M.N. Development, validation, and implementation of capillary gel electrophoresis as a replacement for SDS-PAGE for purity analysis of IgG2 mAbs. J. Sep. Sci. 2010, 33, 218–227. [Google Scholar] [CrossRef] [PubMed]
- Zhang, J.; Burman, S.; Gunturi, S.; Foley, J.P. Method development and validation of capillary sodium dodecyl sulfate gel electrophoresis for the characterization of a monoclonal antibody. J. Pharm. Biomed. Anal. 2010, 53, 1236–1243. [Google Scholar] [CrossRef]
- Sänger van de Griend, C.E. CE-SDS method development, validation, and best practice—An overview. Electrophoresis 2019, 40, 2361–2374. [Google Scholar] [CrossRef]
- Beckman, J.; Song, Y.; Gu, Y.; Voronov, S.; Chennamsetty, N.; Krystek, S.; Mussa, N.; Li, Z.J. Purity Determination by Capillary Electrophoresis Sodium Hexadecyl Sulfate (CE-SHS): A Novel Application for Therapeutic Protein Characterization. Anal. Chem. 2018, 90, 2542–2547. [Google Scholar] [CrossRef]
- Turner, A.; Yandrofski, K.; Telikepalli, S.; King, J.; Heckert, A.; Filliben, J.; Ripple, D.; Schiel, J.E. Development of orthogonal NISTmAb size heterogeneity control methods. Anal. Bioanal. Chem. 2018, 410, 2095–2110. [Google Scholar] [CrossRef] [Green Version]
- Yang, B.; Li, W.; Zhao, H.; Wang, A.; Lei, Y.; Xie, Q.; Xiong, S. Discovery and characterization of CHO host cell protease-induced fragmentation of a recombinant monoclonal antibody during production process development. J. Chromatogr. B 2019, 1112, 1–10. [Google Scholar] [CrossRef]
- Hutterer, K.M.; Hong, R.W.; Lull, J.; Zhao, X.; Wang, T.; Pei, R.; Le, M.E.; Borisov, O.; Piper, R.; Liu, Y.D.; et al. Monoclonal antibody disulfide reduction during manufacturing. MAbs 2013, 5, 608–613. [Google Scholar] [CrossRef] [Green Version]
- Wang, T.; Liu, Y.D.; Cai, B.; Huang, G.; Flynn, G.C. Investigation of antibody disulfide reduction and re-oxidation and impact to biological activities. J. Pharm. Biomed. Anal. 2015, 102, 519–528. [Google Scholar] [CrossRef]
- Guo, A.; Han, M.; Martinez, T.; Ketchem, R.R.; Novick, S.; Jochheim, C.; Balland, A. Electrophoretic evidence for the presence of structural isoforms specific for the IgG2 isotype. Electrophoresis 2008, 29, 2550–2556. [Google Scholar] [CrossRef] [PubMed]
- Shi, Y.; Li, Z.; Lin, J. Advantages of CE-SDS over SDS-PAGE in mAb purity analysis. Anal. Methods 2012, 4, 1637–1642. [Google Scholar] [CrossRef]
- Szekrényes, Á.; Roth, U.; Kerékgyártó, M.; Székely, A.; Kurucz, I.; Kowalewski, K.; Guttman, A. High-throughput analysis of therapeutic and diagnostic monoclonal antibodies by multicapillary SDS gel electrophoresis in conjunction with covalent fluorescent labeling. Anal. Bioanal. Chem. 2012, 404, 1485–1494. [Google Scholar] [CrossRef] [PubMed]
- Smith, M.T.; Zhang, S.; Adams, T.; DiPaolo, B.; Dally, J. Establishment and validation of a microfluidic capillary gel electrophoresis platform method for purity analysis of therapeutic monoclonal antibodies. Electrophoresis 2017, 38, 1353–1365. [Google Scholar] [CrossRef] [PubMed]
- Zhu, Z.; Lu, J.J.; Liu, S. Protein separation by capillary gel electrophoresis: A review. Anal. Chim. Acta 2012, 709, 21–31. [Google Scholar] [CrossRef] [Green Version]
- Römer, J.; Montealegre, C.; Schlecht, J.; Kiessig, S.; Moritz, B.; Neusüß, C. Online mass spectrometry of CE (SDS)-separated proteins by two-dimensional capillary electrophoresis. Anal. Bioanal. Chem. 2019, 411, 7197–7206. [Google Scholar] [CrossRef]
- Wang, W.H.; Cheung-Lau, J.; Chen, Y.; Lewis, M.; Tang, Q.M. Specific and high-resolution identification of monoclonal antibody fragments detected by capillary electrophoresis–sodium dodecyl sulfate using reversed-phase HPLC with top-down mass spectrometry analysis. MAbs 2019, 11, 1233–1244. [Google Scholar] [CrossRef]
- Sánchez-Hernández, L.; Montealegre, C.; Kiessig, S.; Moritz, B.; Neusüß, C. In-capillary approach to eliminate SDS interferences in antibody analysis by capillary electrophoresis coupled to mass spectrometry. Electrophoresis 2017, 38, 1044–1052. [Google Scholar] [CrossRef]
- Borza, B.; Szigeti, M.; Szekrenyes, A.; Hajba, L.; Guttman, A. Glycosimilarity assessment of biotherapeutics 1: Quantitative comparison of the N-glycosylation of the innovator and a biosimilar version of etanercept. J. Pharm. Biomed. Anal. 2018, 153, 182–185. [Google Scholar] [CrossRef] [Green Version]
- Reusch, D.; Haberger, M.; Maier, B.; Maier, M.; Kloseck, R.; Zimmermann, B.; Hook, M.; Szabo, Z.; Tep, S.; Wegstein, J.; et al. Comparison of methods for the analysis of therapeutic immunoglobulin G Fc-glycosylation profiles—Part 1: Separation-based methods. MAbs 2015, 7, 167–179. [Google Scholar] [CrossRef] [Green Version]
- Jarvas, G.; Szigeti, M.; Guttman, A. Structural identification of N-linked carbohydrates using the GUcal application: A tutorial. J. Proteomics 2018, 171, 107–115. [Google Scholar] [CrossRef] [PubMed]
- Filep, C.; Borza, B.; Jarvas, G.; Guttman, A. N-glycosylation analysis of biopharmaceuticals by multicapillary gel electrophoresis: Generation and application of a new glucose unit database. J. Pharm. Biomed. Anal. 2020, 178, 112892. [Google Scholar] [CrossRef] [PubMed]
- Behne, A.; Muth, T.; Borowiak, M.; Reichl, U.; Rapp, E. glyXalign: High-throughput migration time alignment preprocessing of electrophoretic data retrieved via multiplexed capillary gel electrophoresis with laser-induced fluorescence detection-based glycoprofiling. Electrophoresis 2013, 34, 2311–2315. [Google Scholar] [CrossRef] [PubMed] [Green Version]
- Wagner, E.; Colas, O.; Chenu, S.; Goyon, A.; Murisier, A.; Cianferani, S.; François, Y.; Fekete, S.; Guillarme, D.; D’Atri, V.; et al. Determination of size variants by CE-SDS for approved therapeutic antibodies: Key implications of subclasses and light chain specificities. J. Pharm. Biomed. Anal. 2020, 184, 113166. [Google Scholar] [CrossRef] [PubMed]
- Wu, G.; Yu, C.; Wang, W.; Wang, L. Interlaboratory method validation of icIEF methodology for analysis of monoclonal antibodies. Electrophoresis 2018, 39, 2091–2098. [Google Scholar] [CrossRef] [PubMed]
- Duhamel, L.; Gu, Y.; Barnett, G.; Tao, Y.; Voronov, S.; Ding, J.; Mussa, N.; Li, Z.J. Therapeutic protein purity and fragmented species characterization by capillary electrophoresis sodium dodecyl sulfate using systematic hybrid cleavage and forced degradation. Anal. Bioanal. Chem. 2019, 411, 5617–5629. [Google Scholar] [CrossRef]
- Kerékgyártó, M.; Guttman, A. Toward the generation of an aminonaphthalene trisulfonate labeled N -glycan database for capillary gel electrophoresis analysis of carbohydrates. Electrophoresis 2014, 35, 2222–2228. [Google Scholar] [CrossRef]
- Goyon, A.; Excoffier, M.; Janin-Bussat, M.-C.; Bobaly, B.; Fekete, S.; Guillarme, D.; Beck, A. Determination of isoelectric points and relative charge variants of 23 therapeutic monoclonal antibodies. J. Chromatogr. B. 2017, 1065–1066, 119–128. [Google Scholar] [CrossRef]
- Michels, D.A.; Salas-Solano, O.; Felten, C. Imaged Capillary Isoelectric Focusing for Charge-Variant Analysis of Biopharmaceuticals. BioProcess Int. 2011, 9, 48–54. [Google Scholar]
- Zhu, G.; Sun, L.; Wojcik, R.; Kernaghan, D.; McGivney, J.B.; Dovichi, N.J. A rapid cIEF–ESI–MS/MS method for host cell protein analysis of a recombinant human monoclonal antibody. Talanta 2012, 98, 253–256. [Google Scholar] [CrossRef]
- Shimura, K. Capillary Isoelectric Focusing. In Capillary Electromigration Separation Methods; Elsevier: Amsterdam, The Netherlands, 2018; pp. 167–187. [Google Scholar] [CrossRef]
- Hühner, J.; Neusüß, C. CIEF-CZE-MS applying a mechanical valve. Anal. Bioanal. Chem. 2016, 408, 4055–4061. [Google Scholar] [CrossRef] [PubMed]
- Wu, J.; Huang, T. Peak identification in capillary isoelectric focusing using the concept of relative peak position as determined by two isoelectric point markers. Electrophoresis 2006, 27, 3584–3590. [Google Scholar] [CrossRef] [PubMed]
- Suba, D.; Urbányi, Z.; Salgó, A. Capillary isoelectric focusing method development and validation for investigation of recombinant therapeutic monoclonal antibody. J. Pharm. Biomed. Anal. 2015, 114, 53–61. [Google Scholar] [CrossRef] [PubMed]
- Lin, J.; Tan, Q.; Wang, S. A high-resolution capillary isoelectric focusing method for the determination of therapeutic recombinant monoclonal antibody. J. Sep. Sci. 2011, 34, 1696–1702. [Google Scholar] [CrossRef]
- He, X.Z.; Que, A.H.; Mo, J.J. Analysis of charge heterogeneities in mAbs using imaged CE. Electrophoresis 2009, 30, 714–722. [Google Scholar] [CrossRef]
- Mokaddem, M.; d’Orlyé, F.; Varenne, A. Online Capillary IsoElectric Focusing-ElectroSpray Ionization Mass Spectrometry (CIEF-ESI MS) in Glycerol—Water Media for the Separation and Characterization of Hydrophilic and Hydrophobic Proteins; Humana Press: New York, NY, USA, 2016; pp. 57–66. [Google Scholar]
- Dai, J.; Lamp, J.; Xia, Q.; Zhang, Y. Capillary Isoelectric Focusing-Mass Spectrometry Method for the Separation and Online Characterization of Intact Monoclonal Antibody Charge Variants. Anal. Chem. 2018, 90, 2246–2254. [Google Scholar] [CrossRef] [Green Version]
- Dai, J.; Zhang, Y. A Middle-Up Approach with Online Capillary Isoelectric Focusing/Mass Spectrometry for In-Depth Characterization of Cetuximab Charge Heterogeneity. Anal. Chem. 2018, 90, 14527–14534. [Google Scholar] [CrossRef]
- Salas-Solano, O.; Babu, K.; Park, S.S.; Zhang, X.; Zhang, L.; Sosic, Z.; Boumajny, B.; Zeng, M.; Cheng, K.C.; Reed-Bogan, A.; et al. Intercompany study to evaluate the robustness of capillary isoelectric focusing technology for the analysis of monoclonal antibodies. Chromatographia 2011, 73, 1137–1144. [Google Scholar] [CrossRef]
- Vanam, R.P.; Schneider, M.A.; Marlow, M.S. Rapid quantitative analysis of monoclonal antibody heavy and light chain charge heterogeneity. MAbs 2015, 7, 1118–1127. [Google Scholar] [CrossRef] [Green Version]
- An, Y.; Zhang, Y.; Mueller, H.-M.; Shameem, M.; Chen, X. A new tool for monoclonal antibody analysis. MAbs 2014, 6, 879–893. [Google Scholar] [CrossRef]
- Zhang, Z.; Perrault, R.; Zhao, Y.; Ding, J. SpeB proteolysis with imaged capillary isoelectric focusing for the characterization of domain-specific charge heterogeneities of reference and biosimilar Rituximab. J. Chromatogr. B 2016, 1020, 148–157. [Google Scholar] [CrossRef] [PubMed] [Green Version]
- Štěpánová, S.; Kašička, V. Application of Capillary Electromigration Methods for Physicochemical Measurements. In Capillary Electromigration Separation Methods; Elsevier: Amsterdam, The Netherlands, 2018; pp. 547–591. [Google Scholar] [CrossRef]
- Turner, A.; Schiel, J.E. Qualification of NISTmAb charge heterogeneity control assays. Anal. Bioanal. Chem. 2018, 410, 2079–2093. [Google Scholar] [CrossRef] [PubMed] [Green Version]
- Zhang, X.; Chemmalil, L.; Ding, J.; Mussa, N.; Li, Z. Imaged capillary isoelectric focusing in native condition: A novel and successful example. Anal. Biochem. 2017, 537, 13–19. [Google Scholar] [CrossRef] [PubMed]
- King, C.; Patel, R.; Ponniah, G.; Nowak, C.; Neill, A.; Gu, Z.; Liu, H. Characterization of recombinant monoclonal antibody variants detected by hydrophobic interaction chromatography and imaged capillary isoelectric focusing electrophoresis. J. Chromatogr. B 2018, 1085, 96–103. [Google Scholar] [CrossRef]
- Zhang, X.; Voronov, S.; Mussa, N.; Li, Z. A novel reagent significantly improved assay robustness in imaged capillary isoelectric focusing. Anal. Biochem. 2017, 521, 1–7. [Google Scholar] [CrossRef] [PubMed]
- Cao, J.; Sun, W.; Gong, F.; Liu, W. Charge profiling and stability testing of biosimilar by capillary isoelectric focusing. Electrophoresis 2014, 35, 1461–1468. [Google Scholar] [CrossRef]
- Demirdirek, B.; Lan, W.; Qiu, D.; Ding, W.; Iyer, L.K.; Bolgar, M.S.; Valente, J.J. Comparison of imaged capillary isoelectric focusing and cation exchange chromatography for monitoring dextrose-mediated glycation of monoclonal antibodies in infusion solutions. J. Chromatogr. B 2019, 1105, 156–163. [Google Scholar] [CrossRef]
- Maeda, E.; Urakami, K.; Shimura, K.; Kinoshita, M.; Kakehi, K. Charge heterogeneity of a therapeutic monoclonal antibody conjugated with a cytotoxic antitumor antibiotic, calicheamicin. J. Chromatogr. A 2010, 1217, 7164–7171. [Google Scholar] [CrossRef]
- Kahle, J.; Stein, M.; Wätzig, H. Design of experiments as a valuable tool for biopharmaceutical analysis with (imaged) capillary isoelectric focusing. Electrophoresis 2019, 40, 2382–2389. [Google Scholar] [CrossRef]
- Kinoshita, M.; Nakatsuji, Y.; Suzuki, S.; Hayakawa, T.; Kakehi, K. Quality assurance of monoclonal antibody pharmaceuticals based on their charge variants using microchip isoelectric focusing method. J. Chromatogr. A 2013, 1309, 76–83. [Google Scholar] [CrossRef]
- Mack, S.; Arnold, D.; Bogdan, G.; Bousse, L.; Danan, L.; Dolnik, V.; Ducusin, M.A.; Gwerder, E.; Herring, C.; Jensen, M.; et al. A novel microchip-based imaged CIEF-MS system for comprehensive characterization and identification of biopharmaceutical charge variants. Electrophoresis 2019, 40, 3084–3091. [Google Scholar] [CrossRef] [PubMed] [Green Version]
- Wang, L.; Chen, D.D.Y. Analysis of four therapeutic monoclonal antibodies by online capillary isoelectric focusing directly coupled to quadrupole time-of-flight mass spectrometry. Electrophoresis 2019, 40, 2899–2907. [Google Scholar] [CrossRef] [PubMed]
- Kats, M.; Richberg, P.C.; Hughes, D.E. pH-dependent isoform transitions of a monoclonal antibody monitored by micellar electrokinetic capillary chromatography. Anal. Chem. 1997, 69, 338–343. [Google Scholar] [CrossRef] [PubMed]
Figure 1.
Schematic structure of IgG1monoclonal antibody.

Figure 2.
The main sample preparations for monoclonal antibodies (mAbs) analyses.


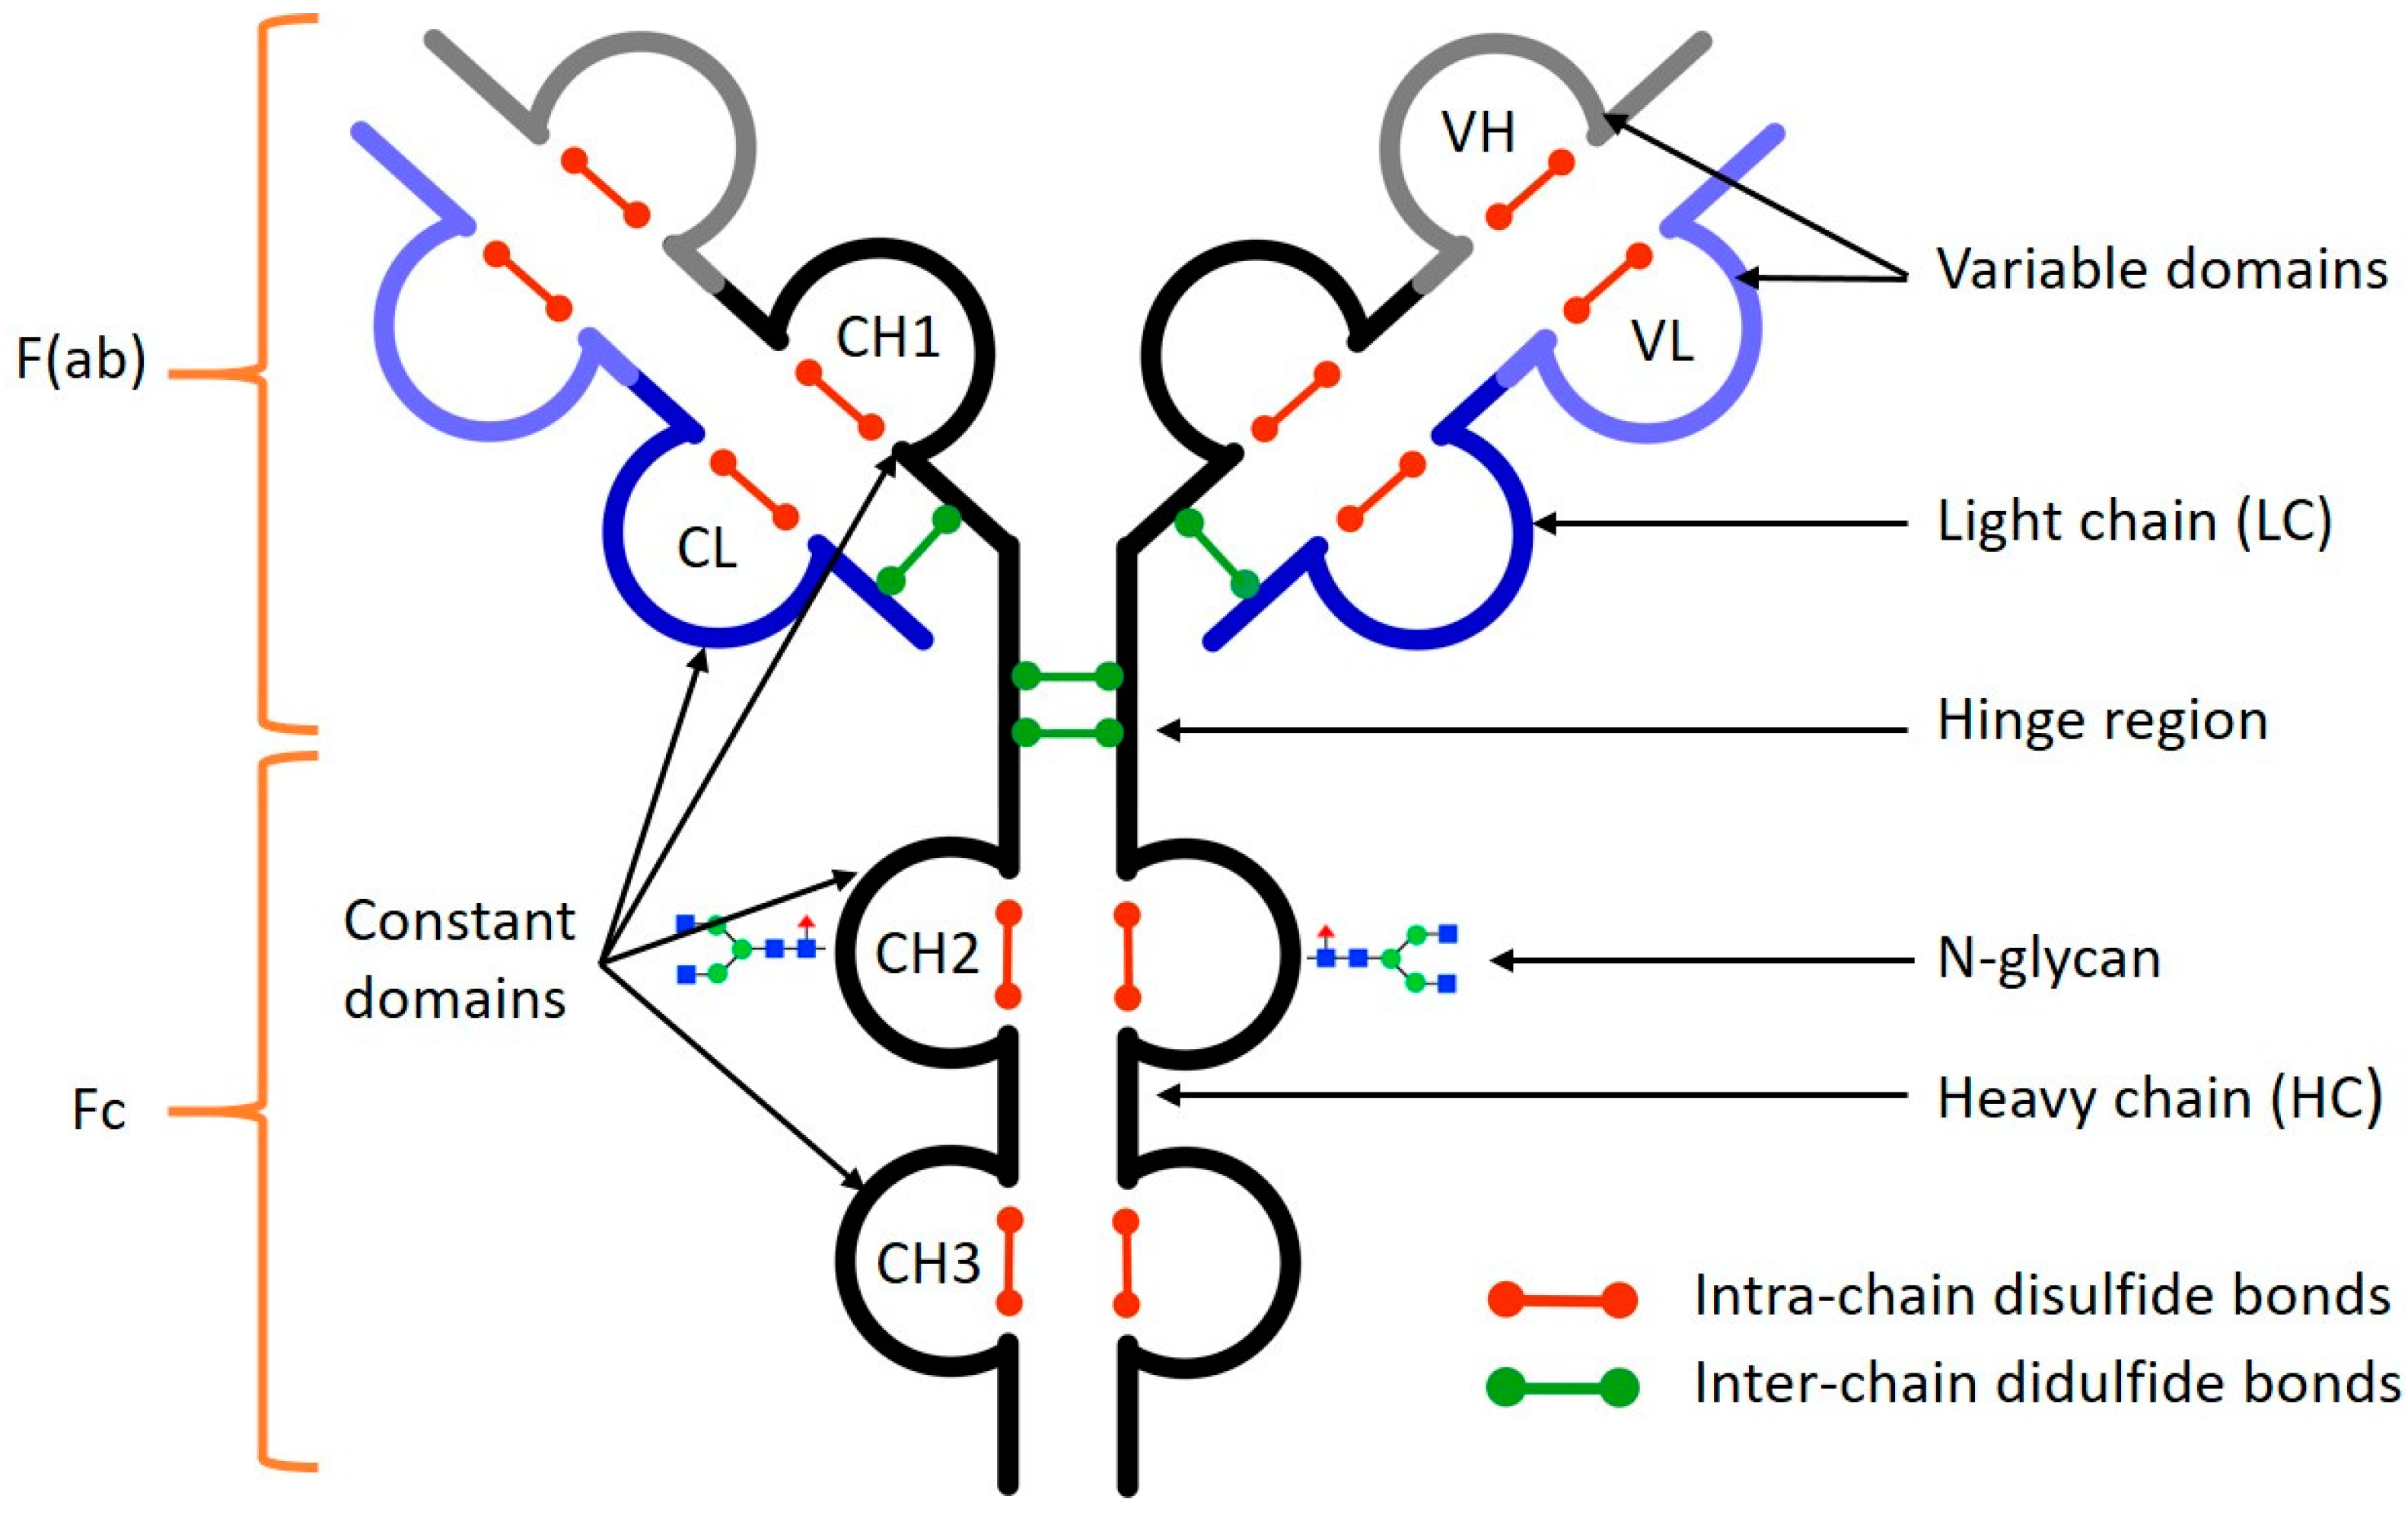
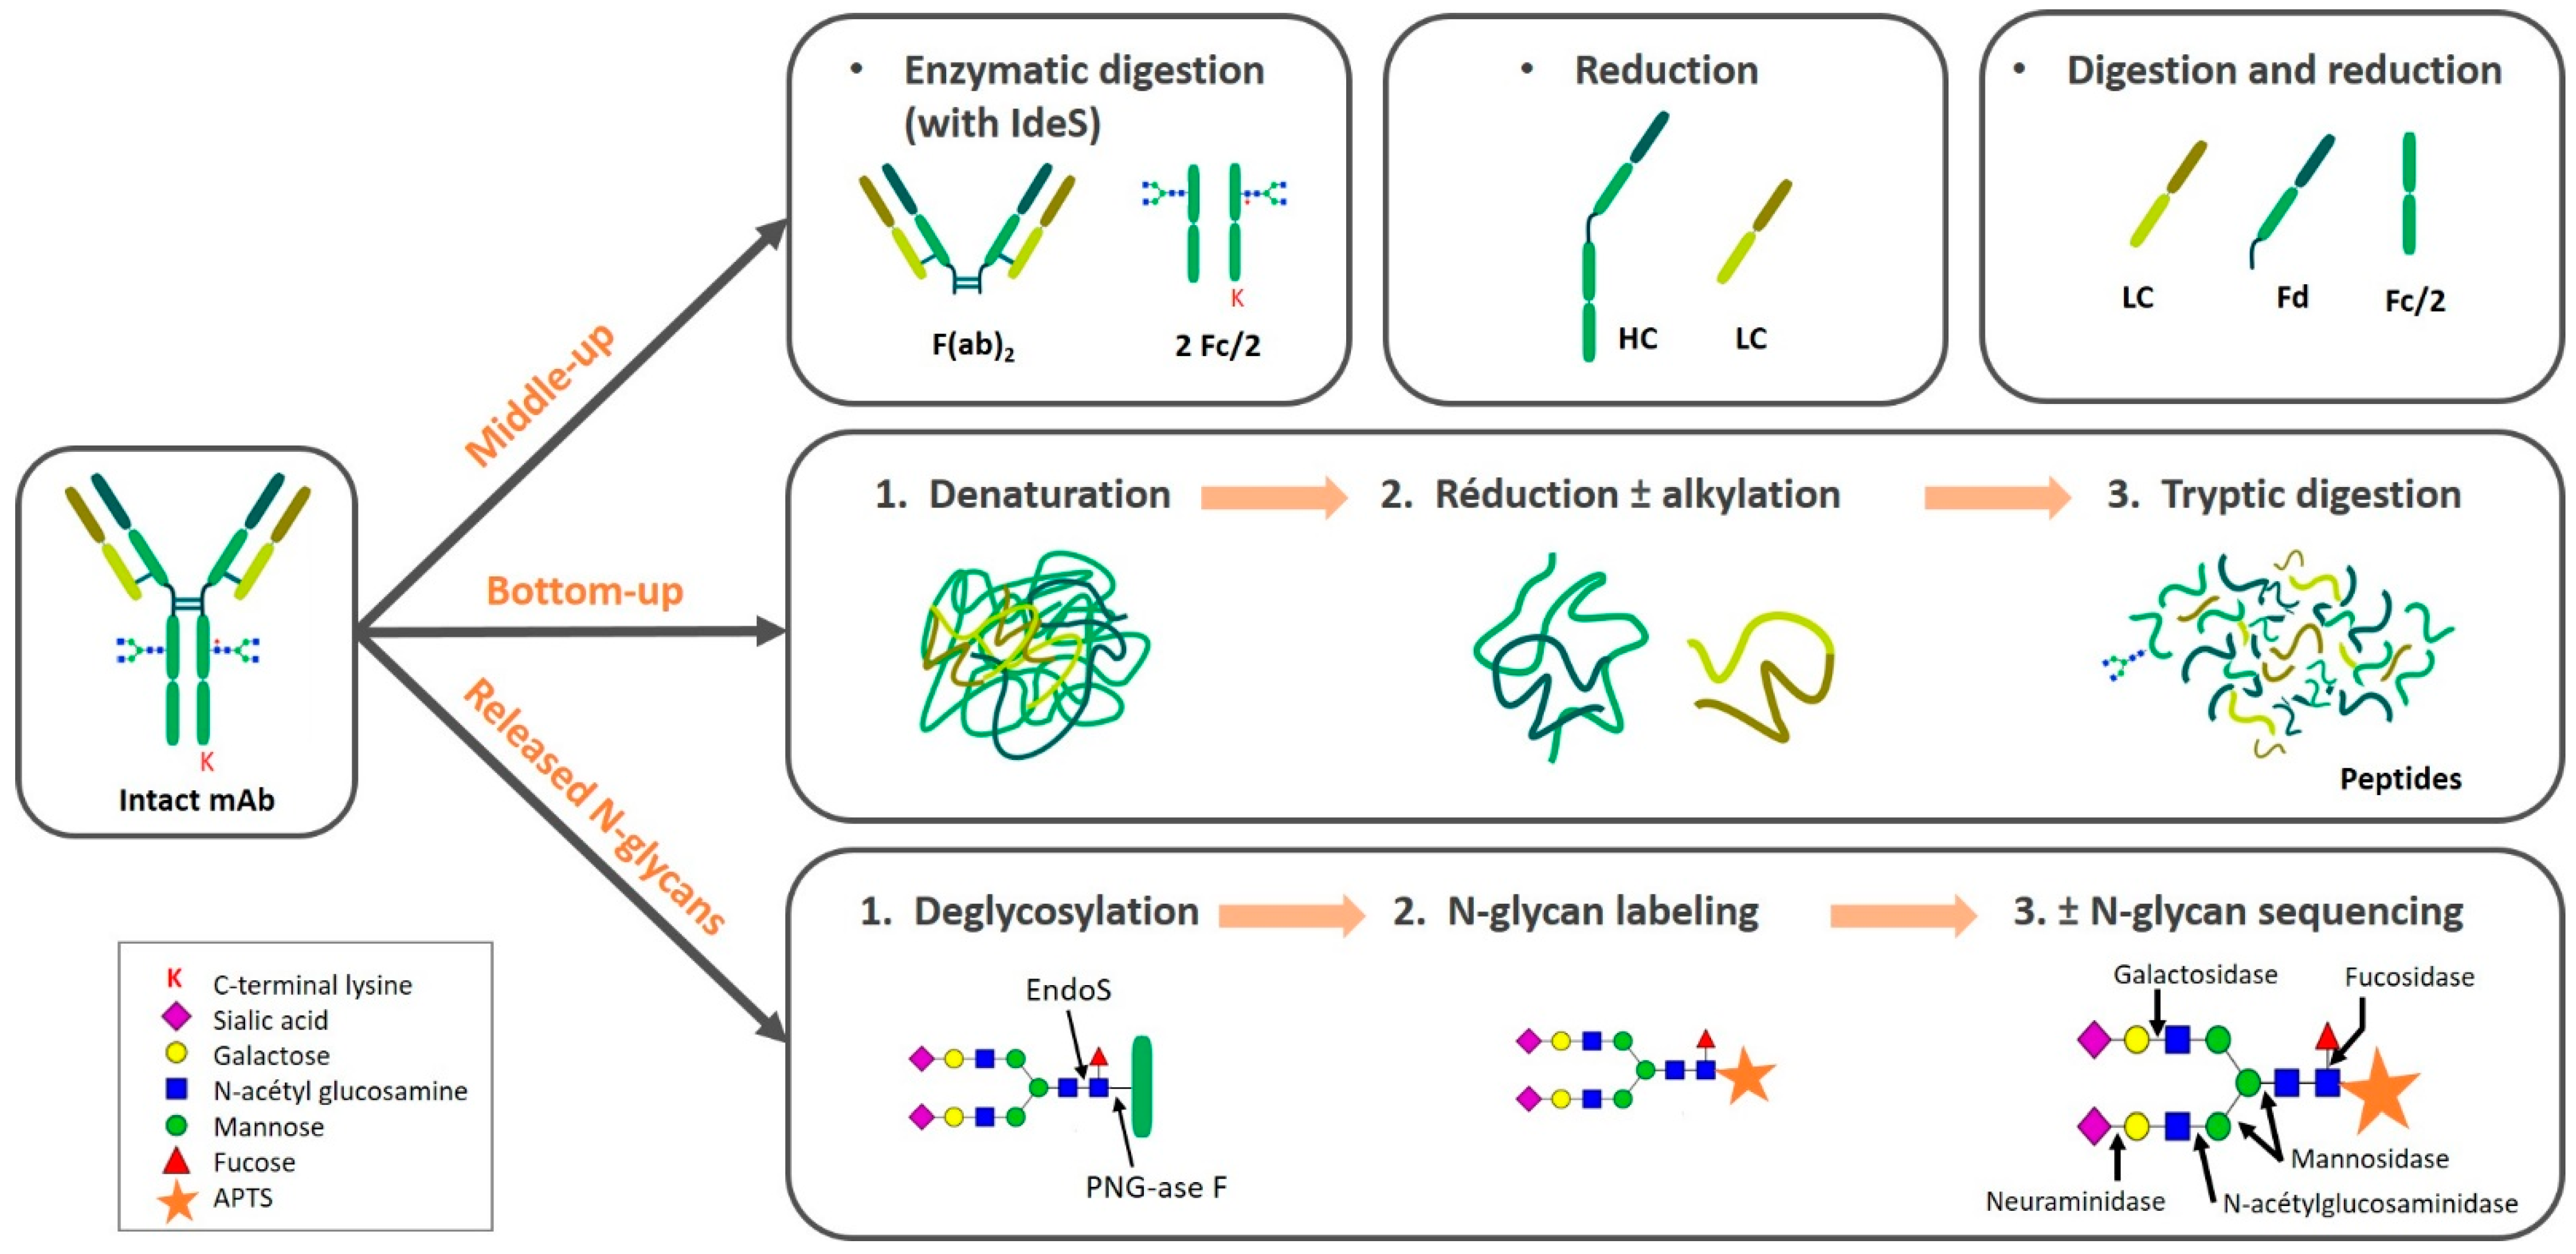
Table 1.
Summary of sample preparation and analysis conditions for capillary zone electrophoresis (CZE) analyses.
Table 1.
Summary of sample preparation and analysis conditions for capillary zone electrophoresis (CZE) analyses.
| CZE for mAbs Analyses | References | |
| Sample preparation | Monoclonal antibodies (mAb) prepared following the approaches (intact, middle-up, or bottom-up) as detailed in Section 2.2, desalted or non-desalted | |
| Sample buffer | Water, mixture acid-organic solvent, ammonium acetate, tris | [34,73,75,89,104] |
| Capillary coating | Uncoated (bottom-up analysis) | [34,114,116,122,123] |
| Neutral coated (e.g., HPMC, PEO, LPA) | [24,62,75,91,97,99] | |
| Positively charged (e.g., c-PEI, M7C4I) | [76,104,105] | |
| BGE |
| [89,91,96,97,98] |
| [34,75,93,94,100,104,105,109,111,123] | |
| Injection | Hydrodynamic | |
| UV detection | 214 nm | [73,89,91,94] |
| MS detection | Online ESI-MS (Sheath liquid or sheathless interface) | [34,102,104,108] |
| Off-line MALDI-MS | [24,98,99] | |
| CZE for Released Glycans Analyses | References | |
| Sample preparation | Release and labeling N-glycans (APTS or 2-AA) (Section 2.2.3.) | |
| Internal standard: glycan ladder (dextran), oligomers of glycans | ||
| Capillary | Uncoated capillary | [131,144] |
| Neutral coated capillary (polyvinyl alcohol (PVA)) | [132,133] | |
| BGE | 6-aminocaproic acid/ammonia (+additives) | [131] |
| Ammonium acetate, ammonium, acetic acid, formic acid | [121,133,136,144,145] | |
| Injection | Hydrodynamic | |
| LIF detection | APTS labeled N-glycans (excitation 488 nm, emission 520 nm) | [131,132,133,139] |
| 2-AA labeled N-glycans (excitation 325 nm, emission 405 nm) | [130,136,145] | |
| MS detection | Online ESI-MS (Sheath liquid or sheathless interface) | |
Table 2.
Summary of sample preparation and analyses conditions for capillary gel electrophoresis (CGE) analyses.
Table 2.
Summary of sample preparation and analyses conditions for capillary gel electrophoresis (CGE) analyses.
| CGE–SDS Analysis of mAbs | References | |
| Sample preparation | Intact mAb, deglycosylated mAb, reduced mAb, digested mAb (e.g., IdeS, IgGdE), desalted or non-desalted | |
| ± Fluorescent dye | [64] | |
| ± Internal standard | [164,171,172] | |
| Sample buffer |
| [150,151,158,164] |
| Capillary | Neutral coating (static or dynamic) | |
| Buffer containing a certain amount of SDS as a tris-borate buffer with 0.1% SDS pH 8.45 | [160] | |
| Sieving matrix | Buffer containing 100 mM Tris-HCl, pH 9.0, 1% SDS | [164] |
| Sieving matrix SDS–MW gel buffer (Beckman Coulter), BioRad buffer (BioRad Laboratories), SDS–MW gel buffer (Sciex) | [149] | |
| Injection | Electrokinetic | |
| UV detection | 220 or 280 nm | |
| LIF detection | 3-(2-furoyl)quinoline-2-carboxaldehyde (FQ) label (excitation 488 nm, emission 600 nm) | [118] |
| CGE Analysis of Released Glycans Analyses | References | |
| Sample preparation | Release and labeling N-glycans (with APTS or ANTS) (Section 2.2.4) | |
| Internal standard: glycan ladder (dextran), oligomers of glycans | [146] | |
| Capillary | Silica capillary or neutral coated capillary | [147] |
| Filled with gel, e.g., | ||
| [146] [166] [133] | |
| Prefilled devices, e.g., | ||
| [173] [169] | |
| Injection | Hydrodynamic or electrokinetic | |
| LIF detection | APTS labeled N-glycans (excitation 488 nm, emission 520 nm) | [160,166] |
| ANTS labeled N-glycans (excitation 420 nm, emission 530 nm) | [167] | |
Table 3.
Summary of sample preparation and analyses conditions for capillary isoelectric focusing (cIEF) analyses.
Table 3.
Summary of sample preparation and analyses conditions for capillary isoelectric focusing (cIEF) analyses.
| cIEF-UV and icIEF-UV Analysis of mAbs | References | |
| Sample preparation | Intact mAb, deglycosylated mAb, reduced mAb, digested mAb (e.g., IdeS, SpeB), desalted or non-desalted. | With stabilizer [181,182,184,188,195,199] Without stabilizer [171,182,184,189] |
| Sample buffer | contains the following components: cIEF gel based on cellulose derivative (0.1–0.4% m/v) ± urea (2–7 M) or formamide; Carrier ampholyte or pharmalytes at one range or different ranges of pI; Anolyte stabilizer (L-argininie) and catholyte stabilizer (iminodiacetic acid); pI markers mixture based on peptides or synthetic molecules; | |
| Capillary | Neutral coated capillaries filled with the sample matrix | |
| BGE | Anolyte: sodium hydroxide ± cellulose derivative Catholyte: phosphoric acid ± cellulose derivative | |
| Injection | Hydrodynamic | |
| UV detection | 280 nm | |
| cIEF-MS Analysis of mAbs | References | |
| Sample preparation | Intact mAb, deglycosylated mAb, reduced mAb, digested mAb (e.g., IdeS), desalted. | [184,185,201] |
| Sample buffer | contains the following components: Glycerol (5–20%); Carrier ampholyte or pharmalyte at one range or different ranges of pI; ± Anolyte stabilizer (L-arginine) and catholyte stabilizer (iminodiacetic acid); pI markers mixture based on peptides or synthetic molecules | |
| Capillary | Neutral coated capillaries filled with the sample matrix | |
| BGE | Anolyte: ammonium hydroxide + glycerol Catholyte: formic acid or acetic acid + glycerol | |
| Injection | Hydrodynamic | |
| MS detection | Online ESI-MS (Sheath liquid, flow-through microvial interface) | |
Publisher’s Note: MDPI stays neutral with regard to jurisdictional claims in published maps and institutional affiliations. |
© 2021 by the authors. Licensee MDPI, Basel, Switzerland. This article is an open access article distributed under the terms and conditions of the Creative Commons Attribution (CC BY) license (http://creativecommons.org/licenses/by/4.0/).
Share and Cite
MDPI and ACS Style
Dadouch, M.; Ladner, Y.; Perrin, C. Analysis of Monoclonal Antibodies by Capillary Electrophoresis: Sample Preparation, Separation, and Detection. Separations 2021, 8, 4. https://0-doi-org.brum.beds.ac.uk/10.3390/separations8010004
AMA Style
Dadouch M, Ladner Y, Perrin C. Analysis of Monoclonal Antibodies by Capillary Electrophoresis: Sample Preparation, Separation, and Detection. Separations. 2021; 8(1):4. https://0-doi-org.brum.beds.ac.uk/10.3390/separations8010004
Chicago/Turabian StyleDadouch, Meriem, Yoann Ladner, and Catherine Perrin. 2021. "Analysis of Monoclonal Antibodies by Capillary Electrophoresis: Sample Preparation, Separation, and Detection" Separations 8, no. 1: 4. https://0-doi-org.brum.beds.ac.uk/10.3390/separations8010004
Note that from the first issue of 2016, this journal uses article numbers instead of page numbers. See further details here.