Article

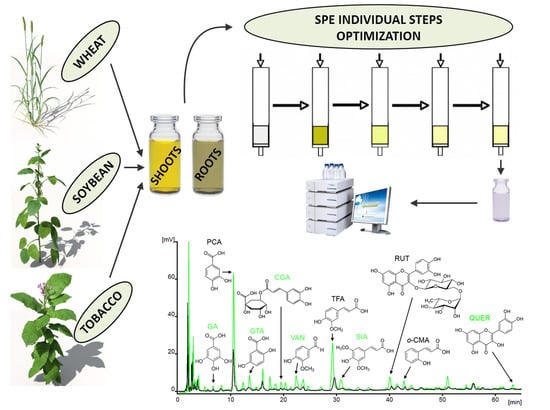
Optimization of Plant Extract Purification Procedure for Rapid Screening Analysis of Sixteen Phenolics by Liquid Chromatography

by
Petra Ranušová
1,*,
Ildikó Matušíková
1 and
Peter Nemeček
2
1
Department of Ecochemistry and Radioecology, Faculty of Natural Science, University of SS. Cyril and Methodius in Trnava, Nám. J. Herdu 2, 91701 Trnava, Slovakia
2
Department of Chemistry, Faculty of Natural Science, University of SS. Cyril and Methodius in Trnava, Nám. J. Herdu 2, 91701 Trnava, Slovakia
*
Author to whom correspondence should be addressed.
Submission received: 22 November 2020 / Revised: 8 January 2021 / Accepted: 19 January 2021 / Published: 25 January 2021

Abstract

:
A solid-phase extraction (SPE) procedure was developed for simultaneous monitoring of sixteen different phenolics of various polarity, quantified by high-performance liquid chromatography (HPLC). The procedure allowed screening the accumulation of intermediates in different metabolic pathways that play a crucial role in plant physiology and/or are beneficial for human health. Metabolites mostly involved in phenylpropanoid, shikimate, and polyketide pathways comprise chlorogenic acid, gentisic acid, vanillic acid, caffeic acid, protocatechuic acid, ferulic acid, rutin, quercetin, epicatechin, gallic acid, sinapic acid, p-coumaric acid, o-coumaric acid, vanillin; two rarely quantified metabolites, 2,5-dimethoxybenzoic acid and 4-methoxycinnamic acid, were included as well. The procedure offered low cost, good overall efficiency, and applicability in laboratories with standard laboratory equipment. SPE recoveries were up to 99.8% at various concentration levels. The method allowed for routine analysis of compounds with a wide range of polarity within a single run, while its applicability was demonstrated for various model plant species (tobacco, wheat, and soybean), as well as different tissue types (shoots and roots).

Graphical Abstract

1. Introduction

Polyphenolic compounds are ubiquitously distributed among higher plants, affecting the organoleptic and nutraceutical properties of fruits and vegetables but also the plant’s ability to cope with environmental constraints. In addition, many of these compounds enter the human body through the food chain and exert positive effects on human health; particular importance is given to metabolites with anti-inflammatory, antioxidative, or cancer-preventing properties [1]. There is an ever-increasing interest in developing and/or improving analytical methods for detection and quantification of different polyphenols in cereals [2], spices [3], vegetables [4], fruits [5], wine [6], tea [7], or coffee [8]. Several review articles are dedicated to not only extraction and analysis of different polyphenols in various plants but also to summarizing their versatile biological activities [9,10,11,12,13].
Phenolic compounds containing a benzene ring with one or more hydroxyl groups are synthetized in plants mainly through the phenylpropanoid, shikimate, and polyketide pathways of secondary metabolism. These metabolites have been identified as playing a role in the environmental stress responses of plants [14,15,16]. Their detection and quantification in plants represent a major challenge due to their low concentration levels and high-water content in tissues, a wide range of polarity, and metabolite complexity of green plant tissue. Furthermore, analyses are hampered by extractability and solubility (bound or free) of individual compounds and limited stability of the analytes. Routine analysis of phenolic compounds in plants requires a complex pre-processing of plant samples. The most commonly used analytical techniques for the determination of phenolic compounds are generally chromatographic methods, such as high-performance liquid chromatography (HPLC) [4,17,18,19]. HPLC (by high-performance liquid chromatography) is a routinely applied method, balancing the cost, efficiency, and robustness of the approach. The key task of sample pre-treatment and subsequent HPLC analysis is removal (or at least limiting) of matrix interferences and extracting the analytes in a solvent compatible with the separating mobile phase. A serious challenge for HPLC analysis of polyphenols is their low concentration in plant green material, necessitating pre-concentration of target analytes. Solid-phase extraction (SPE) is a widely used technique for selective isolation and pre-concentration of analytes and for matrix simplification of samples. Though many other reports on the use of SPE for sample clean-up prior to polyphenol analysis have been published, the analysis of polar phenolic compounds, in particular, still can be a problem because, with classical SPE, sorbents retention problems could occur. Unfortunately, optimization or validation of SPE is often not described in detail or omitted in papers, despite that this process can require complex, multifactorial, and time-consuming steps.
In this paper, we described a methodology for SPE-based complex analysis of sixteen phenolics with different polarity (logKow in the range of 0.7–8.9), stability, and concentration levels in plants. The specific goal of the paper was to identify appropriate solvents and validate the use of a chosen SPE sorbent to extract phenolics from plant material. The method was oriented towards a selected set of phenolic compounds, mostly phenolic acids. These included some more polar compounds, such as gallic acid, protocatechuic acid, or less polar rutin and quercetin, which represent metabolites with a demonstrated role in plant stress metabolism [14,16,20,21]. Furthermore, they included some key plant metabolites synthetized through the phenylpropanoid pathway, such as cinnamic acid, p-coumaric acid, caffeic acid, ferulic acid, vanillin, and sinapic acid, which are ancestors in the synthesis of lignins and other phenolics of high biotechnological, added-value food, and/or chemical-pharmaceutical potential [1]. Our selection also included metabolites, which are not so commonly described nor quantified in plants, such as 2,5-dimethoxybenzoic acid, with antifungal properties and a potential to control postharvest diseases [22] and 4-methoxycinnamic acid—an intermediate in the biosynthetic conversion of cinnamic acids to benzoic acids. These metabolites were found in plants, e.g., by [23] or [24].
The procedure presented here is robust for multiple sample types and various plant species. We described the whole optimization process in good detail, providing a useful resource for researchers to refer to when optimizing SPE.

2. Experimental

2.1. Chemicals

Standards of phenolic compounds (abbreviations used in the paper are given in brackets) were all of HPLC grade and included 2,5-dimethoxybenzoic acid (DMBA), 4-methoxycinnamic acid (4MCA), chlorogenic acid (CGA), gentisic acid sodium salt hydrate (GTA), vanillic acid (VA), caffeic acid (CA), protocatechuic acid (PCA), trans-ferulic acid (TFA), rutin (RUT), quercetin (QUER), and epicatechin (EPI) from Sigma-Aldrich (Hamburg, Germany); gallic acid (GA), sinapic acid (SIA), p-coumaric acid (p-CMA), and o-coumaric acid (o-CMA) from Fluka (Arlington, United Kingdom); vanillin (VAN) from Merck (Darmstadt, Germany). Mobile phases or extracts were prepared using ultrapure water (Simplicity® UV Water Purification System, Merck; Darmstadt, Germany), methanol (HPLC gradient grade; CentralChem; Bratislava, Slovakia), acetonitrile (HPLC gradient grade; CentralChem; Bratislava, Slovakia), and formic acid (98% p.a.; mikroCHEM; Pezinok, Slovakia).

2.2. Preparation of Standard Solutions, Calibration Standards, and Model Mixtures

For SPE validation purposes, standard solutions of sixteen analytes were prepared in different concentrations (25, 50, 75, and 150 μg/mL) with respect to the SPE column capacity, as well as the values previously identified in different plant species [25]. Analytes were also prepared in different solvents (according to the tested sample loading solvents and elution solvents), considering individual steps of the SPE procedure for measurements of calibration curves and estimating yields and losses of analytes in individual steps at the quantitative level. Prepared solutions were stored in a freezer at −4 °C.

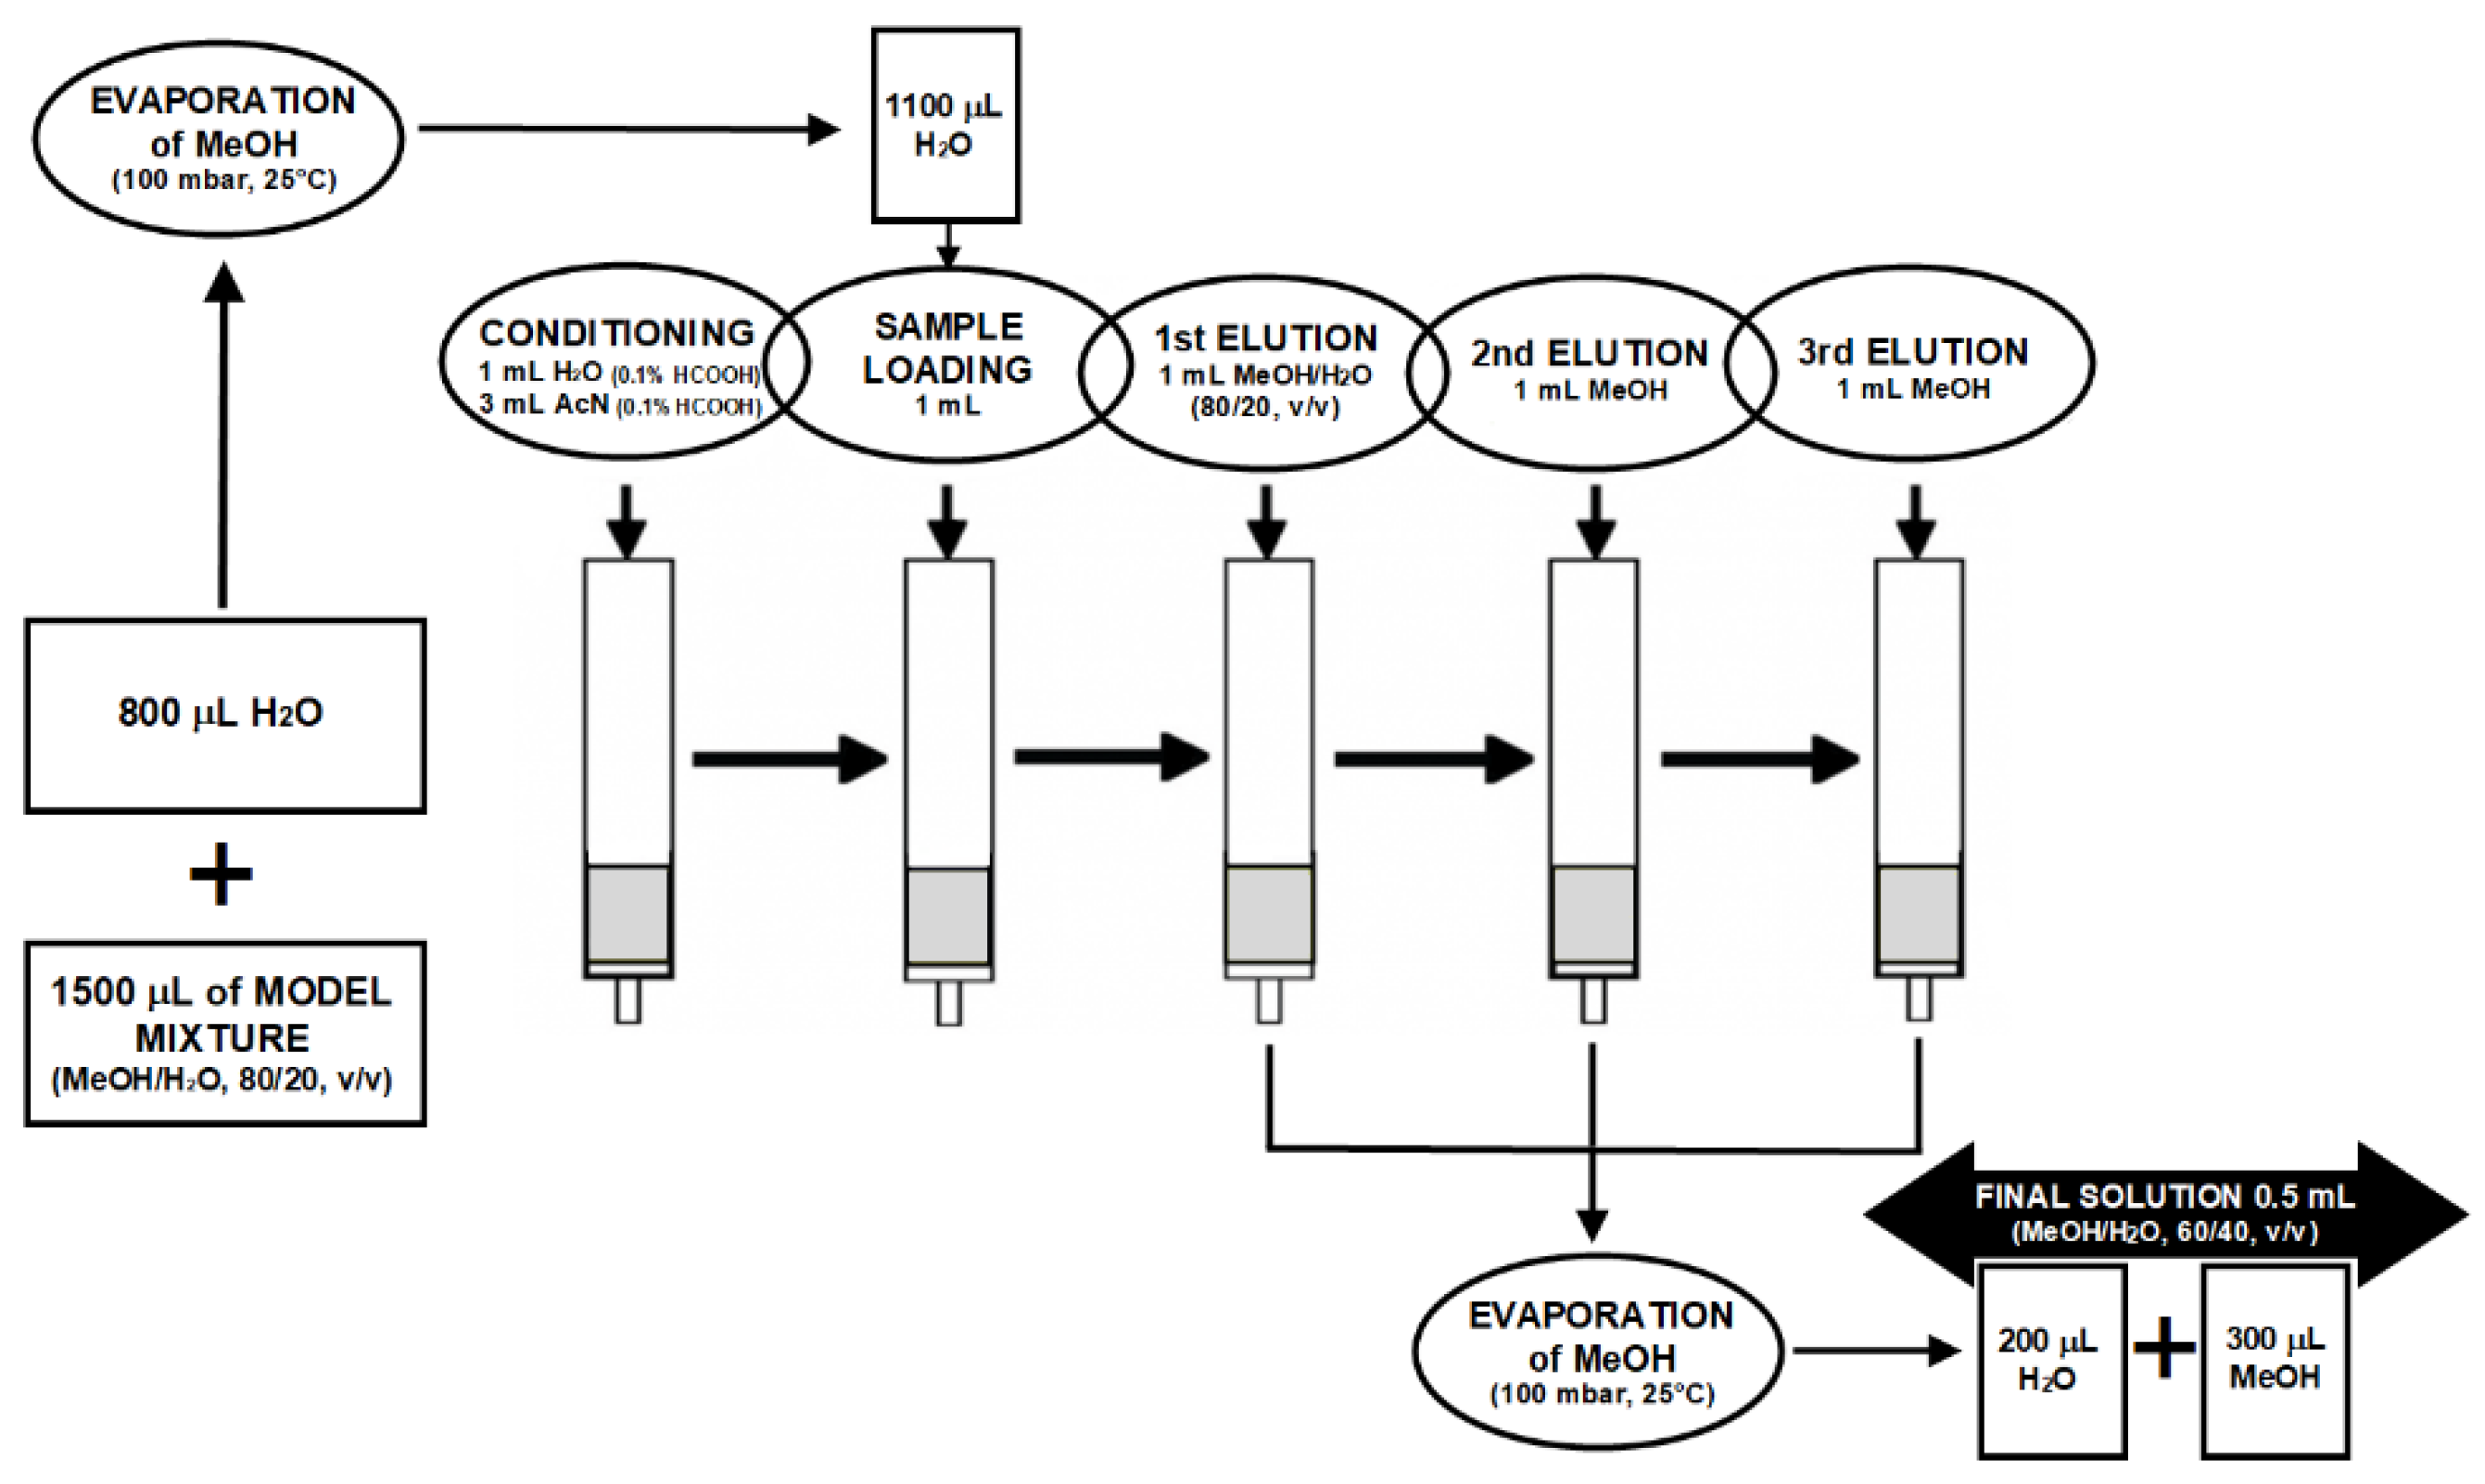
2.3. Preparation of SPE Columns
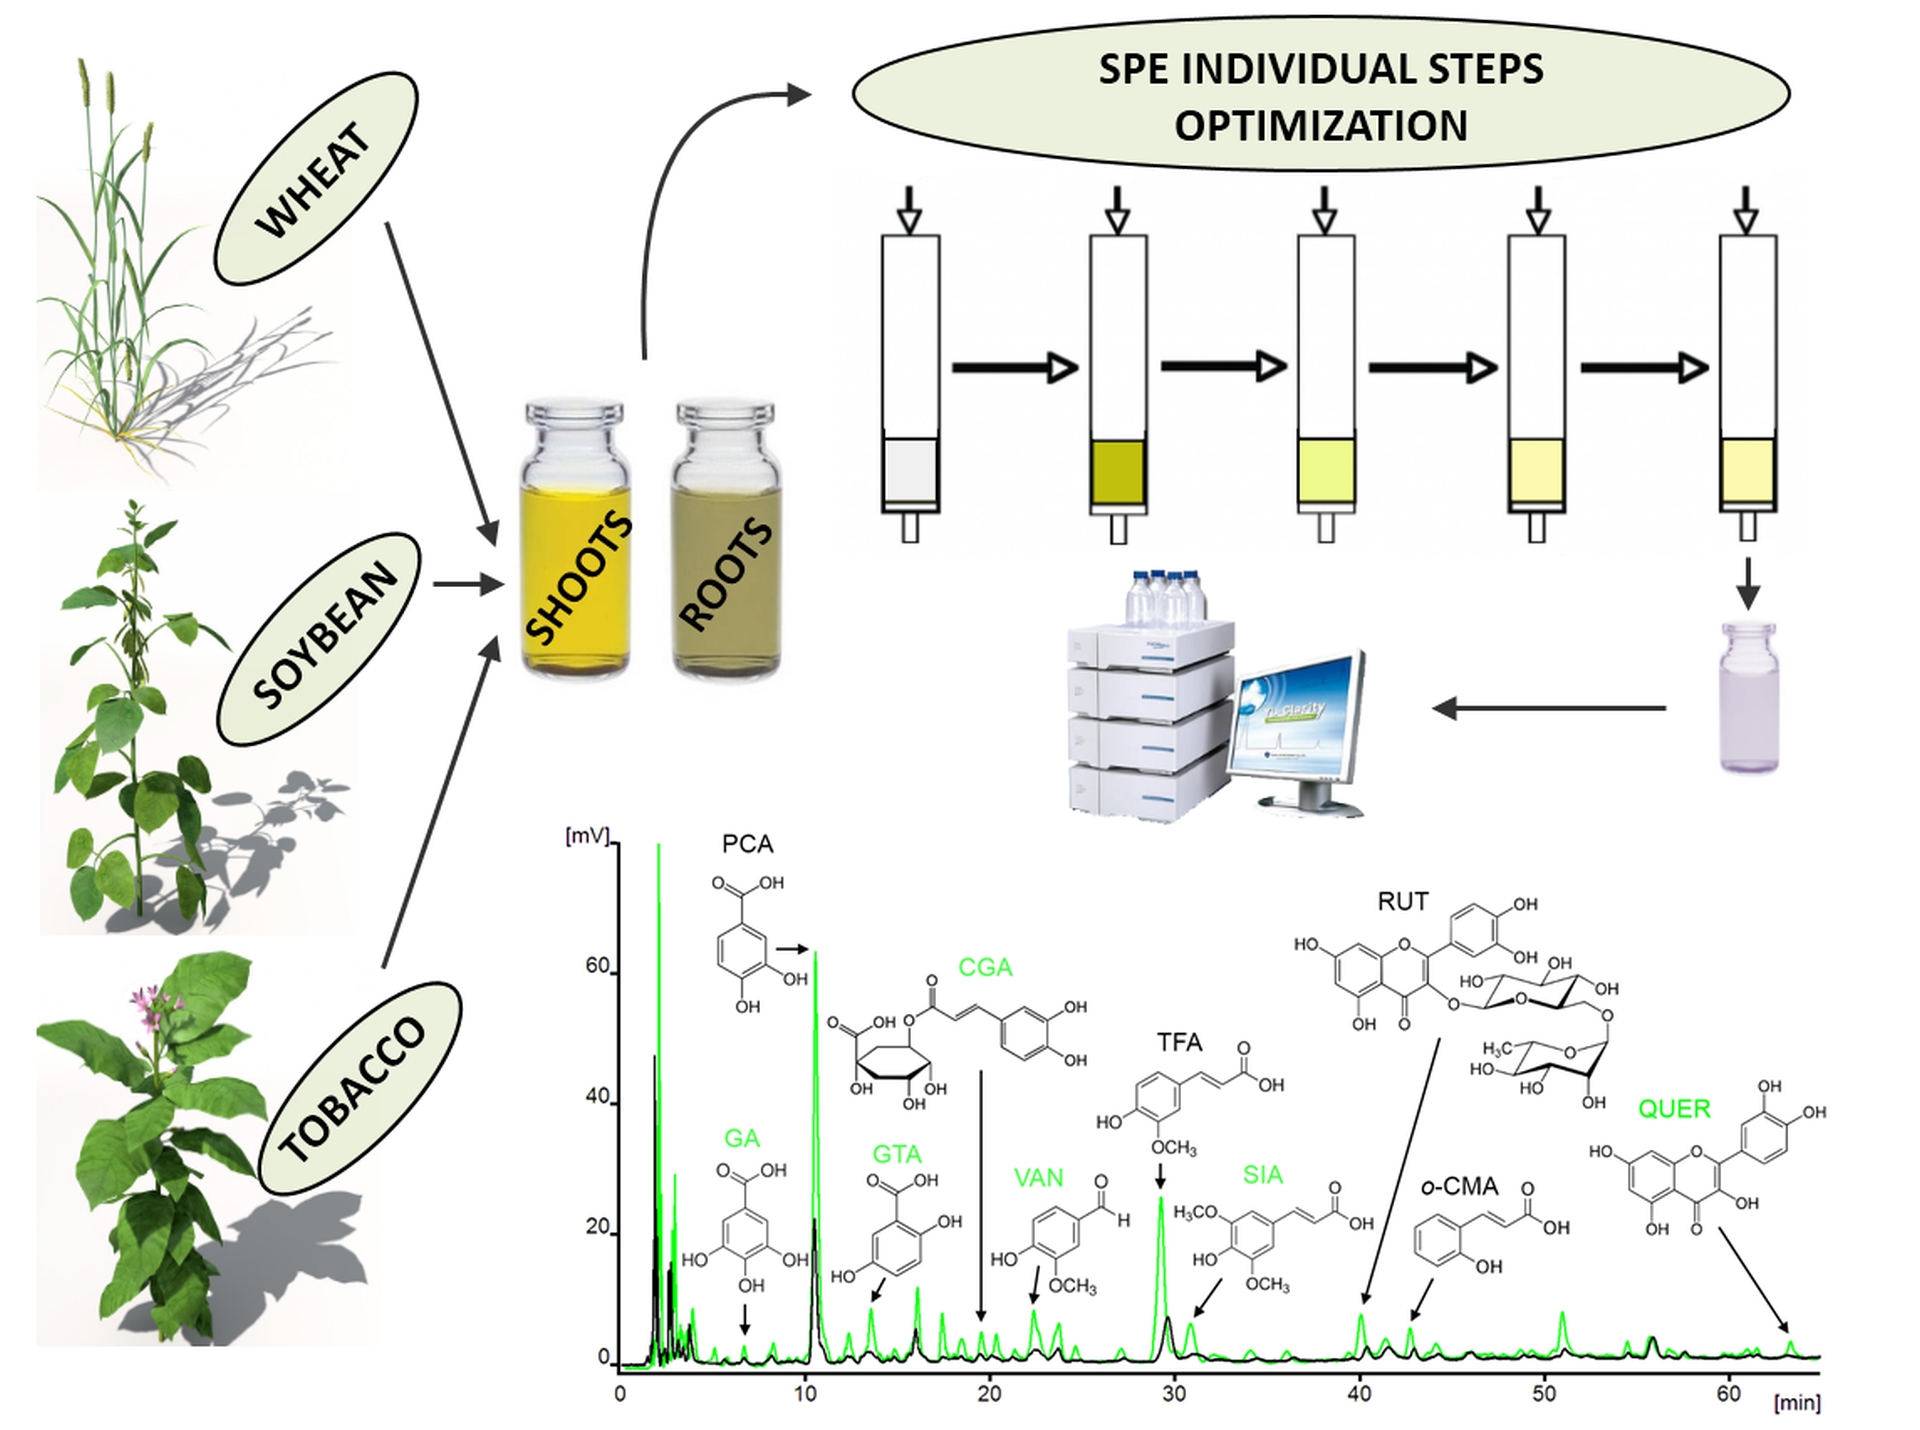
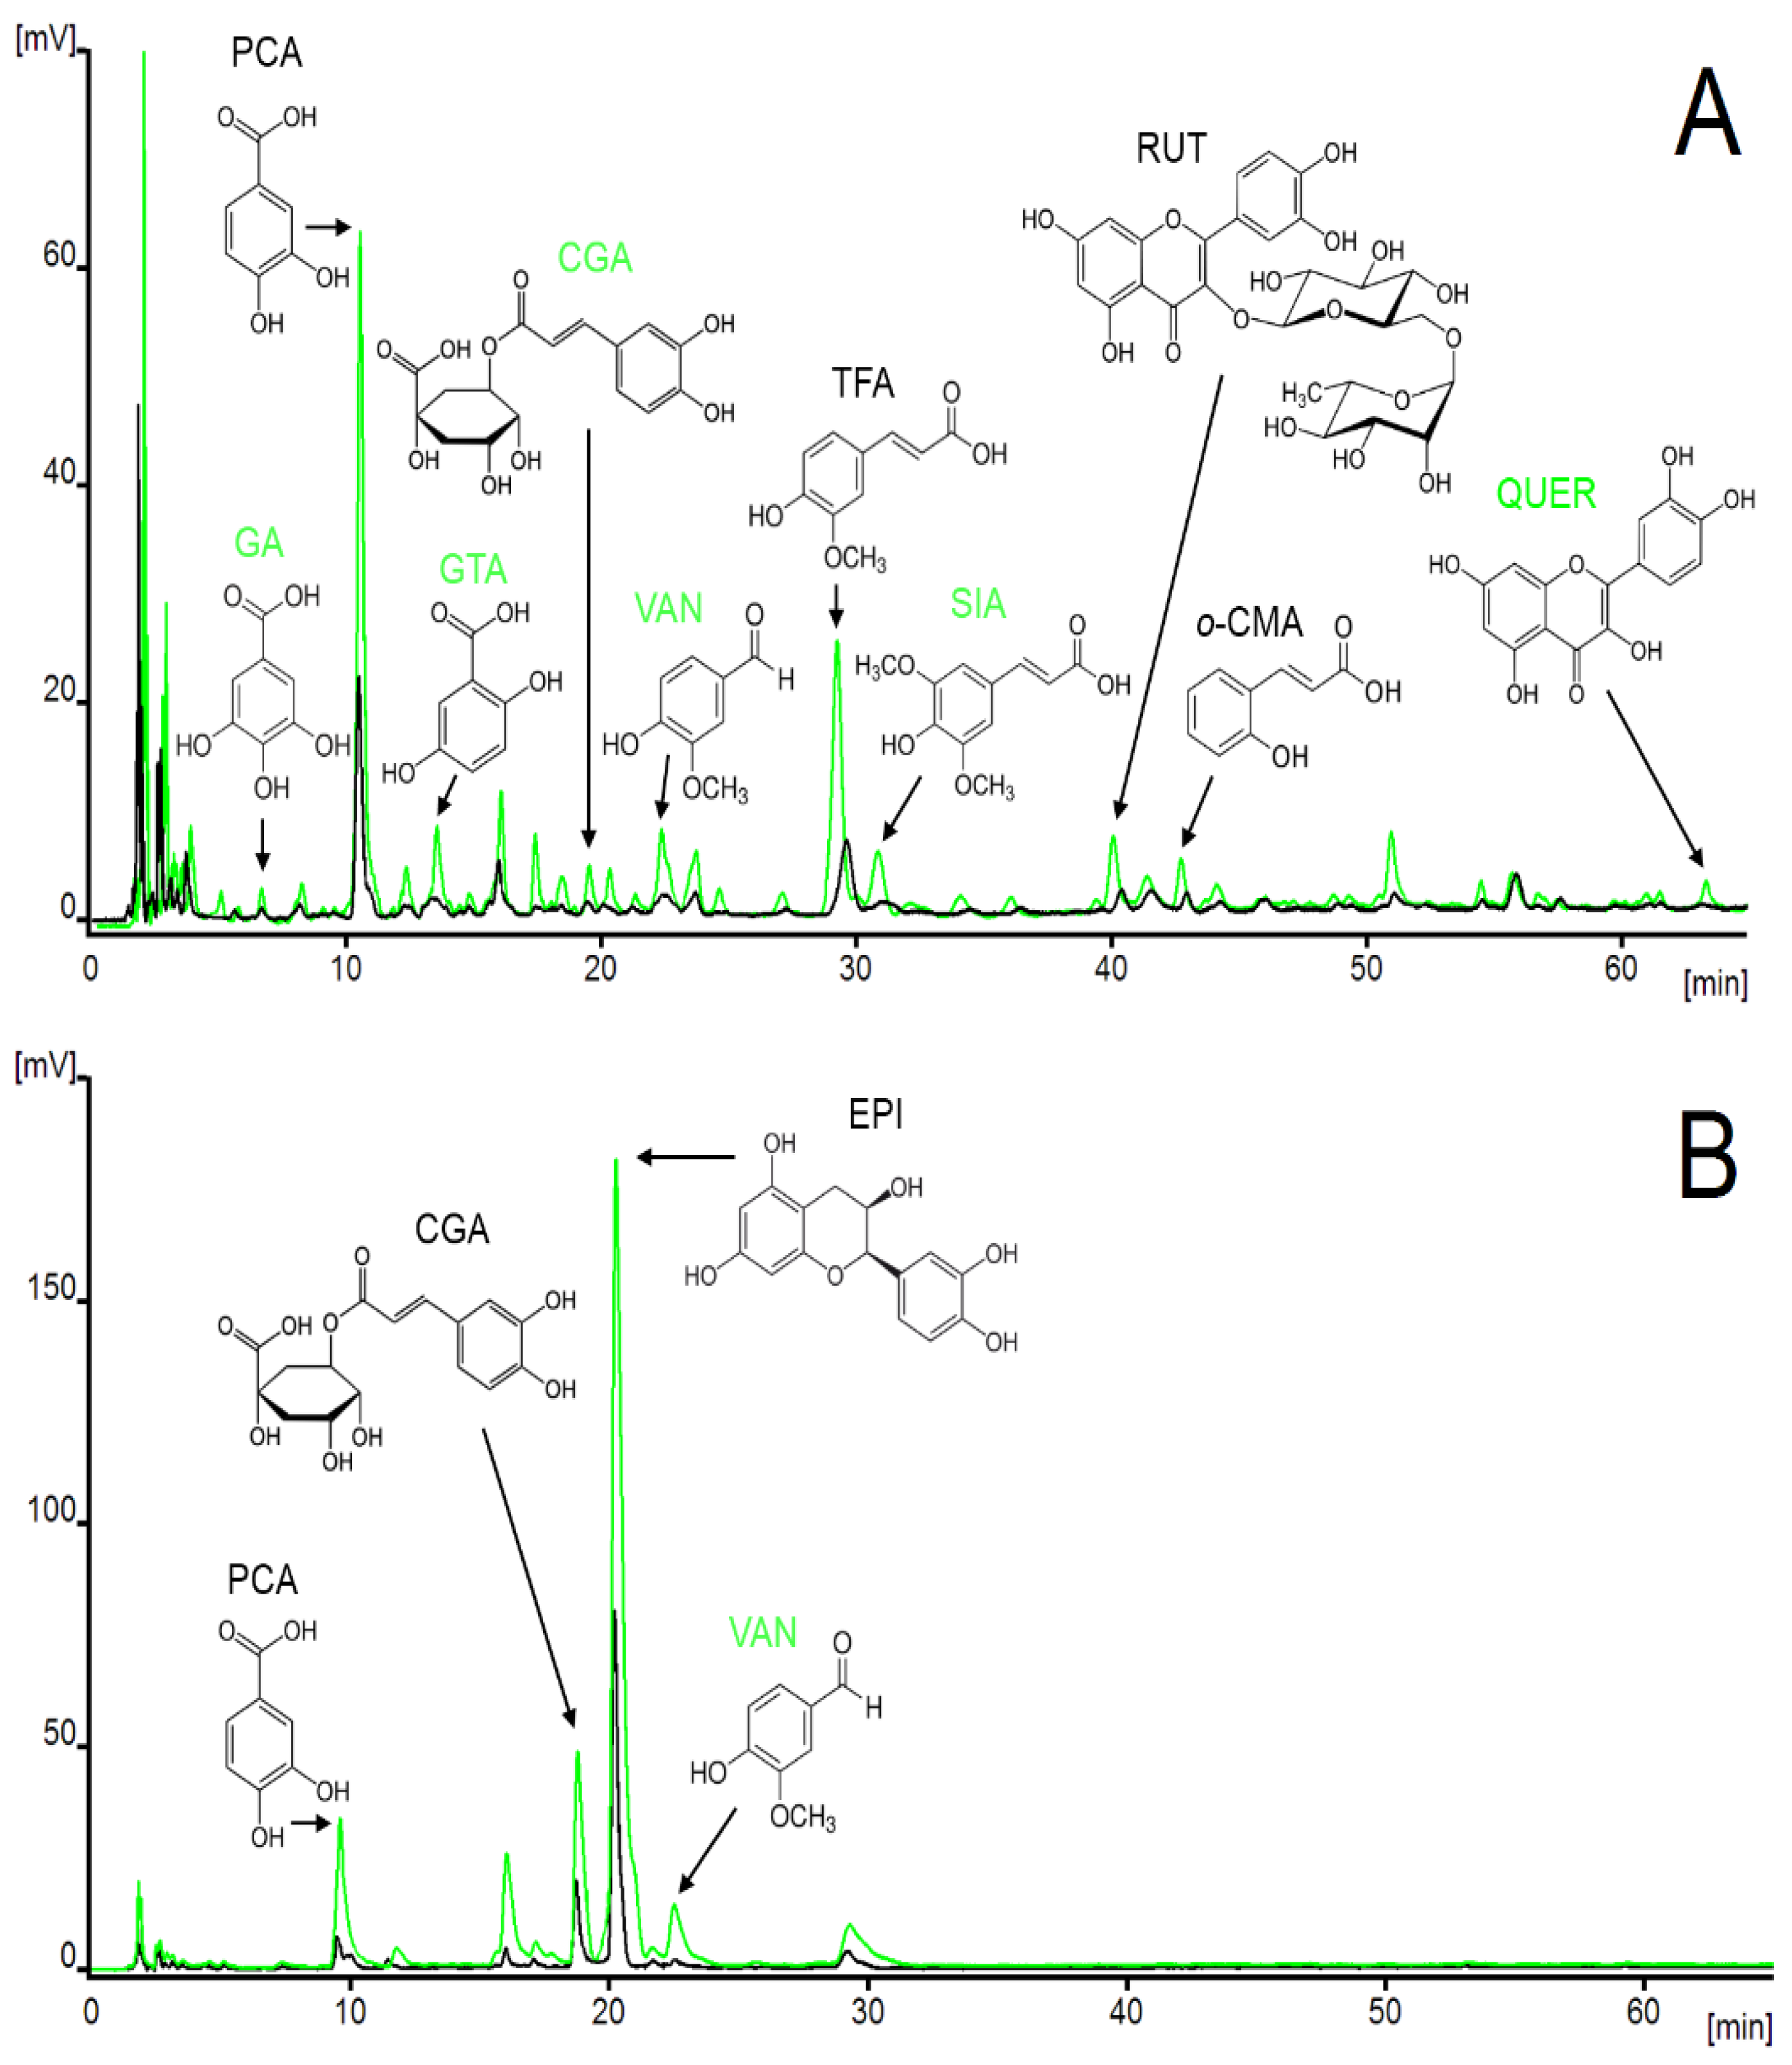
Several types of SPE columns were primarily tested, and best retention results were generally obtained by C18 sorbents modified for polar compounds (trademarks, e.g., C18-AQ, LUNA POLAR, etc.). For final optimizing, we chose commercially available sorbent ReproSil-Pur C18-AQ, 5 μm (Dr. Maisch, GmbH HPLC, Ammerbuch, Germany) with hydrophilic end-capping; we prepared hand-made SPE cartridges in our lab. The selection of this specific producer was determined by used chromatographic column. Polypropylene SPE tubes (3 mL volume) were used, in which the cartridge was immobilized with thin re-used frit. A total of 200 mg of sorbent was weighed per column and sealed with a second frit. For the SPE extraction procedure, a vacuum manifold (Supelco VisiprepTM DL; Sigma-Aldrich; Hamburg, Germany) was used.

2.4. HPLC Analysis

The HPLC system Young Lin 9100 (Anyang, South Korea) equipped with a vacuum degasser (YL9101), a quaternary pump (YL9110), a column thermostat (YL9131), a diode array detector (YL9160), an autosampler (YL9150), and software Clarity (version 7.3, DataApex) was used for all measurements. Chromatographic separations were performed on a GreatSmart RP18 Aq (150 × 4.6 mm, 3 μm) column (Grace; Columbia, Maryland, USA). The column was tempered at 35 °C. The injection volume was 5 μL. The mobile phase consisted of AcN/H2O/HCOOH (95/5/0.05; v/v/v) (component A) and H2O/AcN/HCOOH (95/5/0.05; v/v/v) (component B). The mobile phase program was as follows: 0–4 min, isocratic, 1% of component A; 4–18 min, linear gradient 1% to 10% A; 18–30 min isocratic 10% A; 30–65 min linear gradient 10% to 26% A. Flow rate of mobile phase was 1.0 mL/min. The diode array detector was operated at six wavelengths: 240, 260, 280, 290, 325, and 350 nm. Chromatograms were evaluated according to retention times and UV spectra of analytes.

2.5. Preparation of Plant Extracts

Plant seeds of different species, including soybean (Glycine max L.) (as an example of a dicotyledonous crop), common wheat (Triticum aestivum) (monocotyledonous grain crop), and tobacco (Nicotiana tabacum) (a commonly used research model with huge biomass) were obtained from Gene Bank of the Slovakia (Piešťany, Slovakia) and surface-sterilized with 0.5% (w/v) sodium hypochlorite for 15 min. After germination on moisturized filter paper, they were hydroponically cultivated in plastic boxes (32.8 diameter and 25.8 depth) in 25% Hoagland nutrition media [26]. Cultivation occurred in a temperature-controlled chamber at 22 °C, 16/8 h photoperiod with light intensity ranging from 300 to 400 μE/m2/s. Plant tissue was sampled (using scissors) and freeze-dried for 24 h to maintain the stability of analytes in plants using a lyophilizer (Zirbus; Bad Grund, Germany). The material was then homogenized to soft powder using tissue lyser (TissueLyser II, Qiagen; Hilden, Germany), and it was stored at −20 °C under nitrogen atmosphere until the preparation of extracts. Ultrasound-assisted extraction of 100 mg of plant material’s dry weight (DW) with 2 mL of methanol/water (80/20; v/v) was applied for 20 min (Ultrasons, J.P. Selecta; Abrera, Spain) according to [20]. Extracts were subsequently centrifuged for 10 min at 13,000 rpm (Micro Star 12, VWR; Radnor, PA, USA), and supernatants were filtered through 0.45 μm microfilters (Chromservis; Prague, Czech Republic). Methanol yield was completely evaporated from filtered supernatants using a vacuum rotary evaporator (Heidolph; Schwabach, Germany) with a setting of 100 mbar and 25 °C. The obtained pure water solution was adjusted by adding adequate water and organic solvent (acetonitrile or methanol, in volume and ratio indicated below) volumes and loaded on the SPE column.

3. Results and Discussion

3.1. SPE Optimization

Phenolic compounds belonging to the group of secondary metabolites are often analyzed because of their important biological functions in the plant, bioactive attributes for added-value food, but also valuable therapeutic properties in human medicine [1,27]. Due to the distinct polarities and complexity of plant tissue matrixes, these metabolites have rarely been analyzed in a single run, especially with diode array detection (DAD). Most importantly, the level of most of them is, in general, very low. Purification methods, such as SPE, with good recoveries and minimal losses, are essential to achieve sufficient quantitative analysis of these compounds. Purification procedures must be, however, properly investigated with regard to their recoveries. In this way, it is ascertained whether there are losses of sample components, and if so, in which step of procedure they occur.
To optimize an SPE procedure, concentrations of individual analytes in each step should be controlled by HPLC. Validation characteristics of HPLC methodology, including LODs (limit of detection), LOQs (limit of quantification), linear range, and correlation coefficients, were determined. The obtained data confirmed good resolution of peaks (Rij ≥ 1.5) within 65 min of analysis time. Retention times varied within the range of ±2%. LODs were calculated as the concentration of the analyte at which the elution peak’s height was three times higher than the average baseline noise. LOQs were calculated as the concentration of analyte at which the elution peak’s height was ten times higher than the average baseline noise. The noise signal was monitored at six wavelengths (240, 260, 280, 290, 325, 350 nm), and noise values were obtained as average values at the elution times (tR) of the individual analytes. RSD ≤ 2% (relative standard deviation) was calculated for the deviation between repeated injections. All the determined parameters are listed in Table 1.
Different materials can be used in SPE, e.g., molecularly imprinted polymers, affinity and immunoaffinity sorbents, chelating ion exchange resins, etc. Extraction is achieved using a particulate or monolithic sorbent packed between porous metal or plastic frits. SPE sorbent selection follows the same rules as a selection of the HPLC column in terms of matching the hydrophobicity of the analytes. The analytes of examined phenolic compounds exert a wide range of polarity, starting with more polar derivatives of hydroxybenzoic acid (e.g., GA, PCA, or GTA) to less polar phenols (e.g., RUT or QUER). Considering the different polarities of analytes, the best chromatographic performance was obtained for commercially available and relatively cheap sorbent ReproSil-Pur C18-AQ with hydrophilic end-capping. This column, due to the unique porous particles and hydrophilic end-capping, captured also more polar compounds with which common C18 columns had problems.
The conditioning of sorbent wets and activates the bonded phases to ensure consistent interaction between the analyte and the sorbent functional groups to maximize retention. Commonly applied conditioning with methanol as (first) organic solvent and then with high polar water, however, resulted in overflowing of the more polar phenolic acids, such as GA, PCA, GTA, CA, VA, CGA, regardless of the volume applied (Table 2). Since the sorbent is not dried before sample loading, a certain amount of water likely remained in a column that subsequently washed out the analytes already during sample loading, as we confirmed by HPLC analyses of the eluates. Further, switching the solvent order (water, methanol) failed to retain polar analytes. For this reason, we replaced methanol with acetonitrile. As a result, overflowing of analytes was restricted, especially when 1 mL of water and then 3 mL of acetonitrile were applied. Retention of analytes was further improved by acidification of solutions with 0.1% formic acid, which probably activated hydrogen bonds in hydrophilic end-capping in our favor. These conditions, however, appeared still insufficient for the analyses of GA and PCA as their recoveries were only 31.5 and 53.9%, respectively. However, both metabolites can be analyzed by direct injection of extracts into the chromatographic column [28,29], but in some plant species (especially in green tissue), their abundancy is rather low; thus, application of SPE is essential.
The analytes loaded to a column in the sample ideally interact and retain on the sorbent, while the solvent and other interferences of matrix pass through the cartridge. However, model mixture loading in a solution of methanol and water (80/20; v/v) (as commonly applied plant extracts environment) resulted in recoveries of analytes lower than 50% (Table 3). Therefore, other composition ratios in favor of water were tested; moreover, methanol was replaced with acetonitrile to cohere with column conditioning and avoid undesirable overflow. These adjustments were suitable for most of the analytes but GA and PCA. The data indicate the previous conditioning step could be responsible as well (same percentage of GA and PCA recoveries in the last row of Table 2 and Table 3).
Established conditions still resulted in poor results for GA and PCA. Therefore, we modified the composition of the 1.5 mL of model mixture/extract in MeOH/H2O (80/20; v/v) by adding 800 μL of water. Subsequently, methanol was evaporated using a vacuum rotary evaporator at 100 mbar and 25 °C. These conditions appeared critical for the stability of analytes and avoiding their degradation in a vacuum. The vacuum also inflicted that analytes remained dissolved. Of the resulting 1100 μL water solution, a total of 1000 μL was immediately applied in the SPE column. Table 4 depicts the suitability of this modification for all studied analytes.
The washing step was expected to selectively remove unwanted interferences, co-extracted with studied analytes. However, water, being a very polar washing agent, caused massive losses of the most polar analytes (mostly phenolic acids, e.g., GA, PCA, GTA, CA, VA, CGA), irrespective of the applied volume or acidification. Since washing badly influenced final recoveries, and no significant effect on the matrix interferences was observed, this step was omitted from the method protocol.
Selective desorption of target analytes from SPE sorbent at a controlled flow rate (usually one or two drops per second) enables concentrating analytes and purifying the samples. Due to the wide range of polarity of the studied phenolic compounds, we optimized multiple elution and volume ratios of solvents for better analytical performance. For model analytes, aliquots of eluents were passed through the column sequentially and analyzed by HPLC to determine elution volume. Table 4 shows that the first loaded solvent (MeOH/H2O, 80/20, v/v, 1 mL) eluted completely the most polar phenolic acids, such as GA, PCA, and GTA. Complete elution of the lower polarity compounds like DMBA, RUT, o-CMA, 4MCA, and QUER was achieved after the second and third elution with pure methanol (1 mL each). The fourth methanol elution was proven unnecessary (data not shown). Recoveries higher than 90% for 15 of the 16 studied analytes confirmed the suitability of the proposed SPE procedure (Table 4). Complex analyses of numerous phenols with HPLC-DAD detection are considered as difficult and are not frequently reported. Usually, various SPE and HPLC procedures are optimized for the simultaneous analysis of certain selected types of phenolic compounds (e.g., phenolic acids, flavonoids, catechins, etc.) [30]. Moreover, even in some more recent studies [31,32], authors have focused on only about five to ten phenolic metabolites. Though modern analytical methods, such as HPLC-MS, enable to extend the number of simultaneously detected phenolic metabolites [33,34], our method is routinely applied in many laboratories due to the relatively low cost and much more common equipment required.
Pre-concentration of target analytes can finally improve the detectability of poorly represented (less abundant) analytes. For this purpose, methanol was evaporated from the pool of the three SPE elutions (1 mL each) at the conditions described above (100 mbar, 25 °C). The final residue of target analytes in 200 μL of water was mixed with 300 μL of methanol so that the final solvent ratio was 40/60 (v/v). The scheme of the final optimized SPE procedure with individual steps is presented in Figure 1.
The capacity of the SPE cartridge was tested for various analyte concentrations of 25, 50, 75, and 150 μg/mL. We recorded a certain (albeit not extensive) overflow of six analytes belonging to the group of phenolic acids, namely GA, PCA, GTA, CA, VA, and CGA. A drop of efficiencies for the mentioned analytes caused by exceeding sorbent capacity reached nearly 25% at the highest concentration of 150 μg/mL (Table 5). On the other hand, recoveries for the other analytes remained high (≥99.0%) for all the tested loading concentrations. The observed overflow of polar analytes is likely connected with the limited number of polar active sites of the used sorbent; fewer polar analytes are capable of interacting with non-polar C18 chains. In the cases when the concentration of the most polar analytes (GA, PCA, GTA, CA, VA, and CGA) reaches a value around 100 μg/mL, we strongly recommend extracts’ dilution to ensure correct results.

3.2. Application of SPE Method to Various Plant Extracts

The developed SPE method was tested for roots and leaves of three model plant species, i.e., wheat and soybean as wide-spread agricultural crops, and tobacco as an important model plant in biological sciences and also as a commercial plant. These tissue types, representing complex and variable matrices with multiple interferences, are often analyzed for metabolite content in the context of environmental (stress) response. Direct analysis of such extracts by HPLC measurement without previous sample purification is sometimes barely applicable due to the strong matrix effect. Application of optimized purification and pre-concentration SPE method, however, significantly disposes of the samples of matrix impurities, regardless of tissue type. In addition, the pre-concentration step can improve the detectability of various analytes.
After the application of our method, we were able to detect other analytes (their abbreviations are green marked in Figure 2A–D), which were undetectable using direct analysis. Such minimizing matrix interferences and efficient pre-concentration render the optimized SPE technique suitable for simultaneous identification and quantification of the given set of phenolic compounds in plants.
For a demonstration of the established SPE method, we identified and quantified these analytes (in μg/g DW): GA (15.05), PCA (216.50), GTA (12.69), CGA (9.45), VAN (22.61), TFA (246.51), SIA (15.68), RUT (28.62), o-CMA (50.12), and QUER (5.36) in juvenile wheat leaves (Figure 2A), and PCA (102.36), CGA (185.32), EPI (2885.03), and VAN (29.25) in roots (Figure 2B). In agreement with this, Gregorová et al. [20] previously detected accumulation of GA, PCA, TFA, and SIA in adult wheat leaves and EPI and VAN in roots as well [20].
The method was applicable to tissues from other species as well. For example, our method detected PCA (235.44), GTA (11.92), CGA (9.09), p-CMA (87.56), TFA (502.51), RUT (29.99), o-CMA (44.09), and QUER (7.87) in soybean leaf samples (Figure 2C), similarly to Guzmán-Ortiz et al.; moreover, these authors also found EPI, GA, and VA in germinated seeds [35]. Further, we detected RUT (27.84), CGA (27.69), and PCA (59.12) (Figure 2D) in young tobacco leaves, similarly to Torras-Claveria et al. [36].
Of the set of sixteen metabolites analyzed, we failed to detect 2,5-dimethoxybenzoic acid (DMBA) and 4-methoxycinnamic acid (4MCA) in any tested tissue, while DMBA and 4MCA appear to be rare in plants, as we previously mentioned. On the other hand, vanillic acid (VA) and caffeic acid (CA) are commonly found. In our hands, their presence was detected in soybean and wheat, depending on variety (data not shown). It is important to note that the method is applicable for pre-screening of samples for the content of different polyphenols of a wide range of polarity, without any adjustment for some pre-selected type of metabolites. This might be a very useful tool for, e.g., (stress-related) environmental and biological research to reveal modulations of metabolic pathways that not necessarily are expected. Our detailed description of methods steps and their impact on final performance provide a guide for researchers to introduce stepwise modifications depending on the interest of the experiment to achieve the best performance. Such guides are rarely available in the literature and might be helpful for young researchers and/or for research of matrices of unknown complexity.
Though recently, there are available several more sensitive and miniaturized techniques for the preparation and analysis of (plant) extracts, our procedure compromises good overall efficiency with low cost, reasonable time, and routine use.

4. Conclusions

A solid-phase extraction procedure was developed to simultaneously analyze (sixteen) different phenolics of various polarity in different plant tissues by HPLC. This method allowed to screen the accumulation of intermediates in different metabolic pathways that play a crucial role in plant physiology and/or are beneficial for human health. Two uncommon metabolites (4MCA and DMBA) could be simultaneously quantified as well. The technique coupled with the follow-up HPLC-DAD method exhibited good recoveries up to 99.8% for nearly all analytes at various concentration levels. In addition to the eliminated matrix effect, the developed SPE procedure, including pre-concentration, enabled to quantify also low concentrations of analytes. The procedure offered low cost and good overall efficiency, as well as the possibility to analyze compounds with a wide range of polarity within a single run.
Our method was also suitable for various plant species as well as different tissue types. The obtained results demonstrated that the solid-phase extraction procedure using chosen sorbent with hydrophilic end-capping was appropriate for routine and cheap analysis of various plant samples.
Moreover, we described the optimization process in good detail that will be beneficial to anyone else optimizing an SPE method. Though there are reported many up-to-date methods of higher sensitivity, which analyze polar antioxidants in samples simultaneously (both from sample preparation and instrumental analysis point of view), our simple approach makes it possible for a number of laboratories to run such analyses with the result of efficient control of bioactive components in plant matrices.

Author Contributions

Conceptualization, P.R. and P.N.; Formal analysis, P.R.; Methodology, P.R. and P.N.; Resources, I.M.; Supervision, I.M. and P.N.; Writing—original draft, P.R.; Writing—review & editing, I.M. and P.N. All authors have read and agreed to the published version of the manuscript.

Funding

This work was supported by research grants APVV-15-0051 and VEGA 1/0048/19.

Institutional Review Board Statement

Not applicable.

Informed Consent Statement

Not applicable.

Conflicts of Interest

The authors declare no conflict of interest.

References

  1. Kumar, N.; Goel, N. Phenolic acids: Natural versatile molecules with promising therapeutic applications. Biotechnol. Rep. 2019, 24, e00370. [Google Scholar] [CrossRef]
  2. Kulichová, K.; Maliarová, M.; Sokol, J.; Lašáková, K.; Havrlentová, M. Determination of selected phenolic acid and majoritarian avenanthramides in different varieties of naked oats (Avena sativa L.) grown in Slovakia. Nova Biotechnol. Chim. 2018, 17, 132–139. [Google Scholar] [CrossRef] [Green Version]
  3. Sokamte, T.A.; Mbougueng, P.D.; Tatsadjieu, N.L.; Sachindra, N.M. Phenolic compounds characterization and antioxidant activities of selected spices from Cameroon. S. Afr. J. Bot. 2019, 121, 7–15. [Google Scholar] [CrossRef]
  4. Zhang, L.; Li, Y.; Liang, Y.; Liang, K.; Zhang, F.; Xu, T.; Wang, M.; Song, H.; Liu, X.; Lu, B. Determination of phenolic acid profiles by HPLC-MS in vegetables commonly consumed in China. Food Chem. 2019, 276, 538–546. [Google Scholar] [CrossRef]
  5. Ding, T.; Cao, K.; Fang, W.; Zhu, G.; Chen, C.; Wang, X.; Wang, L. Evaluation of phenolic components (anthocyanins, flavanols, phenolic acids, and flavonols) and their antioxidant properties of peach fruits. Sci. Hortic. 2020, 268, 109365. [Google Scholar] [CrossRef]
  6. Lukić, I.; Radeka, S.; Budić-Leto, I.; Bubola, M.; Vrhovsek, U. Targeted UPLC-QqQ-MS/MS profiling of phenolic compounds for differentiation of monovarietal wines and corroboration of particular varietal typicity concepts. Food Chem. 2019, 300, 125251. [Google Scholar] [CrossRef]
  7. Liu, Z.; Bruins, M.E.; De Bruijn, W.J.C.; Vincken, J.P. A comparison of the phenolic composition of old and young tea leaves reveals a decrease in flavanols and phenolic acids and an increase in flavonols upon tea leaf maturation. J. Food Compos. Anal. 2020, 86, 103385. [Google Scholar] [CrossRef]
  8. Esteban Muñoz, A.; Sánchez Hernández, S.; Recio Tolosa, A.; Pérez Burillo, S.; Olalla Herrera, M. Evaluation of differences in the antioxidant capacity and phenolic compounds of green and roasted coffee and their relationship with sensory properties. Food Sci. Technol. 2020, 128, 109457. [Google Scholar]
  9. Lin, D.; Xiao, M.; Zhao, J.; Li, Z.; Xing, B.; Li, X.; Kong, M.; Li, L.; Zhang, Q.; Liu, Y.; et al. An overview of plant phenolic compounds and their importance in human nutrition and management of type 2 diabetes. Molecules 2016, 21, 1374. [Google Scholar] [CrossRef]
  10. Abbas, M.; Saeed, F.; Anjum, F.M.; Afzaal, M.; Tufail, T.; Bashir, M.S.; Ishtiaq, A.; Hussian, S.; Suleria, H.A.R. Natural polyphenols: An overview. Int. J. Food Prop. 2017, 20, 1689–1699. [Google Scholar] [CrossRef] [Green Version]
  11. Ramesh Kumar, B. Application of HPLC and ESI-MS techniques in the analysis of phenolic acids and flavonoids from green leafy vegetables (GLVs). J. Pharm. Anal. 2017, 7, 349–364. [Google Scholar] [CrossRef]
  12. Domínguez-Rodríguez, G.; Marina, M.L.; Plaza, M. Strategies for the extraction and analysis of non-extractable polyphenols from plants. J. Chromatogr. A 2017, 1514, 1–15. [Google Scholar] [CrossRef]
  13. Tanase, C.; Coșarcă, S.; Muntean, D.L. A critical review of phenolic compounds extracted from the bark of woody vascular plants and their potential biological activity. Molecules 2019, 24, 1182. [Google Scholar] [CrossRef] [Green Version]
  14. Gill, S.S.; Tuteja, N. Reactive oxygen species and antioxidant machinery in abiotic stress tolerance in crop plants. Plant. Physiol. Biochem. 2010, 48, 909–930. [Google Scholar] [CrossRef]
  15. Márquez-García, B.; Ángeles Fernández-Recamales, M.; Córdoba, F. Effects of cadmium on phenolic composition and antioxidants activities of Erica andevalensis. J. Bot. 2012. [Google Scholar] [CrossRef] [Green Version]
  16. Ali, N.; Hadi, F. Phytoremediation of cadmium improved with the high production of endogenous phenolics and free proline contents in Parthenium hysterophorus plant treated exogenously with plant growth regulator and chelating agents. Environ. Sci. Pollut. Res. 2015, 22, 13305–13318. [Google Scholar] [CrossRef]
  17. Kuppusamy, P.; Lee, K.D.; Song, C.E.; Ilavenil, S.; Srigopalram, S.; Arasu, M.V.; Choi, K.C. Quantification of major phenolic and flavonoid markers in forage crop Lolium multiflorum using HPLC-DAD. Rev. Bras. Farmacogn. 2018, 28, 282–288. [Google Scholar] [CrossRef]
  18. Gong, L.; Chi, J.; Zhang, Y.; Wang, J.; Sun, B. In vitro evaluation of the bioaccessibility of phenolic acids in different whole wheats as potential prebiotics. Food Sci. Technol. 2019, 100, 435–443. [Google Scholar] [CrossRef]
  19. Ripari, V.; Baia, Y.; Gänzle, M.G. Metabolism of phenolic acids in whole wheat and rye malt sourdoughs. Food Microbiol. 2019, 77, 43–51. [Google Scholar] [CrossRef]
  20. Gregorová, Z.; Kováčik, J.; Klejdus, B.; Maglovski, M.; Kuna, R.; Hauptvogel, P.; Matušíková, I. Drought-induced respones of physiology, metabolites, and PR proteins in Triticum aestivum. J. Agric. Food Chem. 2015, 63, 8125–8133. [Google Scholar] [CrossRef]
  21. Mongkhonsin, B.; Nakbanpote, W.; Hokura, A.; Nuengchamnong, N.; Maneechai, S. Phenolic compounds responding to zinc and/or cadmium treatments in Gynura pseudochina (L.) DC. extracts and biomass. Plant Physiol. Biochem. 2016, 109, 549–560. [Google Scholar] [CrossRef] [PubMed]
  22. Lattanzio, V.; Di Venere, D.; Linsalata, V.; Lima, G.; Ippolito, A.; Salerno, M. Antifungal activity of 2,5-dimethoxybenzoic acid on postharvest pathogens of strawberry fruits. Postharvest Biol. Technol. 1996, 9, 325–334. [Google Scholar] [CrossRef]
  23. Ponce, M.A.; Bompadre, M.J.; Scervino, J.M.; Ocampo, J.A.; Chaneton, E.J.; Godeas, A.M. Flavonoids, benzoic acids and cinnamic acids isolated from shoots and roots of Italian rye grass (Lolium multiflorum Lam.) with and without endophyte association and arbuscular mycorrhizal fungus. Biochem. Syst. Ecol. 2009, 37, 245–253. [Google Scholar] [CrossRef]
  24. Hidalgo, W.; Kai, M.; Schneider, B. 4-Methoxycinnamic acid—An unusual phenylpropanoid involved in phenylphenalenone biosynthesis in Anigozanthos preissii. Phytochemistry 2015, 117, 476–481. [Google Scholar] [CrossRef] [Green Version]
  25. Stalikas, C.D. Extraction, separation and detection methods for phenolic acids and flavonoids. J. Sep. Sci. 2007, 30, 3268–3295. [Google Scholar] [CrossRef] [PubMed]
  26. Hoagland, D.R. Optimum nutrient solutions for plants. Science 1920, 52, 562–564. [Google Scholar] [CrossRef] [PubMed] [Green Version]
  27. Naczk, M.; Shahidi, F. Phenolics in cereals, fruits and vegetables: Occurrence, extraction and analysis. J. Pharm. Biomed. Anal. 2006, 41, 1523–1542. [Google Scholar] [CrossRef] [PubMed]
  28. Veljković, J.N.; Pavlović, A.N.; Mitić, S.S.; Tošić, S.B.; Stojanović, G.S.; Kaličanin, B.M.; Stanković, D.M.; Stojković, M.B.; Mitić, M.N.; Brcanović, J.M. Evaluation of individual phenolic compounds and antioxidant properties of black, green, herbal and fruit tea infusions consumed in Serbia: Spectrophotometrical and electrochemical approaches. J. Food Nutr. Res. 2013, 52, 12–24. [Google Scholar]
  29. Zhao, H.; Zhang, H.; Yang, S. Phenolic compounds and its antioxidant activities in ethanolic extracts from seven cultivars of Chinese jujube. Food Sci. Hum. Well. 2014, 3, 183–190. [Google Scholar] [CrossRef] [Green Version]
  30. Dimcheva, V.; Kaloyanov, N.; Karsheva, M.; Funeva-Peycheva, M.; Stoilova, N. HPLC-DAD method for simultaneous determination of natural polyphenols. Open J. Anal. Bioanal. Chem. 2019, 3, 39–43. [Google Scholar] [CrossRef] [Green Version]
  31. González-González, R.M.; Barragán-Mendoza, L.; Peraza-Campos, A.L.; Muñiz-Valencia, R.; Ceballos-Magaña, S.G.; Parra-Delgado, H. Validation of an HPLC-DAD method for the determination of plant phenolics. Rev. Bras. Farmacogn. 2019, 29, 689–693. [Google Scholar] [CrossRef]
  32. De Magalhães, B.E.A.; Santana, D.D.A.; Silva, I.M.D.J.; Minho, L.A.C.; Gomes, M.A.; Almeida, J.R.G.D.S.; Lopes dos Santos, W.N. Determination of phenolic composition of oilseed whole flours by HPLC-DAD with evaluation using chemometric analyses. Microchem. J. 2020, 155, 104683. [Google Scholar] [CrossRef]
  33. Bajkacz, S.; Baranowska, I.; Buszewski, B.; Kowalski, B.; Ligor, M. Determination of flavonoids and phenolic acids in plant materials using SLE-SPE-UHPLC-MS/MS method. Food Anal. Methods 2018, 11, 3563–3575. [Google Scholar] [CrossRef] [Green Version]
  34. Xiong, Y.; Zhang, P.; Warner, R.D.; Shen, S.; Johnson, S.; Fang, Z. Comprehensive profiling of phenolic compounds by HPLC-DAD-ESI-QTOF-MS/MS to reveal their location and form of presence in different sorghum grain. Food Res. Int. 2020, 137, 109671. [Google Scholar] [CrossRef] [PubMed]
  35. Guzmán-Ortiz, F.A.; San Martín-Martínez, E.; Valverde, M.E.; Rodríguez-Aza, Y.; De, J.; Berríos, J.; Mora-Escobedo, R. Profile analysis and correlation across phenolic compounds, isoflavones and antioxidant capacity during germination of soybeans (Glycine max L.). CyTA J. Food. 2017, 15, 516–524. [Google Scholar] [CrossRef] [Green Version]
  36. Torras-Claveria, L.; Jáuregui, O.; Codina, C.; Tiburcio, A.F.; Bastida, J.; Viladomat, F. Analysis of phenolic compounds by high-performance liquid chromatography coupled to electrospray ionization tandem mass spectrometry in senescent and water-stressed tobacco. Plant Sci. 2012, 182, 71–78. [Google Scholar] [CrossRef]
Figure 1. Schematic representation of the optimized solid-phase extraction (SPE) procedure with all individual steps, solvent types, and volumes.
Separations 08 00013 g001
Figure 2. Chromatograms of real plant extracts: wheat leaves (A), wheat roots (B), soybean leaves (C), and tobacco leaves (D) before (black) and after (green) SPE procedure.
Separations 08 00013 g002aSeparations 08 00013 g002b
Table 1. Validation parameters of applied HPLC-DAD method for the 16 studied metabolites (n = 3, RSD ≤ 2%) *.
AnalytetR (min)Detection (nm)Regression EquationLOD (ng/mL)LOQ (ng/mL)
GA5.14280y = 1.347x + 0.384 R2 = 0.995238.9796.4
PCA10.11260y = 1.774x + 0.338 R2 = 0.997138.7462.3
GTA13.89240y = 0.475x + 0.069 R2 = 0.993425.91419.8
CA16.49325y = 1.249x + 0.341 R2 = 0.997482.51608.5
VA17.45260y = 1.455x − 0.072 R2 = 0.995157.6525.2
CGA18.66325y = 1.778x + 0.544 R2 = 0.995150.0500.0
EPI21.08240y = 0.574x − 0.038 R2 = 0.998462.71542.5
VAN22.27280y = 1.180x + 0.131 R2 = 0.997436.91456.4
p-CMA25.60290y = 1.978x − 0.228 R2 = 0.995207.3691.1
TFA29.89325y = 1.143x + 0.151 R2 = 0.996545.51818.3
SIA31.71325y = 1.433x + 0.096 R2 = 0.997421.21404.0
DMBA35.72240y = 1.549x − 1.424 R2 = 0.993131.7439.1
RUT39.99260y = 0.709x + 0.023 R2 = 0.993340.31134.4
o-CMA43.54280y = 1.289x + 0.036 R2 = 0.997375.81252.6
4MCA60.04290y = 1.709x–0.033 R2 = 0.995211.9706.3
QUER61.92260y = 0.747x–0.044 R2 = 0.997299.5998.5
* Linearity range was tested between 400 and 2000 ng/mL. Analytes were prepared in MeOH/H2O (60/40, v/v). Abbreviations: tR—retention time; n—number of measurements; RSD—relative standard deviation; LOD—limit of detection; LOQ—limit of quantification; GA—gallic acid; PCA—protocatechuic acid; GTA—gentisic acid; CA—caffeic acid; VA—vanillic acid; CGA—chlorogenic acid; EPI—epicatechin; VAN—vanillin; p-CMA—p-coumaric acid; TFA—trans-ferulic acid; SIA—sinapic acid; DMBA—2,5-dimethoxybenzoic acid; RUT—rutin; o-CMA—o-coumaric acid; 4MCA—4-methoxycinnamic acid; QUER—quercetin.
Table 2. Recoveries (%) of SPE procedure under various conditioning solvents for the 16 studied metabolites (n = 3, RSD ≤ 2%). * Solvents acidified with 0.1% formic acid.
Conditioning SolventsGAPCAGTACAVACGAEPIVANp-CMATFASIADMBARUTo-CMA4MCAQUER
3 mL MeOH
3 mL H2O
0001.84.75.17.69.011.114.915.227.547.749.350.458.3
3 mL MeOH *
3 mL H2O *
0003.77.47.18.69.714.516.718.929.349.651.052.859.1
3 mL MeOH
1 mL H2O
004.612.815.916.117.217.918.619.519.430.957.158.759.664.5
3 mL MeOH *
1 mL H2O *
005.914.917.318.718.818.920.823.424.838.863.564.064.169.6
3 mL H2O
3 mL MeOH
0004.68.68.89.210.115.217.718.028.850.552.457.867.6
3 mL H2O *
3 mL MeOH *
005.014.819.920.019.820.022.324.125.040.858.164.960.169.8
1 mL H2O
3 mL MeOH
4.715.519.835.834.840.560.172.574.378.580.089.990.191.091.992.1
1 mL H2O *
3 mL MeOH *
9.719.026.037.746.048.878.781.782.082.383.191.699.599.799.699.8
1 mL H2O
3 mL AcN
19.445.195.898.198.899.399.599.599.699.799.699.899.799.799.699.7
1 mL H2O *
3 mL AcN *
31.553.997.898.298.599.199.299.499.499.599.499.699.899.799.799.8
Abbreviations: MeOH—methanol; AcN—acetonitrile; n—number of measurements; RSD—relative standard deviation; GA—gallic acid; PCA—protocatechuic acid; GTA—gentisic acid; CA—caffeic acid; VA—vanillic acid; CGA—chlorogenic acid; EPI—epicatechin; VAN—vanillin; p-CMA—p-coumaric acid; TFA—trans-ferulic acid; SIA—sinapic acid; DMBA—2,5-dimethoxybenzoic acid; RUT—rutin; o-CMA—o-coumaric acid; 4MCA—4-methoxycinnamic acid; QUER—quercetin.
Table 3. Recoveries (%) of SPE procedure under various elution solvents for the 16 studied metabolites (n = 3, RSD ≤ 2%, conditioning: acidified 1 mL H2O + acidified 3 mL AcN). * Solvents acidified with 0.1% formic acid.
Sample SolventGAPCAGTACAVACGAEPIVANp-CMATFASIADMBARUTo-CMA4MCAQUER
MeOH/H2O 80/20 (v/v)000005.15.97.08.510.614.320.939.741.444.049.1
MeOH/H2O 80/20 (v/v) *0002.74.58.69.510.818.225.728.829.848.551.456.257.8
MeOH/H2O 50/50 (v/v)008.69.617.614.016.319.625.129.934.737.856.358.960.663.5
MeOH/H2O 50/50 (v/v) *0014.614.522.319.722.224.630.834.439.843.260.462.663.168.3
AcN/H2O 10/90 (v/v)10.120.440.298.298.598.398.598.798.799.099.299.499.499.799.699.8
AcN/H2O 10/90 (v/v) *14.235.246.498.498.598.598.698.798.998.999.099.199.399.499.799.6
AcN/H2O 5/95 (v/v)29.148.898.798.798.898.999.199.199.299.299.599.699.799.799.899.8
AcN/H2O 5/95 (v/v) *31.553.997.898.298.599.199.299.499.499.599.499.699.899.799.799.8
Abbreviations: MeOH—methanol; AcN— acetonitrile; n—number of measurements; RSD—relative standard deviation; GA—gallic acid; PCA—protocatechuic acid; GTA—gentisic acid; CA—caffeic acid; VA—vanillic acid; CGA—chlorogenic acid; EPI—epicatechin; VAN—vanillin; p-CMA—p-coumaric acid; TFA—trans-ferulic acid; SIA—sinapic acid; DMBA—2,5-dimethoxybenzoic acid; RUT—rutin; o-CMA—o-coumaric acid; 4MCA—4-methoxycinnamic acid; QUER—quercetin.
Table 4. Recoveries of analytes in individual SPE elutions after optimization of both conditioning and sample loading (n = 3, RSD ≤ 2%, the concentration of model mixture: 25 μg/mL).
AnalyteLosses Caused by Overflowing after Sample Loading (%)Recoveries (%)
First Elution
MeOH/H2O
(80/20, v/v)
Second Elution
MeOH
Third Elution
MeOH
Total
GA12.986.80086.8
PCA9.690.20090.2
GTA4.295.30095.3
CA3.480.216.0096.2
VA1.480.218.0098.2
CGA1.578.419.9098.3
EPI078.920.6099.5
VAN075.324.5099.8
p-CMA075.124.6099.7
TFA075.024.6099.6
SIA072.726.3099.0
DMBA070.922.55.999.3
RUT068.625.95.299.7
o-CMA066.626.76.499.7
4MCA064.227.08.499.6
QUER058.830.410.699.8
Abbreviations: MeOH—methanol; n—number of measurements; RSD—relative standard deviation; GA—gallic acid; PCA–protocatechuic acid; GTA—gentisic acid; CA—caffeic acid; VA—vanillic acid; CGA—chlorogenic acid; EPI—epicatechin; VAN—vanillin; p-CMA—p-coumaric acid; TFA–trans-ferulic acid; SIA—sinapic acid; DMBA—2,5-dimethoxybenzoic acid; RUT—rutin; o-CMA—o-coumaric acid; 4MCA—4-methoxycinnamic acid; QUER—quercetin.
Table 5. Recoveries (%) of problematic phenolic compounds (GA, PCA, GTA, CA, VA, CGA) after optimization of SPE at four concentration levels.
ConcentrationGAPCAGTACAVACGA
25 μg/mL86.890.295.396.298.298.3
50 μg/mL86.389.194.595.597.998
75 μg/mL84.685.990.791.594.094.2
150 μg/mL74.577.680.680.983.585.0
Abbreviations: GA—gallic acid; PCA—protocatechuic acid; GTA—gentisic acid; CA—caffeic acid; VA—vanillic acid; CGA—chlorogenic acid.
Publisher’s Note: MDPI stays neutral with regard to jurisdictional claims in published maps and institutional affiliations.

