Article

Hydrophilic Interaction Liquid Chromatography to Characterize Nutraceuticals and Food Supplements Based on Flavanols and Related Compounds

by
Oscar Vidal-Casanella
1,
Kevin Arias-Alpizar
1,
Oscar Nuñez
1,2,3 and
Javier Saurina
1,2,*
1
Department of Chemical Engineering and Analytical Chemistry, University of Barcelona. Martí i Franquès, 1-11, E-08028 Barcelona, Spain
2
Research Institute in Food Nutrition and Food Safety, University of Barcelona, Recinte Torribera, Av. Prat de la Riba 171, Edifici de Recerca (Gaudí), Santa Coloma de Gramenet, E-08921 Barcelona, Spain
3
Serra Húnter Fellow, Generalitat de Catalunya, E-08008 Barcelona, Spain
*
Author to whom correspondence should be addressed.
Submission received: 14 January 2021 / Revised: 31 January 2021 / Accepted: 3 February 2021 / Published: 9 February 2021
(This article belongs to the Special Issue Advances in Food and Biological Samples Analysis)

Abstract

:
Purified extracts from different types of berries and medicinal plants are increasingly used as raw materials for the production of nutraceuticals and dietary supplements, mainly due to their high content in bioactive substances. This is, for instance, the case of phenolic compounds such as flavonoids, which exhibit a wide range of beneficial properties, including antioxidant, anti-inflammatory, antineoplastic and antimicrobial activities. This paper tackles the characterization of several kinds of nutraceuticals based on hydrophilic interaction liquid chromatography (HILIC) with fluorescence detection (FLD). The study focused on the determination of flavanols and related compounds such as condensed tannins. Analytes were recovered by solvent extraction using methanol:water:hydrochloric acid (70:29:1 v:v:v) as the extraction solvent under sonication for 30 min at 55 °C. Experimental design with response surface methodology was used to optimize the HILIC separation to achieve good resolution of the main components, using acetonitrile:acetic acid (99:1 v/v) (solvent A) and methanol:water:acetic acid, (95:3:2 v/v/v) (solvent B) as the components of the mobile phase. For the assessment of the elution gradient, factors under study were solvent B percentage and gradient time. The best conditions were achieved with 10% solvent B as the initial percentage and 30 min of linear gradient to reach 25% solvent B. Principal component analysis and partial least square-discriminant analysis were used to characterize and compare the compositional features of dietary supplements based on both targeted and non-targeted approaches. Results revealed that the sample distribution relied on the oligomeric nature of descriptors.

Graphical Abstract

1. Introduction

The consumption of fruits and vegetables has been related to a decrease in the risk of suffering chronic diseases and, in parallel, to an increment of longevity [1]. Several studies have proved that some phytochemicals from fruits and vegetables can play a bioactive role, thus helping to prevent some diseases and bringing positive effects for human health [2]. Among other products, the berries such as cranberry, blackberry, blueberry and raspberry have gained the attention of consumers because of their exceptional polyphenolic content that provides great antioxidant, anti-inflammatory, antiviral and antibacterial activities [3,4,5,6]. In the case of artichoke-based products, widely used in the formulation of dietary supplements, their hypolipidemic activity has been partly attributed to some bioactive polyphenolic agents [7,8]. Furthermore, other vegetal products from grapevines and medicinal herbs are increasingly used as ingredients in nutraceuticals because of their multiple beneficial detox and medicinal properties.
Phenolic compounds consist of a vast group of phytochemicals, with more than 8000 different molecules, which are the most important source of antioxidants in the human diet. They are often classified according to their chemical structures, being phenolic acids and flavonoids the principal families. Focusing on flavonoids, the basic skeleton consists of two phenyl rings linked by three carbon atoms that form an oxygen heterocycle ring. This family is divided into six groups differing in the degree of hydrogenation and hydroxylation of the three-ring system, namely: flavonols, flavones, isoflavones, flavanones, anthocyanidins and flavanols [9]. The latter includes highly relevant compounds such as catechin, epicatechin and their oligomers, the so-called proanthocyanidins (PAC) or condensed tannins. PACs are formed from the linkage of flavanol monomers, being the single bond between C4 of the chain-extension unit and C6 or C8 of the chain-terminating moiety; the most common one (B-type link). Some molecules have an additional interflavan link, the so-called A-type, which consist of an oxygen bridge between C2 and C7 of the flavanol monomers (Figure S1). It should be noted that although A-type compounds are much less common and abundant, they are powerful natural antimicrobial compounds to be used in the prevention and treatment of some infections [10]. In more detail, A-type compounds prevent the adhesion of bacteria to tissue walls, so they can be used in the prophylaxis of urinary and respiratory infections, among others. [11].
The determination of phenolic compounds, in particular flavanol-related species, is typically carried out by liquid chromatography (LC). Reversed-phase (RP) mode with silica-based C8 or C18 columns is the most reasonable choice for the determination of phenolic acids, flavonoids, stilbenoids and other phenolic compounds in food matrices. RP separations offer an excellent performance for dealing with small molecules, both aglycon and glycosylated species, based on their different polarities. However, this approach has been found to be limited for the separation of larger molecules such as tannins including PAC oligomers. As a successful alternative, Hammerstone et al. demonstrated the potentiality of normal-phase (NP) high performane liquid chromatography (HPLC) with UV and fluorescence detection to determine PACs in cocoa and chocolate samples [12]. The method was able to separate compounds from monomers to decamers, while bigger polymers resulted in broader bands. However, the lack of available commercial standards for oligomers (degree of polymerization (DP) > 3) hinders the identification and quantification of these species. The application of liquid chromatography coupled to MS detection techniques (LC-MS) offered new possibilities for identifying the ion fragments of the specific PACs. Mass spectral data can also be used to characterize structural features of the PACs, and distinguish between singly and doubly linked proanthocyanidins (A-type or B-type) [13]. More recently, the introduction of hydrophilic interaction liquid chromatography (HILIC) has offered new analytical possibilities for the separation of bioactive molecules [14]. In this regard, various authors have explored the possibilities of HILIC separation, in general based on LC-MS(/MS) platforms, for the analysis of condensed tannins in various food matrices, such as in the case of cocoa [15], blackcurrant and other berries of Finnish commercial cultivars [16,17], apple extracts from different varieties [18,19] and dry-blanched peanut skins [20].
This paper deals with the development and application of HILIC for the characterization of various nutraceutical and functional food products based on flavanol profiling and fingerprinting. The HILIC mode has been established using a bare silica column as the stationary phase and acidified acetonitrile and methanol solutions as the components of the mobile phase. The optimization of the separation relies on experimental design for a systematic exploration of the influence of the solvent composition and the elution gradient profiles. Owing to the complexity in the composition of some sample extracts, the best separation corresponds to that leading to the maximum number of resolved peaks in a minimum run time. In this regard, the separation performance has been investigated using a cranberry extract as a representative sample. The method has been applied to the analysis of commercial food supplements and the resulting data from both profiling and fingerprinting approaches has been exploited for sample characterization. In this regard, principal component analysis (PCA) has been used for more efficient data exploration. Results revealed important differences in sample patterns which clearly depend on compositional issues.

2. Materials and Methods

2.1. Chemicals and Solutions

General reagents and solvents used for the sample treatment and the preparation of the mobile phase were hydrochloric acid (37%, Panreac Chemistry SA, Castellar del Valles, Barcelona, Spain), formic acid (≥95%, Sigma-Aldrich, St Louis, MO, USA), dimethyl sulfoxide (DMSO > 99%, Merck, Darmstadt, Germany), acetonitrile and methanol (SuperGradient grade, Panreac, Spain) and water (purified using an Elix 3 coupled to a Mili-Q system, Bedford, MA, USA).
Flavanols were obtained from the following suppliers: procyanidin A2 (≥99%, Phytolab, Vestenbergsgreuth, Germany), procyanidin B2 (≥98%, Chengdu Biopurify Phytochemicals LTD, Chengdu, China), procyanidin C1 (≥99%, Phytolab, Vestenbergsgreuth, Germany), catechin (≥98%, Sigma-Aldrich, St Louis, MO, USA), epicatechin (≥98%, Sigma-Aldrich, St Louis, MO, USA) and epigallocatechin (≥98%, Carbosynth, Berkshire, UK). Stock solutions of each standard of phenolic acids and flavonoids were prepared by accurately weighing the solid substance to obtain a standard concentration of ca. 1000 mg L−1 using DMSO as the solvent. Stock solutions were placed in amber glass vials and stored at 4 °C in the fridge. Intermediate standard solutions for identification purposes were prepared at a concentration of 100 mg L−1 in water/methanol (1:1 v:v).

2.2. Samples

Twenty-four dietary supplements and nutraceuticals were obtained from local natural food stores and specialty health and nutrition stores located in Barcelona (Barcelona, Spain) and Gdansk (Gdansk, Poland). Samples commercialized in the pharmaceutical forms of capsules and pills were as follows: 9 cranberry-based extracts used against cystitis (2 of them also contained a small percentage of other plant extracts); 3 raspberry-based extracts also with antioxidant attributes; 1 grapevine sample rich in resveratrol with cardioprotective and anti-inflammatory properties; 3 red grape-based samples also containing different plant ingredients (grape only, grape + pomegranate and grape + polygonum + onion), all of them rich in epicatechin and B-type flavanols to treat venous insufficiency; 3 “antiox” samples composed of various red and black berries and other plant ingredients (nettle and vine) displaying great antioxidant activity; and 5 artichoke extracts with hepatoprotective and hypolipidemic indications.

2.3. Instruments and Lab Equipment

The chromatographic system consisted of an Agilent Series 1100 HPLC chromatograph (Agilent, Technologies, Palo Alto, CA, USA) equipped with a binary pump (G1312A), an autosampler (G1379A), a degasser system (G1379A), a diode array (DAD, G1315B) and a fluorescence (FLD, G1321A) detector.
Furthermore, a Genius 3 Vortex mixer (IKA, Staufen, Germany), a Rotanta 460 RS centrifuge (Hettich, Tuttlingen, Germany), a Branson 5510 ultrasonic bath (Branson Ultrasonic corporation, Danbury, CT, USA) equipped with a heater, a LyoQuest lyophilizer (Telstar, Terrasa, Spain) and a PB1502-L analytical balance (Mettler-Toledo, Columbus, OH, USA) were used for the extraction process and other laboratory operations.

2.4. Sample Treatment

The extraction procedure was described in reference [21]. Briefly, the content of 10 capsules was collected and homogenized to obtain a representative sample. For tablets, 10 units were taken, crushed and homogenized. In all cases, ca. 0.1 g of powdered samples were accurately weighed using an analytical balance and extracted with 5 mL MeOH/water/HCl (70:29:1 v:v:v) mixture in conical centrifuge tubes of 15 mL. Analytes were dissolved by sonification for 30 min at 55 °C. Afterwards, extracts were centrifuged for 15 min at 3200× g and the supernatant solutions were filtered through nylon membranes of 0.45 µm pore size (20 mm diameter, Macherey-Nagel, Düren, Germany). Extractions were carried out in triplicate. A quality control (QC) solution was prepared using identical volumes (100 µL) of each sample extract to evaluate the variability of the chromatographic method and the robustness of the chemometric results.

2.5. Chromatographic Method

The separation of flavanols and related compounds was attempted by HILIC mode using a Luna silica column (100 mm × 4.6 mm i.d.) with 2.6 μm particle size, equipped with the corresponding precolumn (4.0 mm × 4.6 mm i.d.), both from Phenomenex, Torrance, CA. The mobile phase was created from acetonitrile containing 1% acetic acid (solvent A) and an acidic aqueous methanolic (MeOH:water:acetic acid, 95:3:2 v/v/v) solution (solvent B). The elution gradient, which was optimized to achieve a good compromise among compound resolution and analysis time, was as follows: 0–30 min, 10−25% B (linear); 30–35 min, 25–85% B (linear); 35–40 min, 85% B (isocratic) and 45–50 min, 85–10% B. The column was re-equilibrated with 10% solvent B for 5 min before the next run. The flow rate was 0.4 mL min−1 and the injection volume 10 µL. Chromatograms were recorded by UV-vis detection at 280 nm and by FLD at 276 and 316 nm as the excitation and emission wavelengths, respectively.

2.6. Data Analysis

Principal component analysis (PCA) and partial least squares-discriminant analysis (PLS-DA) were carried out with PLS toolbox from Eigenvector working with Matlab R2017b (MathWorks, Natick, MA, USA). Two types of datasets were studied, namely: (i) Compositional profiles consisting of peak areas of 15 featured peaks of well-known and tentatively assigned compounds. The dimension of the corresponding data matrix was 82 samples × 15 variables, including 24 samples analyzed in triplicate plus 10 QCs. Finally, 10 variables were selected to achieve a better sample description. (ii) Chromatographic fingerprints consisting of fluorescence intensity values taken throughout the entire chromatogram in steps of 0.0072 min. The data matrix dimension was 82 samples × 4167 time points within the separation time range 0–30 min.
The original datasets were conveniently preprocessed to improve the performance of the chemometric models. Data was autoscaled to equalize the influence of major and minor components in the models. In the case of chromatograms, they were synchronized, smoothed and normalized, and the most suitable working time window was chosen. Additional details of these procedures are given in “Results and Discussion”.

3. Results and Discussion

This study is envisaged as a step forward in the development of new analytical methods for the analysis and characterization of nutraceuticals and dietary supplements based on some bioactive polyphenol families. As a preliminary framework, previous scientific papers have been published exploring the analytical possibilities of reversed-phase methods [21,22], as well as the assessment of efficient procedures to recover the desired analytes from these types of samples. In the following sections, we discuss the optimization of a new analytical method based on HILIC as well as its application for sample characterization.

3.1. Optimization of the Separation Conditions

RP HPLC is currently the technique of choice for the determination of phenolic compounds in a wide variety of food samples and related food supplements. Beyond the excellent performance of RP HPLC for the study of the vast majority of phenolic families, it has shown some limitations for dealing with the oligomeric nature of condensed tannins or PACs, and compounds with DP higher than 3 usually remain undetected. In this case, the separation mechanism mostly depends on polarity issues [21], as there is no correspondence between size and retention behavior.
Most of the former scientific publications devoted to the assessment of the oligomeric composition of PACs in fruits and vegetables relied on NP-HPLC in which the separation behavior was related to the size of the molecules. In the NP approach, methods commonly use low polar organic solvents such as methylene chloride or toluene and a growing gradient of a more polar solvent (methanol, acetone or acetonitrile) containing a low percentage of an organic acid (acetic or formic acid), while the stationary phase consists of bare silica particles in which interactions occur among the silanol groups and the polar groups of the analytes [14]. As the separation pattern, chromatograms clearly showed peaks or bands of compounds clustered according to their degree of polymerization, with retention times increasing from monomers to bigger oligomers.
Despite the initial success of NP separations for the characterization of oligomeric polyphenols, some drawbacks were encountered regarding the occurrence of long separations as well as the limited variety of stationary phases. The combination of silica columns with more polar organic solvent (such as acetonitrile or methanol) results in the HILIC mode has also demonstrated its great performance for the separation of different types of tannins depending on size features. Besides, apart from silica, a wide range of stationary phases with polar, weak ion exchange and zwitterionic groups have been developed for HILIC separations.
The extension of NP chromatographic separation proposed by Gu et al. to HILIC was taken as the starting point to optimize the separation of flavanol-related components occurring in the dietary supplements and nutraceutical samples analyzed [23]. The main objective of this optimization was to simplify the chromatographic separation through a gradient with a single slope and to reduce the analysis time since, in general, chromatographic runs longer than 60 min were required NP methods.
As indicated in the experimental section, the mobile phase was generated from 1% acetic acid in acetonitrile (solvent A) and MeOH:water:acetic acid (95:3:2, v/v/v) (solvent B). Preliminary experiments indicated that PACs have a greater affinity to polar solvents; as a result, increasing the polarity of the mobile phase by increasing the percentage of solvent B accelerated their elution. Nevertheless, the use of stronger elution conditions resulted in more overlapping peaks of components. Elution limits of the most and less retained species were studied to establish the working range of solvent B, concluding that ca. 10% solvent B was necessary for the retention of monomers (i.e., the less retained species) while the solvent B percentage should be increased up to 40% to elute bigger oligomers (i.e., the most retained species).
A systematic optimization of the separation conditions was attempted based on experimental design approaches, being the experimental factors under study, their experimental domain and the optimization criterion are key aspects to be defined. Apart from a preliminary study using pure standards of each analyte, the separation performance was assessed using a cranberry extract as a representative sample. The cranberry extract was rich in a wide range of phenolic compounds, especially flavanol species which are the main targets of this paper, thus, this matrix was considered a good example to address HILIC optimization.
On the one hand, experimental factors to be considered were the initial percentage of solvent B and the gradient time (to reach 40% solvent B). In this way, the experimental plan consisted of a 2 factor at 3 level full factorial design, involving 9 runs, in which the initial percentage of solvent B was studied at 10, 15 and 20% and the gradient time at 30, 45 and 60 min. In all cases, a further cleaning and conditioning step was added after the separation stage, in which the solvent B percentage increased up to 85%, was maintained at this percentage for 5 min, and returned to the initial conditions for column stabilization. Experiments were carried out randomly to avoid the influence of systematic drifts on the results.
On the other hand, the optimization criterion relied on reaching a suitable compromise among best separation capacity (i.e., maximum number of resolved compounds) and analysis time (i.e., fastest analysis). 
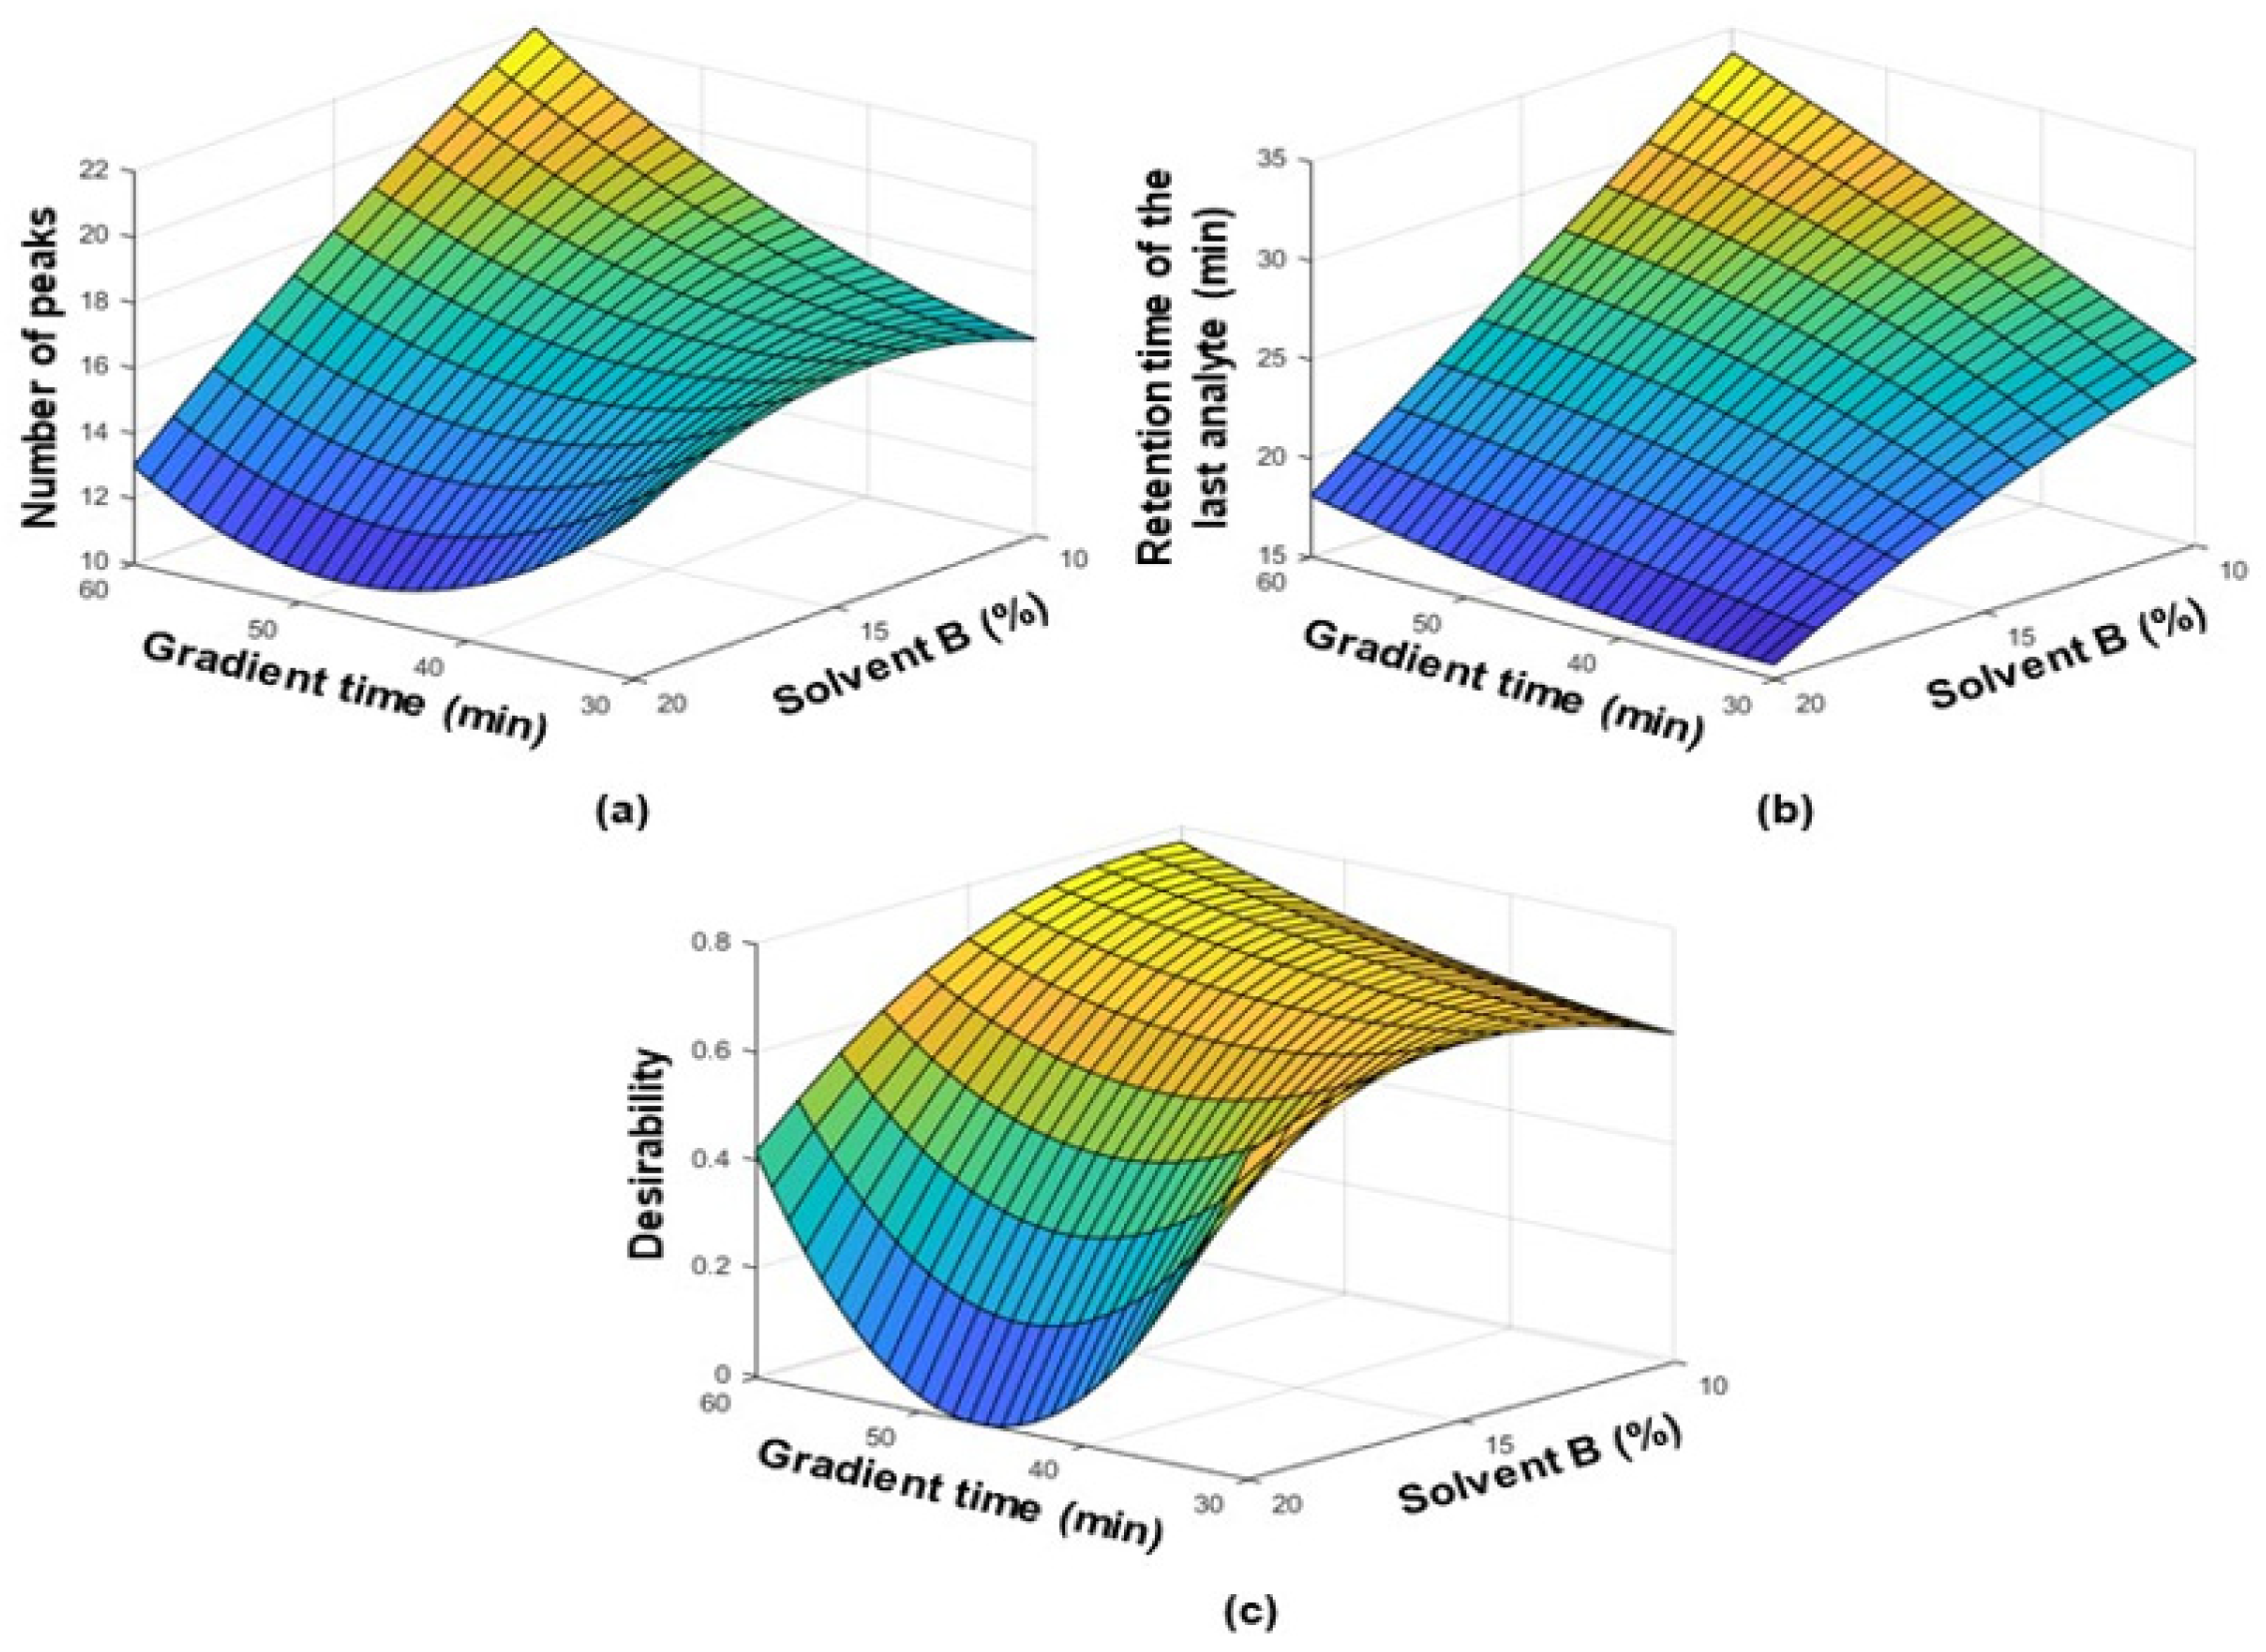
Figure 1 depicts the response surface corresponding to the optimization of the separation under the HILIC mode. Figure 1a shows the number of compounds resolved represented as a function of the experimental variables (solvent B percentage and gradient time), and the maximum of this surface theoretically corresponded to the optimal conditions given by this design. As can be seen in this figure, the best separation was obtained by increasing the percentage of solvent B from 10 to 40% in 60 min. Figure 1b shows the retention time of the last analyte peak represented as a function of the experimental variables (solvent B percentage and gradient time). The optimization criterion was mathematically expressed as a response function (desirability function) combining both contributions of resolved compounds and retention time, given by the number of analyte peaks found in the chromatogram and the retention time of the last analyte peak in the chromatogram, respectively. In order to equalize the influence of each contribution to the overall response function, in other words, minimizing the influence of the different scales, each response was normalized from 0 to 1, with 0 representing the worse results and 1 the best ones. The overall response function was then calculated as the geometric mean of number of peaks (npeaks) and analysis time (tR): D = (dnpeaks × dtR)1/2. Figure 1c shows the effect of initial methanol percentage and gradient time on the separation of flavanol-related components expressed as a desirability function D. The best conditions were 10–40% in 60 min. Then, the gradient profile was further modified to shorten the analysis time by reducing those initial and final chromatographic ranges without significant peaks of analytes (no peaks were detected with retention times higher than 30 min). Hence, the separation chosen consisted of increasing the solvent B percentage from 10 to 25% in 30 min; after that period, cleaning and conditioning steps were applied.
Under the selected conditions, sample chromatograms recorded by UV absorption spectroscopy at 280 nm resulted in complex patterns with a great diversity of peaks and multiple overlapping; peaks detected corresponded to a wide range of phenolic compounds, including hydroxybenzoic and hydroxycinnamic acids, stilbenes, flavonoids, et cetera. Nevertheless, in order to simplify the chromatographic profiles and focused on flavanols and other structurally related families, data was recorded by FLD at λexc 276 and λem 316 nm. The higher selectivity and sensitivity achieved by this detection technique led to cleaner chromatograms in which many interferences remained undetectable.

3.2. Analysis of the Sample Extracts

Nutraceuticals and food supplements were analyzed in triplicate, from the injection of three independent sample extracts which were analyzed randomly in order to minimize the influence of possible instrumental drifts in the results. Besides, the QC was analyzed every 10 sample injections to assess repeatability of the chromatographic method. Regarding compositional issues, apart from catechin, epicatechin, procyanidin A2, procyanidin B2 and procyanidin C1, which were confirmed from commercial standards, other relevant peaks were observed in the chromatograms. Peaks with retention times higher than 14 min were attributed to bigger oligomers, including clusters of other trimers, tetramers, et cetera. Unfortunately, standards for these species were not available so they could only be tentatively deduced from MS measurements. For instance, B-type oligomers exhibited m/z values for the [M-H] ions of 865 (trimers), 1155 (tetramers) 1445 (pentamers) and 1735 (hexamers); when A-type links occurred in these molecules, the m/z values decreased in 2 units per link [24,25]. In the range, 3.8–8.6 min, peaks were attributed to hydroxybenzoic acids (e.g., gallic acid, vanillic acid and gentisic acid) and flavanones (hesperidin, naringenin, etc.) that may be abundant in some of the samples. These compounds have a fluorescent moiety similar to that of flavanols so they were also detected by FLD at the excitation and emission wavelengths used. The individual resolution of these compounds was not attempted here as our description was mainly focused on flavanols.
Table S1 shows some relevant method features estimated from the series of QCs. As can be seen, the values of the relative standard deviation in the retention time, expressed as a percentage (RSD%), were lower than 1%, thus indicating a good repeatability of the chromatographic events throughout the series of analyses. In the case of peak areas, RSD% values of catechin, epicatechin, procyanidin A2, procyanidin B2 and procyanidin C1 ranged from 1.3 to 6.7%. For the rest of the peaks, the variability was lower than 10% except for the bigger oligomers that exhibited higher RSD% values, possibly due to the low intensities of the corresponding peaks.
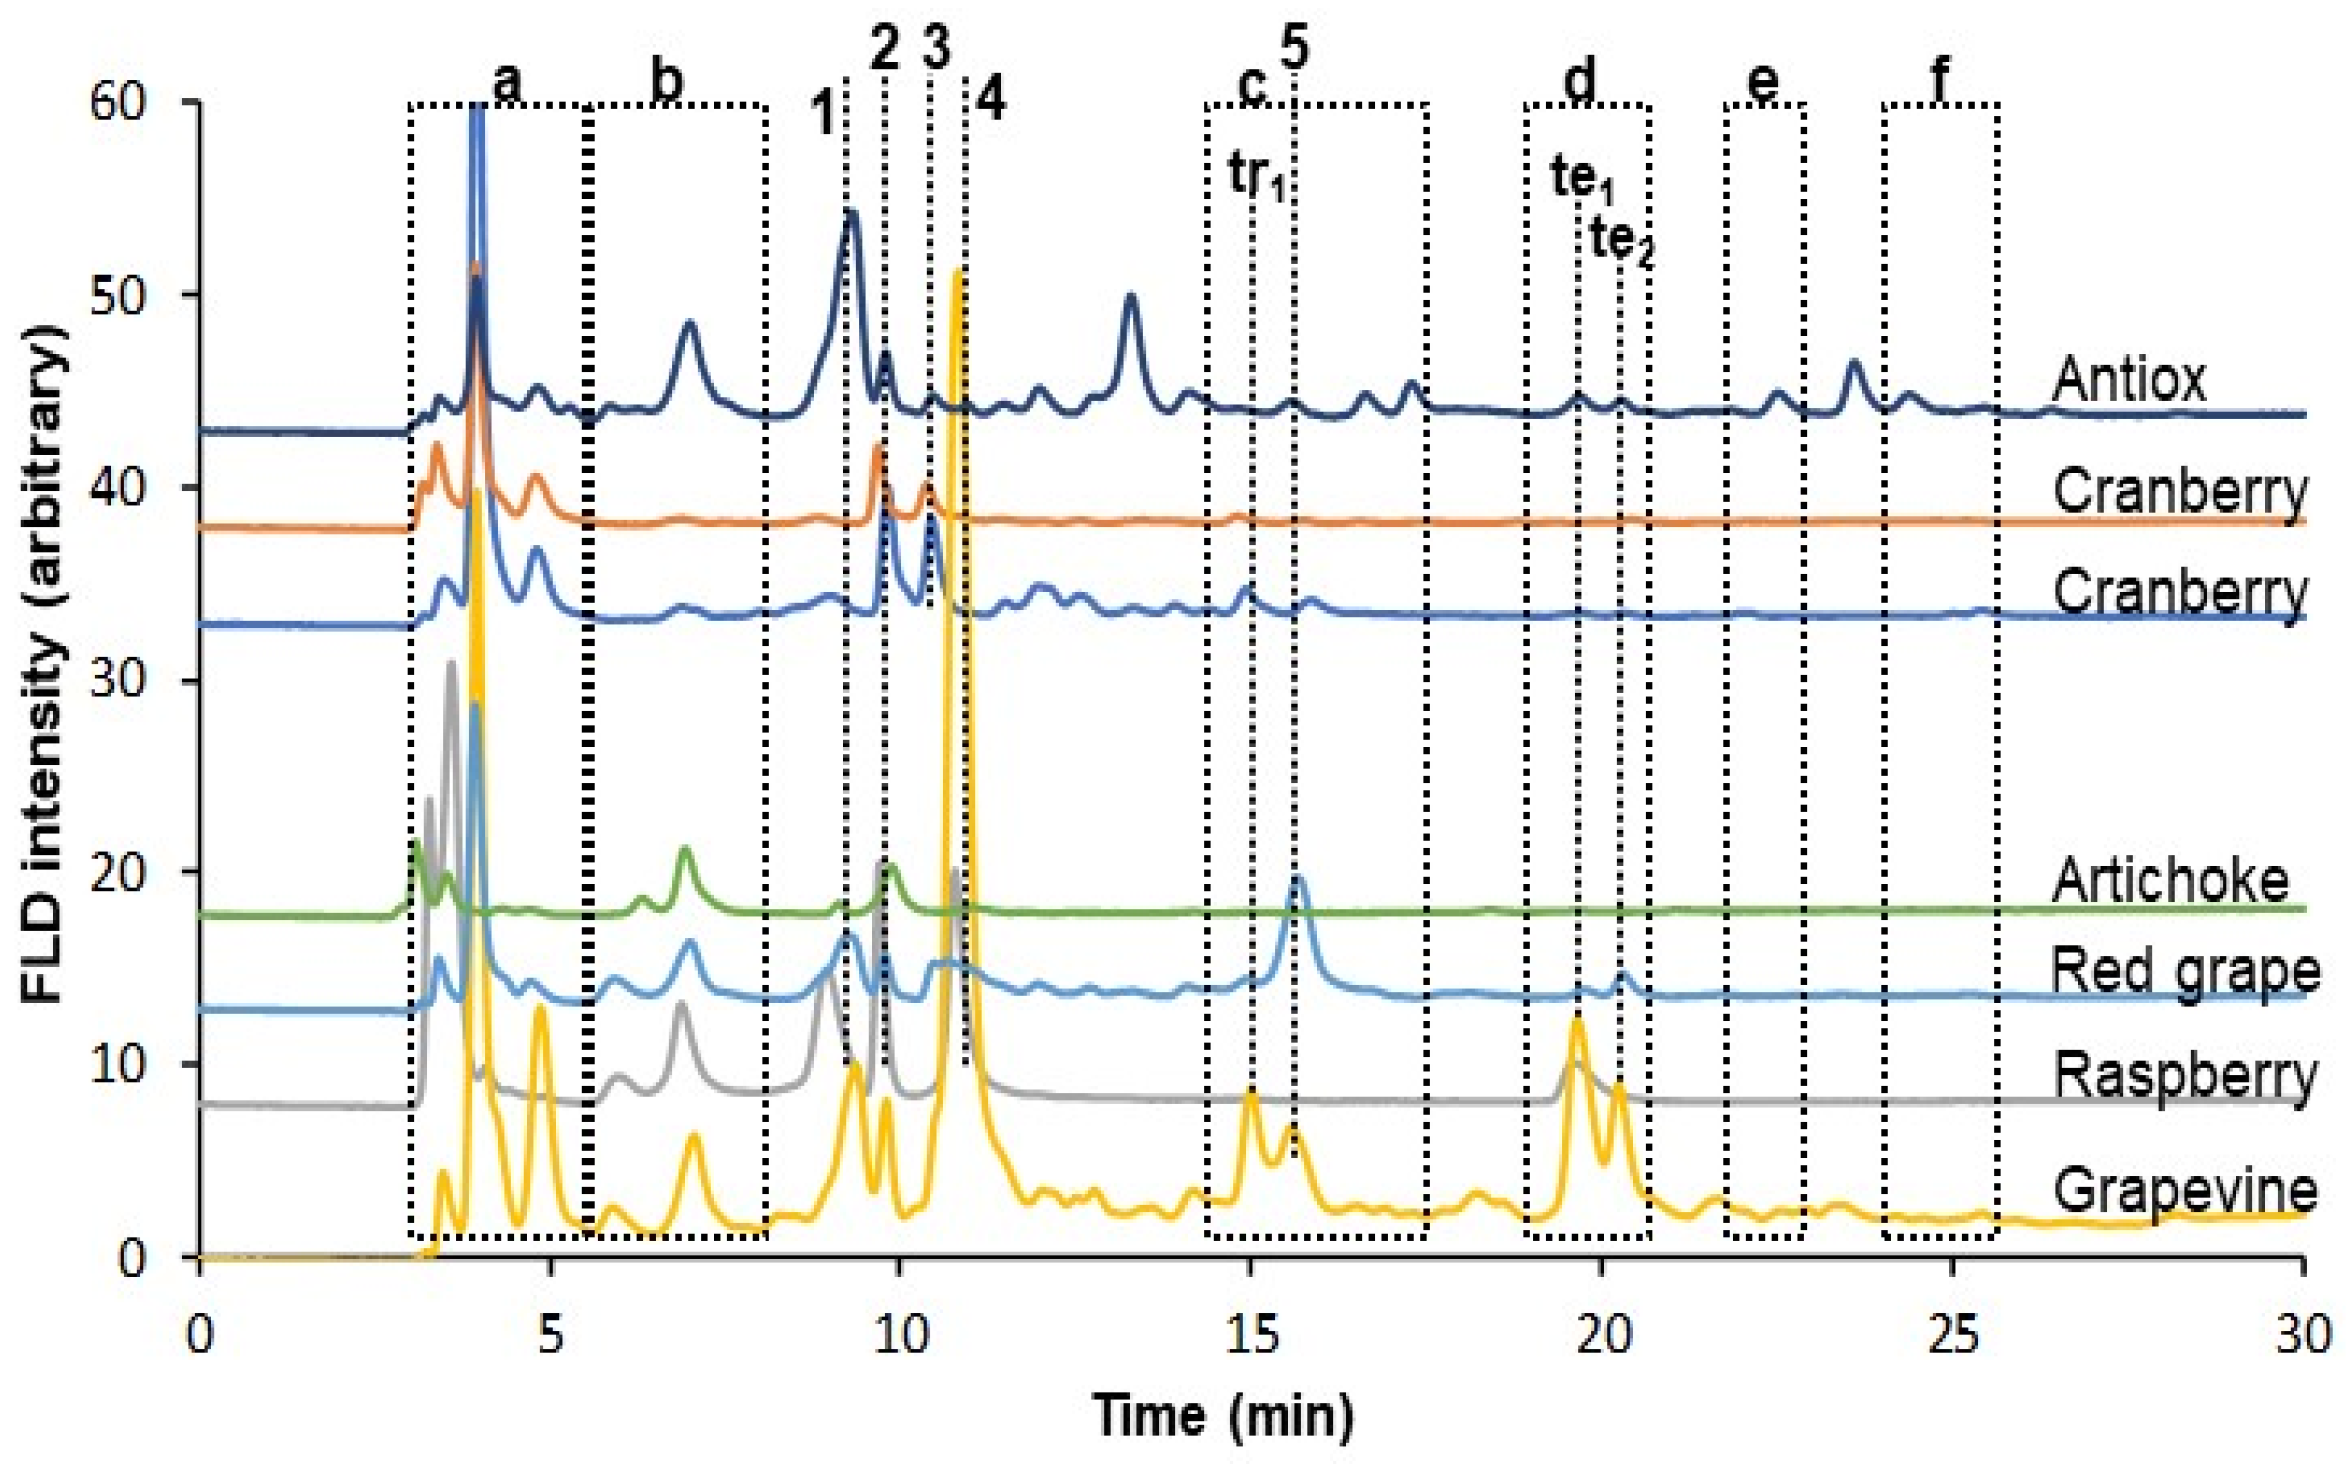
As an example, Figure 2 shows some representative FLD chromatograms of cranberry, raspberry, grapevine, red grape, antiox products and artichoke samples. For samples manufactured with purified cranberry extracts, epicatechin and procyanidin A2 were the most remarkable compounds although some oligomeric species were also detected. In some cases, cranberry extracts were combined with other medicinal plants, thus resulting in more complex chromatograms in terms of compound diversity. Raspberry extracts were rich in catechin, epicatechin and procyanidin B2. In the case of the grapevine sample, the most relevant peaks corresponded to catechin, epicatechin, procyanidin B2 and some trimer and tetramer species. Red grape samples were abundant in procyanidin C1. All the artichoke samples displayed simpler profiles, catechin and epicatechin being the principal species. Antiox products exhibited the most complex profiles in accordance with the variety of ingredients that contain them, including red berries, pomegranate, grapevine, plum, strawberry, et cetera. Since differences in the composition of the samples were significant, the compositional profiles were exploited as a source of potential descriptors to characterize and discriminate the nutraceutical samples.

3.3. Sample Characterization by Principal Component Analysis and Related Methods

A comprehensive characterization of dietary supplements and nutraceuticals was tackled under both profiling and fingerprinting approaches. In the first strategy, data consisted of concentrations of given analytes determined for the set of samples. Strictly speaking, the quantification can only be done in the case of analytes for which commercial standards were available, namely, catechin, epicatechin, procyanidin A2, procyanidin B2 and procyanidin C1. In a broader sense, however, peak areas of non-quantified compounds can also be used to enrich the data matrix. Further data pretreatment consisting of autoscaling was applied to equalize the differences in the magnitude and amplitude of the different scales regardless of concentrations or areas that were used.
Principal component analysis (PCA) was applied as an exploratory method to characterize samples regarding the type of ingredients, such as berries, grape-related products, artichoke, et cetera. The PCA profiling model performed considering all detected peaks showed some sample clustering according to type of product (Figure S2). Cranberry samples were mainly discriminated from artichoke samples while raspberry, grape and antiox samples showed some overlapping; this finding was attributed to the influence of phenolic acids and other flavonoids (different to flavanols) on the model. In order to try to achieve a better separation among groups of samples with similar features, another PCA model was attempted using flavanols only. PCA results (see 
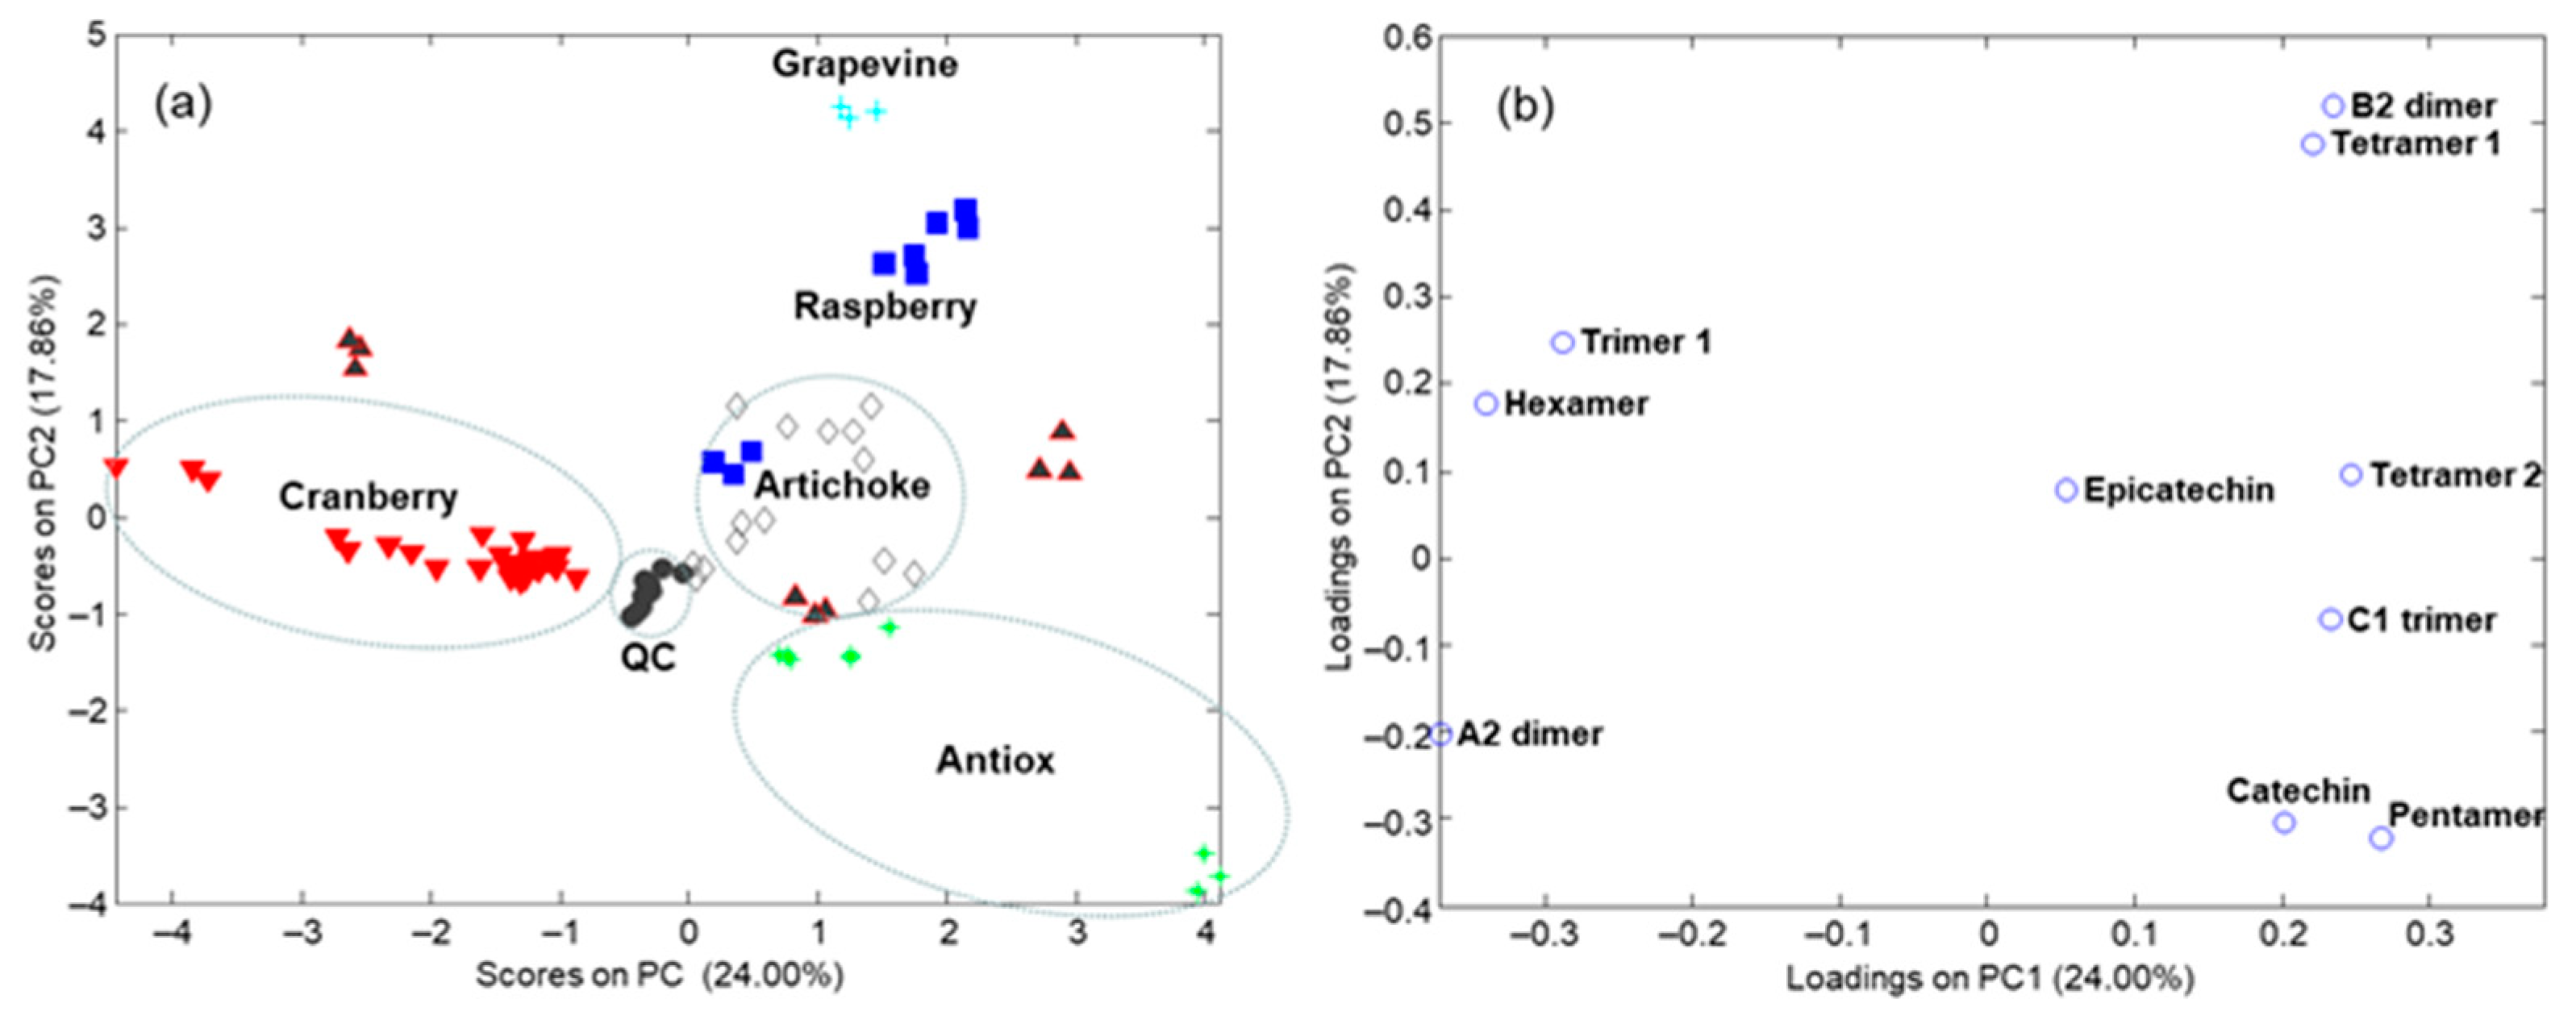
Figure 3) showed that similar samples were grouped in compact groups, with cranberries on the left, artichokes in the center and the other classes mainly on the right side. Red grape-based samples appeared dispersed since, although grape was the main ingredient, they also contained other plant extracts (grape alone, grape + pomegranate and grape + polygonum + onion). It should be pointed out that QCs were tightly clustered in the center of the model, thus demonstrating the stability and reproducibility of the chromatographic data throughout the entire series of measurements as well as the suitability of the PCA. It was also deduced that PC2 mainly distinguished raspberry and grapevine samples (top right corner) from red grape and antiox samples (bottom).
The map of loadings (Figure 3b), procyanidin A2 and trimer 1 (A type trimer), on the left side, were well correlated variables (r2 = 0.68), being the most characteristic descriptors of cranberry-based samples. Procyanidin B2, on the top right corner, was especially abundant in raspberry and grapevine preparations. Procyanidin C1, on the middle right, was plentiful in red grape samples. Epicatechin was ubiquitous to all the samples so it was found close to the center of the graph. Catechin was more characteristic of the antiox combinations.
The application of supervised methods for class modeling based on PLS-DA used class information to achieve a more efficient model. Results shown in Supplementary Materials (Figure S3) indicated that five latent variables were used to establish a PLS-DA model. Plots of scores and loadings provided similar conclusions to PCA with regards to the main class descriptors, although, in this case, the groups were better defined.
Sample characterization based on chromatographic fingerprints required an exhaustive data preprocessing in order to obtain reliable results. First, although the reproducibility of the chromatographic data was noticeable, in general, retention time of analytes increased slightly throughout the series of injections. This peak shifting phenomenon was more remarkable for compounds with higher retention times. Hence, chromatograms were aligned using representative peaks as a reference, such as the epicatechin peak which was common to all the samples. After synchronization, trends associated with the working time were fully corrected and the influence of this factor on the results became negligible, as it was deduced from the study of the behavior of QCs.
The selection of the most appropriate chromatographic time range was another important issue that affected the performance of the description models. When using the whole chromatogram, various time ranges containing useless data (e.g., holdup time, cleaning step and column stabilization) were kept in the dataset. In contrast, all relevant compounds were located within the working range 3.5–25.5 min, from phenolic acids to oligomers. In this case, as occurred in the profiling approach, the PCA model revealed that samples were mainly grouped according to their classes although some different samples were found in the same areas (see Figure S4). Various shorter ranges were investigated, and the best results were obtained when working in the time window from 6.2 to 16.0 min, which included the most important flavanolic compounds.
Chromatograms were further smoothed according to a Savitzky–Golay filter (order 2 and 15-point window). Finally, chromatograms were scaled by vector normalization to equalize the influence of each sample regardless the overall concentration of analytes. Normalization was applied by dividing each absorbance value throughout the chromatogram by the vector norm, in other words, square root of the sum of squares.
PCA results from the filtered dataset are depicted in Figure 4. As can be seen, cranberry and artichoke samples were found in compact groups on the top and left parts of the graph, respectively, which suggested that the composition of these samples was quite homogenous within each class. Some raspberry samples as well as antiox and red grape products were distributed on the right side of the graph. The study and interpretation of the loading vectors here were more complex. In this regard, catechin seemed to have a high weight in PC1 while procyanidin A2 and epicatechin mainly influenced PC2 (see Figure 4b).
In the Supplementary Materials, Figure S5 summarizes the PLS-DA results, showing a more marked sample structuration according to the type of products; in this case, the optimum number of latent variables established from Venetian blinds cross validation was 7, which again indicated the great complexity of the FLD chromatographic fingerprints.

4. Conclusions

This paper reports the development and application of a new HILIC with FLD method for the characterization of various nutraceutical samples based on red and black berries and other plant products with beneficial health attributes. FLD has shown improved performance in terms of selectivity and sensitivity with respect to UV detection. In particular, most of the hydroxycinnamic acids, stilbenoids and flavonoids do not interfere with the determination of flavanols while only a limited group of hydroxybenzoic compounds and flavanones can be detected under the selected FLD conditions. The separation relies on HILIC mode on a silica column using acidified acetonitrile and methanol as the components of the mobile phase. The elution gradient, based on increasing the percentage of methanol, has been carefully optimized by experimental design, being the number of compounds resolved chromatographically and the retention time of the last analyte peak of the objective responses to be considered. Compared to the reversed-phase mode, HILIC separation offers improved possibilities for the resolution of oligomers depending on size features. With respect to normal phase separations, the method proposed here uses common chromatographic solvents (acetonitrile and methanol) and provides improved analytical features with respect to analysis time and separation performance. In this regard, although an exhaustive study of the small phenolic acid molecules is beyond the scope of the work, preliminary HILIC results show promising expectations. Chemometric methods have been used for a more comprehensive characterization of nutraceuticals and functional foods, exploring compositional profiles and chromatographic fingerprints as the source of information. Principal component analysis and partial least squares discriminant analysis have provided great descriptions of the behavior of samples as well as some chemical markers of the different classes. Overall, HILIC-FLD has been found to be an excellent technique for implementing this application, opening up new possibilities in the analysis of phenolic compounds.

Supplementary Materials

The following are available online at https://0-www-mdpi-com.brum.beds.ac.uk/2297-8739/8/2/17/s1, Figure S1. Scheme of some relevant analytes. 1 = catechin; 2 = epicatechin; 3 = procyanidin A2; 4 = procyanidin B2; 5 = procyanidin C1. Figure S2. Characterization of nutraceuticals and dietary supplements by PCA using the compositional profiles of all relevant peaks as the data. (a) Scatter plot of scores of PC1 vs. PC2; (b) scatter plot of loadings of PC1 vs. PC2. Sample assignation: triangle (vertex down) = cranberry; triangle (vertex up) = red grape; rhombus = artichoke; cross = grapevine; square = raspberry; asterisk = antiox; circle = QCs. Figure S3. Characterization of nutraceuticals and dietary supplements by PLS-DA using the compositional profiles of flavanols as the data. (a) Estimation of the number of latent variables by Venetian blinds cross validation (arrow indicates the selected number of LVs which provides the minimum prediction error); (b) scatter plot of scores of PC1 vs. PC2; (c) scatter plot of loadings of PC1 vs. PC2. Sample assignation: see Figure S2. Figure S4. Scatter plot of scores of PC1 vs. PC2 vs. PC3 for the characterization of nutraceuticals and dietary supplements by PCA using the chromatographic fingerprints in the time range 3.5 to 25.5 min as the data. Sample assignation: see Figure S2. Figure S5. Characterization of nutraceuticals and dietary supplements by PLS-DA using the chromatographic fingerprints in the time range 6.2–12 min as the data. (a) Estimation of the number of latent variables by Venetian blinds cross validation (arrow indicates the selected number of LVs which provides the minimum prediction error); (b) scatter plot of scores of PC1 vs. PC2. Sample assignation: see Figure S2. Table S1. Peak features of selected compounds from estimated form the analysis of the QC samples (n = 10).

Author Contributions

Conceptualization, O.N. and J.S.; Data curation, J.S.; Investigation, O.V.-C. and K.A.-A.; Methodology, O.V.-C. and K.A.-A.; Supervision, O.N. and J.S.; Writing—original draft, O.V.-C. and J.S.; Writing—review & editing, O.V.-C., O.N. and J.S. All authors have read and agreed to the published version of the manuscript.

Funding

This research was supported by the Spanish Ministry of Science and Innovation under the project PGC2018-095013-B-I00) and by the Agency for Administration of University and Research Grants (Generalitat de Catalunya, Spain) under the projects 2017SGR-171 and 2017SGR-310.

Institutional Review Board Statement

Not applicable.

Informed Consent Statement

Not applicable.

Data Availability Statement

Data is available upon request to the authors.

Conflicts of Interest

The authors declare no conflict of interest.

References

  1. Chen, A.Y.; Chen, Y.C. A Review of the Dietary Flavonoid, Kaempferol on Human Health and Cancer Chemoprevention. Food Chem. 2013, 138, 2099–2107. [Google Scholar] [CrossRef] [Green Version]
  2. Shahidi, F.; Ambigaipalan, P. Phenolics and Polyphenolics in Foods, Beverages and Spices: Antioxidant Activity and Health Effects—A Review. J. Funct. Foods 2015, 18, 820–897. [Google Scholar] [CrossRef]
  3. Prior, R.L.; Gu, L. Occurrence and Biological Significance of Proanthocyanidins in the American Diet. Phytochemistry 2005, 6, 2264–2280. [Google Scholar] [CrossRef]
  4. Caillet, S.; Côté, J.; Sylvain, J.F.; Lacroix, M. Antimicrobial Effects of Fractions from Cranberry Products on the Growth of Seven Pathogenic Bacteria. Food Control 2012, 23, 419–428. [Google Scholar] [CrossRef]
  5. Gramza-Michałowska, A.; Sidor, A.; Kulczyński, B. Berries as a Potential Anti-Influenza Factor—A Review. J. Funct. Foods 2017, 37, 116–137. [Google Scholar] [CrossRef]
  6. Vidal-Casanella, O.; Nuñez, O.; Hernández-Cassou, S.; Saurina, J. Assessment of Experimental Factors Affecting the Sensitivity and Selectivity of the Spectrophotometric Estimation of Proanthocyanidins in Foods and Nutraceuticals. Food Anal. Methods 2020. [Google Scholar] [CrossRef]
  7. Sertić, M.; Mornar, A.; Nigović, B. A Rapid Profiling of Hypolipidemic Agents in Dietary Supplements by Direct Injection Tandem Mass Spectrometry. J. Food Compos. Anal. 2014, 34, 68–74. [Google Scholar] [CrossRef]
  8. Sá, R.R.; Matos, R.A.; Silva, V.C.; da Cruz Caldas, J.; da Silva Sauthier, M.C.; dos Santos, W.N.L.; Magalhães, H.I.F.; de Freitas Santos Júnior, A. Determination of Bioactive Phenolics in Herbal Medicines Containing Cynara Scolymus, Maytenus Ilicifolia Mart Ex Reiss and Ptychopetalum Uncinatum by HPLC-DAD. Microchem. J. 2017, 135, 10–15. [Google Scholar] [CrossRef]
  9. Lucci, P.; Saurina, J.; Núñez, O. Trends in LC-MS and LC-HRMS Analysis and Characterization of Polyphenols in Food. TrAC Trends Anal. Chem. 2017, 88, 1–24. [Google Scholar] [CrossRef] [Green Version]
  10. Andersen, O.M.; Markham, K.R. Flavonoids: Chemistry, Biochemistry and Application, 1st ed.; Taylor & Francis: Boca Raton, FL, USA, 2006; pp. 553–617. [Google Scholar]
  11. Vasileiou, I.; Katsargyris, A.; Theocharis, S.; Giaginis, C. Current Clinical Status on the Preventive Effects of Cranberry Consumption against Urinary Tract Infections. Nutr. Res. 2013, 33, 595–607. [Google Scholar] [CrossRef]
  12. Hammerstone, J.F.; Lazarus, S.A.; Mitchell, A.E.; Rucker, R.; Schmitz, H.H. Identification of Procyanidins in Cocoa (Theobroma Cacao) and Chocolate Using High-Performance Liquid Chromatography/Mass Spectrometry. J. Agric. Food Chem. 1999, 47, 490–496. [Google Scholar] [CrossRef] [PubMed]
  13. Prior, R.L.; Lazarus, S.A.; Cao, G.; Muccitelli, H.; Hammerstone, J.F. Identification of Procyanidins and Anthocyanins in Blueberries and Cranberries (Vaccinium Spp.) Using High-Performance Liquid Chromatography/Mass Spectrometry. J. Agric. Food Chem. 2001, 49, 1270–1276. [Google Scholar] [CrossRef]
  14. Saurina, J.; Sentellas, S. Liquid Chromatography Coupled to Mass Spectrometry for Metabolite Profiling in the Field of Drug Discovery. Expert Opin. Drug Discov. 2019, 14, 469–483. [Google Scholar] [CrossRef]
  15. Racine, K.C.; Lee, A.H.; Stewart, A.C.; Blakeslee, K.W.; Neilson, A.P. Development of a Rapid Ultra Performance Hydrophilic Interaction Liquid Chromatography Tandem Mass Spectrometry Method for Procyanidins with Enhanced Ionization Efficiency. J. Chromatogr. A 2019, 1594, 54–64. [Google Scholar] [CrossRef]
  16. Yang, W.; Ma, X.; Laaksonen, O.; He, W.; Kallio, H.; Yang, B. Effects of Latitude and Weather Conditions on Proanthocyanidins in Blackcurrant (Ribes Nigrum) of Finnish Commercial Cultivars. J. Agric. Food Chem. 2019, 67, 14038–14047. [Google Scholar] [CrossRef]
  17. Yang, W.; Laaksonen, O.; Kallio, H.; Yang, B. Effects of Latitude and Weather Conditions on Proanthocyanidins in Berries of Finnish Wild and Cultivated Sea Buckthorn (Hippophaë rhamnoides L. Ssp. Rhamnoides). Food Chem. 2017, 216, 87–96. [Google Scholar] [CrossRef] [PubMed]
  18. Hollands, W.J.; Voorspoels, S.; Jacobs, G.; Aaby, K.; Meisland, A.; Garcia-Villalba, R.; Tomas-Barberan, F.; Piskula, M.K.; Mawson, D.; Vovk, I.; et al. Development, Validation and Evaluation of an Analytical Method for the Determination of Monomeric and Oligomeric Procyanidins in Apple Extracts. J. Chromatogr. A 2017, 1495, 46–56. [Google Scholar] [CrossRef]
  19. Sommella, E.; Pepe, G.; Pagano, F.; Ostacolo, C.; Tenore, G.C.; Russo, M.T.; Novellino, E.; Manfra, M.; Campiglia, P. Detailed Polyphenolic Profiling of Annurca Apple (M. pumila Miller Cv Annurca) by a Combination of RP-UHPLC and HILIC, Both Hyphenated to IT-TOF Mass Spectrometry. Food Res. Int. 2015, 76, 466–477. [Google Scholar] [CrossRef] [PubMed]
  20. Ma, Y.; Kosińska-Cagnazzo, A.; Kerr, W.L.; Amarowicz, R.; Swanson, R.B.; Pegg, R.B. Separation and Characterization of Phenolic Compounds from Dry-Blanched Peanut Skins by Liquid Chromatography-Electrospray Ionization Mass Spectrometry. J. Chromatogr. A 2014, 1356, 64–81. [Google Scholar] [CrossRef] [PubMed]
  21. Bakhytkyzy, I.; Nuñez, O.; Saurina, J. Determination of Flavanols by Liquid Chromatography with Fluorescence Detection. Application to the Characterization of Cranberry-Based Pharmaceuticals through Profiling and Fingerprinting Approaches. J. Pharm. Biomed. Anal. 2018, 156, 206–213. [Google Scholar] [CrossRef]
  22. Bakhytkyzy, I.; Nuñez, O.; Saurina, J. Size Exclusion Coupled to Reversed Phase Liquid Chromatography for the Characterization of Cranberry Products. Food Anal. Methods 2019, 12, 604–611. [Google Scholar] [CrossRef] [Green Version]
  23. Gu, L.; Kelm, M.; Hammerstone, J.F.; Beecher, G.; Cunningham, D.; Vannozzi, S.; Prior, R.L. Fractionation of Polymeric Procyanidins from Lowbush Blueberry and Quantification of Procyanidins in Selected Foods with an Optimized Normal-Phase HPLC-MS Fluorescent Detection Method. J. Agric. Food Chem. 2002, 50, 4852–4860. [Google Scholar] [CrossRef] [PubMed]
  24. Navarro, M.; Nunez, O.; Saurina, J.; Hernandez-Cassou, S.; Puignou, L. Characterization of Fruit Products by Capillary Zone Electrophoresis and Liquid Chromatography Using the Compositional Profiles of Polyphenols: Application to Authentication of Natural Extracts. J. Agric. Food Chem. 2014, 62, 1038–1046. [Google Scholar] [CrossRef] [Green Version]
  25. Barbosa, S.; Pardo-Mates, N.; Hidalgo-Serrano, M.; Saurina, J.; Puignou, L.; Nunez, O. Detection and Quantitation of Frauds in the Authentication of Cranberry-Based Extracts by UHPLC-HRMS (Orbitrap) Polyphenolic Profiling and Multivariate Calibration Methods. J. Agric. Food Chem. 2018, 66, 9353–9365. [Google Scholar] [CrossRef] [PubMed] [Green Version]
Figure 1. Optimization of the HILIC separation gradient by 2-factor at 3-level experimental design using a cranberry extract as a representative sample. Experimental factors and levels: Initial methanol percentage (10, 15 and 20% methanol) and gradient time (30, 45 and 60 min). Optimization criterion: Maximum number of resolved peaks on the fastest analysis. (a) Number of compounds resolved; (b) retention time of the last analyte peak and (c) effect of initial methanol percentage and gradient time on the separation of flavanol-related components expressed as a desirability function.
Separations 08 00017 g001
Figure 2. Representative chromatograms of various nutraceutical samples obtained by the HILIC with fluorescence detection. Sample assignation: deep blue = antiox; orange = cranberry; blue = cranberry (combined); green = artichoke; light blue = red grape (peel and seeds); grey = raspberry and yellow = grapevine. Compound assignation from standards: 1 = catechin; 2 = epicatechin; 3 = procyanidin A2; 4 = procyanidin B2 and 5 = procyanidin C1. Tentative compound assignation: a = phenolic acids; b = other flavonoids; c = trimers (tr1 = trimer 1); d = tetramers (te1 = tetramer 1; te2 = tetramer 2); e = pentamers and f = hexamers.
Separations 08 00017 g002
Figure 3. Characterization of nutraceuticals and dietary supplements by principal component analysis (PCA) using the compositional profiles of flavanols as the data. (a) Scatter plot of scores of PC1 vs. PC2; (b) scatter plot of loadings of PC1 vs. PC2. Sample assignation: triangle (vertex down) = cranberry; triangle (vertex up) = red grape; rhombus = artichoke; cross = grapevine; square = raspberry; asterisk = antiox and circle = QCs.
Separations 08 00017 g003
Figure 4. Characterization of nutraceuticals and dietary supplements by PCA using the chromatographic fingerprints in the time range 6.2–16 min as the data. (a) Scatter plot of scores of PC1 vs. PC2 and (b) plot of loadings of PC1 and PC2. PC assignation: black = PC1 and blue = PC2. Sample assignation: see Figure 3.
Separations 08 00017 g004
Publisher’s Note: MDPI stays neutral with regard to jurisdictional claims in published maps and institutional affiliations.

