Article

ESI–LC–MS/MS for Therapeutic Drug Monitoring of Binary Mixture of Pregabalin and Tramadol: Human Plasma and Urine Applications

1
Department of Pharmaceutical Chemistry, College of Pharmacy, Taif University, P.O. Box 11099, Taif 21944, Saudi Arabia
2
Addiction and Neuroscience Research Unit, College of Pharmacy, Taif University, Al-Hawiah, Taif 21944, Saudi Arabia
3
Analytical Toxicology Laboratory, Forensic Medicine Authority, Ministry of Justice, Cairo 11647, Egypt
4
Forensic Medicine Department, Faculty of Medicine, Beni-Suef University, Beni-Suef 62514, Egypt
5
Analytical Chemistry Department, Faculty of Pharmacy, Cairo University, Cairo 11562, Egypt
6
Faculty of Pharmacy, October 6 University, October 6 City, Giza 12566, Egypt
7
Pharmaceutical Analytical Chemistry Department, Faculty of Pharmacy, Beni-Suef University, Alshaheed Shehata Ahmad Hegazy St., Beni-Suef 62514, Egypt
*
Author to whom correspondence should be addressed.
Equally contributing first authors.
Submission received: 24 January 2021 / Revised: 10 February 2021 / Accepted: 10 February 2021 / Published: 13 February 2021

Abstract

:
Tramadol (TRM) and pregabalin (PGB) are frequently used in combination for neuropathic pain management. Accordingly, a selective and sensitive high-performance liquid chromatography–electrospray ionization–mass/mass spectrometric (ESI–LC–MS/MS) method is presented for determination of TRM and PGB, whether in pure forms or human biological fluids (plasma/urine), using gabapentin (GBP) (IS) as the internal standard. Chromatographic separation was effected in total run time of 2.5 min, on Phenomenex Luna® Omega 1.6 um polar C18 (LC 150 × 2.1 mm) column with a mobile phase of methanol/water (70:30, v/v), 0.1% (v/v) formic acid at a flow rate of 0.3 mL/min. Ionization of the analytes was obtained using electrospray in the positive ion mode (ESI+). The MS/MS detection was performed by monitoring the fragments for TRM, PGB and GBP on a triple quadrupole mass spectrometer. Assay calibration was over the range of 10–1000 ng mL−1 for TRM and PGB with the correlation coefficients over 0.999 in pure form, human plasma and urine spiked with the studied compounds. Validation data showed the inter-run relative standard deviations (RSDs) were less than 4.3% for TRM and 3.8% for PGB, whereas the intra-run RSDs were less than 3.7% for TRM and 3.6% for PGB. The mean extraction recoveries for TRM and PGB were in the ranges of 86.51–93.38% and 86.20–92.42%. This method was successfully performed on real plasma and urine samples taken from neuropathic patients and proved to be an applicable method for routine therapeutic drug monitoring of the proposed drug combination.

1. Introduction

As per the “International Association for Study of Pain (IASP)”, neuropathic pain is “pain caused by a lesion or disease of the somatosensory system” [1]. According to recommendations for pharmacological management of neuropathic pain guidelines, the first-line treatment for neuropathic control is antidepressants, α2δ modulators of calcium channel (i.e., PGB and GBP) and finally topical lidocaine. The recommended second-line treatment is opioid analgesics (TRM) but in limited clinical cases they are preferred as first-line treatments [2,3].
In most cases of neuropathic pain, monotherapy prescribed drugs have side effects and limited efficacy. Hence, combination of different drugs is considered to enhance analgesic efficacy and minimize side effects as much as possible (as synergistic interaction permits dose reduction of the combined prescribed drugs) [4]. Combination of pregabalin and tramadol is one of the most important drug combinations for treating neuropathic pain, especially for postherpetic neuralgia and painful polyneuropathy [5,6]. They are also prevalent drugs of abuse detected in forensic cases of crime and suicide.
Accordingly, this presented study introduces an analytical assay for routine simple therapeutic monitoring of the combination of TRM and PGB, as a preliminary clinical study to support future clinical pharmacokinetic studies.
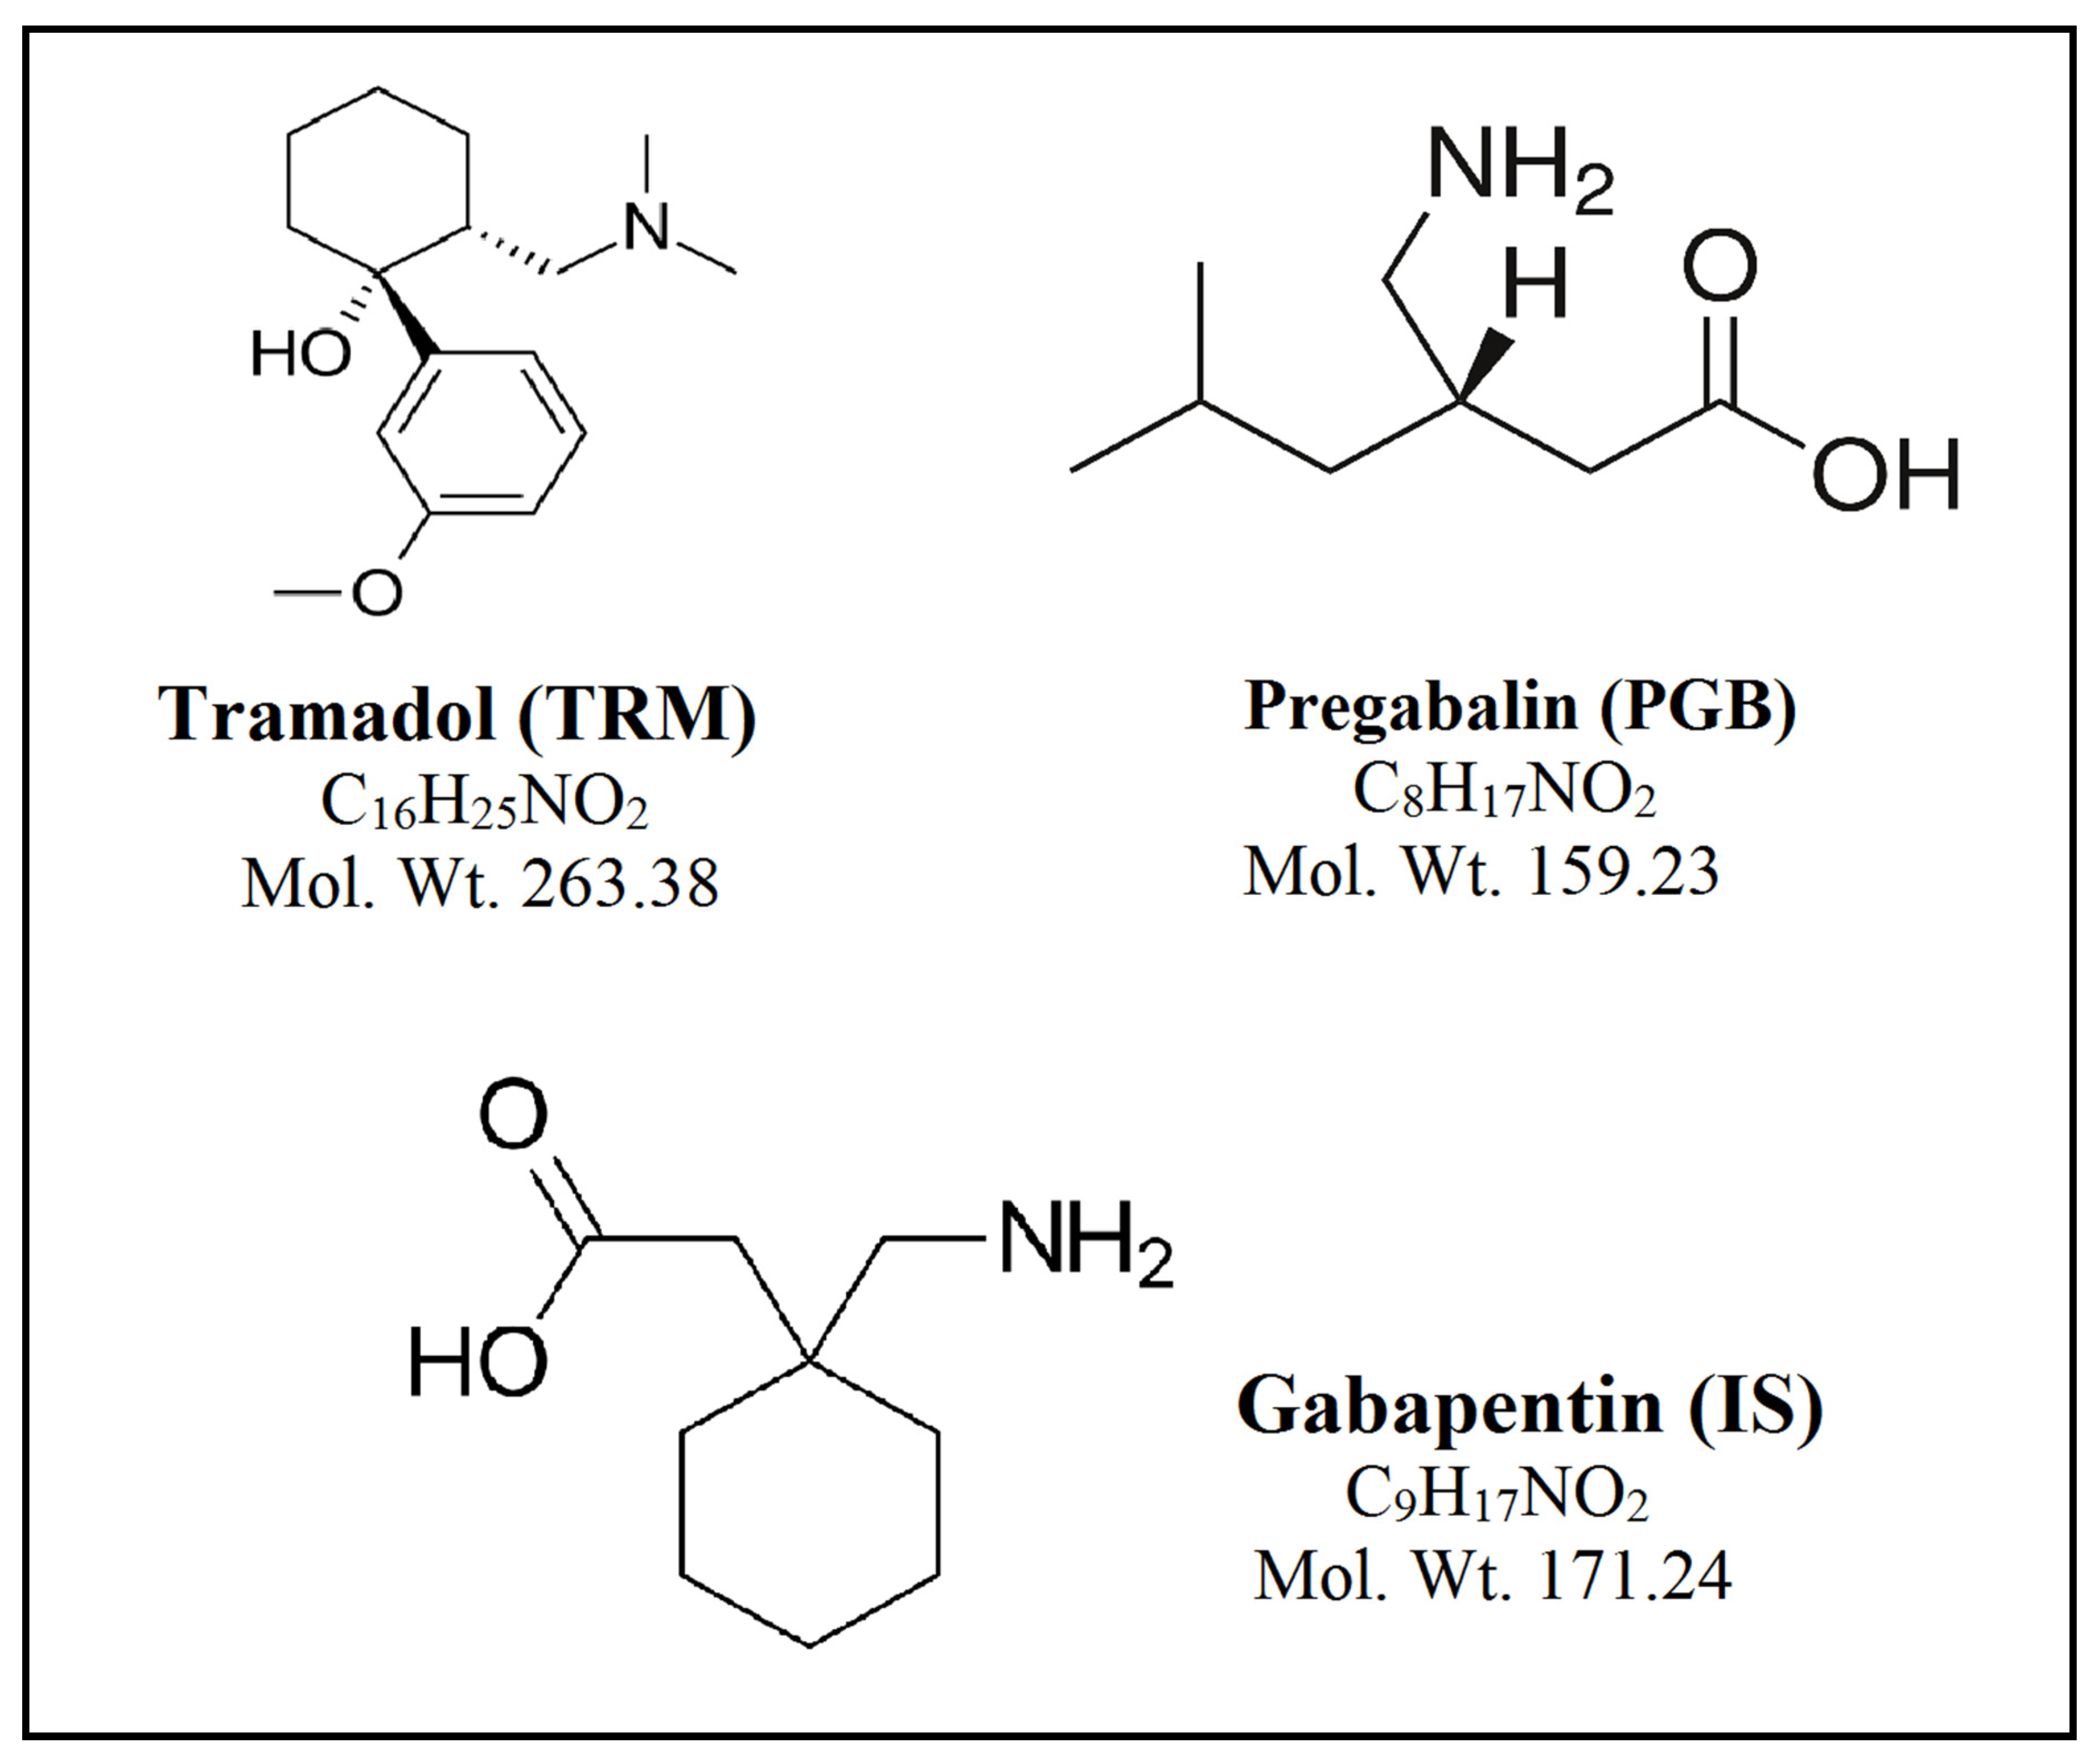
TRM, (1RS, 2RS)-2-[(dimethylamino)methyl] -1-(3-methoxyphenyl)cyclohexanol, is a centrally acting synthetic analgesic drug, Figure 1. It is used globally for the treatment of moderate to severe pain, including neuropathic pain, as an alternative to opioid analgesics [7]. TRM is considered a relatively safe drug with a low abuse potential and so low potential for dependence relative to morphine [8]. Following oral administration, TRM is completely absorbed (<90%) with average bioavailability of nearly 70%. Ninety percent of oral TRM is eliminated in urine and 10% in feces, while 30% of a TRM oral dose is excreted as the unchanged drug in urine [9].
The British Pharmacopoeia has described a non-aqueous titration technique for detecting TRM potentiometrically [10]. The literature review revealed different analytical methods for TRM determination, either in biological fluids or pharmaceutical preparations, including HPLC [11,12,13,14], LC-MS [15,16,17], GC-MS [18,19], TLC [20], spectrophotometry [21], ion-selective electrode [22] and voltammetry [23].
PGB, (S)-3-(amino methyl)-5-methylhexanoic acid, is a neurotransmitter γ-amino-butyric acid (GABA) structural analogue, which was used in common as an antiepileptic and analgesic drug, Figure 1. The European Federation of Neurological Societies recommendations are using PGB as a first-line treatment for management of pain with patients suffering post-herpetic neuralgia, central neuropathic pain, and painful diabetic neuropathy [24]. There are few reported analytical methods for assay of PGB in biological fluids and pharmaceuticals involving GC–MS [25,26], LC–MS [27,28,29], HPLC [30,31,32,33], spectrophotometry [34] and TLC [35,36]. After oral intake, PGB is rapidly absorbed with high bioavailability of more than 90% [37]. It is not metabolized in humans and is almost entirely excreted unchanged in urine (<90%). Therapeutic plasma levels of PGB range between 0.3 and 14 mg/L [38].
There are few reported methods for analysis of PGB in human plasma or human urine by HPLC after precolumn derivatization using different derivatizing agents [30,31,32]. In practice, derivatization is considered a tedious technique which requires extra steps and strictly maintained conditions to obtain accurate estimation of the analyte [27]. On the other hand, the LC separation of TRM using ultraviolet or fluorescence detection often requires surfactants or electrolyte buffers with its technical problems of crystal formation in connecting detector cells and tubes as well as damaging of pump seals; besides, they cause suppression of analytes’ ionization in MS/MS analysis [17].
Though there are several reported methods for assay of TRM and PGB separately, there are not any published methods for their simultaneous determination. Hence, introduction of an analytical method that could analyze TRM and PGB simultaneously was a neat idea without the need for derivatization of PGB or using electrolyte buffers and surfactants for separation of TRM. LC–MS/MS, as an analytical method, has been widely trusted as a principal tool in the structural elucidation and quantitation of drugs due to its superior sensitivity, selectivity and efficiency. The proposed method offers advantages of sensitivity for analysis of TRM, whose therapeutic concentrations in plasma are low (70–592 ng mL−1) [39].
The objective of the presented study is to introduce the LC method for simultaneous quantification of the two analytes in pure form, spiked human plasma and human urine, using gabapentin (IS) as the internal standard and describing MS/MS detection with its high sensitivity and selectivity. Efficient sample preparation was required to achieve high method selectivity as an alternative to the time- and cost- consuming sample concentration and clean-up by solid-phase or liquid-liquid extraction. Accordingly, the work presented assayed the drugs in human spiked plasma and human urine samples by simple protein precipitation. Moreover, the method was applied for determination of TRM and PGB concentration in real human plasma and human urine samples taken from neuropathic pain patients treated by the drug therapy combination. A semi-quantitative greenness assessment was achieved using the eco-scale method for ensuring environmental safety of the proposed method [40].

2. Material and Methods

2.1. Pure Standards

TRM was supplied by “Sigmatec Pharmaceutical Industries, El Monofeya, Egypt”. PGB was kindly provided by “Eva Pharma, Cairo, Egypt”. Gabapentin (IS) was kindly obtained from “Delta Pharma, Cairo, Egypt”. Their purities were found to be 99.60%, 99.92% and 99.70%, respectively, according to analysis certificates issued by the companies.

2.2. Chemicals and Reagents

HPLC-grade methanol and formic acid were purchased from “Sigma-Aldrich Chemie, Germany”.
Deionized water was from “SEDICO Pharmaceuticals Co., Cairo, Egypt”.
Cellulose acetate syringe filters of 0.45 μm pore size were from “Gemma Medical, Barcelona, Spain”.
Human plasma and human urine were kindly gifted by “Beni-Suef University Hospital, Beni-Suef, Egypt”.

2.3. LC-MS/MS Instrumentation and Chromatographic Conditions

UPLC MS/MS “(Waters 3100, Milford, MA, USA)” was used utilizing a well-managed binary solvent pump “(Acquity Ultra Performance LC, Milford, MA, USA)”. Samples were injected with “Acquity Ultra Performance LC auto-sampler”. The LC system was coupled with “Acquity Ultra Performance LC triple quadrupole mass spectrometer detector (Acquity Ultra Performance LC, Milford, MA, USA)”. For data processing and acquisition, “MassLynx software version 4.1 (Waters Corporation, Milford, MA, USA)” was used. Chromatographic separation was achieved on “Phenomenex Luna® Omega 1.6um polar C18 (LC 150 × 2.1 mm) column (Phenomenex, Torrance, CA, USA)”. Elution of the analytes was achieved at room temperature with methanol–water (70:30, v/v) containing 0.1 volume percentage of formic acid as the mobile phase at 0.3 mL/min flow rate with a total run time not exceeding 2.5 min. per injection.
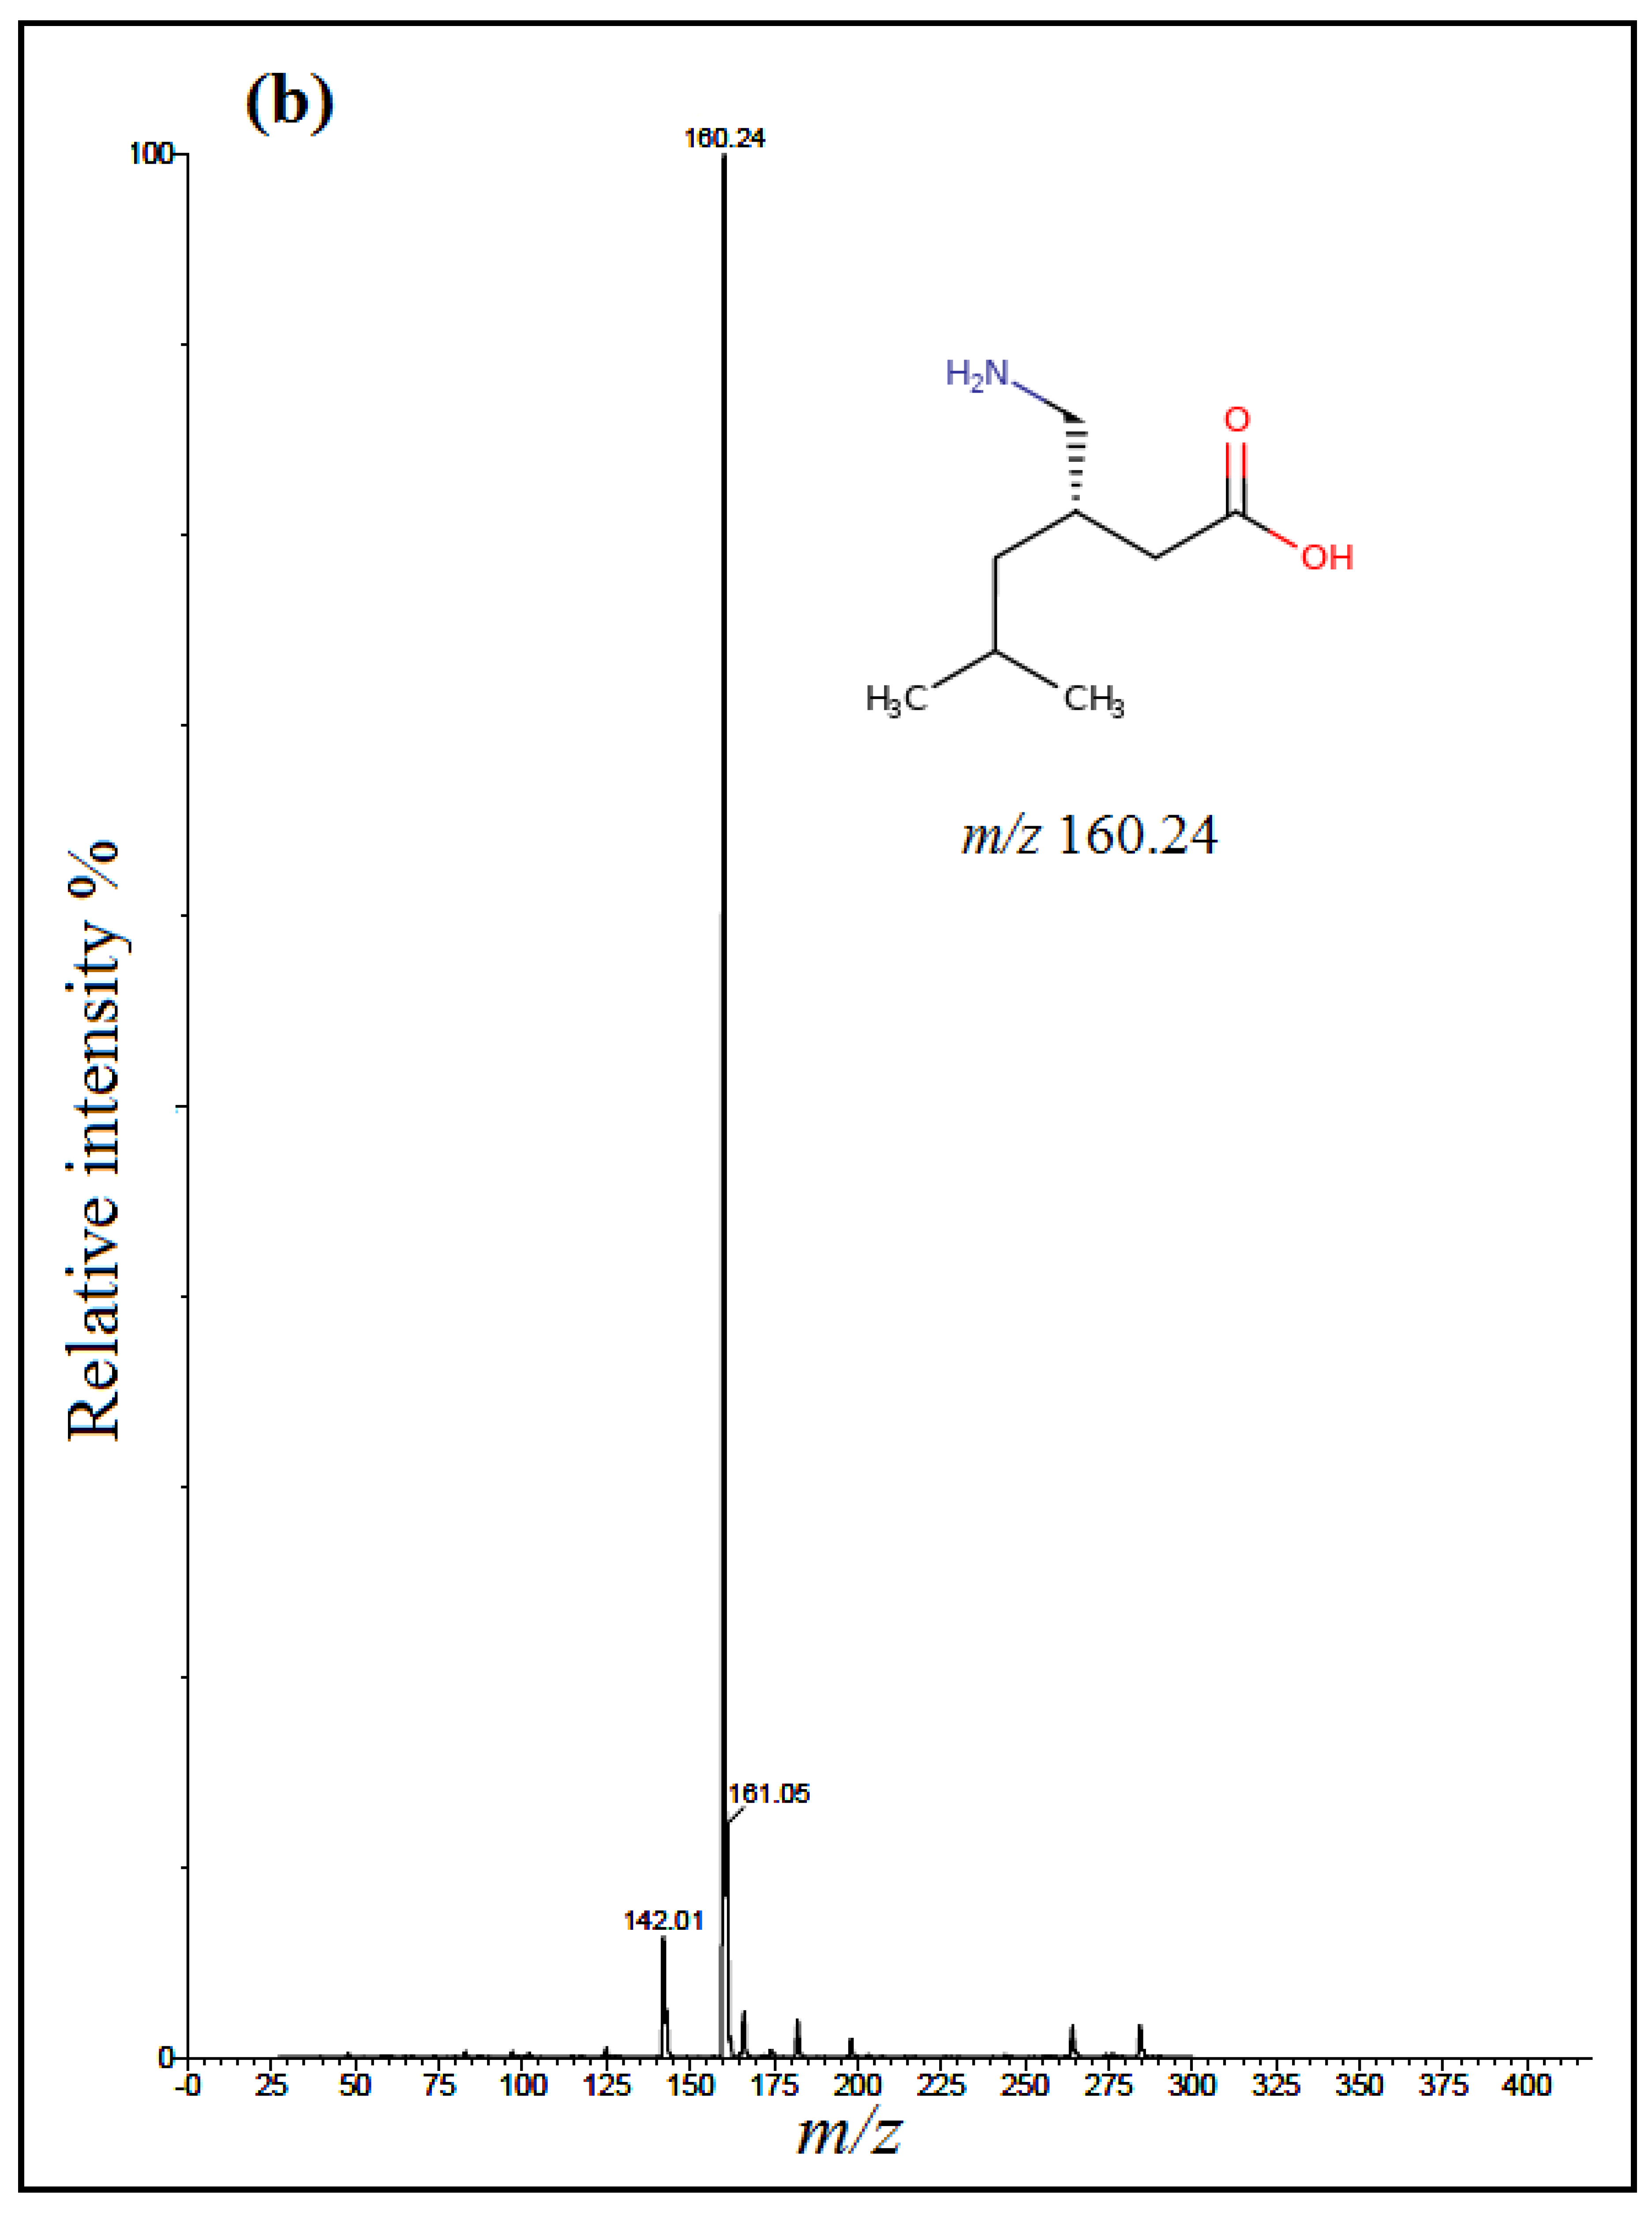
The detection of analytes was done using multiple-reaction mode (MRM) with an electrospray positive ionization (+ESI). Positive electrospray mass spectra showed intense [M + H]+ ions at m/z 263.89 for TRM, m/z 160.24 for PGB and m/z 171.95 for IS (
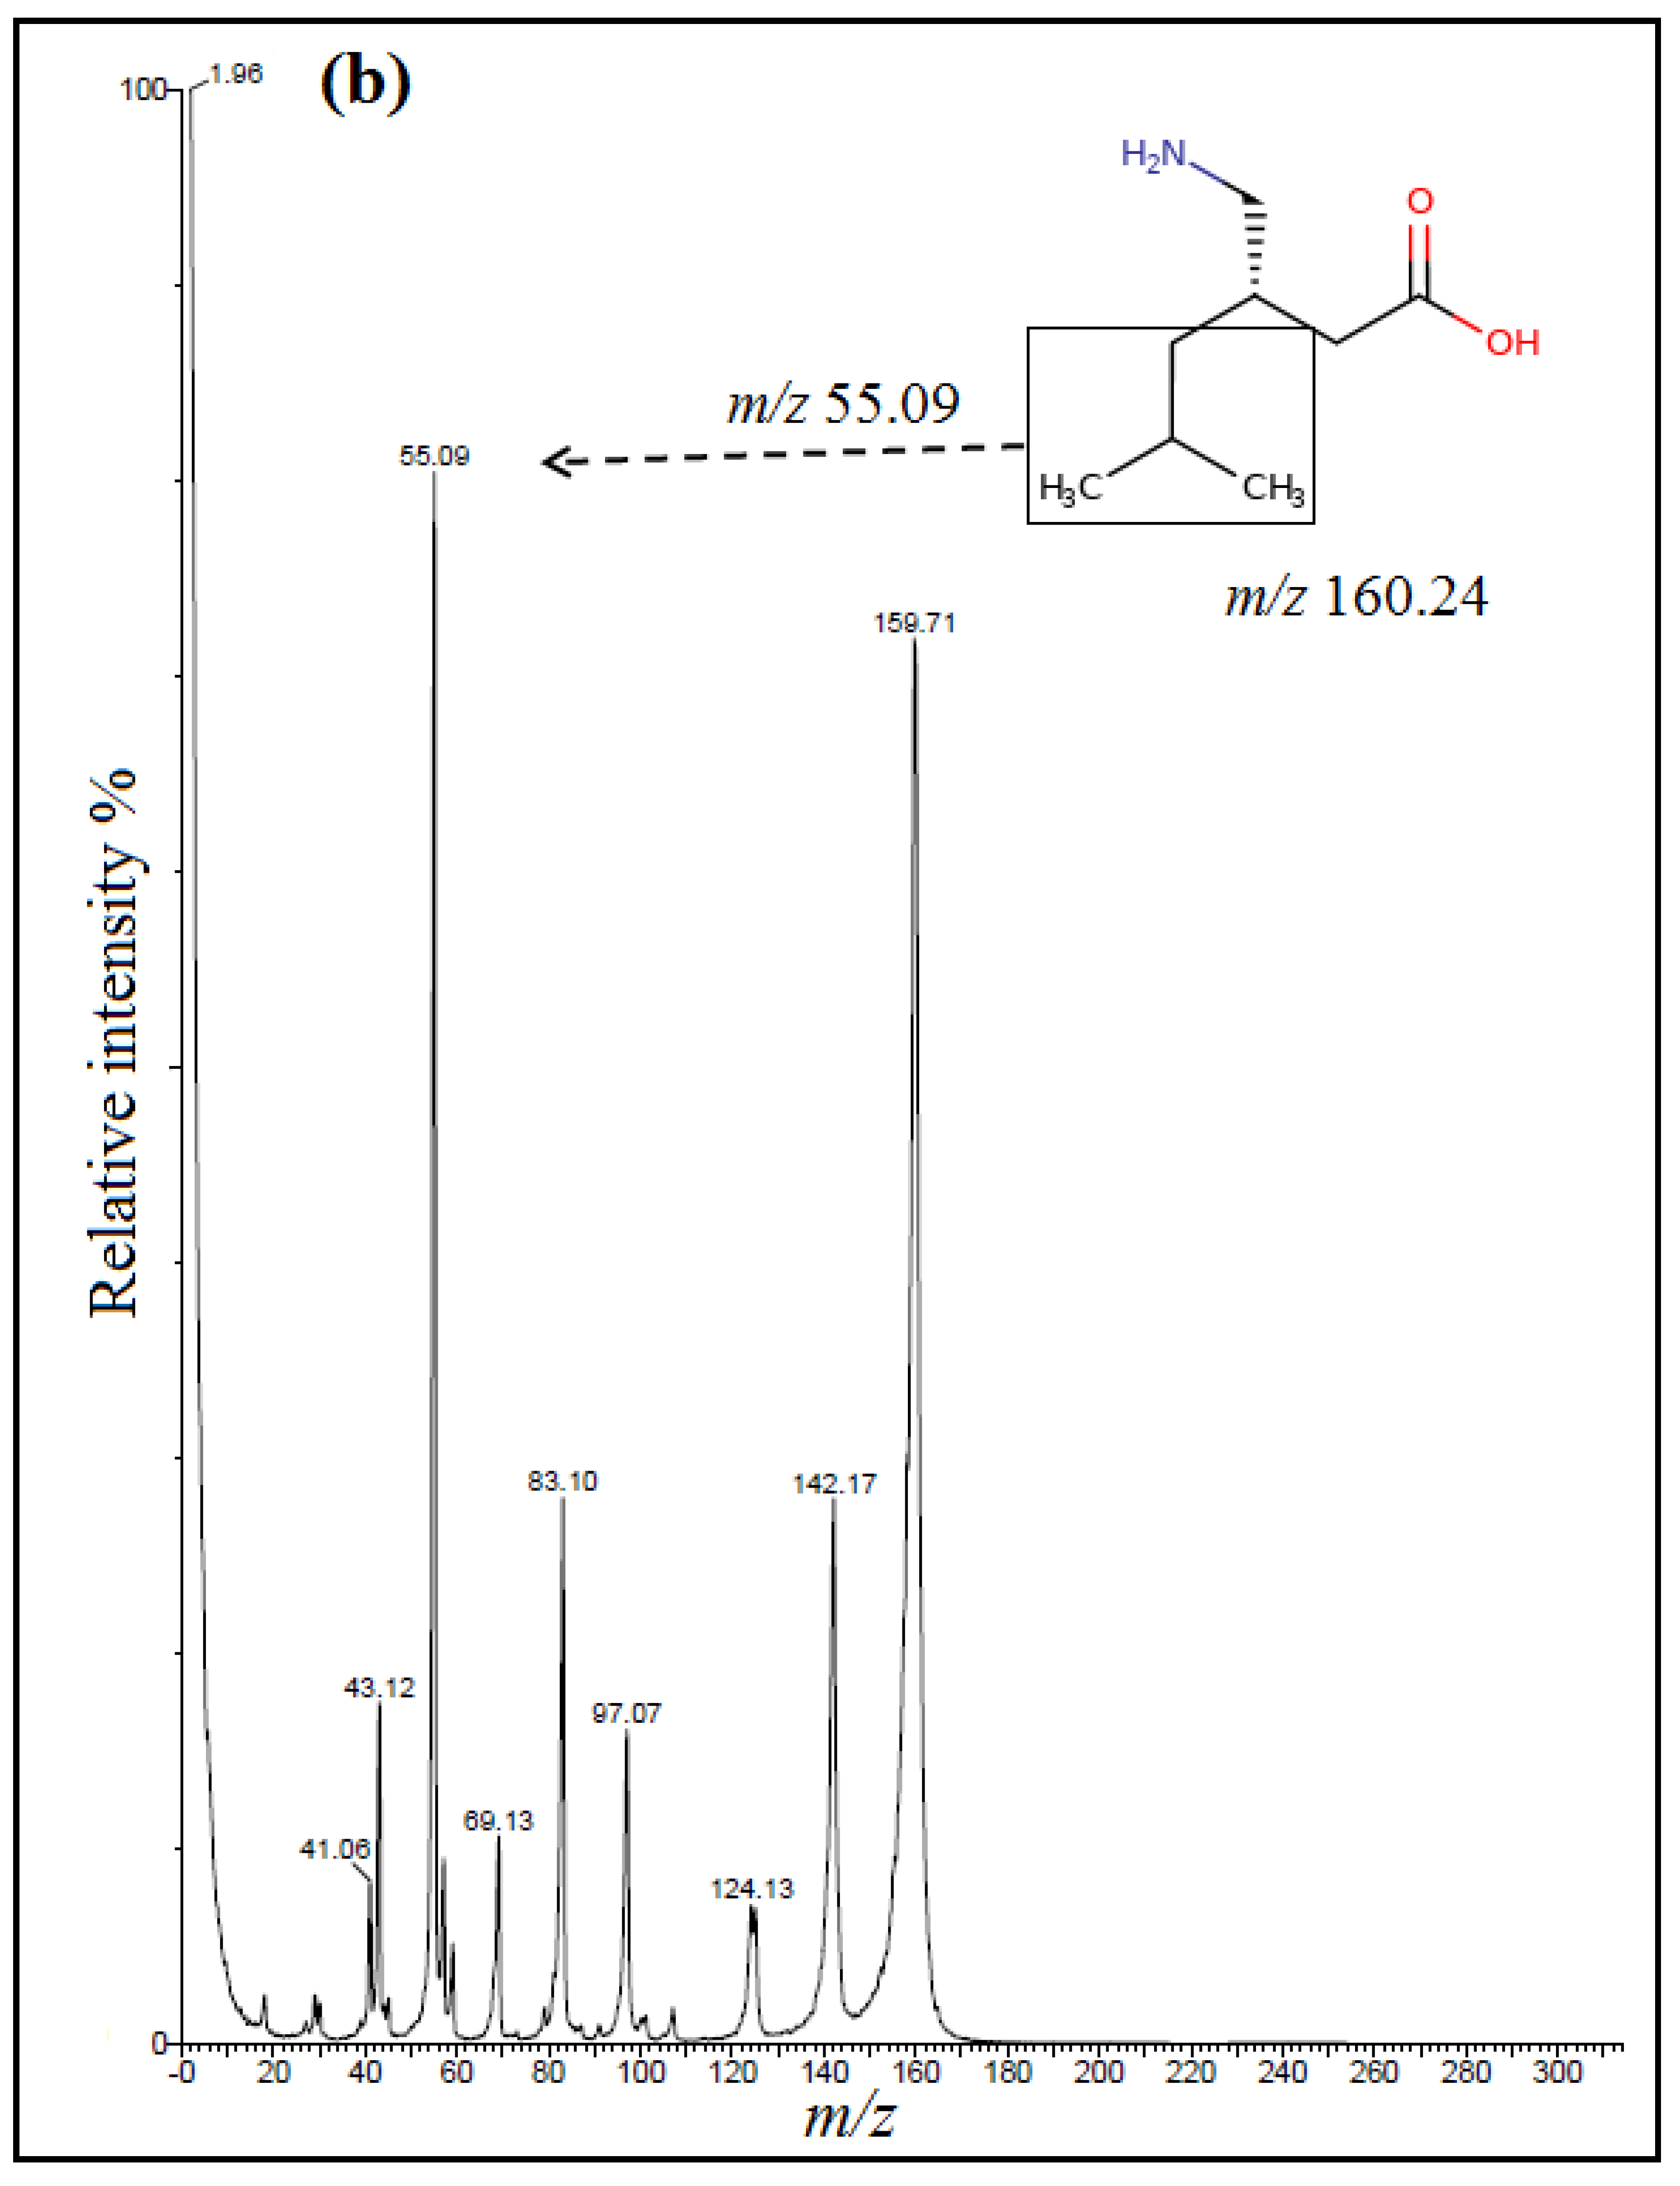
Figure 2); however, positively ionized fragments showed the product ions at m/z 58.13 for TRM, m/z 55.09 for PGB and m/z 67.12 for IS (Figure 3).
Collision energy and other drugs and instrumental parameters were optimized on their solutions using a concentration of 100 ng mL−1. The instrument was programmed for a scan dwell time of 0.104 s. The optimized collision energies and other parameters are presented in Table 1.

2.4. Standard Solutions

Stock standard solutions of TRM, PGB and IS (1 mg mL−1) were separately prepared in methanol and stored at −20 °C when not in use. Corresponding working solutions at 100 and 1 μg mL−1 were obtained by appropriate stock drug solution dilutions to prepare calibration curves and control samples. Drugs’ standard solutions were mixed to obtain final concentrations in ranges of 10–1000 ng mL−1 for TRM and PGB in pure form in mobile phase.
The three drugs’ concentration levels from calibration curves (low, medium and high) were separately prepared as control samples in biological matrices at concentrations of 30, 400 and 750 ng mL−1 for TRM and PGB.

2.5. Sample Preparation and Extraction Procedure

Standard calibration samples in biological matrices were daily prepared through spiking 450 µL drug-free human plasma or human urine and 50 µL of IS working solution with appropriate standard solutions of TRM and PGB to prepare six separate calibrators in the concentration ranges of 10–1000 ng mL−1 in human plasma and human urine (10, 50, 100, 250, 500, 1000 ng mL−1), and the concentration of IS in human plasma and human urine samples was 100 ng mL−1. Samples were vortexed for 30 s and then one mL of methanol was added to each sample, vortexed for 1 min, centrifuged at a speed of 3000 rpm for 30 min, filtered using 0.45 µm syringe filter, and 10 µL supernatant was injected into the column for analysis.

2.6. Method Validation

The proposed method study was validated as per FDA bioanalytical method validation guidelines [41] regarding selectivity, sensitivity, linearity, precision, accuracy, extraction efficiency and stability.
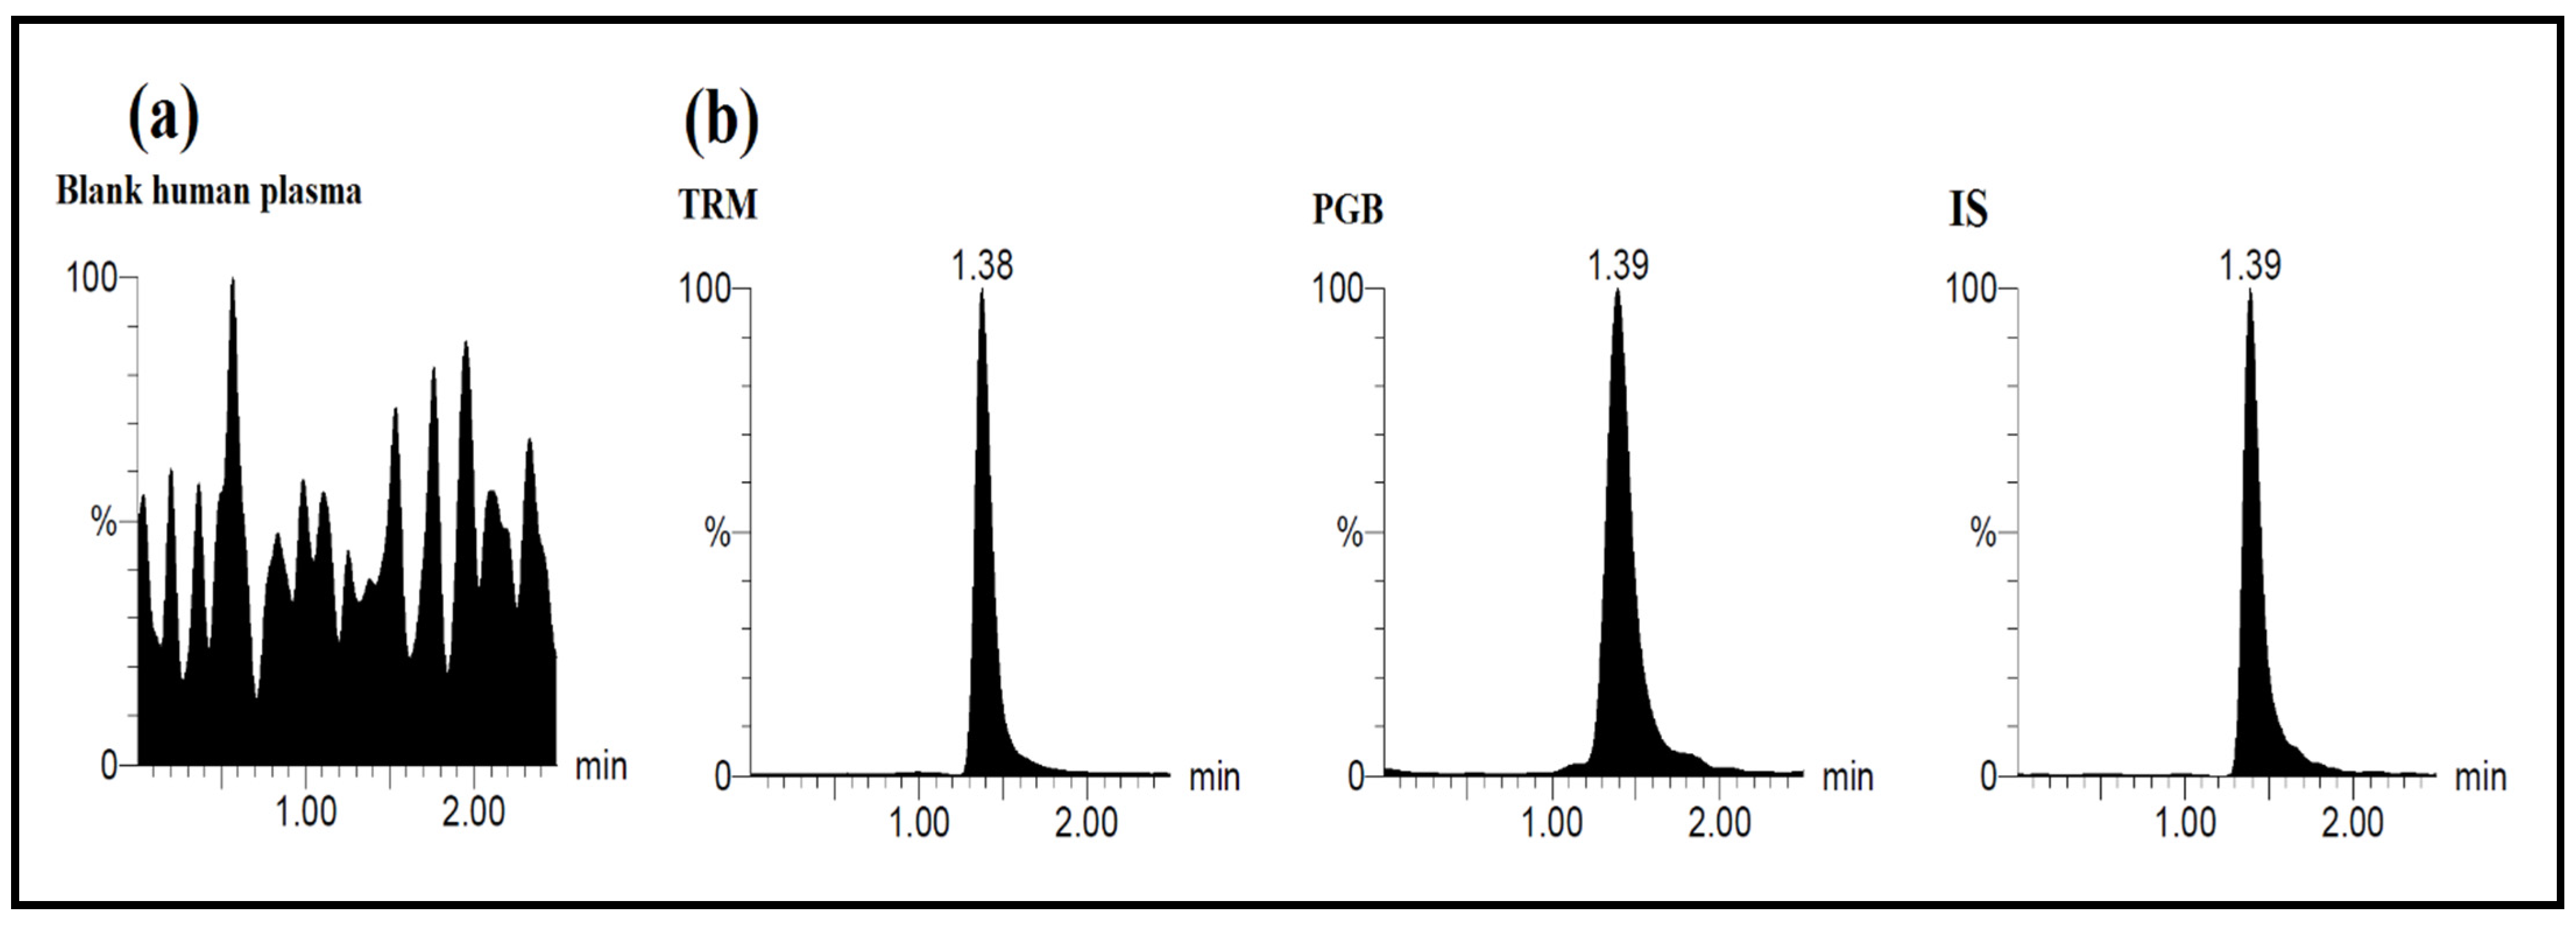
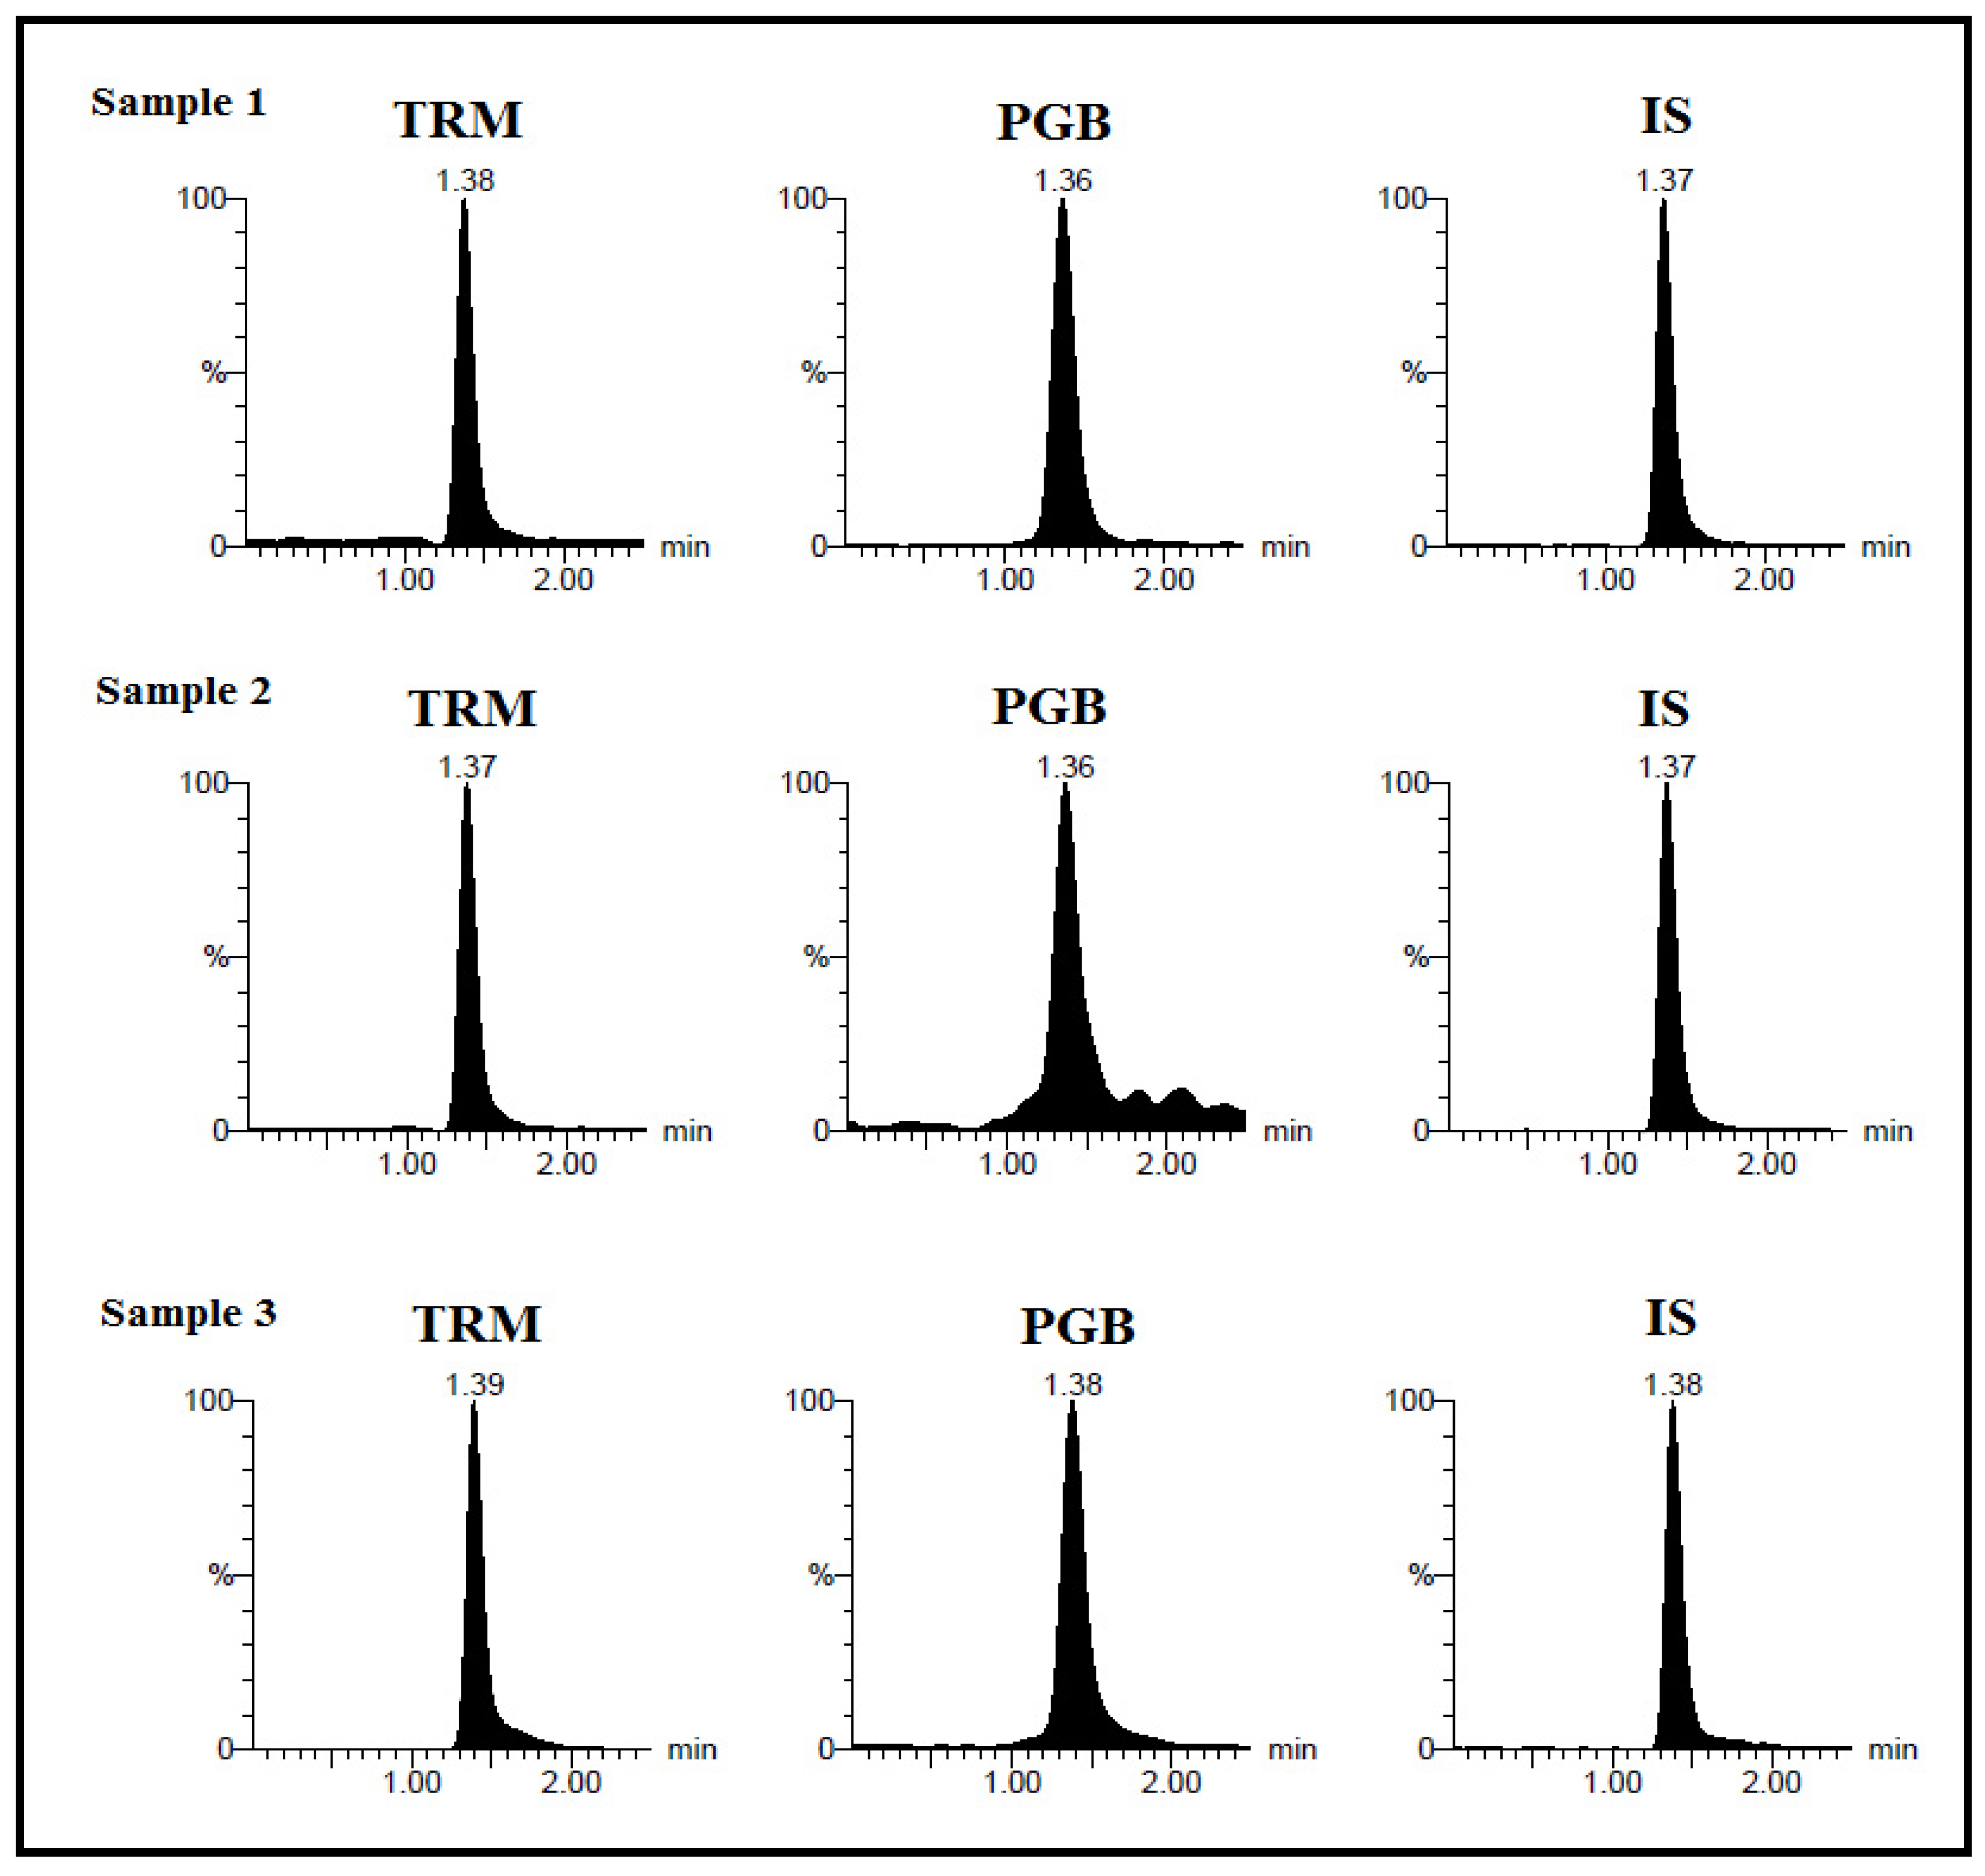
Assay selectivity was ascertained by assaying human blank plasma and urine samples to guarantee that no matrix endogenous interferences were encountered. Calibration standards of six concentrations of TRM and PGB (10, 50, 100, 250, 500, 1000 ng mL−1) were extracted and quantified. The peak area ratio of analytes/IS were calculated for establishment of calibration curves in spiked human plasma and human urine.
Linearity of analytes’ calibration curves was affirmed by drawing peak-area ratios versus the corresponding concentrations. Calibration curve was established and assayed along with the control samples.
Five sets of control samples were analyzed on five separate runs in a single day to evaluate the intra-day accuracy and precision (n = 5), while the inter-day data were estimated by analyzing each control sample in five successive days (n = 5). Method precision was calculated as (% RSD), whereas the accuracy was defined as the percent of target concentration of each analyte. Lower limit of quantification was determined at the lowest calibration standard, providing an accuracy and precision lower than 20% [41].
Tramadol and PGB recoveries of control samples from human plasma and human urine were evaluated to express extraction efficiency of the proposed method. It was estimated by comparing extracted analytes and IS peak areas to those of non-extracted reference solutions at the same concentration level (n = 5).
Human plasma/human urine stability of TRM and PGB was investigated at high and low control concentration levels by comparing data of analyzed samples after and before exposure to stability conditions. Control samples were kept at room temperature for 4 h, at 4 °C for 24 h and at −20 °C for 15 days, then analyzed for estimating short- and long-term stability (n = 5). Three freeze–thaw cycles were performed for studying the drugs’ stability in control samples where control samples were kept at –20 °C for 24 h, then thawed at room temperature, then refrozen for 24 h until completion of the three cycles.

2.7. Clinical Application

Following development and validation, the developed method’s applicability was tested by quantification of the two drugs in real human plasma and human urine samples of neuropathic patients treated with TRM and PGB followed by complete monitoring at “Beni-Suef University Hospital, Egypt”, with acceptance with serial no: REC-H-PhBSU-19001. The study was approved by the “ethics committee of the Faculty of Pharmacy, Beni-Suef University, Egypt”.

3. Results and Discussion

3.1. Development and Optimization of Developed LC Conditions

During method development, several mobile phase components were tested for achieving symmetric chromatographic peaks with optimum sensitivity. The experimental results indicated that adding 0.1% formic acid to the water could improve the peak shape and sensitivity to the analyte. The methanol ratio was being used at 60%, then increased to 70% to improve the ionization of the analytes. Additionally, MS/MS response to the analytes was enhanced while the retention time of TRM and PGB was shortened. Several flow rates of the mobile phase were tried as (0.2, 0.25, 0.3, 0.4 mL min−1) while 0.3 mL min−1 flow rate was proven to give maximum resolution of the resolved peaks with short total time of analysis. Finally, optimum sensitivity and short run time were achieved by the elution system of methanol–water (70:30, v/v) containing 0.1% formic acid as a mobile phase at a flow rate of 0.3 mL min−1. Typical MRM chromatograms are presented in Figure 4.

3.2. MS/MS Spectrometry

ESI–LC–MS/MS for the determination of TRM and PGB in human plasma and human urine using IS as the internal standard was investigated using the positive ion mode for their proton affinities; it was performed in the multiple-reaction mode (MRM). The test results showed that the base peak in the +ESI mass spectra of TRM, PGB and IS was its corresponding protonated molecule [M + H]+; scan mass spectra of drugs are represented in Figure 2a–c. Positive electrospray mass spectra of TRM showed a distinctive molecular [M + H]+ ion at m/z 263.89. After undergoing fragmentation in the collision cell using the optimized experimental conditions, the product ion at m/z 58.13 exhibited due to the formation of the fragment H2C=N+CH3CH3, as shown in Figure 3a. The protonated molecule of PGB [M + H]+ mass spectra was found at m/z 160.24, which was further fragmented to give the product ion of +HC=CCH3CH3 at m/z 55.09, as presented in Figure 3b. However, the molecular [M + H]+ ion mass spectra of IS was at m/z 171.95 and its product ion at m/z 67.12, as presented in Figure 3c.

3.3. Method Validation

3.3.1. Selectivity

Assay selectivity was checked by setting a comparison between the chromatogram of blank human plasma and human urine with the spiked samples using the developed procedure of extraction and chromatographic conditions to exclude any interference presented. Typical MRM chromatograms from the study of blank human plasma and human urine exhibit no interference peak in the MRM profiles of the studied compounds, as shown in Figure 5 and Figure 6.

3.3.2. Linearity and Lower Limit of Quantification

In pure form, the linearity of TRM and PGB was determined by relating peak areas against corresponding concentrations in the range of 10–1000 ng mL−1, at six calibration standards of both drugs at the levels of (10, 50, 100, 250, 500, 1000 ng mL−1). Their linearity in spiked human plasma and human urine was estimated by measuring the peak area ratio of analytes/IS versus corresponding concentration over the ranges of 10–1000 ng mL−1. The calibration curves were individually obtained for TRM and PGB over the specified ranges with excellent linearity and high correlation coefficients r2. The regression equations of the calibration curves of TRM and PGB as well as their corresponding correlation coefficients r2 is illustrated in Table 2. Lower limit of quantification (LLOQ) is known as the lowest linearity concentration having relative standard deviation (% RSD) not exceeding 20%. LLOQ was observed to be 10 ng mL−1 for determination of TRM and PGB in pure form, spiked human plasma and human urine.

3.3.3. Precision and Accuracy

The results of the precision and accuracy of low, middle and high concentrations of the calibration ranges of three control samples (n = 5) are shown in Table 3. Concerning validation data of control samples, intra-run accuracies of TRM ranged from 95.74% to 97.49% in plasma, and from 97.25% to 99.96% in human urine with the overall precision (% RSD) not exceeding 3.72%. For PGB, the intra-run accuracies were limited in the range from 91.40% to 99.81% in plasma, and from 94.12% to 97.11% in human urine with the overall precision (% RSD) below 3.56%. The inter–run data showed good results with high accuracy and low % RSD values as detailed in Table 3, indicating the method was reliable, accurate and precise within analytical ranges.

3.3.4. Recovery

PGB, as an aliphatic compound, could not be extracted by liquid–liquid extraction using any extracted organic solvent due to its hydrophilicity. On the other hand, solid-phase extraction requires specific cartridges with numerous boring steps and expensive technique. Protein precipitation is widely utilized as a sample preparation technique due to its merits of fast extraction, low cost and requiring no specific devices [42]. These merits make it the pretreatment method of choice for routine analysis in all laboratories. The extraction recovery using protein precipitation by methanol was checked by assaying five replicates of 30, 400 and 750 ng mL−1 of TRM and PGB and the recovery from human plasma and human urine were calculated as detailed in Section 2.6. The results showed good absolute recoveries of the tested drugs ranging from 86.51% to 93.38% for TRM, and from 86.20% to 92.42% for PGB, as presented in Table 4.

3.3.5. Stability

Stability of TRM and PGB in plasma and human urine were studied under conditions detailed in Section 2.6. The method ascertained that the analytes were stable in human plasma/human urine samples applying different storage conditions and handling, including over short and long terms and during freeze–thaw cycles; the results are summarized in Table 5.

3.4. Clinical Application

The proposed analytical method was basically developed and optimized to be applicable for therapeutic monitoring, clinical pharmacokinetic studies and forensic laboratories. Hence, the method was applied for the analysis of human plasma and human urine samples from three neuropathic pain patients treated with TRM (100 mg/24 h) and PGB (150 mg/12h). All human plasma and human urine samples were collected and stored at −20 °C until time of analysis. Human urine samples were diluted (1:30) with blank human urine to fit in the range of calibration curves. Representative plasma sample chromatograms are shown in Figure 7, where the results assessed high sensitivity and selectivity of the separated drugs with no interference of endogenous matrix components. Drug plasma and human urine concentrations were computed by the interpolation of the respective calibration curves as the determined levels of TRM and PGB were within the calibration range established in the assay. The measured concentrations determined by LC−MS/MS are presented in Table 6.
In view of the above, a highly sensitive and highly selective ESI–LC–MS/MS method was proposed, optimized, FDA validated, and applied for assay of TRM and PGB using GBP as the internal standard on a Phenomenex Luna® Omega polar C18 (LC 150 × 2.1 mm) column with 1.6 µm particle size at ambient temperature, applying isocratic elution of methanol−water (70:30, v/v) containing 0.1% (v/v) formic acid with a 0.3 mL/min flow rate. The total obtained run time of analysis was 2.5 min. only. The method was further subjected to validation by its application for qualitative determination of components under study in spiked human plasma and human urine with absence of any matrix endogenous interferences. The developed method offers advantages of sensitivity for analysis of both TRM and PGB with LLOQ of 10 ng mL−1 covering the therapeutic plasma concentration levels previously mentioned.

3.5. Eco-Scale Assessment of the Developed Method

Using hazardous solvents and chemicals is a significant major problem all over the world due to the resultant global environmental pollution. Accordingly, a natural evolution for preventing pollution in all chemistry labs is use of green solvents for green chemistry. In line with that, eco-scale tools were used for green assessment of the proposed chromatographic assay, representing each parameter in the proposed method from an environmental viewpoint by penalty points [40] whose summation was subtracted from 100. A detailed eco-scale-dependent greenness evaluation of the proposed method is represented in Table 7. The final eco-scale score was 89, higher than the threshold of 75, indicating that the introduced method is an acceptably ecofriendly assay [43].

4. Conclusions

The presented work introduces the first analytical method for simultaneous quantitative assay of TRM and PGB, a binary mixture that is widely used in various cases of neuropathic pain and forensic cases. A sensitive, accurate and isocratic ESI–LC–MS/MS method for assaying TRM and PGB in pure form in spiked human plasma and human urine has been established. The procedure exhibited wide linearity of 10–1000 ng mL−1 with high sensitivity for both TRM and PGB. The method was found to be a stable and fast tool for bioanalytical study of the drugs with short total analysis time of 2.5 min.
These findings allowed its successful application for clinical study of real plasma and human urine samples of neuropathic pain patients treated by the drugs. However, the presented study is a preliminary one that supports future pharmacokinetics study; further studies on metabolism of tramadol and pregabalin and detection of their active metabolites should be pursued. This study proposed simple protein precipitation for sample preparation using methanol as a compatible solvent with LC–MS/MS, offering advantages of minimizing the probe molecule ionization effect on ESI–LC–MS/MS. The method was validated following FDA guidelines and proved to be reasonably suitable for future pharmacokinetic studies and therapeutic drug monitoring of TRM and PGB combinations in bioanalytical environments. Regarding green chemistry considerations, semi-quantitative eco-scale assessment was applied proving that the presented method is an acceptable green analytical method.

Author Contributions

Data curation, I.A.N.; Formal analysis, N.A.A.; Funding acquisition, I.A.N.; Investigation, F.A.E. and M.R.E.G.; Methodology, N.A.A.; Project administration, M.R.E.G.; Resources, M.R.E.G.; Supervision, A.H.A. and I.A.N.; Writing—original draft, N.A.A.; Writing—review & editing, A.H.A. and A.A.E. All authors have read and agreed to the published version of the manuscript.

Funding

This research was funded by Taif University Researchers Supporting Project, TURSP-2020/56.

Institutional Review Board Statement

The study was conducted according to the guidelines of the Declaration of Helsinki, and approved by “ethics committee of the Faculty of Pharmacy, Beni-Suef University, Egypt”, serial no: REC-H-PhBSU-19001, 15 July 2018).

Informed Consent Statement

Informed consent was obtained from all subjects involved in the study.

Data Availability Statement

Data can be provided by authors upon request.

Acknowledgments

The authors would like to extend their sincere appreciation to Taif University Researchers Supporting Project number (TURSP-2020/56), Taif University, Taif, Saudi Arabia.

Conflicts of Interest

Authors declare that there is no conflict of interest.

References

  1. Treede, R.D.; Jensen, T.S.; Campbell, J.N.; Cruccu, G.; Dostrovsky, J.O.; Griffin, J.W.; Hansson, P.; Hughes, R.; Nurmikko, T.; Serra, J. Neuropathic pain. Redefinition and a grading system for clinical and research purposes. Neurology 2008, 70, 1630–1635. [Google Scholar] [CrossRef]
  2. Corona-Ramos, J.N.; De la O-Arciniega, M.; Déciga-Campos, M.; Medina-López, J.R.; Domínguez-Ramírez, A.M.; Jaramillo-Morales, O.A.; Espinosa-Juárez, J.V.; López-Muñoz, F.J. The antinociceptive effects of tramadol and/or gabapentin on rat neuropathic pain induced by a chronic constriction injury. Drug Dev. Res. 2016, 77, 217–226. [Google Scholar] [CrossRef]
  3. Szczudlik, K.; Dobrogowski, J.; Wordliczek, J.; Stępie, A.; Krajnik, M.; Leppert, W.; Woroń, J.; Przeklasa-Muszyńska, A.; Kocot-Kępska, M.; Zajączkowska, R.; et al. Diagnosis and management of neuropathic pain: Review of literature and recommendations of the Polish Association for the Study of Pain and the Polish Neurological Society–part two. Neurol. Neurochir. Pol. 2014, 48, 423–435. [Google Scholar] [CrossRef] [PubMed]
  4. Chaparro, L.E.; Wiffen, P.J.; Moore, R.A.; Gilron, I. Combination pharmacotherapy for the treatment of neuropathic pain in adults. Cochrane Database Syst. Rev. 2012, 2012, CD008943. [Google Scholar] [CrossRef]
  5. Le Cudennec, C.; Castagné, V. Face-to-face comparison of the predictive validity of two models of neuropathic pain in the rat: Analgesic activity of pregabalin, tramadol and duloxetine. Eur. J. Pharm. 2014, 735, 17–25. [Google Scholar] [CrossRef] [PubMed]
  6. Miranda, H.F.; Noriega, V.; Prieto, J.C.; Zanetta, P.; Castillo, R.; Aranda, N.; Sierralta, F. Antinociceptive interaction of tramadol with gabapentin in experimental mononeuropathic pain. Basic Clin. Pharm. Tox. 2016, 119, 210–214. [Google Scholar] [CrossRef] [PubMed] [Green Version]
  7. Sweetman, S.C. Martindale: The Complete Drug Reference, 36th ed.; The Pharmaceutical Press: London, UK, 2009. [Google Scholar]
  8. Tramadol—World Health Organization, Geneva. 36th Expert Committee on Drug Dependence 2014 Agenda Item 6.1. Available online: https://www.who.int/medicines/areas/quality_safety/6_1_Update.pdf (accessed on 6 November 2018).
  9. Electronic Medicines Compendium 2014 Tramadol Hydrochloride. Available online: http://www.medicines.org.uk/emc/ingredient/1228/tramadol%20hydrochloride/ (accessed on 24 December 2018).
  10. The British Pharmacopoeia; Her Majesty’s Stationary Office: London, UK, 2012; (electronic version).
  11. Rouini, M.R.; Ardakani, Y.H.; Soltani, F.; Aboul-Enein, H.Y.; Foroumadi, A. Development and validation of a rapid HPLC method for simultaneous determination of tramadol, and its two main metabolites in human plasma. J. Chromatogr. B 2006, 830, 207–211. [Google Scholar] [CrossRef]
  12. Curticapean, A.; Muntean, D.; Curticapean, M.; Dogaru, M.; Vari, C. Optimized HPLC method for tramadol and O-desmethyl tramadol determination in human plasma. J. Biochem. Biophys. Meth. 2008, 70, 1304–1312. [Google Scholar] [CrossRef] [PubMed]
  13. Gu, Y.; Fawcett, J.P. Improved HPLC method for the simultaneous determination of tramadol and O-desmethyltramadol in human plasma. J. Chromatogr. B 2005, 82, 240–243. [Google Scholar] [CrossRef]
  14. Vlase, L.; Leucuta, S.E.; Imre, S. Determination of tramadol and O-desmethyltramadol in human plasma by high-performance liquid chromatography with mass spectrometry detection. Talanta 2008, 7, 1104–1109. [Google Scholar] [CrossRef]
  15. Patel, B.N.; Sharma, N.; Sanyal, M.; Shrivastav, P.S. An accurate, rapid and sensitive determination of tramadol and its active metabolite O-desmethyltramadol in human plasma by LC–MS/MS. J. Pharm. Biomed. Anal. 2009, 49, 354–366. [Google Scholar] [CrossRef] [PubMed]
  16. Tanaka, H.; Naito, T.; Mino, Y.; Kawakami, J. Validated determination method of tramadol and its desmethylates in human plasma using an isocratic LC-MS/MS and its clinical application to patients with cancer pain or non-cancer pain. J. Pharm. Health Care Sci. 2016, 2, 25–29. [Google Scholar] [CrossRef]
  17. Zhu, T.; Ding, L.; Guo, X.; Yang, L.; Wen, A. Simultaneous determination of tramadol and acetaminophen in human plasma by LC–ESI–MS. Chromatographia 2007, 66, 171–178. [Google Scholar] [CrossRef]
  18. El-Sayed, A.A.Y.; Mohamed, K.M.; Nasser, A.Y.; Button, J.; Holt, D.W. Simultaneous determination of tramadol, O-desmethyltramadol and N-desmethyltramadol in human human urine by gas chromatography–mass spectrometry. J. Chromatogr. B 2013, 926, 9–15. [Google Scholar] [CrossRef] [PubMed]
  19. Sha, Y.F.; Shen, S.; Duan, G.L. Rapid determination of tramadol in human plasma by headspace solid-phase microextraction and capillary gas chromatography–mass spectrometry. J. Pharm. Biomed. Anal. 2005, 37, 143–147. [Google Scholar] [CrossRef] [PubMed]
  20. Krzek, J.; Starek, M. Quality assessment for tramadol in pharmaceutical preparations with thin layer chromatography and densitometry. Biomed. Chromatog. 2004, 18, 589–599. [Google Scholar] [CrossRef]
  21. Abdellatef, H.E.; El-Henawee, M.M.; El-Sayed, H.M.; Ayad, M.M. Spectrophotometric and spectrofluorimetric methods for analysis of tramadol, acebutolol and dothiepin in pharmaceutical preparations. Spectrochim. Acta A Mol. Biomol. Spectrosc. 2006, 65, 1087–1092. [Google Scholar] [CrossRef]
  22. Saadeh, H.M.A.S.M.; Al-Dalou, A.R.; Ghalwa, N.A.; Assi, A.A.A. Optimization of tramadol–PVC membrane electrodes using miscellaneous plasticizers and ion-pair complexes. Mater. Sci. Eng. C 2011, 31, 300–306. [Google Scholar]
  23. Norouzi, P.; Dinarvand, R.; Reza Ganjali, M.; Sadat Emami Meibodi, A. Application of Adsorptive Stripping Voltammetry for the Nano-Level Detection of Tramadol in Biological Fluids and Tablets Using Fast Fourier Transform Continuous Cyclic Voltammetry at an Au Microelectrode in a Flowing System. Anal. Lett. 2007, 40, 2252–2270. [Google Scholar] [CrossRef]
  24. Attal, N.; Cruccu, G.; Baron, R.A.; Haanpää, M.; Hansson, P.; Jensen, T.S.; Nurmikko, T. EFNS guidelines on the pharmacological treatment of neuropathic pain. Eur. J. Neuro. 2010, 17, 1113-e88. [Google Scholar] [CrossRef]
  25. Sowjanya, K.; Thejaswini, J.C.; Gurupadayya, B.M.; Raja, P. Quantitative determination of PRG by gas chromatography using ethyl chloroformate as a derivatizing reagent in pure and pharmaceutical preparation. Indian Drugs 2011, 48, 43–47. [Google Scholar]
  26. Mudiam, M.K.R.; Chauhan, A.; Jain, R.; Ch, R.; Fatima, G.; Malhotra, E.; Murthy, R.C. Development, validation and comparison of two microextraction techniques for the rapid and sensitive determination of pregabalin in human urine and pharmaceutical formulations after ethyl chloroformate derivatization followed by gas chromatography–mass spectrometric analysis. J. Pharm. Biomed. Anal. 2012, 70, 310–319. [Google Scholar]
  27. Mandal, U.; Sarkar, A.K.; Gowda, K.V.; Agarwal, S.; Bose, A.; Bhaumik, U.; Ghosh, D.; Pal, T.K. Determination of pregabalin in human plasma using LC-MS-MS. Chromatographia 2008, 67, 237–243. [Google Scholar] [CrossRef]
  28. Chahbouni, A.; Sinjewel, A.; den Burger, J.C.; Vos, R.M.; Wilhelm, A.J.; Veldkamp, A.I.; Swart, E.L. Rapid quantification of gabapentin, pregabalin, and vigabatrin in human serum by ultraperformance liquid chromatography with mass-spectrometric detection. Therap. Drug Monit. 2013, 35, 48–53. [Google Scholar] [CrossRef]
  29. Dzygiel, P.; Fraier, D. Simultaneous determination of PRG, sildenafil and its active metabolite in rat plasma utilising SPE followed by LC–MS–MS. Chromatographia 2011, 73, 1177–1182. [Google Scholar] [CrossRef]
  30. Dousa, M.; Gibala, P.; Lemr, K. Liquid chromatographic separation of PRG and its possible impurities with fluorescence detection after postcolumn derivatization with o-phtaldialdehyde. J. Pharm. Biomed. Anal. 2010, 53, 717–722. [Google Scholar] [CrossRef]
  31. Vermeij, T.A.C.; Edelbroek, P.M. Simultaneous high-performance liquid chromatographic analysis of pregabalin, gabapentin and vigabatrin in human serum by precolumn derivatization with O-phtaldialdehyde and fluorescence detection. J. Chromatogr. B 2004, 810, 297–303. [Google Scholar] [CrossRef]
  32. Ahmadkhaniha, R.; Mottaghi, S.; Zargarpoor, M.; Souri, E. Validated HPLC method for quantification of pregabalin in human plasma using 1-Fluoro-2, 4-dinitrobenzene as derivatization agent. Chromatogr. Res. Inter. 2014, 2014. [Google Scholar] [CrossRef] [Green Version]
  33. Bhatt, K.K.; Patelia, E.M.; Mori, A. Simultaneous Estimation of Pregabalin and Methylcobalamine in Pharmaceutical Formulation by RP-HPLC Method. J. Anal. Bioanal. Tech. 2013, 4, 1–4. [Google Scholar]
  34. Shaalan, R.A.A. Spectrofluorimetric and spectrophotometric determination of PRG in capsules and human urine samples. Int. J. Biomed. Sci. 2010, 6, 260–267. [Google Scholar] [PubMed]
  35. Prasad, M.K.C.; Sagar, G.V.; Sudhakar, R.D.P. Simultaneous HPTLC Method for Estimation of Gabapentin and Pregabalin. Int. J. Pharm. Pharm. Sci. 2013, 5, 326–333. [Google Scholar]
  36. Shah, D.A.; Patelia, E.M.; Mori, A. Simultaneous estimation of pregabalin and methylcobalamin in pharmaceutical formulation by HPTLC densitometry Method. J. Chromatogr. Sep. Tech. 2013, 4, 145–152. [Google Scholar] [CrossRef] [Green Version]
  37. European Medicines Agency. Summary of Product Characteristics (PDF). Available online: https://www.ema.europa.eu/en/documents/template-form/qrd-product-information-annotated-template-english-version-102-rev1_en.pdf (accessed on 12 December 2018).
  38. Arroyo, S.; Anhut, H.; Kugler, A.R.; Lee, C.M.; Knapp, L.E.; Garofalo, E.A.; Messmer, S. Pregabalin 1008-011 International Study Group, Pregabalin add-on treatment: A randomized, double-blind, placebo-controlled, dose–response study in adults with partial seizures. Epilepsia 2004, 45, 20–27. [Google Scholar] [CrossRef] [PubMed]
  39. Grond, S.; Sablotzki, A. Clinical pharmacology of tramadol. Clin. Pharmacokinet. 2004, 43, 879–923. [Google Scholar] [CrossRef] [PubMed]
  40. Gałuszka, A.; Migaszewski, Z.M.; Konieczka, P.; Namieśnik, J. Analytical Eco-Scale for assessing the greenness of analytical procedures. TrAC Trends Anal. Chem. 2012, 37, 61–72. [Google Scholar] [CrossRef]
  41. US Food and Drug Administration, Guidance for Industry: Bioanalytical Method Validation. 2001. Available online: http://www.fda.gov/downloads/Drugs/GuidanceComplianceRegulatoryInformation/Guidances/ucm070107.pdf (accessed on 21 November 2018).
  42. Polson, C.; Sarkar, P.; Incledon, B.; Raguvaran, V.; Grant, R. Optimization of protein precipitation based upon effectiveness of protein removal and ionization effect in liquid chromatography–tandem mass spectrometry. J. Chromatogr. B 2003, 785, 263–275. [Google Scholar] [CrossRef]
  43. Mohamed, H.; Lamie, N. Analytical Eco-Scale for Assessing the Greenness of a Developed RP-HPLC Method Used for Simultaneous Analysis of Combined Antihypertensive Medications. J. AOAC Int. 2016, 99, 1260–1265. [Google Scholar] [CrossRef]
Figure 1. Chemical structure of tramadol (TRM), pregabalin (PGB) and gabapentin (IS), which was used as the internal standard.
Separations 08 00021 g001
Figure 2. A full scan MS/MS spectra of (a) TRM with the parent ion [M + H]+ of m/z 263.89, (b) PGB with the parent ion [M + H]+ of m/z 160.24, and (c) GBP (IS) with the parent ion [M + H]+ of m/z 171.95.
Separations 08 00021 g002aSeparations 08 00021 g002bSeparations 08 00021 g002c
Figure 3. Daughter ion MS/MS spectra of (a) TRM, m/z 58.13, (b) PGB, m/z 55.09, and (c) GBP (IS), m/z 67.12.
Separations 08 00021 g003aSeparations 08 00021 g003bSeparations 08 00021 g003c
Figure 4. LC–MS/MS chromatogram of TRM and PGB at a concentration of 100 ng mL−1 using methanol: water (70:30, v/v) containing 0.1% formic acid as a mobile phase.
Separations 08 00021 g004
Figure 5. LC–MS/MS chromatogram of (a) a blank human plasma, and (b) human plasma spiked with 100 ng mL−1 of TRM, PGB and GBP as the internal standard.
Separations 08 00021 g005
Figure 6. LC–MS/MS chromatogram of (a) a blank human urine, and (b) human urine spiked with 100 ng mL−1 of TRM, PGB and GBP as the internal standard.
Separations 08 00021 g006
Figure 7. LC−MS/MS chromatogram of three plasma samples obtained from neuropathic patients treated with TRM and PGB and spiked with 100 ng mL−1 of IS.
Separations 08 00021 g007
Table 1. Tandem mass spectrometric parameters of TRM, PGB and GBP (IS).
AnalytePrecursor (Da)Product (Da)D Well (Sec)Cône (V)Coll. Energy (V)Ion Mode
Tramadol263.8958.130.1042525+ve
Pregabalin160.2455.090.1043030+ve
Gabapentin171.9567.120.1042035+ve
Table 2. Calibration ranges and regression equations for TRM and PGB in pure form, human plasma and urine using the LC–MS/MS method.
MatrixAnalyteCalibration Range (ng mL−1)Regression Equation aR2
PureTRM10–1000Y = 53.3878X + 601.730.9999
PGB10–1000Y = 2.0366X + 3.34250.9999
PlasmaTRM10–1000Y = 0.0167X + 0.11120.9999
PGB10–1000Y = 0.0005X + 0.00610.9999
UrineTRM10–1000Y = 0.0128X + 0.4990.9998
PGB10–1000Y = 0.0005X + 0.10910.9999
a Y represents analyte peak area in pure form and analyte–IS peak area ratio in spiked human plasma and urine; x represents analyte concentration (ng mL−1).
Table 3. Intra- and inter-day precision and accuracy of TRM and PGB in human plasma and urine samples at the low, middle and high concentrations of the calibration ranges for the proposed LC–MS/MS method.
MatrixAnalyteAnalyte Nominal Concentration (ng mL−1)Intra-Day (n = 5)Inter-Day (n = 5)
Mean (ng mL−1) ± SD Accuracy a (% Target)Precisionb (% RSD)Mean (ng mL−1) ± SDAccuracy a (% Target)Precision b (% RSD)
Human plasmaTRM30.0029.25 ± 0.46997.491.6030.12 ± 0.763100.392.53
400.00382.95 ± 11.89295.743.11377.52 ± 13.18994.383.49
750.00728.54 ± 24.95497.143.43731.81 ± 29.56997.574.04
PGB30.0029.94 ± 0.70299.812.3529.87 ± 0.80299.582.69
400.00385.72 ± 9.46696.432.45370.22 ± 12.45392.563.36
750.00685.53 ± 13.53491.401.97688.23 ± 17.35191.762.52
Human urineTRM30.0029.99 ± 0.71299.962.3729.71 ± 1.09699.053.69
400.00389.01 ± 8.72997.252.24384.70 ± 14.82796.173.85
750.00741.41 ± 27.49298.863.71711.91 ± 30.17794.924.24
PGB30.0028.63 ± 0.68395.432.3829.66 ± 0.77298.862.60
400.00376.47 ± 13.35994.123.55377.07 ± 12.50494.273.32
750.00728.31 ± 16.19797.112.22698.37 ± 26.13793.123.74
a Percentage difference between mean and target concentration. b Percentage relative standard deviation.
Table 4. Absolute recovery of TRM and PGB from human plasma and urine samples.
MatrixAnalyteAnalyte Nominal Concentration (ng mL−1)Absolute Recovery a (%) ± SD Precision (% RSD)
Human plasmaTRM30.0090.83 ± 4.9725.47
400.0091.31 ± 2.8463.12
750.0093.38 ± 4.0784.37
PGB30.0088.89± 7.2748.18
400.0089.87 ± 4.7855.32
750.0090.46 ± 3.0043.32
Human urineTRM30.0088.17 ± 5.0135.69
400.0086.51 ± 3.4724.01
750.0089.56 ± 4.0294.50
PGB30.0092.42 ± 8.5299.23
400.0087.38 ± 4.0294.61
750.0086.20 ± 5.1375.96
a Mean ± standard deviation, n = 5.
Table 5. Stability (values in percentage) of TRM and PGB in human plasma and urine samples under different conditions of sample handling and storage.
MatrixAnalyteAnalyte Concentration (ng mL−1)Stability Conditions (n = 5)
RT a 4 h (% of Target) b4 °C 24 h (% of Target) bThree Freeze/Thaw Cycles (% of Target) b−20 °C 15 Days (% of Target) b
PlasmaTRM30.00102.9798.6397.3598.10
750.0096.7495.1290.70102.56
PGB30.0098.8197.5195.9691.79
750.0093.4795.2190.9594.74
UrineTRM30.00103.8798.3297.6098.40
750.0098.8096.2095.0898.61
PGB30.0096.2095.6192.3694.94
750.0097.1793.2692.7194.12
a RT, room temperature. b Stability is mean percentage difference from freshly prepared samples.
Table 6. TRM and PGB concentrations in plasma/urine samples of neuropathic pain patients by the developed LC–MS/MS method.
PatientDrug Therapy DosingMeasured Plasma Concentration (ng mL−1)Measured Urine Concentration (ng mL−1)
1TRM: 110 mg/24 h3007550
PGB: 75 mg/12 h183059,760
2TRM: 110 mg/24 h5809500
PGB: 75 mg/12 h137043,910
3TRM: 110 mg/24 h2506040
PGB: 75 mg/12 h107039,380
Table 7. Penalty points of the developed ESI−LC−MS/MS method.
ReagentsProposed ESI−LC−MS/MS Method
Methanol1
Water0
Formic acid1
Internal standard4
Σ6
Instrument
ESI−LC−MS/MS2
Occupational hazardous0
Energy2
Waste1
Σ5
Total penalty points11
Analytical Eco-scale Total score89
Publisher’s Note: MDPI stays neutral with regard to jurisdictional claims in published maps and institutional affiliations.

