Article

The Role of Ionic Liquid Interaction in the Separation of Fatty Acid Methyl Esters—Polyunsaturated Geometric Isomers in GC–MS

Institute of Bioanalysis, Medical School, and Szentágothai Research Center, University of Pécs, Szigeti út 12., 7624 Pécs, Hungary
*
Authors to whom correspondence should be addressed.
Submission received: 28 February 2021 / Revised: 16 March 2021 / Accepted: 23 March 2021 / Published: 26 March 2021

Abstract

:
Knowledge of the type and level of saturated and unsaturated fatty acids in food and clinical matrices is of practical importance, but the wide variety of fatty acids makes analyses very complex. The discrimination of the geometric isomers of fatty acid needs proper and effective separation conditions. The efficiency of three different stationary phases was evaluated by GC–MS methods in the separation of fatty acids in their methyl ester forms. Significant differences were observed in the efficiencies of polysiloxane-based (non-polar HP-5MS and medium/high polarity DB-225MS) and ionic liquid-based (SLB-IL111) columns. Baseline separation of the geometric isomers of linoleic acid methyl ester was obtained by the extremely polar SLB-IL111 column, showing a preference over the other two columns. The optimization of the experimental conditions (response linearity, limit of detection, limit of quantification, system suitability, intraday and interday repeatability and accuracy) showed the separation power of the ionic liquid interaction in the analyses by using short (25–30 m long) columns. By deducting the general principles of the interaction, predictions can be made for the separation of other isomers. The results facilitate the precise identification of various types of fatty acids in real samples for nutritional information.

1. Introduction

Fatty acids (FAs) and their associated derivatives are the main constituents of lipids, having biological, structural and functional roles in living organisms. FAs show remarkable structural diversity, such as saturated, unsaturated, polyunsaturated fatty acids (PUFAs) and, moreover, cis or trans configurations may occur. Growing interest in the investigation of FAs can be observed thanks to their high relevance for human nutrition and health. The most physiologically significant PUFAs are those having 18, 20 or 22 carbon atoms and containing 2 to 6 double bonds. Due to various biological aspects, such as influencing inflammation [1] and presenting neuro- and cardiovascular protection [2,3], the n-3 essential fatty acid, C18:3n-3 (α-linolenic acid), the n-6 essential fatty acid, C18:2n-6 (linoleic acid) and two metabolites, C22:6n-3 (docosahexaenoic acid) and C20:4n-6 (arachidonic acid), are of great importance in analyses. In recent years, the investigation of conjugated linoleic acid (CLA) isomers has attracted considerable interest, since they appear as minor components of the lipid fraction and are found in meat and dairy products from cows and sheep [4,5,6]. Besides CLAs, several positional and geometric isomers of linoleic acid are formed during the partial hydrogenation of vegetable oils. C18:2 isomers are found in significant amounts in margarine and other edible fats [7], which are of great practical importance.
Reliable qualitative and quantitative fatty acid analyses are required, but considering the high structural complexity of the compounds, these investigations can be difficult. GC, coupled with FID or MS detection, offers high chromatographic resolution and it is the most commonly used technique for analyzing FA isomers after methylation, i.e., in fatty acid methyl ester (FAME) forms. Various stationary phases, ranging from non-polar to extremely polar, have been tested to find the most effective one for FAME analysis, and thus, companies provide recommendations for column selection [8]. High-polarity phases are proposed for cis/trans separations and mid-polarity phases for the determination of omega-3 fatty acids, while non-polar columns may eliminate the overlapping of components with different chain lengths. The reason for the differences is due to the interactions of the components with the stationary phases. The retention behavior on cyanopropyl siloxane (DB-23 and HP-88) and phenyl siloxane (HP-5) stationary phases was used and evaluated to identify C4–C24 FAMEs using GC–MS by Härtig [9]. The mass and retention data were collected in a database for identification and utilized for the analysis of a real sample (FAMEs from the cell envelope of Pseudomonas putida). Recently, He et al. [10] reported GC–MS analysis of straight-chain and branched short-chain FAs and concluded that a 30 m long cyanopropylphenyl siloxane DB-225MS column and a 30 m long phenyl-arylene-siloxane DB-5 combination MS column provided the best separation. The method was found to be suitable to quantify the short-chain FAs in mouse feces.
Increased health awareness has led to a considerable number of studies in food chemistry concerning the FA profiles of a variety of samples, with particular regard to cis/trans isomers. In recent years, GC columns with ionic liquid (IL) stationary phases of various polarities and high thermal stabilities have been introduced as alternatives to traditional columns for FAME investigations. A review has been published by Fanali et al. [11], summarizing the application of IL-based columns in GC analyses of FAMEs, and SLB-IL111 was suggested for FAME isomer analyses. This extremely polar column has been used to determine the FA composition in milk fat of different origins [5,12,13], in oils (such as linseed oil [14], menhaden fish oil [15] or various edible oils [16]) and fast food samples [17]. In particular, the SLB-IL111 column was applied to separate cis/trans monounsaturated FAs C14:1 to C20:1 to compare its performance with other commercially available columns, such as the SP-2560 and the CP-Sil 88 ones [6]. Compared to the polysiloxane and polyethylene glycol stationary phases, the IL stationary phases showed improved separation of FAME substances in the C16, C18 and C20 regions and the conjugated linoleic acid isomer regions. The capability of separating FAMEs on a series of phosphonium- and imidazolium-based IL capillary columns was demonstrated by Zeng et al. [18]. The elution temperature, the retention behavior and the equivalent chain length values of analytes were estimated and the IL stationary phases were characterized by using a linear solvation energy relationship approach. Due to possible physiological effects, intensive regulations have been introduced in the European Union to minimize trans fats in food (<2 g/100 g fat) [19]. Furthermore, Baylin et al. [20] found that the best indicators of total trans fatty acid intake were 18:2n-6ct (cis,trans-9,12-octadecadienoic acid) and 18:2n-6tc (trans,cis-9,12-octadecadienoic acid).
This study investigates the elution behavior of fatty acid methyl esters with high structural diversity on three capillary columns of different polarities. For each column, optimal GC–MS methods were developed and validated to obtain the highest efficiency in the separation of the geometric isomers of polyunsaturated fatty acids.

2. Materials and Methods

2.1. Chemicals and GC Columns

The GLC-674 Reference Standard Mixture (Nu-Chek-Prep Inc., Elysian, MN, USA), containing 52 fatty acid methyl ester components with chain lengths from C4 to C24, was used as a 1 mg mL−1 (total concentration of the components) stock solution in n-hexane. Table 1 contains the list of components, and the concentrations of the components in the stock solution were between 0.01 and 0.03 mg mL−1 (see vendor’s description [21]). The CRM47791 Linoleic Acid Methyl Ester Mix (Sigma-Aldrich, St. Louis, MO, USA) containing 0.1 mg mL−1 cis,cis-9,12-octadecadienoic acid methyl ester, 0.2 mg mL−1 cis,trans-9,12-octadecadienoic acid methyl ester, 0.2 mg mL−1 trans,cis-9,12-octadecadienoic acid methyl ester and 0.5 mg mL−1 trans,trans-9,12-octadecadienoic acid methyl ester distributed in dichloromethane was diluted with n-hexane to 0.08 mg mL−1 (total concentration). The solutions were stored at −20 °C before analysis. The GC-grade solvent n-hexane was purchased from Merck Chemical Co (Darmstadt, Germany).
A non-polar HP-5MS (Agilent, Waldbronn, Germany), with phase composition of (5%-phenyl)-methylpolysiloxane (length, 25 m; inner diameter, 0.20 mm; film thickness, 0.33 µm), a mid/high polarity DB-225MS (Agilent, Waldbronn, Germany), with phase composition of (50%-cyano-propylphenyl)-methylpolysiloxane (length, 30 m; inner diameter, 0.25 mm; film thickness, 0.25 µm), and an extremely polar SLB-IL111 (Sigma, St. Louis, MO, USA), with phase composition of 1,5-di(2,3-dimethylimidazolium)pentane bis(trifluoromethylsulfonyl)imide (length, 30 m; inner diameter, 0.25 mm; film thickness, 0.20 µm) were used in GC–MS experiments. Before the first use, the conditioning of the columns was carried out according to the factory recommendations, i.e., raising the temperature from 24 °C to 200 °C at the rate of 15 °C min−1, held at 200 °C for 30 min, then raised at the rate of 20 °C min−1 to a temperature that was 10 °C below the highest recommended value, and held for 120 min.

2.2. GC–MS Analysis

An Agilent Technologies 6890N gas chromatograph with a 5975 mass selective detector (Agilent, Waldbronn, Germany) was used for the analysis of FAMEs. The chromatograph and the detector conditions were as follows: flow rate of the helium carrier gas, 1.5 mL min−1; injection mode, splitless; the temperature of the injector, ion source, and quadrupole mass analyzer, 250 °C, 230 °C and 150 °C, respectively. The injection volume was 1 µL, applied with an autosampler. The mass spectrometer was operated at 70 eV in the electron impact (EI) mode, and the scanned mass range was 50–450 amu.
To find the appropriate method for the separation of FAMEs, the relevant literature on the applied columns [9,10,18] was used as a basis and, after modifications, the following settings were found to be suitable. For the HP-5MS column, the column temperature was initially held at 50 °C for 2 min, raised to 170 °C at the rate of 10 °C min−1, held at 170 °C for 2 min, then raised to 190 °C at the rate of 4 °C min−1, held at 190 °C for 5 min, then raised to 290 °C at the rate of 5 °C min−1, held at 290 °C for 2 min, then raised to 320 °C at the rate of 20 °C min−1, held at final temperature for 2 min. The temperature of the transfer line was set to 280 °C. For the DB-225MS column, the column temperature was initially held at 50 °C for 2 min, raised to 170 °C at the rate of 10 °C min−1, held at 170 °C for 2 min, then raised to 190 °C at the rate of 2.5 °C min−1, held at 190 °C for 5 min, then raised to 220 °C at the rate of 5 °C min−1, held at 220 °C for 2 min, then raised to 230 °C at the rate of 10 °C min−1, held at final temperature for 8 min. The temperature of the transfer line was set to 230 °C. For the SLB-IL111 column, the column temperature was initially held at 40 °C for 4 min, raised to 220 °C at the rate of 4.5 °C min−1, then raised to 260 °C at the rate of 20 °C min−1, held at final temperature for 1 min. The temperature of the transfer line was set to 260 °C. Data analysis was performed using the GC/MSD CHEMSTATION (Version D.03.01, Agilent) software. The fatty acids were identified with the help of the MS library (AMDIS Version 2.64, NIST; Freeware; http://chemdata.nist.gov/mass-spc/amdis, accessed on 25 November 2019.).

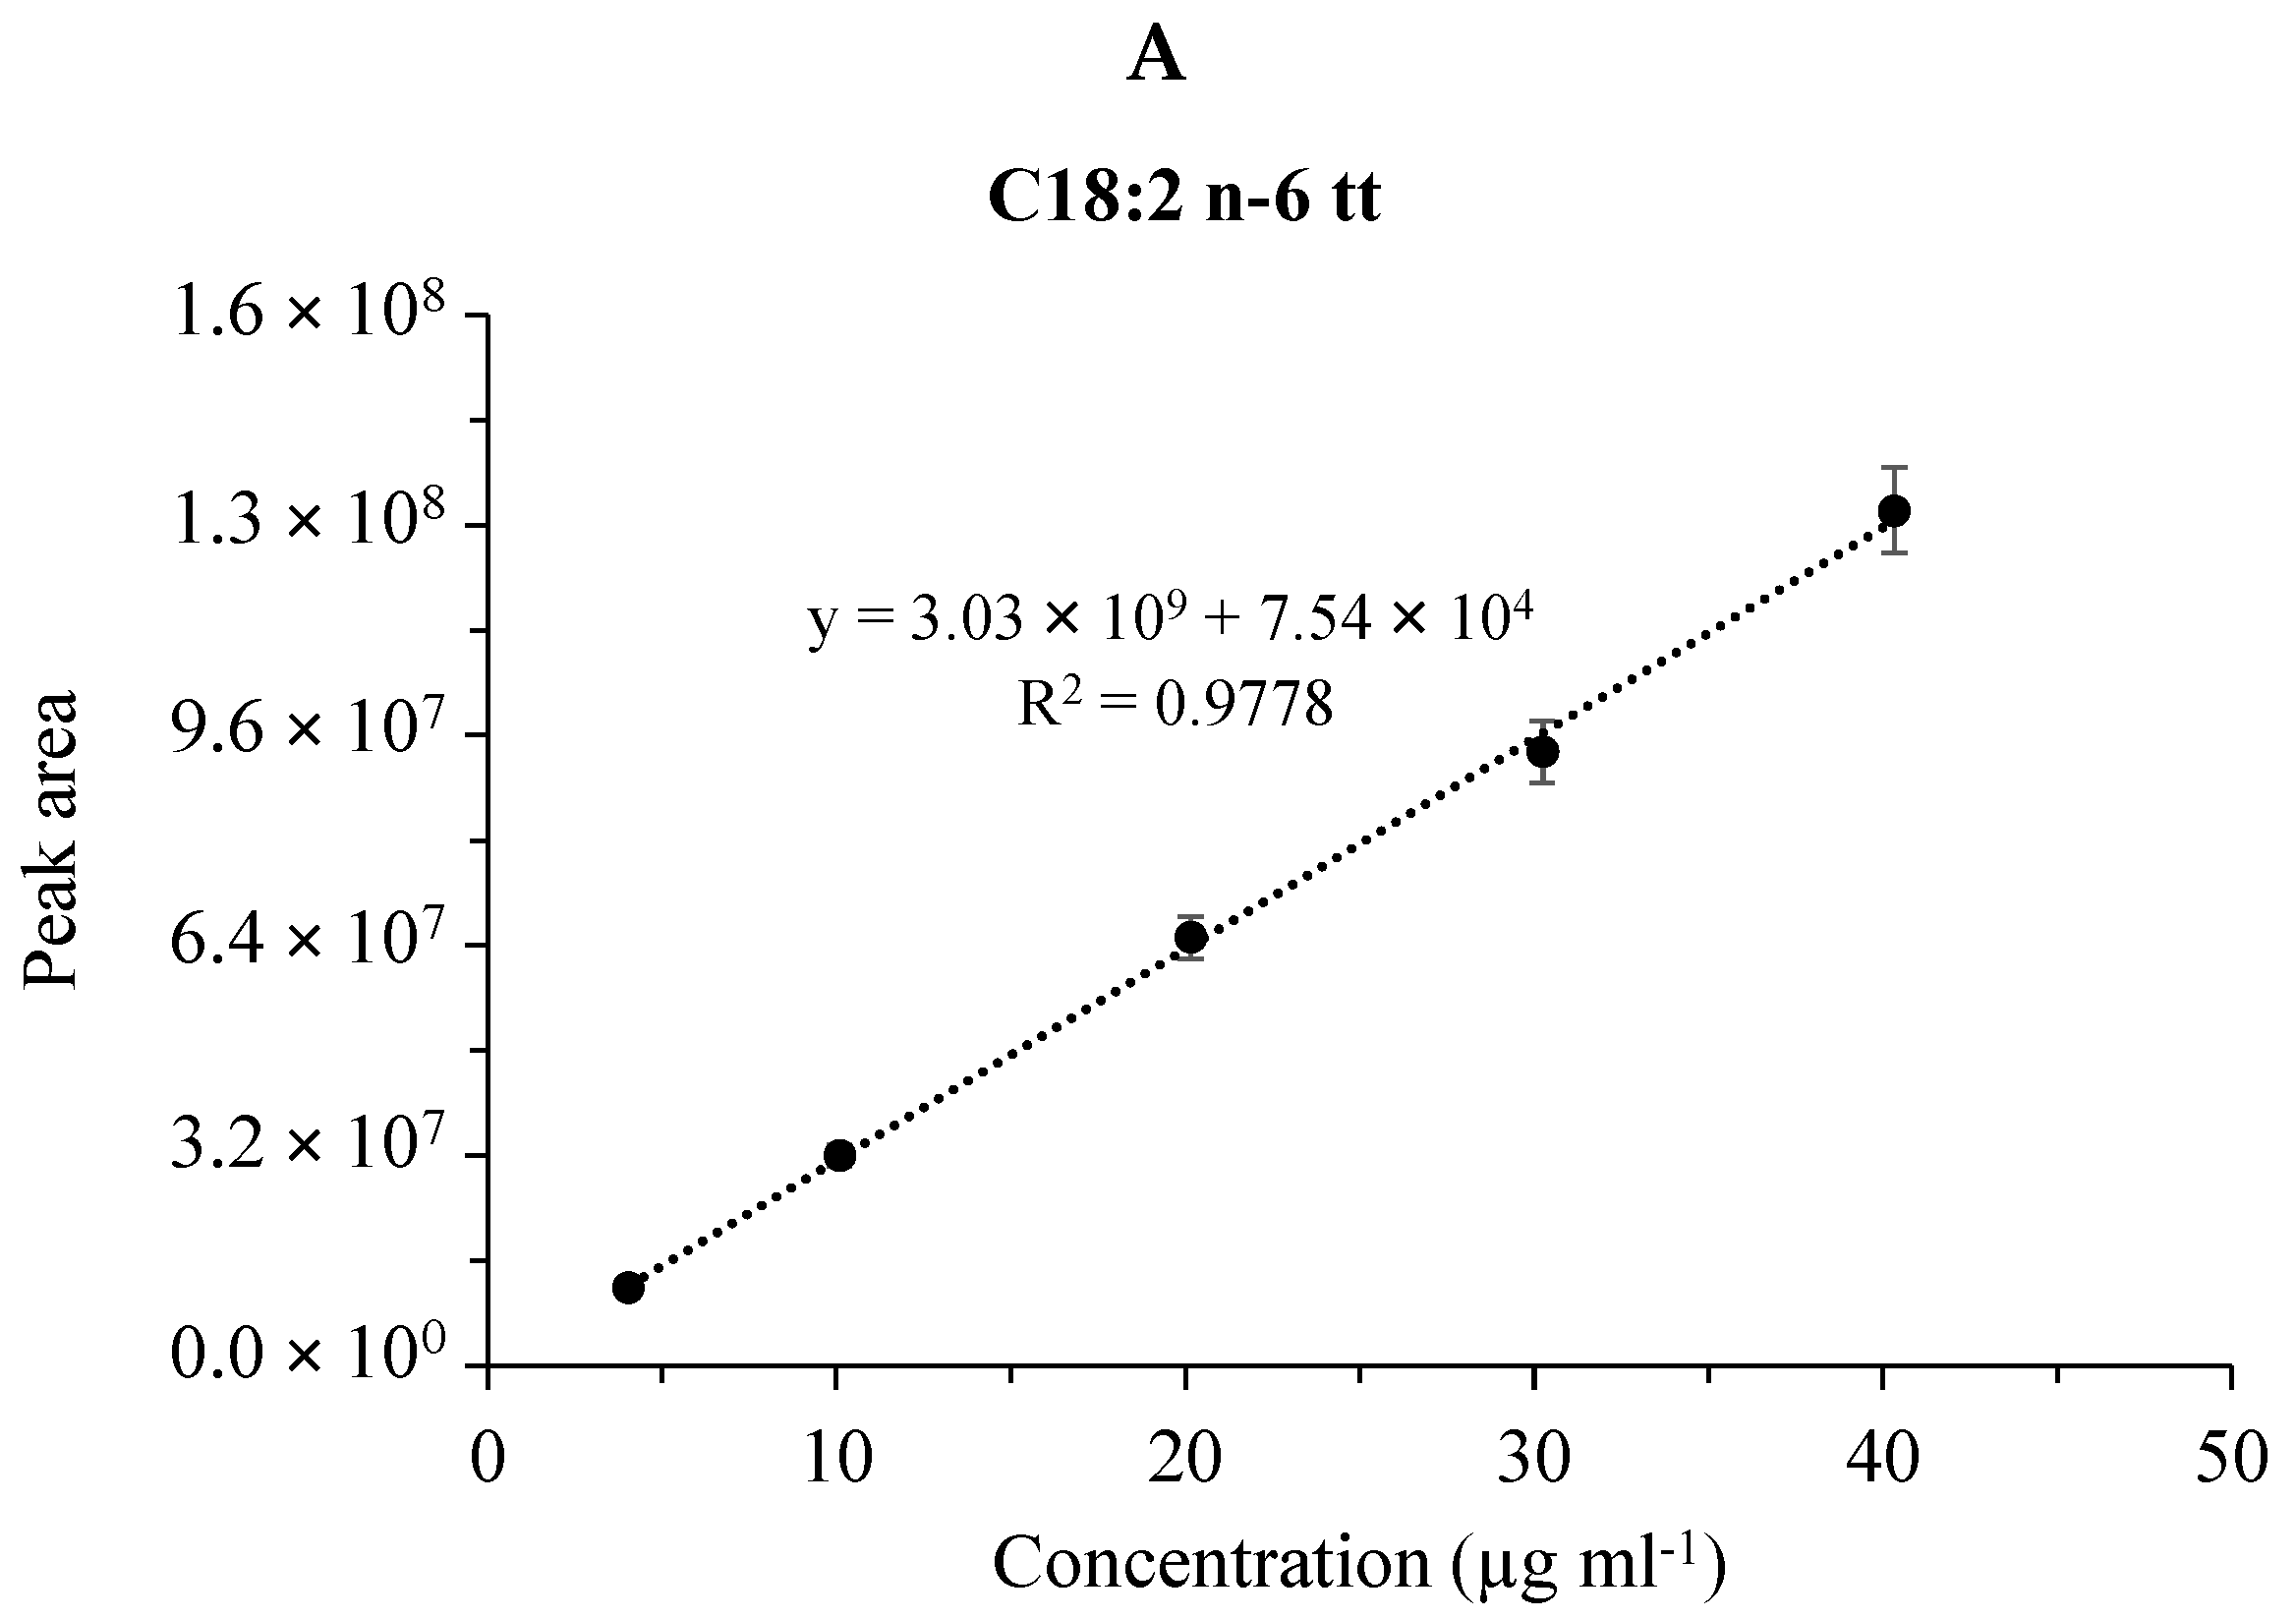
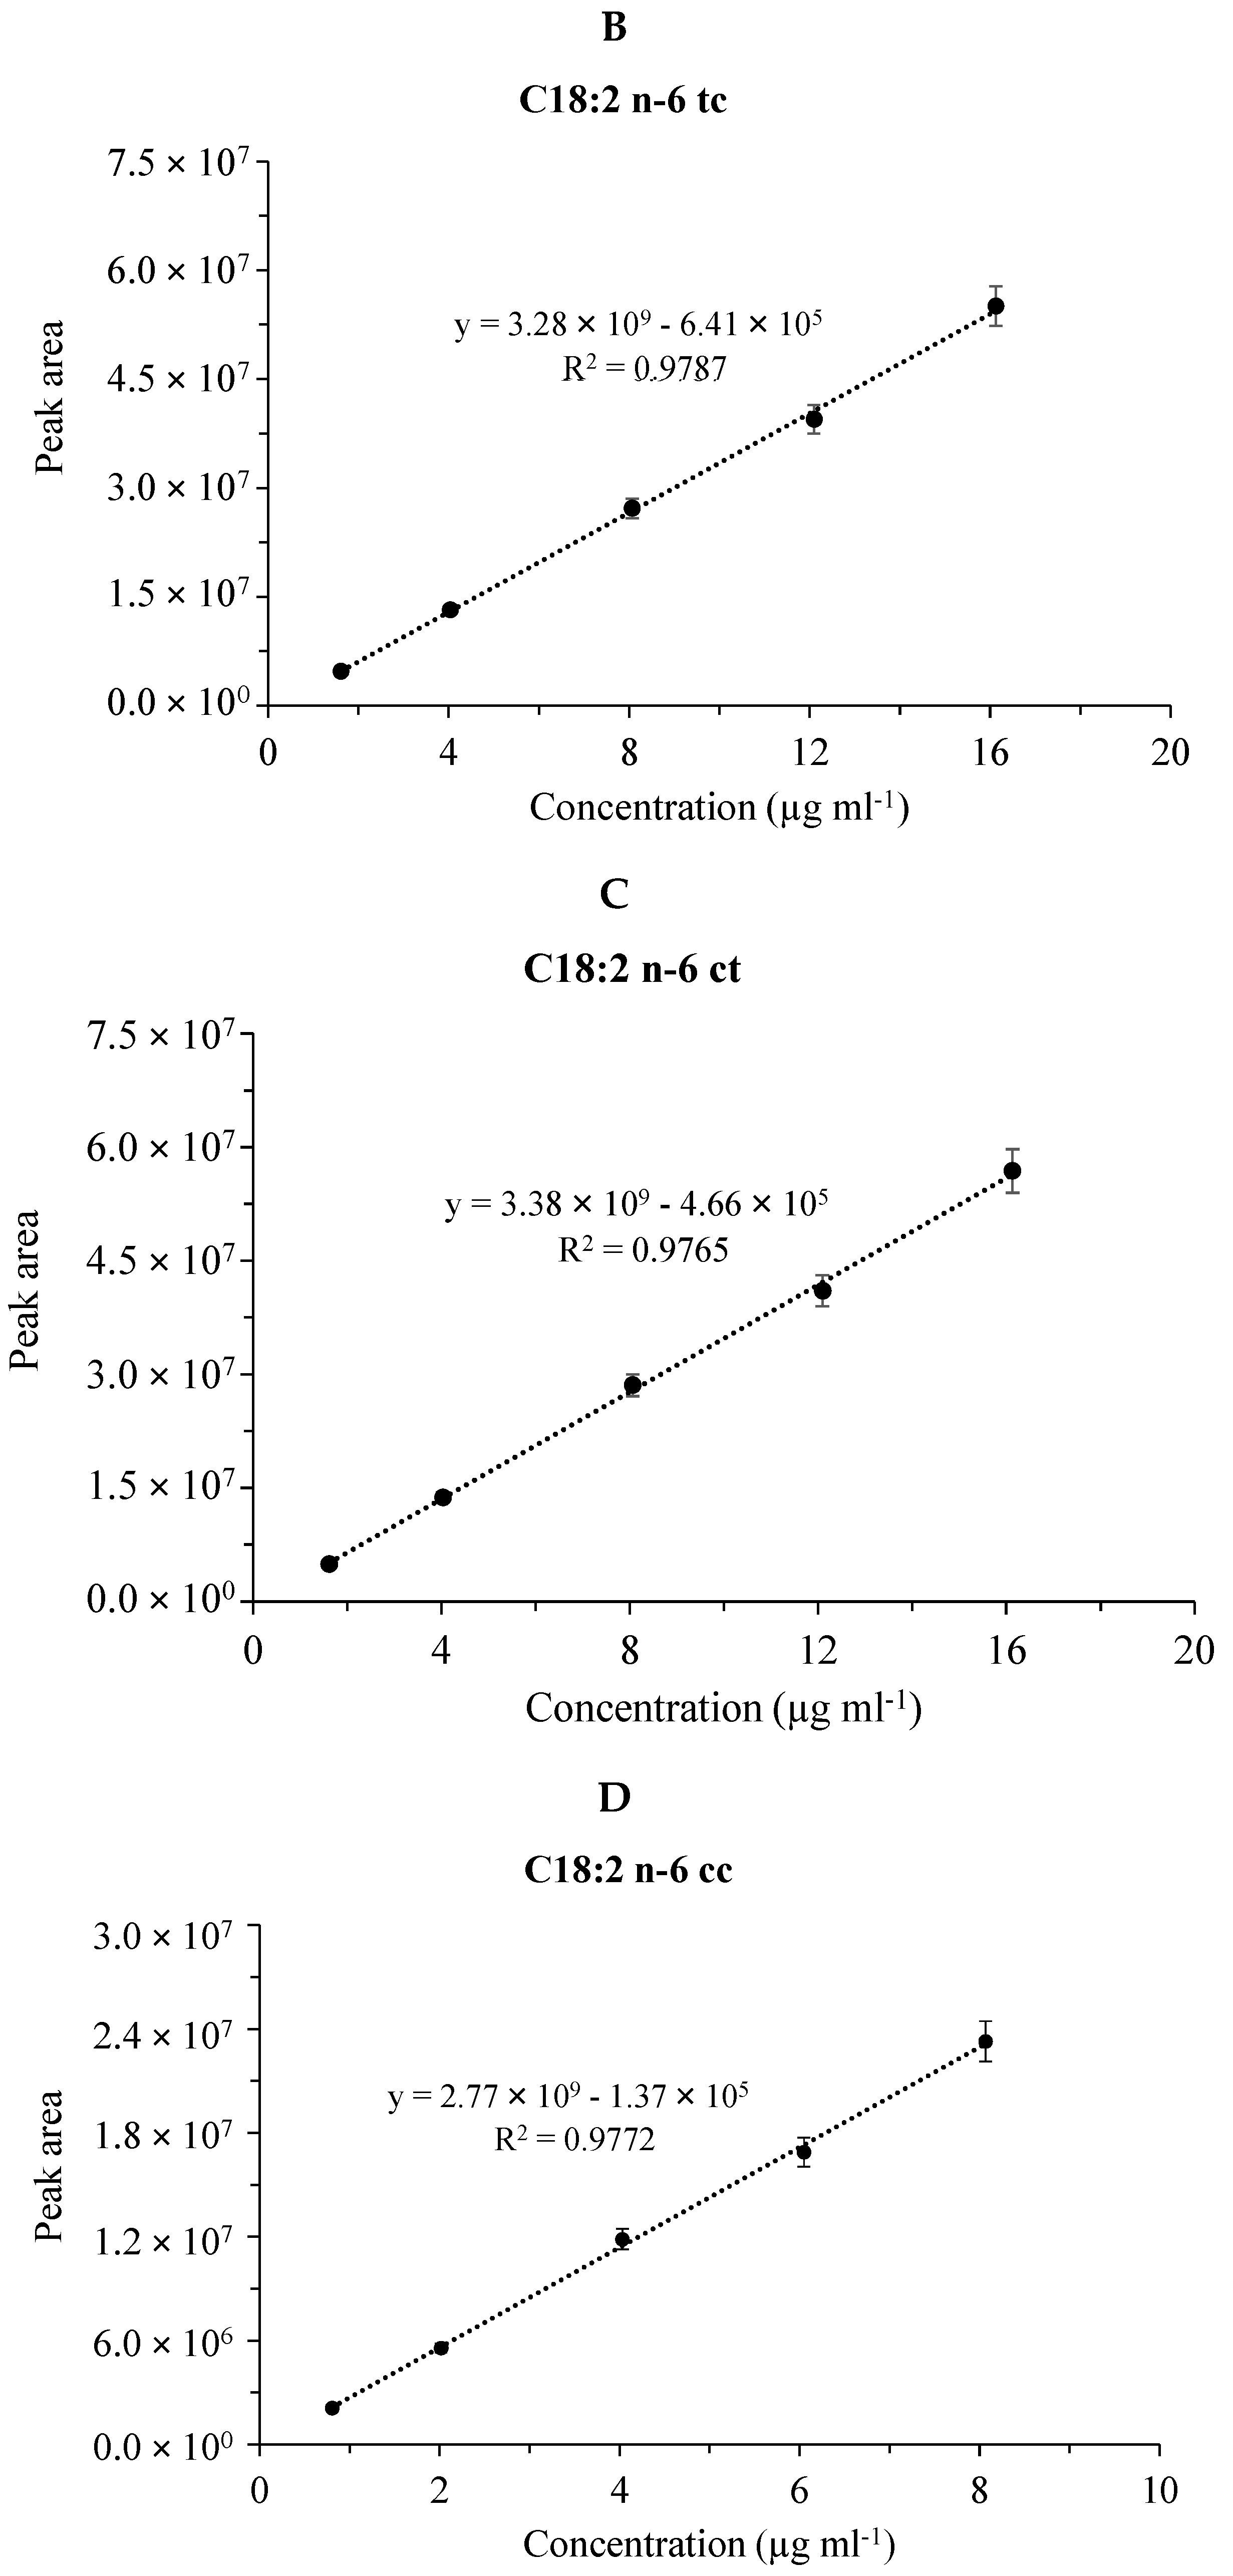
2.3. Validation Procedure

The GC–MS experiments with the three columns were systematically studied to obtain optimal conditions with high efficiency. The two FAME mixtures were studied in different experimental setups by performing at least three analyses with each. Solution series of five (total) concentrations of the GLC-674 mixture (0.1, 0.25, 0.5, 0.75 and 1 mg mL−1 concentrations prepared in n-hexane) and the CRM47791 mixture (0.008, 0.02, 0.04, 0.06 and 0.08 mg mL−1 concentrations prepared in n-hexane) were analyzed. Calibration curves were established from three (n = 3) complete analyses under the same conditions. The limit of detection (LOD) and limit of quantification (LOQ) were determined as described in [22]. Validation of the chromatographic methods was based on the guidelines in [23]. System suitability was expressed by the relative standard deviation (RSD) values of the retention time and the concentration obtained from seven (n = 7) complete analyses of each sample under the same conditions within one day. The general criteria for the system suitability were that the RSD values should be less than 2% for the retention time and less than 10% for the concentration. The precision of the methods was checked by intraday and interday experiments, as well. The intraday repeatability was obtained from three (n = 3) complete analyses of each sample under the same conditions within one day, and the interday repeatability was obtained from three (n = 3) complete analyses of each sample repeated on three consecutive days (n = 9). The general criteria for the intraday and interday repeatability were that the RSD values should be less than 10%. The mean values of repeatability were expressed by the RSD values. The general criteria for the average accuracy were that the RSD values should be between 80 and 120%.

2.4. Molecular Modeling

In order to demonstrate the interactions between the 1,5-di(2,3-dimethylimidazolium)pentane bis(trifluoromethylsulfonyl)imide ionic liquid and the geometric isomers of linoleic acid methyl ester (C18:2n-6tt, C18:2n-6tc, C18:2n-6ct, and C18:2n-6cc), possible positions of the two molecules were constructed using the HyperChem 7.51 software (HyperChem(TM) Professional 7.51, Hypercube, Inc., 1115 NW 4th Street, Gainesville, FL, USA). Geometry optimization of the molecules displays the structures with minimum energy, i.e., the most stable form of the chemical structure. As an initial step, the molecules were created individually and then optimized by the method of MM+ molecular mechanics force field [24]. After creating the molecular systems, the relative positions of the two molecules were optimized with the same MM+ method.

3. Results

3.1. Retention Behavior of Fatty Acid Methyl Esters

Fatty acid methyl esters were analyzed by GC–MS as described in the Materials and Methods. The total ion chromatograms were registered in the cases of three different separation columns, i.e., the non-polar HP-5MS (25 m) column, the medium/high polarity DB-225MS (30 m) column and the extremely polar, ionic liquid (IL)-based SLB-IL111 (30 m) column. Two different mixtures (GLC-674 and CRM47791), containing 52 and 4 components, respectively, were analyzed. The separated components were identified based on the retention times, on the relative concentration in the mixture and on the mass spectra. The respective peaks were labeled according to the order of appearance in the chromatograms obtained with the use of the non-polar HP-5MS column. Table 1 and Table 2 include the lists of the components in the two FAME mixtures. Figure 1 shows the total ion chromatograms of the FAME components in the GLC-674 mixture analyzed with the three GC columns. The peak labels correspond to those in Table 1. Figure 2 shows the total ion chromatograms of the FAME components in the CRM47791 mixture on the three different columns, and the peak labels correspond to those in Table 2.
Applying the three columns, significant differences in the retention properties of FAME components with C4–C24 chain lengths could be observed.
Applying the HP-5MS (i.e., the non-polar, phenyl siloxane) column, 43 peaks appeared, covering the 52 FAMEs. It could be observed that the butyric acid methyl ester (C4:0) was eluted together with the solvent (showing no retention) on each column; therefore, it was not included in the dataset. Generally, the saturated FAMEs were eluted after the unsaturated FAMEs (Figure 1A); in addition, limited separation of the trans-isomers could be observed, since the cis-FAME isomers overlapped with the trans-FAME isomers. The retention time increased in cases of FAMEs having the double-bond position closer to the CH3 group end; thus, the n-6-FAMEs were eluted before the n-3-FAMEs on all three columns. Additionally, the polyunsaturated FAMEs were eluted before the monounsaturated FAMEs. On this non-polar phase, two peaks covered three components, since the C18:1n-9 (component 22), the C18:2n-6tt (component 23) and the C18:1n-7 (component 24) esters overlapped, and also the C18:1n-9t (component 25), the C18:1n-12t (component 26) and the C18:1n-12 (component 27) esters overlapped. In four cases, co-elutions were observed, since, e.g., the C20:1n-9 ester (component 36) overlapped with the C20:3n-3 ester (component 37), while the C21:0 ester (component 40) overlapped with the C22:5n-6 ester (component 41). The retention times of the overlapping components are given in bold in Table 1.
Using the DB-225MS (i.e., the mid/high-polarity, cyanopropyl siloxane) column, 47 peaks could be seen. On this column, the separation of cis and trans geometric isomers could be achieved. Furthermore, the saturated FAMEs were eluted before the unsaturated FAMEs (Figure 1B). Four esters, the C18:1n-9 (component 22), the C18:1n-9t (component 25), the C18:1n-12t (component 26) and the C18:1n-7t (component 28), were overlapping, whereas the C20:3n-3 ester (component 37) overlapped with the C21:0 ester (component 40).
The extremely high-polarity SLB-IL111 (ionic liquid phase) column showed similarly overlapping retention times of components, but to a smaller extent, since 48 peaks appeared in the chromatogram (Figure 1C). Three peaks covered double components, since the C18:1n-7 (component 24) and the C18:1n-7t (component 28) esters appeared together; also the C18:3n-6 (component 19) and the C20:1n-9t (component 38) ester had the same retention time; and the C20:4n-6 (component 32) and the C20:3n-3 (component 37) esters were co-eluted, too. All the cis-FAME isomers were eluted after the trans-isomers.
Comparing the experiments with the three columns, it can be seen that the elution orders in the cases of the SLB-IL111 and DB-225MS columns were more similar than that obtained with the HP-5MS. Furthermore, nearly complete separation of the C18 and C20 regions was also obtained with the SLB-IL111 column (Figure 1C).
The polyunsaturated (methyl linoleate) geometric isomers could be completely separated only with the SLB-IL111 column (Figure 2C), and no baseline separation of the four C18:2 geometric isomers (cis-cis, cis-trans, trans-cis, trans-trans) could be observed with the other two separation phases (Figure 2A,B).

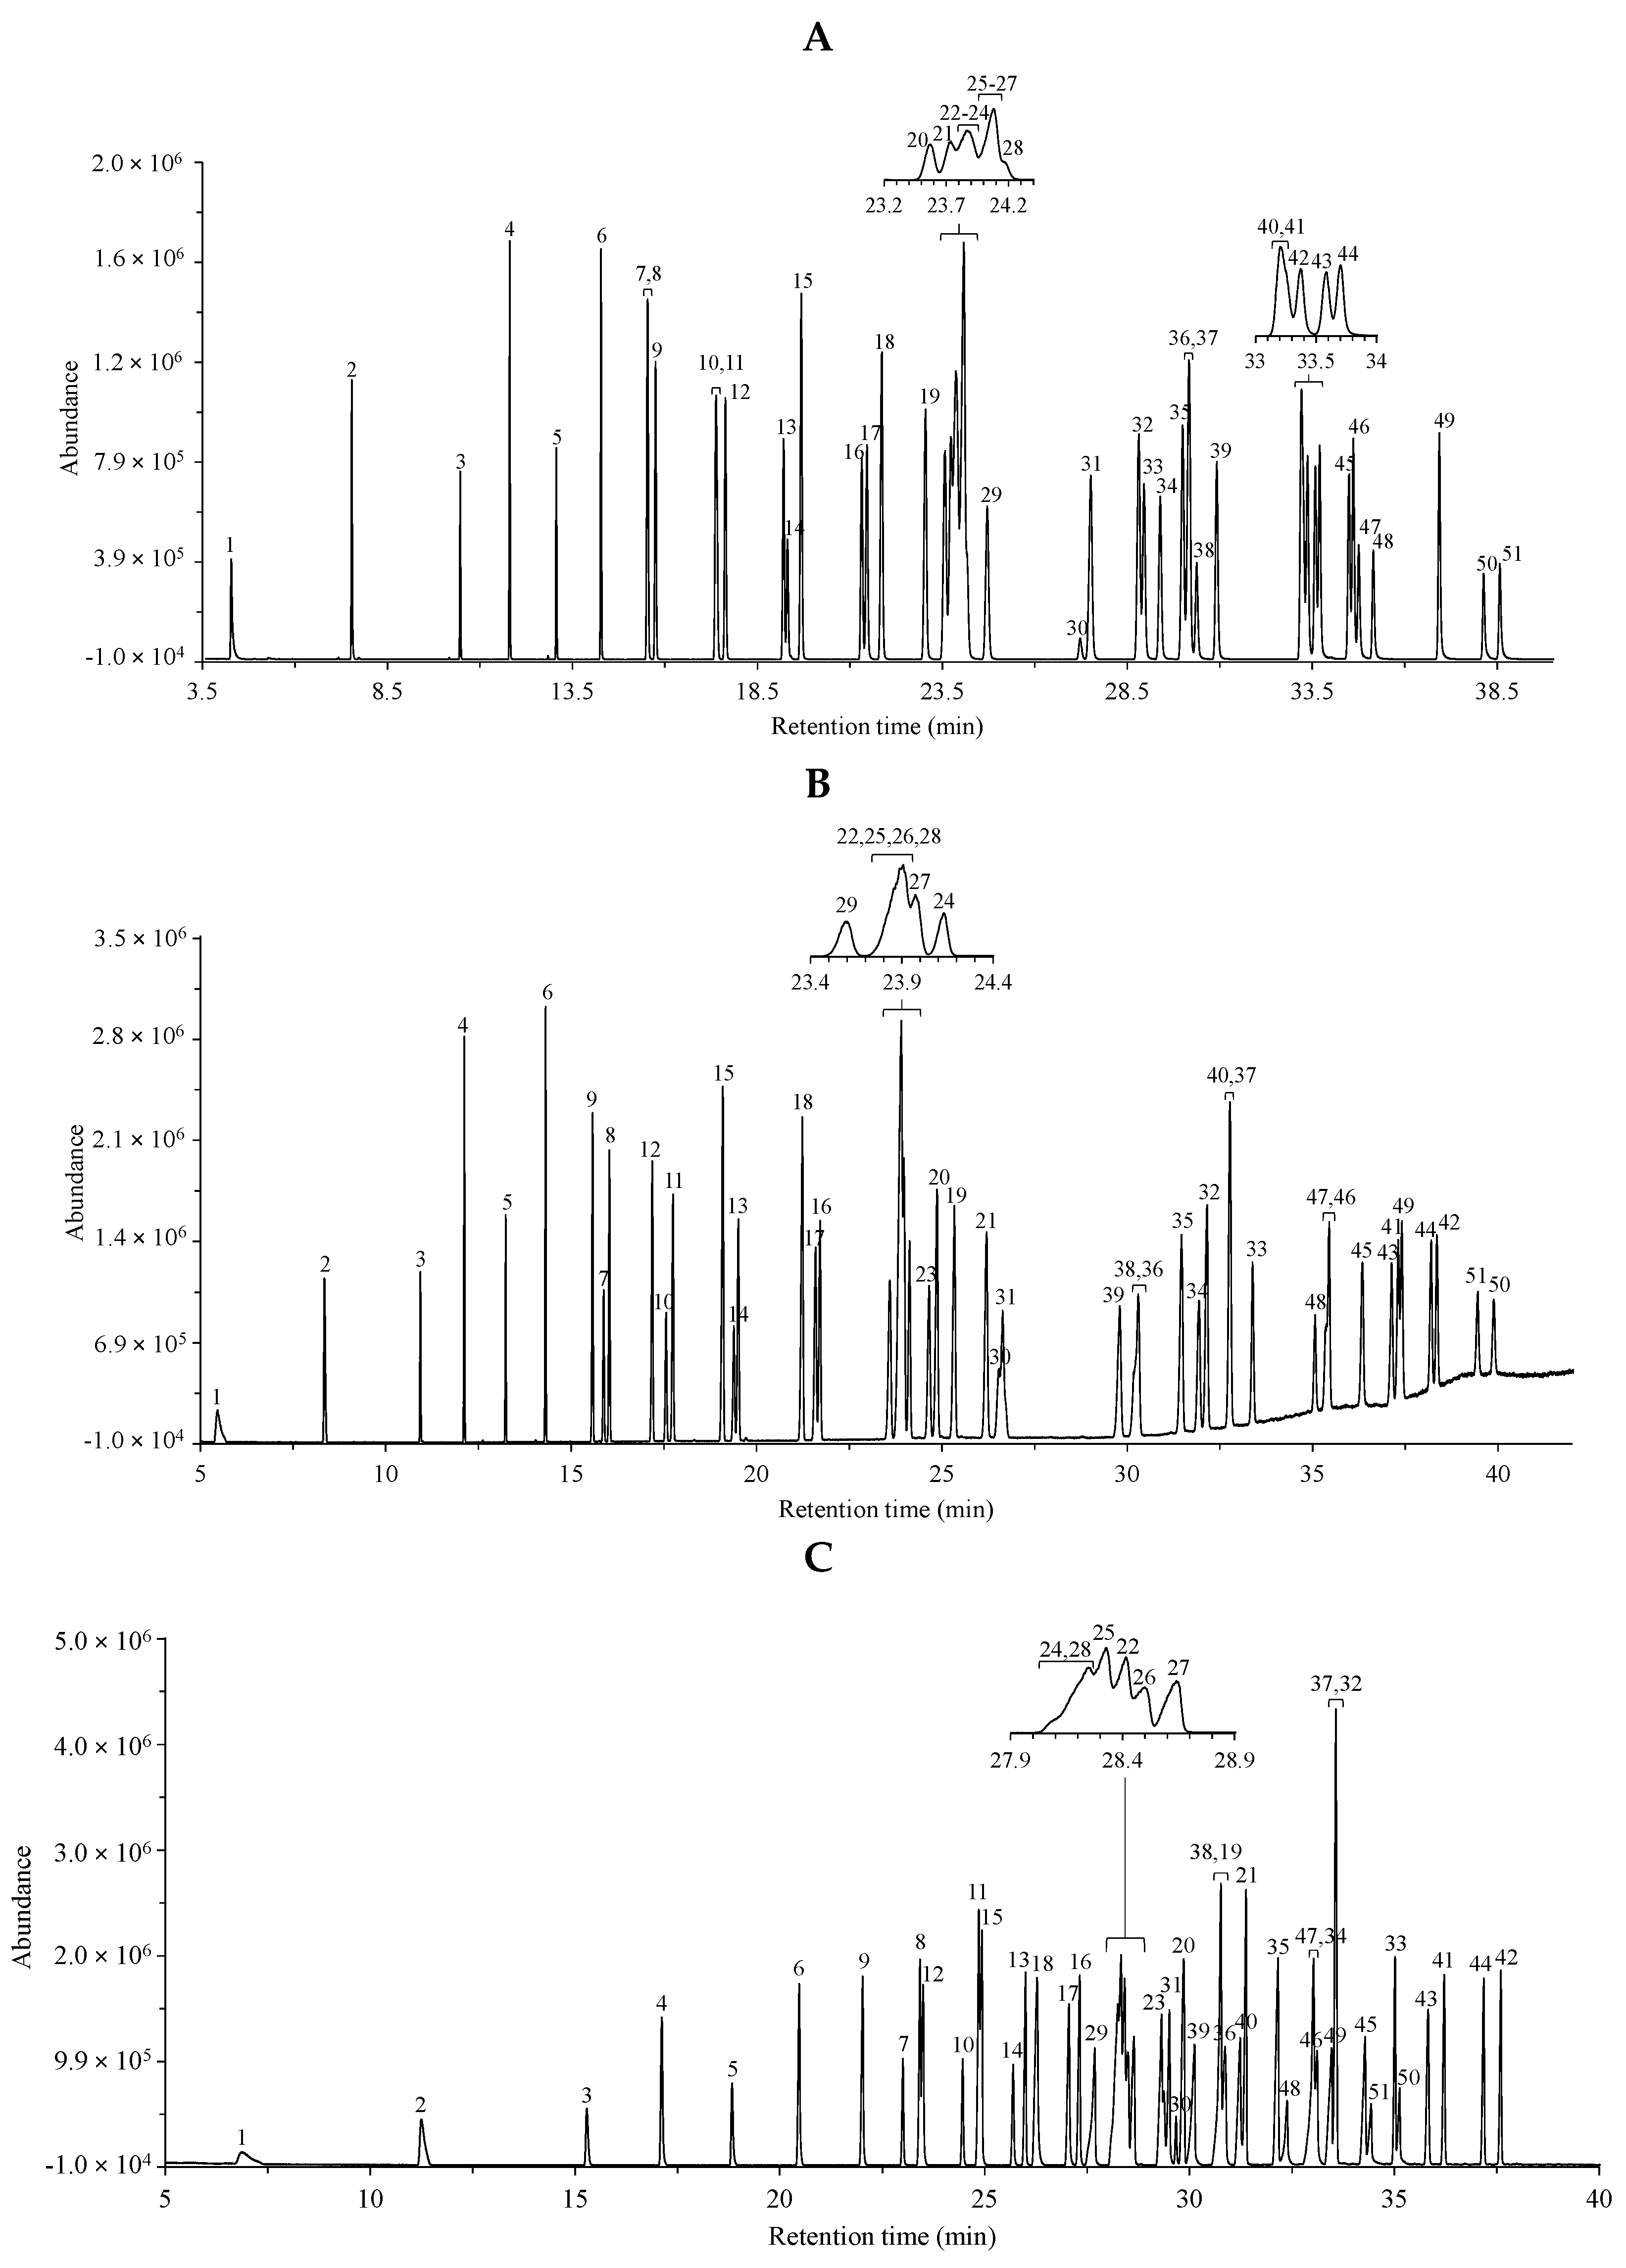
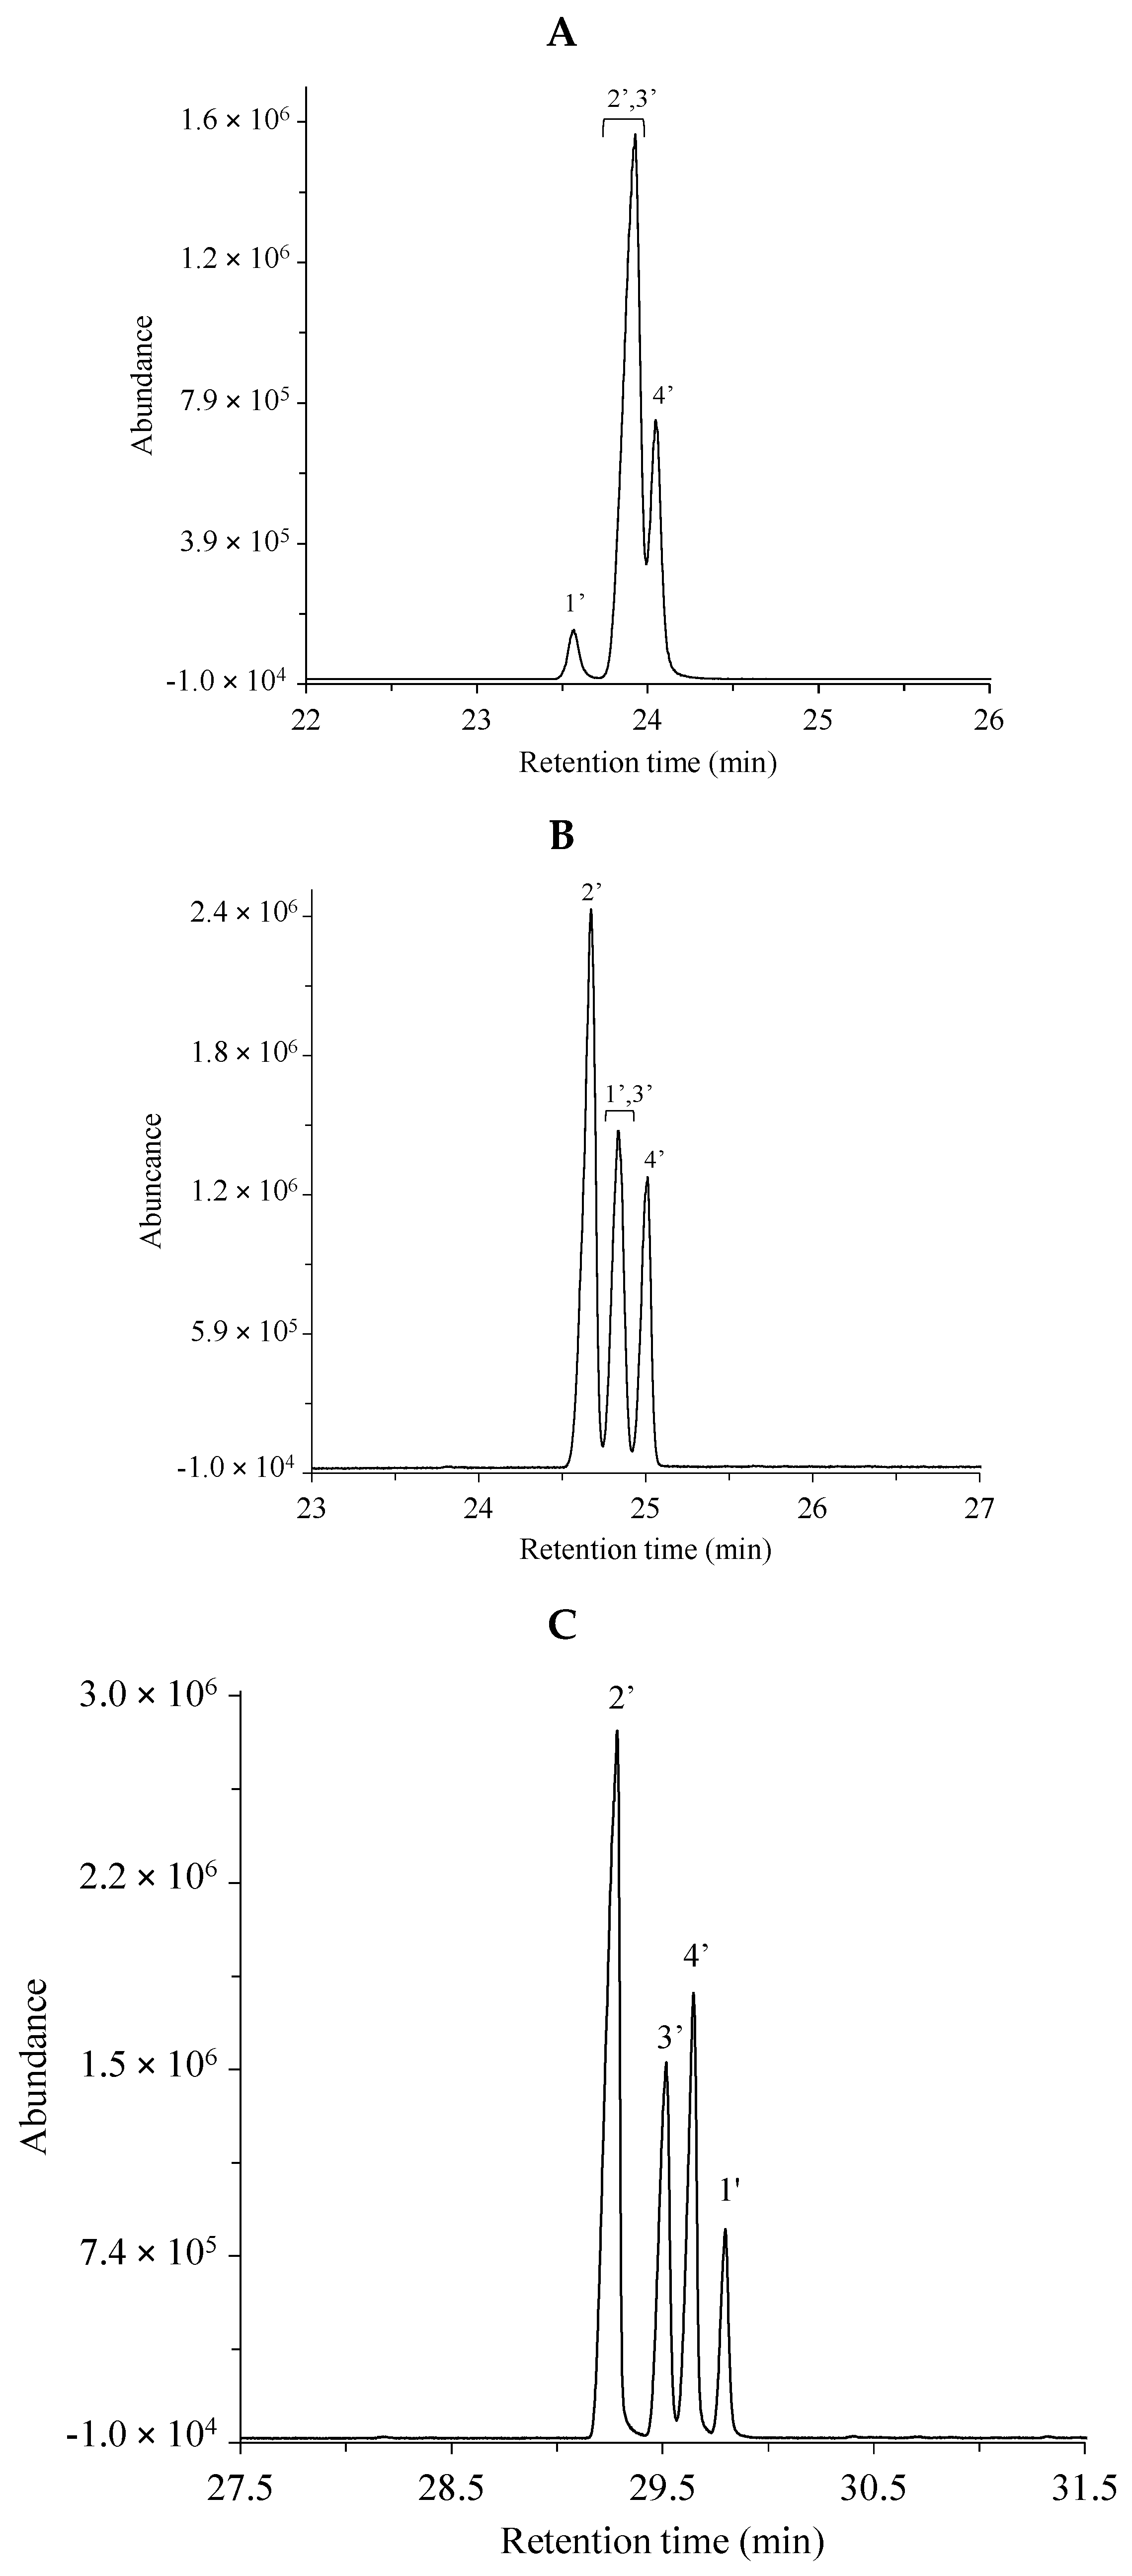
3.2. Evaluation of the Chromatograms

In order to characterize the separation efficiency of the different columns, some parameters were calculated. The theoretical plate number values (N) fell between 150,000 and 350,000, which are generally acceptable in GC–MS experiments. However, these data cannot provide a basis for the selection of a particular column, since the optimized experimental parameters are different. A decrease in the asymmetry factors (As) in the chromatograms was observed in the case of the SLB-IL111 column, when comparing the retention behavior of selected components in the experiments. However, the asymmetry factors of the peaks were above 0.7 in all cases of components with baseline separation.
Figure 3 shows the linear fitting and the coefficient of determination (R2) of the calibration plots for the four FAME components in the case of the CRM47794 mixture obtained by the GC separations with the SLB-IL111 column. (The validation data for the separations of both the GLC-674 and CRM47794 mixtures are summarized in the supplementary data (Table S1).) The calibration curve data were used to calculate the linear responses of the FAMEs. The values of R2 were higher than 0.91, 0.98 and 0.96 in the cases of the separations with the HP-5MS, DB-225MS and SLB-IL111 columns, respectively. With respect to the retention time, the values for system suitability RSD of the GLC-674 mixture were between the range of 0.00% and 0.08%, 0.00% and 0.04%, 0.01% and 0.05%, whereas in the case of the CRM47791 mixture, they were between 0.01% and 0.02%, 0.01% and 0.02%, 0.00% and 0.01% for the HP-5MS, DB-225MS and SLB-IL111 column, respectively. Regarding the concentration, the values for system suitability RSD of the GLC-674 mixture were between the range of 2.08% and 3.71%, 2.99% and 7.88%, 2.04% and 6.81%, whereas in the case of the CRM47791 mixture, they were between 2.26% and 3.06%, 3.30% and 4.53%, 2.45% and 3.22% for the HP-5MS, DB-225MS and SLB-IL111 column, respectively (see Table S1). The system suitability values correspond to the general criteria (retention time < 2% RSD, concentration < 10% RSD).
The mean values of repeatability were expressed by the relative standard deviation (RSD), and the average accuracy (%) values obtained for FAMEs are shown in Table S1. As can be seen from the table, the values for intraday RSD of the GLC-674 mixture were between the range of 4.99% and 9.98%, 2.89% and 8.97%, 2.69% and 8.04%, whereas in the case of the CRM47794 mixture, they were between 1.61% and 4.63%, 1.27% and 1.67%, 0.64% and 1.14% for the HP-5MS, DB-225MS and SLB-IL111 column, respectively.
The values for interday RSD of the GLC-674 mixture ranged between 4.27% and 9.11%, 1.45% and 8.51%, 1.22% and 4.15%, whereas in the case of the CRM47794 mixture, they were between 2.54% and 3.96%, 1.01% and 1.73%, 1.32% and 1.89% for the HP-5MS, DB-225MS and SLB-IL111 column, respectively. The intraday and interday repeatability values correspond to the general criteria (<10% RSD).
The average accuracies of the GLC-674 mixture were between the range of 101.8% and 108.8%, 95.1% and 105.3%, 96.1% and 109.5%, whereas in the case of the CRM47794 mixture, they were between 92.9% and 112.7%, 110.6% and 117.1%, 98.1% and 100.8% for the HP-5MS, DB-225MS and SLB-IL111 column, respectively. The average accuracy values correspond to the general criteria, where values between 80% and 120% are acceptable.
The LOD values were between 0.18 and 0.91 µg mL−1, between 0.45 and 0.60 µg mL−1 and between 0.02 and 0.18 µg mL−1, whereas the LOQ values were between 1.23 and 2.90 µg mL−1, between 1.36 and 1.91 µg mL−1 and between 0.26 and 0.77 µg mL−1 for the GLC-674 mixture in the cases of the separations with the HP-5MS, DB-225MS and SLB-IL111 columns, respectively. The LOD and LOQ values for the CRM47791 FAME mixture are listed in Table 3.

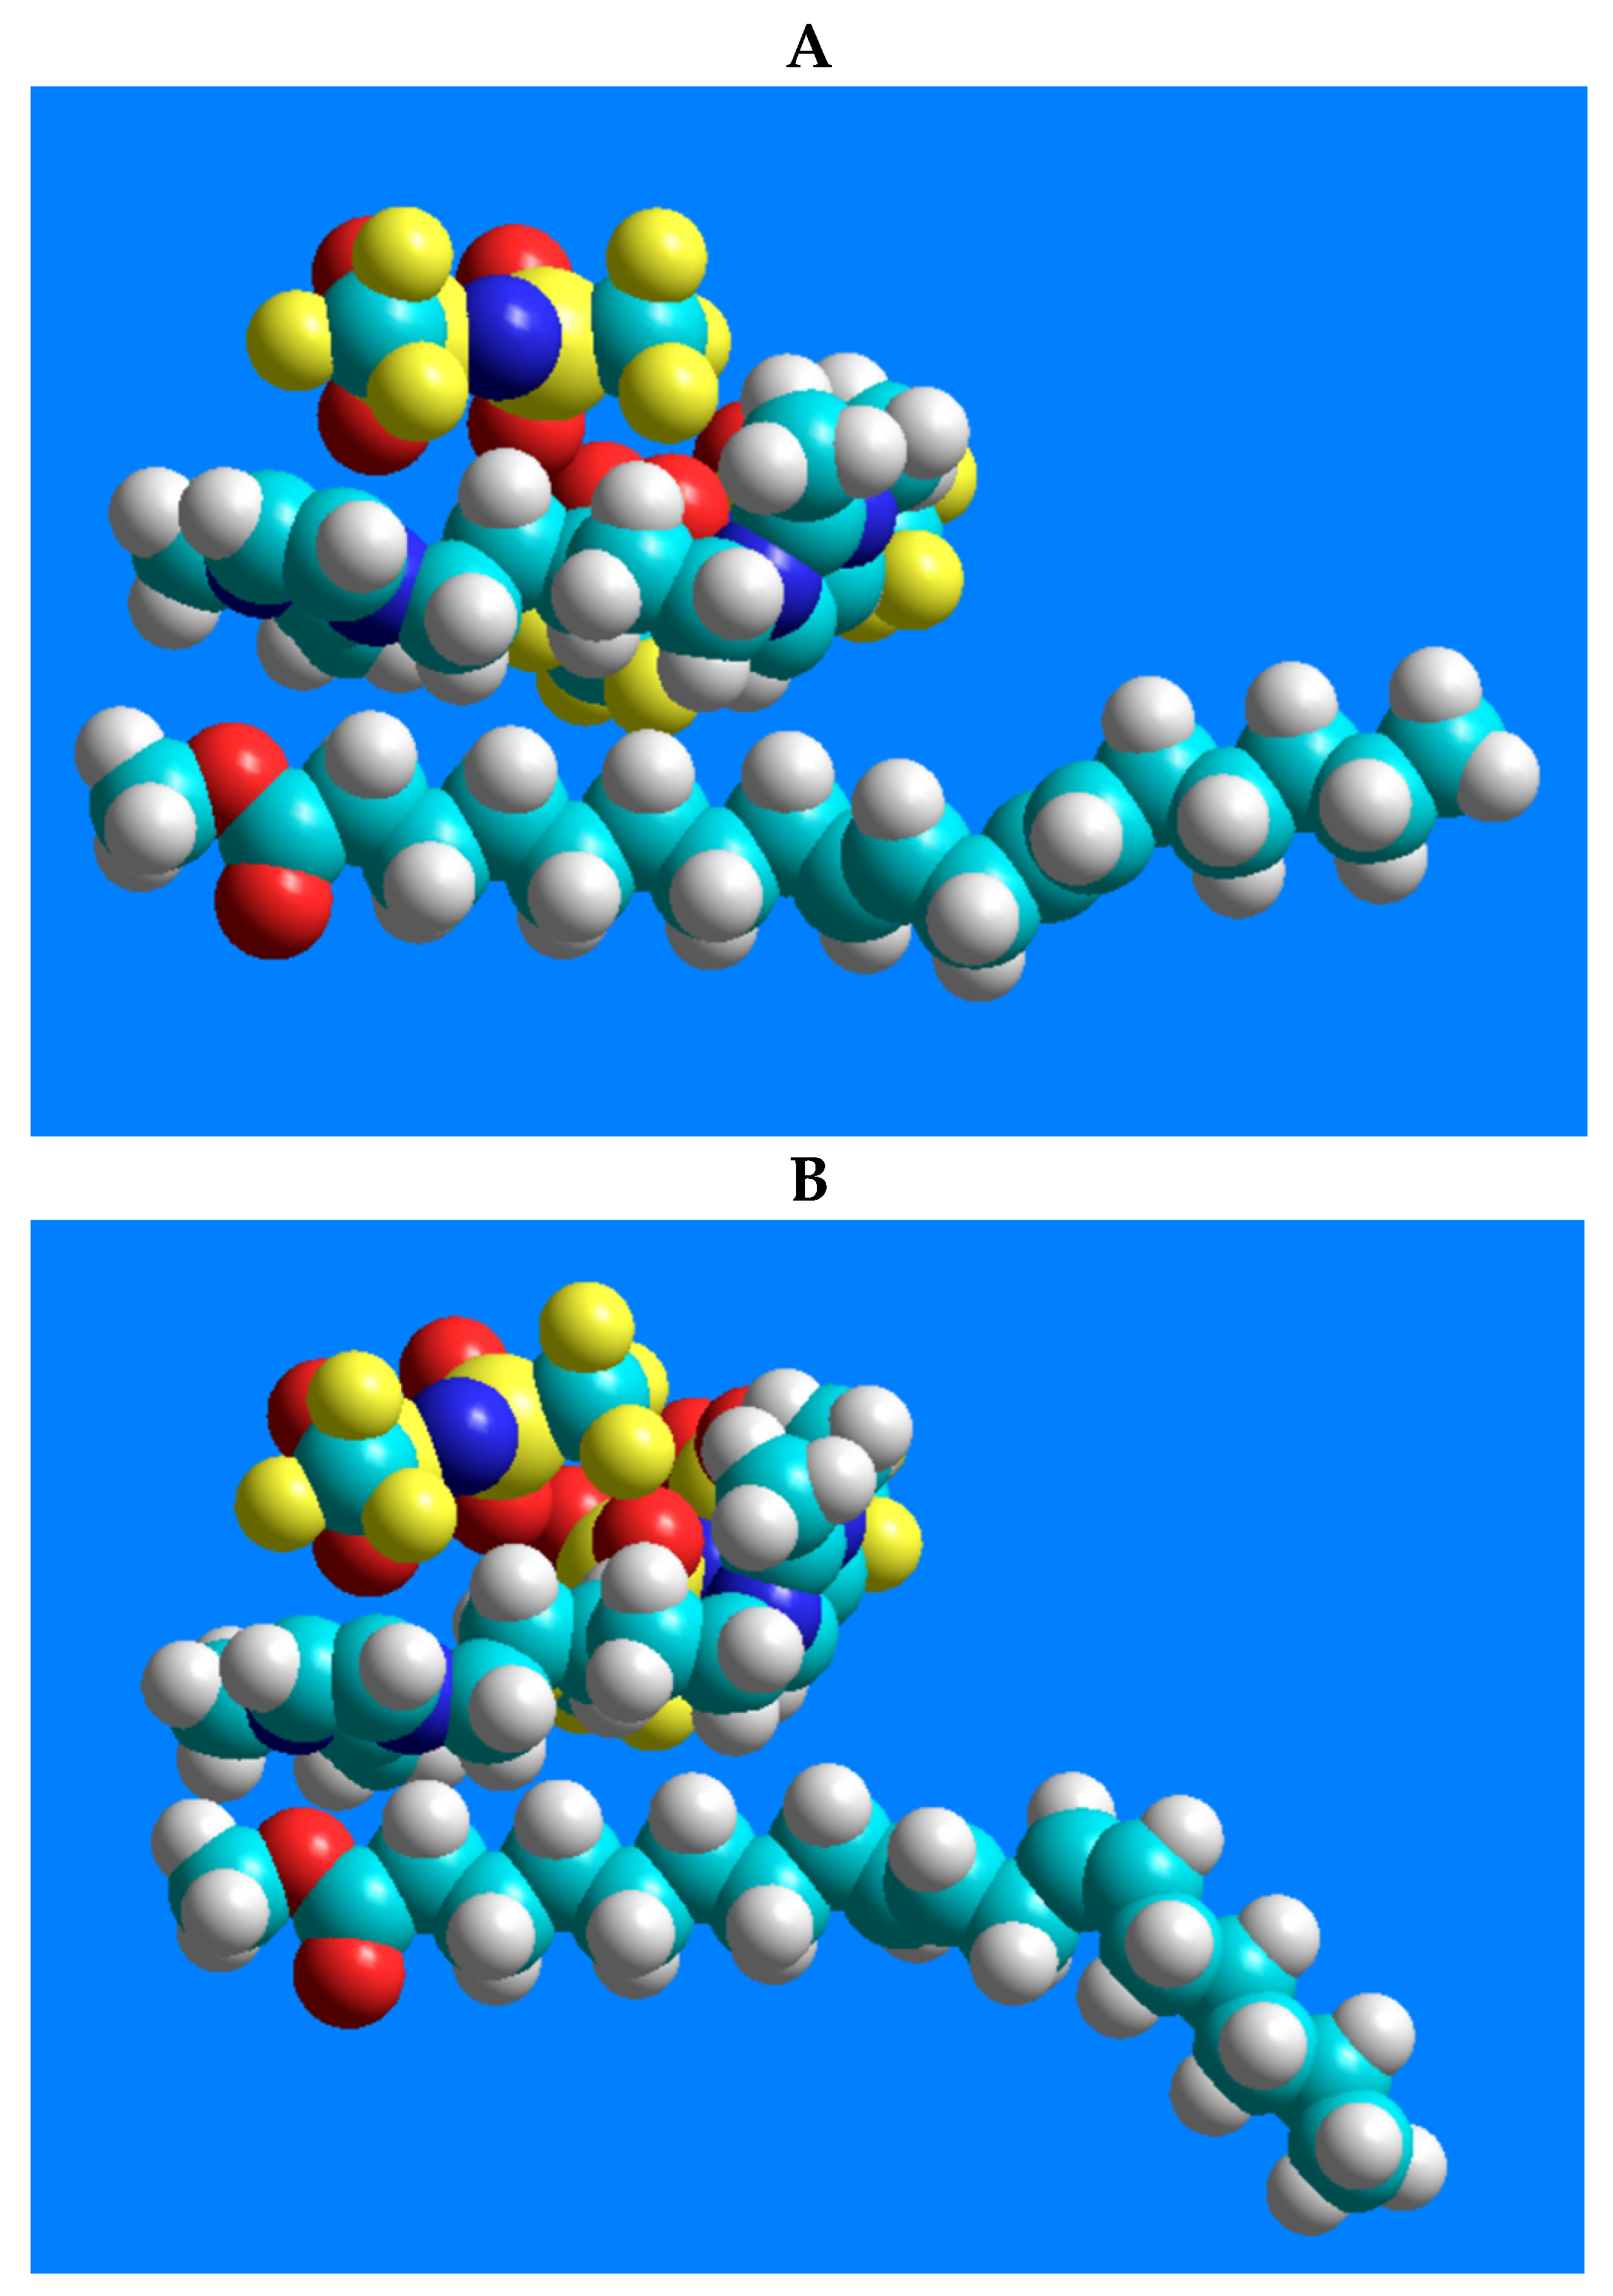
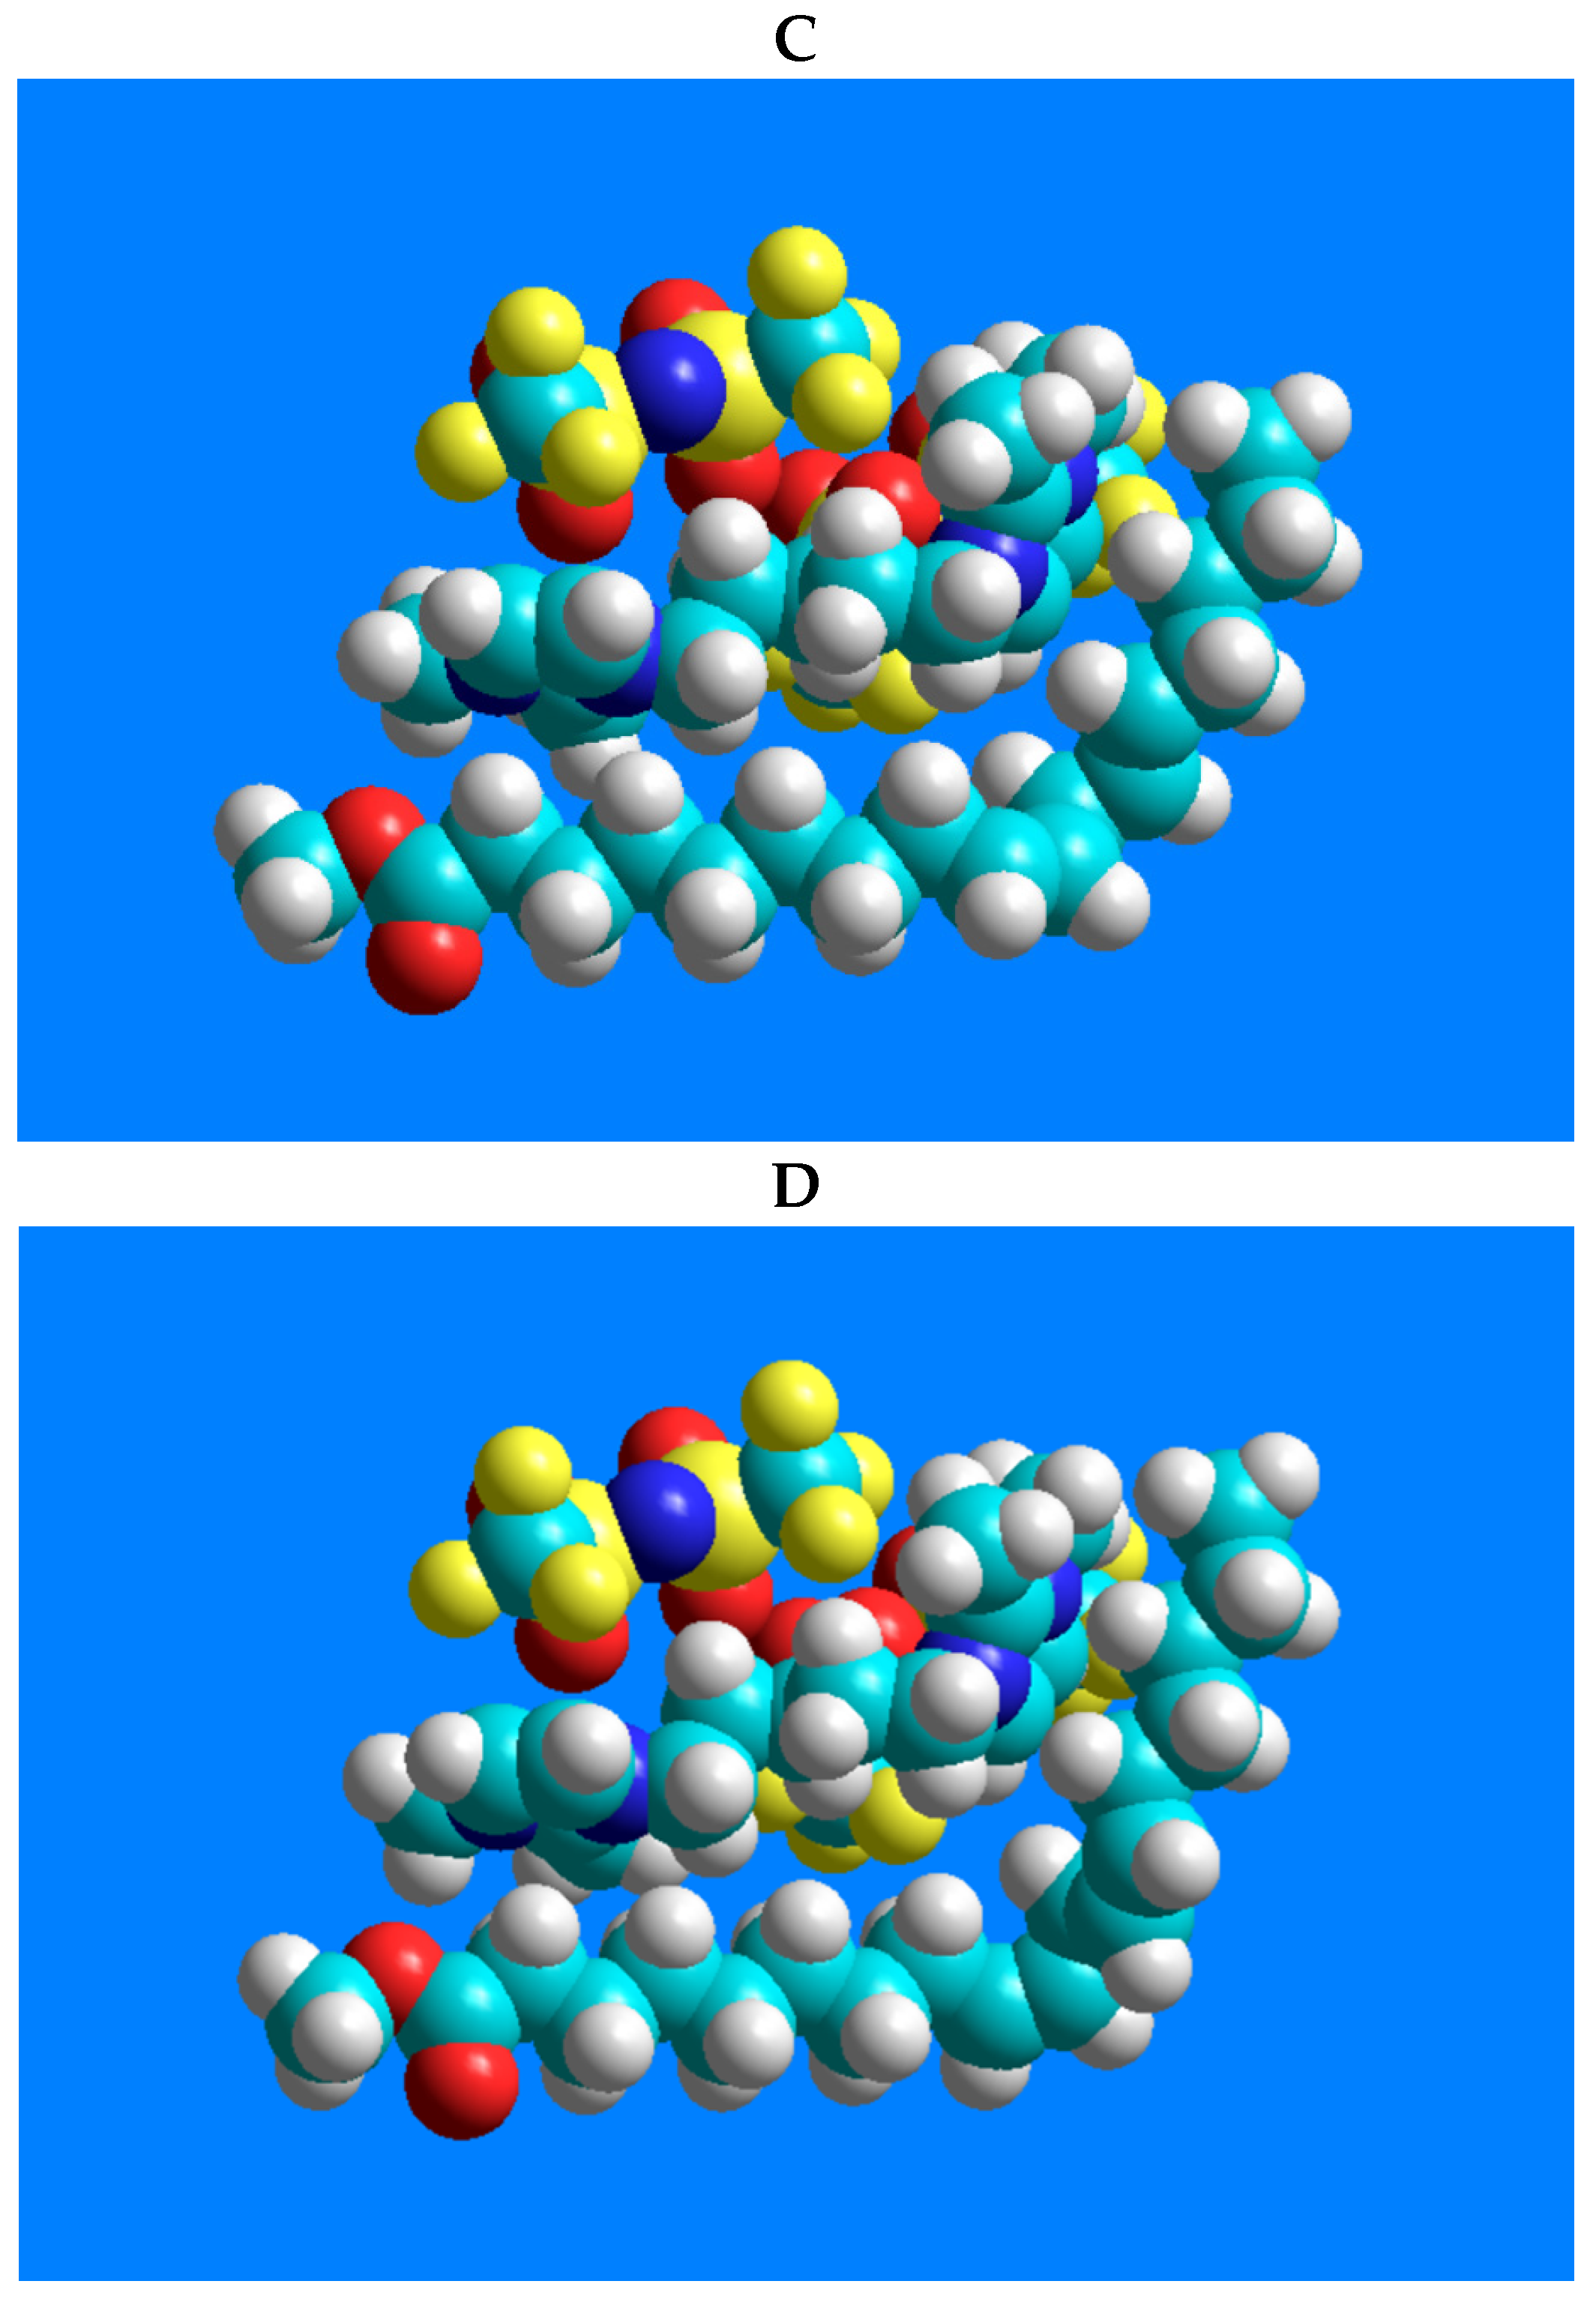
3.3. Ionic Liquid–FAME Interactions

In terms of the excellent separation of the four-component CRM47791 FAME mixture on the SLB-IL111 column, the three-dimensional models of 1,5-di(2,3-dimethylimidazolium)pentane bis(trifluoromethylsulfonyl)imide ionic liquid and the C18:2 FAME isomers (C18:2n-6cc, C18:2n-6tt, C18:2n-6tc and C18:2n-6ct), and their possible positions, were constructed. Figure 4 shows the lowest energy structures obtained by the modeling and emphasizes only the molecule moieties that presumably participate in the stationary phase–FAME interactions.

4. Discussion

Significant differences in the FAME separation properties were observed between the two polysiloxane-based columns and between the polysiloxane- and the IL-based columns. The results indicated that the non-polar and medium/high-polarity, polysiloxane-based columns were suitable for the separation of saturated and monounsaturated fatty acid groups, and the extremely polar, IL-based column is appropriate for the separation of fatty acids of diverse structures in the complex samples, which could not be completely resolved with the two other columns. In addition, fewer co-elutions could be observed on the SLB-IL111 column than on the polysiloxane-based columns (Figure 1 and Figure 2). All these can be explained by the different selectivities and polarities of the columns, and by the different distribution properties of the components in the stationary phases. Generally, non-polar analytes are more soluble in a non-polar stationary phase, which leads to higher retention. Accordingly, highly polar phases are used for the separation of polar analytes, where the separation mechanism depends on the polarity and volatility of components [25]. Polarizable analytes (FAMEs with double bonds) are more strongly retained on high-polarity columns compared to saturated FAMEs, due to the stronger dipole–dipole interactions. In fact, the high degree of unsaturation resulted in stronger retention in the cases of the highly polar columns.
For the polysiloxane polymer phases, the functional groups of the backbone chain can separate the components according to the chain length, the number and position of double bonds and the cis/trans isomerism. Additionally, there is the possibility of hydrogen bonding interaction between the terminal active hydroxyl group of the polymer and the ester group of the FAME. Similarly, a dispersion interaction can form between the alkyl side chain of the polymer and the carbon chain of the FAME. When the phase contains cyano groups (e.g., DB-225MS), it facilitates the better separation of cis/trans isomers. Regarding the IL-based column, there is the possibility of dipole–dipole attraction between the partially positive and negative parts of the stationary phase and the FAME, respectively. This interaction can be enhanced by the presence of an aromatic ring in the stationary phase (e.g., SLB-IL111). The hydrogen-bond-forming ability of imidazolium cations has been widely investigated [26,27,28,29]. In our case, the electron-deficient hydrogen atoms of the imidazolium cation may serve as the hydrogen donors of the hydrogen bonding, while the lone pair of electrons on an oxygen atom of the FAME ester group is the hydrogen acceptor. These intermolecular interactions collectively enable the higher retention of the components on the IL column and result in more efficient separation, especially in the case of the cis/trans isomers of the C18:2 region. This knowledge provides essential information in the confirmation of trans-fatty acid compositions in food industries [30,31], milk [32,33,34,35,36] and stool analysis [37,38,39].
There are predominantly cation–anion pairs in the ionic liquid phase, presumably in the arrangements shown in Figure 4. The lowest energy structures show that the most favorable position of the anions is when they are located above the imidazolium rings. Based on these, the anions are probably not involved in the interactions that would affect the separation. The secondary interactions mentioned above can mainly be formed by the ionic liquid cation, with the imidazolium ring and the pentane carbon chain. A link can be seen between the retention order of the isomers on the IL column and their polarity. The structure-related polarity of the components from low polarity to higher polarity is as follows: C18:2n-6tt, C18:2n-6tc, C18:2n-6ct, C18:2n-6cc. This order equals the retention order on the ionic liquid-based column.

5. Conclusions

The retention properties of two FAME mixtures (the 52-component GLC-674 and the 4-component CRM47791, including C4–C24 chain length compounds with high structural diversity) on three commercial capillary columns of different polarities were studied. The three columns show distinct selectivity towards saturated, unsaturated and cis/trans fatty acids, and the elution orders and co-elutions of FAME components were different. Although all three methods correspond to the validation criteria, the method developed for the SLB-IL111 column proves to be the most appropriate for the separation of cis and trans fatty acids. This is the first direct GC–MS separation of cis,cis-9,12; cis,trans-9,12; trans,cis-9,12 and trans,trans-9,12 C18:2 geometric isomers using a 30 m long ionic liquid-based column. With the two other columns (HP-5MS and DB-225MS), only 3 out of 4 C18:2 FAME isomers could be detected and separated. A wide variety of intermolecular interactions provided by the ionic liquid stationary phase allowed the successful separation of fatty acids of high structural heterogeneity and the baseline separation of the four geometric isomers of linoleic acid methyl ester. The results of the validation procedure indicate that this method is accurate, credible and suitable for the quantification of FAME analyses. Utilizing the excellent separation properties of the SLB-IL111 column, further studies will be conducted to determine fatty acids from various biological/clinical matrices from, e.g., bacteria, endotoxins and human fecal samples.

Supplementary Materials

The following are available online at https://0-www-mdpi-com.brum.beds.ac.uk/article/10.3390/separations8040038/s1, Table S1: Calibration curve equations, coefficient of determination, intra- and interday repeatability, system suitability and average accuracy of the FAMEs, determined in the GLC-674 and CRM47791 mixtures using the optimized methods for the three GC-columns. The optimized experimental conditions are detailed in Materials and Methods.

Author Contributions

Conceptualization, E.M., F.K., and L.M.; methodology, E.M., A.B., V.P., T.M., and L.M.; software, E.M., A.B., V.P. and L.M.; validation, E.M., A.B., V.P. and L.M.; investigation, E.M., A.B., V.P. and L.M.; writing—original draft preparation, E.M., A.B., C.P., V.P. and L.M.; writing—review and editing, F.K.; supervision, F.K. and L.M.; funding acquisition, E.M., A.B., L.M. and F.K. All authors have read and agreed to the published version of the manuscript.

Funding

The research was supported by the NKFIH K-125275, K-120193 and the PTE-AOK-KA-2017-19 grants, and the NKFIH in Hungary, within the framework of the 2020-4.1.1-TKP2020 3rd thematic program of the University of Pécs. EM acknowledges the financial support of the Gedeon Richter’s Talentum Foundation. LM acknowledges the financial support of the PTE-AOK-KA-2019-08 grant and AB acknowledges the financial support of the PTE-AOK-KA-2015-16.

Conflicts of Interest

The authors declare no financial/commercial conflicts of interest.

References

  1. Calder, P.C. Polyunsaturated fatty acids and inflammation and immunity. In Shock; Lippincott Williams & Wilkins: Philadelphia, PA, USA, 2004; Volume 21, p. 123. [Google Scholar] [CrossRef]
  2. Landgraf-Leurs, M.M.; Drummer, C.; Fröschl, H.; Steinhuber, R.; von Schacky, C.; Landgraf, R. Pilot study on omega-3 fatty acids in type I diabetes mellitus. Diabetes 1990, 39, 369–375. [Google Scholar] [CrossRef]
  3. Endo, J.; Arita, M. Cardioprotective mechanism of omega-3 polyunsaturated fatty acids. J. Cardiol. 2016, 67, 22–27. [Google Scholar] [CrossRef] [Green Version]
  4. Griinari, J.; Corl, B.; Lacy, S.; Chouinard, P.; Nurmela, K.; Bauman, D. Conjugated linoleic acid is synthesized endogenously in lactating dairy cows by Δ9-desaturase. J. Nutr. 2000, 130, 2285–2291. [Google Scholar] [CrossRef] [PubMed]
  5. Delmonte, P.; Fardin-Kia, A.R.; Kramer, J.K.; Mossoba, M.M.; Sidisky, L.; Tyburczy, C.; Rader, J.I. Evaluation of highly polar ionic liquid gas chromatographic column for the determination of the fatty acids in milk fat. J. Chromatogr. A 2012, 1233, 137–146. [Google Scholar] [CrossRef] [PubMed]
  6. Delmonte, P.; Kia, A.; Kramer, J.; Mossoba, M.; Sidisky, L.; Rader, J. Separation characteristics of fatty acid methyl esters using SLB-IL111, a new ionic liquid coated capillary gas chromatographic column. J. Chromatogr. A 2011, 1218, 545–554. [Google Scholar] [CrossRef] [PubMed]
  7. Ratnayake, W.; Pelletier, G. Positional and geometrical-isomers of linoleic-acid in partially hydrogenated oils. J. Am. Oil Chem. Soc. 1992, 69, 95–105. [Google Scholar] [CrossRef]
  8. David, F.; Sandra, P.; Vickers, A.K. Column selection for the analysis of fatty acid methyl esters. Agil. Technol. 2005, 19, 19. [Google Scholar]
  9. Hartig, C. Rapid identification of fatty acid methyl esters using a multidimensional gas chromatography-mass spectrometry database. J. Chromatogr. A 2008, 1177, 159–169. [Google Scholar] [CrossRef] [PubMed]
  10. He, L.; Prodhan, M.; Yuan, F.; Yin, X.; Lorkiewicz, P.; Wei, X.; Feng, W.; McClain, C.; Zhang, X. Simultaneous quantification of straight-chain and branched-chain short chain fatty acids by gas chromatography mass spectrometry. J. Chromatogr. B 2018, 1092, 359–367. [Google Scholar] [CrossRef] [PubMed]
  11. Fanali, C.; Micalizzi, G.; Dugo, P.; Mondello, L. Ionic liquids as stationary phases for fatty acid analysis by gas chromatography. Analyst 2017, 142, 4601–4612. [Google Scholar] [CrossRef] [PubMed]
  12. Gomez-Cortes, P.; Rodriguez-Pino, V.; Juarez, M.; de La Fuente, M. Optimization of milk odd and branched-chain fatty acids analysis by gas chromatography using an extremely polar stationary phase. Food Chem. 2017, 231, 11–18. [Google Scholar] [CrossRef] [PubMed]
  13. Yurchenko, S.; Sats, A.; Tatar, V.; Kaart, T.; Mootse, H.; Joudu, I. Fatty acid profile of milk from Saanen and Swedish Landrace goats. Food Chem. 2018, 254, 326–332. [Google Scholar] [CrossRef] [PubMed]
  14. Gomez-Cortes, P.; Brenna, J.; Lawrence, P.; de La Fuente, M. Novel characterisation of minor alpha-linolenic acid isomers in linseed oil by gas chromatography and covalent adduct chemical ionisation tandem mass spectrometry. Food Chem. 2016, 200, 141–145. [Google Scholar] [CrossRef] [PubMed] [Green Version]
  15. Fardin-Kia, A.; Delmonte, P.; Kramer, J.; Jahreis, G.; Kuhnt, K.; Santercole, V.; Rader, J. Separation of the Fatty Acids in Menhaden Oil as Methyl Esters with a Highly Polar Ionic Liquid Gas Chromatographic Column and Identification by Time of Flight Mass spectrometry. Lipids 2013, 48, 1279–1295. [Google Scholar] [CrossRef] [PubMed]
  16. Guo, Q.; Jiang, F.; Jin, J.; Li, Q.; Wang, F.; Wang, Q.; Ha, Y. Highly sensitive method for the quantification of trans-linolenic acid isomers in trilinolenin of edible oils using an ionic liquid capillary column. J. Sci. Food Agric. 2017, 97, 4697–4703. [Google Scholar] [CrossRef]
  17. Tyburczy, C.; Delmonte, P.; Fardin-Kia, A.; Mossoba, M.; Kramer, J.; Rader, J. Profile of trans Fatty Acids (FAs) Including Trans Polyunsaturated FAs in Representative Fast Food Samples. J. Agric. Food Chem. 2012, 60, 4567–4577. [Google Scholar] [CrossRef]
  18. Zeng, A.; Chin, S.; Nolvachai, Y.; Kulsing, C.; Sidisky, L.; Marriott, P. Characterisation of capillary ionic liquid columns for gas chromatography-mass spectrometry analysis of fatty acid methyl esters. Anal. Chim. Acta 2013, 803, 166–173. [Google Scholar] [CrossRef]
  19. Zuchowska-Grzywacz, M.; Kowalska, M. Trans Fatty Acids in food—Current legal regulations as protections for consumers and food manufacturers. Acta Aliment. 2019, 48, 105–114. [Google Scholar] [CrossRef]
  20. Baylin, A.; Kabagambe, E.K.; Siles, X.; Campos, H. Adipose tissue biomarkers of fatty acid intake. Am. J. Clin. Nutr. 2002, 76, 750–757. [Google Scholar] [CrossRef] [Green Version]
  21. Nu-Check-Prep, Inc. Available online: http://www.nu-chekprep.com/catalog.pdf (accessed on 23 January 2021).
  22. Dodds, E.D.; McCoy, M.R.; Rea, L.D.; Kennish, J.M. Gas chromatographic quantification of fatty acid methyl esters: Flame ionization detection vs. electron impact mass spectrometry. Lipids 2005, 40, 419–428. [Google Scholar] [CrossRef]
  23. Taverniers, I.; de Loose, M.; van Bockstaele, E. Trends in quality in the analytical laboratory. II. Analytical method validation and quality assurance. Trends Anal. Chem. 2004, 23, 535–552. [Google Scholar] [CrossRef]
  24. Allinger, N.L. Conformational-analysis. 130. MM2—Hydrocarbon force-field utilizing V1 and V2 torsional terms. J. Am. Chem. Soc. 1977, 99, 8127–8134. [Google Scholar] [CrossRef]
  25. Harynuk, J.; Wynne, P.M.; Marriott, P.J. Evaluation of new stationary phases for the separation of fatty acid methyl esters. Chromatographia 2006, 63, S61–S66. [Google Scholar] [CrossRef]
  26. Takamuku, T.; Tokuda, T.; Uchida, T.; Sonoda, K.; Marekha, B.; Idrissi, A.; Takahashi, O.; Horikawa, Y.; Matsumura, J.; Tokushima, T.; et al. Hydrogen bonds of the imidazolium rings of ionic liquids with DMSO studied by NMR, soft X-ray spectroscopy, and SANS. Phys. Chem. Chem. Phys. 2018, 20, 12858–12869. [Google Scholar] [CrossRef]
  27. Roy, S.; Mandal, S.; Banerjee, P.; Sarkar, N. Modification of fatty acid vesicle using an imidazolium-based surface active ionic liquid: A detailed study on its modified properties using spectroscopy and microscopy techniques. J. Chem. Sci. 2018, 130. [Google Scholar] [CrossRef] [Green Version]
  28. Zhang, Q.; Wang, N.; Yu, Z. The Hydrogen Bonding Interactions between the Ionic Liquid 1-Ethyl-3-Methylimidazolium Ethyl Sulfate and Water. J. Phys. Chem. B 2010, 114, 4747–4754. [Google Scholar] [CrossRef] [PubMed]
  29. Dong, K.; Zhang, S.; Wang, D.; Yao, X. Hydrogen bonds in imidazolium ionic liquids. J. Phys. Chem. A 2006, 110, 9775–9782. [Google Scholar] [CrossRef]
  30. Corazzin, M.; Romanzin, A.; Sepulcri, A.; Pinosa, M.; Piasentier, E.; Bovolenta, S. Fatty Acid Profiles of Cow’s Milk and Cheese as Affected by Mountain Pasture Type and Concentrate Supplementation. Animals 2019, 9, 68. [Google Scholar] [CrossRef] [Green Version]
  31. Schlormann, W.; Birringer, M.; Lochner, A.; Lorkowski, S.; Richter, I.; Rohrer, C.; Glei, M. In vitro fermentation of nuts results in the formation of butyrate and c9, t11 conjugated linoleic acid as chemopreventive metabolites. Eur. J. Nutr. 2016, 55, 2063–2073. [Google Scholar] [CrossRef]
  32. Halmemies-Beauchet-Filleau, A.; Vanhatalo, A.; Toivonen, V.; Heikkila, T.; Lee, M.R.; Shingfield, K.J. Effect of replacing grass silage with red clover silage on nutrient digestion, nitrogen metabolism, and milk fat composition in lactating cows fed diets containing a 60:40 forage-to-concentrate ratio. J. Dairy Sci. 2014, 97, 3761–3776. [Google Scholar] [CrossRef] [Green Version]
  33. Enjalbert, F.; Videau, Y.; Nicot, M.C.; Troegeler-Meynadier, A. Effects of induced subacute ruminal acidosis on milk fat content and milk fatty acid profile. J. Anim. Physiol. Anim. Nutr. 2008, 92, 284–291. [Google Scholar] [CrossRef] [PubMed] [Green Version]
  34. Szabo, E.; Boehm, G.; Beermann, C.; Weyermann, M.; Brenner, H.; Rothenbacher, D.; Decsi, T. trans Octadecenoic acid and trans octadecadienoic acid are inversely related to long-chain polyunsaturates in human milk: Results of a large birth cohort study. Am. J. Clin. Nutr. 2007, 85, 1320–1326. [Google Scholar] [CrossRef]
  35. Szabo, E.; Boehm, G.; Beermann, C.; Weyermann, M.; Brenner, H.; Rothenbacher, D.; Decsi, T. Fatty acid profile comparisons in human milk sampled from the same mothers at the sixth week and the sixth month of lactation. J. Pediatr. Gastroenterol. Nutr. 2010, 50, 316–320. [Google Scholar] [CrossRef] [PubMed]
  36. Zanferari, F.; Vendramini, T.H.A.; Rentas, M.F.; Gardinal, R.; Calomeni, G.D.; Mesquita, L.G.; Takiya, C.S.; Renno, F.P. Effects of chitosan and whole raw soybeans on ruminal fermentation and bacterial populations, and milk fatty acid profile in dairy cows. J. Dairy Sci. 2018, 101, 10939–10952. [Google Scholar] [CrossRef] [PubMed]
  37. Wan, J.; Hu, S.; Ni, K.; Chang, G.; Sun, X.; Yu, L. Characterisation of Fecal Soap Fatty Acids, Calcium Contents, Bacterial Community and Short-Chain Fatty Acids in Sprague Dawley Rats Fed with Different sn-2 Palmitic Triacylglycerols Diets. PLoS ONE 2016, 11, e0164894. [Google Scholar] [CrossRef] [PubMed]
  38. Devillard, E.; McIntosh, F.M.; Paillard, D.; Thomas, N.A.; Shingfield, K.J.; Wallace, R.J. Differences between human subjects in the composition of the faecal bacterial community and faecal metabolism of linoleic acid. Microbiology 2009, 155, 513–520. [Google Scholar] [CrossRef] [Green Version]
  39. De Koninck, A.; Nys, K.; Vandenheede, B.; van Biervliet, S.; Speeckaert, M.; Delanghe, J. Detailed faecal fat analysis using Fourier transform infrared spectroscopy: Exploring the possibilities. Clin. Biochem. 2016, 49, 1283–1287. [Google Scholar] [CrossRef]
Figure 1. Total ion chromatograms of the GLC-674 fatty acid methyl ester mixture using the (A) non-polar HP-5MS column, (B) the medium/high polar DB-225MS column and (C) the extremely polar, ionic liquid-based SLB-IL111 column. The peak labels indicate components listed in Table 1 according to the retention order in the separation with the HP-5MS column. The optimized experimental conditions are detailed in Materials and Methods. Total FAME concentration is 0.5 mg mL−1.
Separations 08 00038 g001
Figure 2. Total ion chromatograms of the CRM47741 fatty acid methyl ester mixture using the (A) non-polar HP-5MS column, (B) the medium/high polar DB-225MS column and (C) the extremely polar, ionic liquid-based SLB-IL111 column. The peak labels indicate components listed in Table 2 according to the retention order in the separation with the HP-5MS column. The optimized experimental conditions are detailed in Materials and Methods. Total FAME concentration is 80.6 µg mL−1.
Separations 08 00038 g002
Figure 3. Calibration plots for fatty acid methyl esters in the CRM47741 mixture. Cumulative graph of the assay in the range of 0.008–0.08 mg mL−1 with 5 points of calibration in three (n=3) separate calibrations, mean values of calibration concentrations represented by dots and ±SDs. (A) C18:2n-6tt, (B) C18:2n-6tc, (C) C18:2n-6ct and (D) C18:2n-6cc analyzed by the SLB-IL111 GC column.
Separations 08 00038 g003aSeparations 08 00038 g003b
Figure 4. Models of the possible positioning of the 1,5-di(2,3-dimethylimidazolium)pentane bis(trifluoromethylsulfonyl)imide ionic liquid and the geometric isomers of linoleic acid methyl ester. The structure-related polarity of the components from low polarity to higher polarity is as follows: (A) C18:2n-6tt, (B) C18:2n-6tc, (C) C18:2n-6ct, (D) C18:2n-6cc.
Separations 08 00038 g004aSeparations 08 00038 g004b
Table 1. Retention time values of fatty acid methyl ester components in the GLC-674 mixture using the optimized separation methods for the three GC columns. The optimized experimental conditions are detailed in Materials and Methods.
Peak LabelCompound IDSystematic Name (Common Name)HP-5MS
(min)
DB-225MS
(min)
SLB-IL111
(min)
C4:0 Butanoic acid methyl ester
(Methyl butyrate)
n.d.n.d.n.d.
1C6:0 Hexanoic acid methyl ester
(Methyl caproate)
4.295.466.87
2C8:0 Octanoic acid methyl ester
(Methyl caprylate)
7.548.3511.24
3C10:0 Decanoic acid methyl ester
(Methyl caprate)
10.4710.9415.28
4C11:0 Undecanoic acid methyl ester
(Methyl undecanoate)
11.8112.1217.12
5C12:0 Dodecanoic acid methyl ester
(Methyl laurate)
13.0713.2418.83
6C13:0 Tridecanoic acid methyl ester14.2814.3120.47
7C14:1n-5t trans-9-Tetradecenoic acid methyl ester (Methyl 9-trans-myristelaidate) 15.5315.8823.00
8C14:1n-5 cis-9-Tetradecenoic acid methyl ester (Methyl 9-cis-myristoleat) 15.5316.0423.42
9C14:0 Tetradecanoic acid methyl ester
(Methyl myristate)
15.7515.5822.02
10C15:1n-5t trans-10-Pentadecenoic acid methyl ester (Methyl 10-trans-pentadecenoate) 17.3917.5624.46
11C15:1n-5 cis-10-Pentadecenoic acid methyl ester (Methyl 10-cis-pentadecenoate) 17.3917.7524.85
12C15:0 Pentadecanoic acid methyl ester
(Methyl pentadecanoate)
17.6417.1923.49
13C16:1n-7 cis-9-Hexadecenoic acid methyl ester (Methyl palmitoleate)19.2119.5125.99
14C16:1n-7t trans-9-Hexadecenoic acid methyl ester (Methyl palmitelaidate)19.3219.3925.69
15C16:0 Hexadecanoic acid methyl ester (Methyl palmitate)19.6919.0924.93
16C17:1n-7 cis-10-Heptadecenoic acid methyl ester (Methyl 10-heptadecenoate) 21.3221.7127.31
17C17:1n-7t trans-10-Heptadecenoic acid methyl ester (Methyl 10-trans-heptadecenoate) 21.4621.5927.05
18C17:0 Heptadecanoic acid methyl ester
(Methyl heptadecenoate)
21.8621.2426.27
19C18:3n-6 cis,cis,cis-6,9,12-Octadecatrienoic acid methyl ester (Methyl γ-linolenate) 23.0525.3430.76
20C18:2n-6cccis,cis-9,12-Octadecadienoic acid methyl ester (Methyl linoleate) 23.5724.8729.86
21C18:3n-3 cis,cis,cis-9,12,15-Octadecatrienoic acid methyl ester (Methyl α-linolenate) 23.7426.2131.38
22C18:1n-9 cis-9-Octadecenoic acid methyl ester
(Methyl oleate)
23.8723.9128.41
23C18:2n-6tt trans,trans-9,12-Octadecadienoic acid methyl ester (Methyl linoelaidate) 23.8724.6629.32
24C18:1n-7 cis-11-Octadecenoic acid methyl ester (Methyl cis-vaccenate) 23.8724.1328.25
25C18:1n-9t cis-9-Octadecenoic acid methyl ester (Methyl elaidate) 24.0823.9128.33
26C18:1n-12t trans-6-Octadecenoic acid methyl ester (Methyl petroselaidate) 24.0823.9128.50
27C18:1n-12 cis-6-Octadecenoic acid methyl ester (Methyl petroselinoate) 24.0823.9828.64
28C18:1n-7t trans-11-Octadecenoic acid methyl ester (Methyl trans-vaccenate) 24.1523.9128.25
29C18:0 Octadecanoic acid methyl ester
(Methyl stearate)
24.7223.6027.68
30C19:1n-12t trans-7-Nonadecenoic acid methyl ester (Methyl 7-trans-nonadecenoate) 27.2326.5429.50
31C19:1n-9t cis-10-Nonadecenoic acid methyl ester (Methyl 10-trans-nonadecenoate) 27.5126.6429.37
32C20:4n-6 cis,cis,cis,cis-5,8,11,14-Eicosatetraenoic acid methyl ester (Methyl arachidonate) 28.8132.1533.57
33C20:5n-3 cis,cis,cis,cis,cis-5,8,11,14,17-Eicosapentaenoic acid methyl ester
(Methyl eicosapentaenoate)
28.9533.3935.02
34C20:3n-6 cis,cis,cis-8,11,14-Eicosatrienoic acid methyl ester (Methyl dihomo-γ linolenate) 29.3931.9333.03
35C20:2n-6 cis,cis-11,14-Eicosadienoic acid methyl ester (Methyl 11-14-eicosadienoate) 30.0031.4732.16
36C20:1n-9 cis-11-Eicosenoic acid methyl ester (Methyl gondoate) 30.1730.3030.87
37C20:3n-3 cis,cis,cis-11,14,17-Eicosapentaenoic acid methyl ester (Methyl 11-14-17-eicosatrienoate) 30.1732.7733.57
38C20:1n-9t trans-11-Eicosenoic acid methyl ester (Methyl 11-trans-eicosenoate) 30.3830.2230.76
39C20:0 Eicosanoic acid methyl ester
(Methyl arachidate)
30.9229.7930.11
40C21:0 Heneicosanoic acid methyl ester
(Methyl heneicosanoate)
33.2132.7731.23
41C22:5n-6 cis,cis,cis,cis,cis-4,7,10,13,16-Docosapentaenoic acid methyl ester (Osbond acid methyl ester) 33.2137.3136.22
42C22:6n-3 cis,cis,cis,cis,cis,cis-4,7,10,13,16,19-Docosahexaenoic acid methyl ester (Methyl docosahexaenoate, DHA) 33.3738.3637.60
43C22:4n-6 cis,cis,cis,cis-7,10,13,16-Docosatetraenoic acid methyl ester (Methyl adrenate) 33.5837.1335.82
44C22:5n-3 cis,cis,cis,cis,cis-7,10,13,16,19-Docosapentenoic acid methyl ester
(Methyl clupanodonat)
33.7038.1937.18
45C22:2n-6 cis,cis-13,16-Docosadienoic acid methyl ester (Methyl 13-16-docosadienoate) 34.4936.3434.28
46C22:1n-9 cis-13-Docosenoic acid Methyl ester (Methyl erucate) 34.6135.4433.11
47C22:1n-9t cis-13-Docosenoic acid methyl ester (Methyl brassidate) 34.7635.3732.96
48C22:0 Docosanoic acid methyl ester
(Methyl behenate)
35.1535.0632.38
49C23:0 Tricosanoic acid methyl ester
(Methyl tricosanoate)
36.9437.4133.46
50C24:1n-9 cis-15-Tetracosenoic acid methyl ester (Methyl nervonate) 38.1339.8935.12
51C24:0 Tetracosanoic acid methyl ester
(Methyl lignocerate)
38.5739.4534.43
The overlapping peaks’ retention time values are given in bold. n.d.: not detected.
Table 2. Retention time values of FAME components in the CRM47791 mixture using the optimized methods for the three GC columns. The optimized experimental conditions are detailed in Materials and Methods.
Peak LabelCompound IDSystematic Name (Common Name)HP-5MS(min)DB-225MS (min)SLB-IL111 (min)
1′C18:2n-6cccis,cis-9,12-Octadecadienoic acid methyl ester (Methyl linoleate)23.5624.8129.77
2′C18:2n-6tttrans,trans-9,12-Octadecadienoic acid methyl ester (Methyl linoelaidate)23.8924.6429.24
3′C18:2n-6tctrans,cis-9,12-Octadecadienoic acid methyl ester23.8924.8129.48
4′C18:2n-6ctcis,trans-9,12-Octadecadienoic acid methyl ester24.0224.9829.61
The overlapping peaks’ retention time values are given in bold. The cis/trans isomerism of the C18:2 esters is indicated in the Compound ID, as well.
Table 3. Limit of detection (LOD) and limit of quantification (LOQ) values for components in the CRM47791 mixture determined by GC–MS using the optimized methods for the three GC columns. The optimized experimental conditions are detailed in Materials and Methods.
FAMEsHP–5MSDB-225MS SLB-IL111
LOD a (g mL−1) LOQ b (g mL−1) LOD a (g mL−1) LOQ b (g mL−1) LOD a (g mL−1) LOQ b (g mL−1)
C18:2n-6cc0.330.980.511.200.260.74
C18:2n-6tt1.193.913.016.330.351.38
C18:2n-6tc0.461.670.972.960.090.47
C18:2n-6ct0.432.151.022.410.150.93
a The LOD values were measured at S/N ratio > 3. b The LOQ values were measured at S/N ratio > 10.
Publisher’s Note: MDPI stays neutral with regard to jurisdictional claims in published maps and institutional affiliations.

