Article

A Study on the Reaction Kinetics of Anaerobic Microbes Using Batch Anaerobic Sludge Technique for Beverage Industrial Wastewater

1
Department of Chemical Engineering, NFC Institute of Engineering and Technology, Multan 60000, Pakistan
2
State Key Laboratory of Fine Chemicals, School of Chemical Engineering, Dalian University of Technology, Dalian 116024, China
3
Department of Chemistry, Shaheed Benazir Bhutto Women University, Peshawar 25000, Pakistan
4
Department of Chemical Engineering, Universiti Teknologi Petronas, Seri Iskandar 31750, Malaysia
5
Institute of Biochemistry and Biotechnology, University of the Punjab, Lahore 54590, Pakistan
6
Institute of Chemical Engineering & Technology, University of the Punjab, Lahore 54590, Pakistan
7
Institute of Chemical, Environmental and Bio Science Engineering, TU WIEN, 1040 Vienna, Austria
*
Author to whom correspondence should be addressed.
Submission received: 2 March 2021 / Revised: 20 March 2021 / Accepted: 29 March 2021 / Published: 1 April 2021
(This article belongs to the Section Environmental Separations)

Abstract

:
In this study, a low-cost, efficient, and environmentally friendly anaerobic sludge process for the treatment of industrial beverage wastewater was investigated to analyze the effect of bacteria growth on the degradation of organic matter (chemical oxygen demand). Additionally, the mechanism, interactions between the microbe’s growth, and operating conditions of an anaerobic batch reactor along with the wastewater treatment efficiency were evaluated via microbial kinetics. The kinetic coefficients based on chemical oxygen demand (COD) by conventional techniques such as kinetic coefficients growth yield (0.46 mg VSS/mg COD), saturation coefficient (3500 mg/L COD), the maximum rate of substrate utilization per unit mass of biomass (0.0066 mg/L COD), growth rate by Monod equation, M (0.03833 L/h), and maximum growth rate, μm (0.03672 L/h) were calculated. The results show a higher rate of substrate degradation (0.54 day−1) due to the high COD removal efficiency (CRE) of 99.31% during 13 days that was achieved, which can be attributed to the active involvement of anaerobic microbes in the process of degradation. Based on these results, it can be concluded that the current study can be used as an effective way to analyze the industrial beverage wastewater at commercial levels.

1. Introduction

Accessibility of freshwater resources is one of the serious and life-threatening issues facing our current society. In the current scenario, about one-third of the world population is striving for a freshwater supply, which ultimately affects the ecosystem’s sustainability. Pakistan was once a supererogatory water country; now, it has become a water shortfall country due to several unavoidable reasons, including the improper management of natural water resources. The accessibility of water was 1299 m3 per capita recorded in 1997, and now reduced to 1100 m3 per capita (less than 700 m3 per capita is expected in 2025) [1]. One of the significant reasons for the limited freshwater supply in Pakistan is the waste effluents that ultimately pollute freshwater resources due to poor sanitation and waste management issues. In Pakistan, most of the municipal and industrial effluent is released directly into a sewerage system, drinking water streams, nearby farming fields, or open tanks that result in secondary pollution to the freshwater supply. As industrial wastewater is the source of water pollution (heavy metals, organic compounds, and toxic chemicals), improper disposal of untreated industrial effluent may pose life-threatening issues to human and aquatic life [2]. The growing industries of Pakistan, including iron, petrochemical, pulp and paper, vegetable oil, food manufacturing, pharmaceutical, and others, discharge several types of environmental pollutants such as suspended solids (SS), dissolved organics (DO), organic compounds, toxic gases, and many types of bacteria and viruses which may pollute clean water lines. The resulting water pollution from the contaminants mentioned above can ultimately cause different diseases, including stomach ulcers, acute gastroenteritis, diarrhea, and other severe health impacts upon long-term exposure [3,4]. Among various industrial units, food industry wastewater has the highest organic components and nutrient content, resulting in a high chemical oxygen demand (COD) that may reach thousands of milligrams per liter and may act as an enriched food colony for various life-threatening microbes [5,6]. According to a report published by China’s National Bureau of Statistics, the wastewater discharged from the food processing industry produces approximately 19% of the total industrial waste that can ultimately pose severe environmental concerns in the case of improper waste management [5].
Considering the environmental consequences of wastewater pollution originating from the food and beverage industry, there is a dire need for effective methods to treat industrial wastewater before its discharge into the surrounding environment. For proper control of such pollution, several treatment options can be effectively employed, such as adsorption [7], ion exchange [8], and membrane separation [7,9]. However, these techniques have some limitations, such as high cost, complex plant setup, and secondary pollution [10]. Among them, anaerobic sludge is considered one of the most suitable techniques to treat wastewater due to its better economic performance and the elimination of secondary pollution problems [11].
In this technique, organic solids or soluble organics presenting in wastewater are typically converted into gaseous end products through the process of degradation [12]. In this treatment method, a bacterial biomass (the anaerobic sludge) is generally responsible for reducing wastewater pollutants. Depending on the optimal design and specific operating conditions, the anaerobic-sludge-based wastewater treatment process removes organic substances and can effectively achieve biological nitrogen and biological phosphorous removal. Much research has been done to improve and propose optimal anaerobic sludge process configurations during recent years [13,14]. However, further optimization and deep investigation of kinetic parameters are still limited for industrial wastewater, especially for beverage effluent.
In this research, a detailed study for beverage wastewater treatment was carried out to check the effect of microbes on the degradation of organic matter using a batch anaerobic sludge system, and the effects of microbial growth on solids retention time (SRT) were especially emphasized. Further, to understand the removal mechanisms of micropollutants from industrial beverage wastewater, the concentrations of related substances, including COD, were also measured from time to time. So far, limited studies have been reported on Gram staining tests for microbial identification in the beverage wastewater effluents, and thus it can be extended to various beverage-based industries to analyze the quality of waste effluent from the prospective production plant. The objectives of the study lie in the following steps. Firstly, the microbiology of industrial beverage effluent using the Gram staining test was performed to analyze the classifications of bacteria present in the wastewater. Secondly, the kinetics were reported by estimating the microbial growth rate, characterization of industrial beverage effluent, degradation of organic matter, and solid retention time of the beverage wastewater treatment.
Overall, this study demonstrated that the reactor was efficient in treating industrial beverage wastewater at a pilot-scale level. It was designed for 10 L of high-strength septic effluent consisting of a reactor with a height of 50 cm and a diameter of 15 cm. To better understand the process and further improve its efficiency, kinetic parameters were studied in detail. The kinetic parameters have been calculated through experimental studies on pilot-scale batch reactor using powdered activated carbon (PAC) for the pre-treatment of wastewater and an anaerobic sludge system technique. The results indicate that this method has the advantage of feasibility at a pilot-scale level to treat beverage industry wastewater at a very high degradation efficiency without additional risk of secondary pollutants, and will pave the way for wastewater treatment methodologies at large scales.

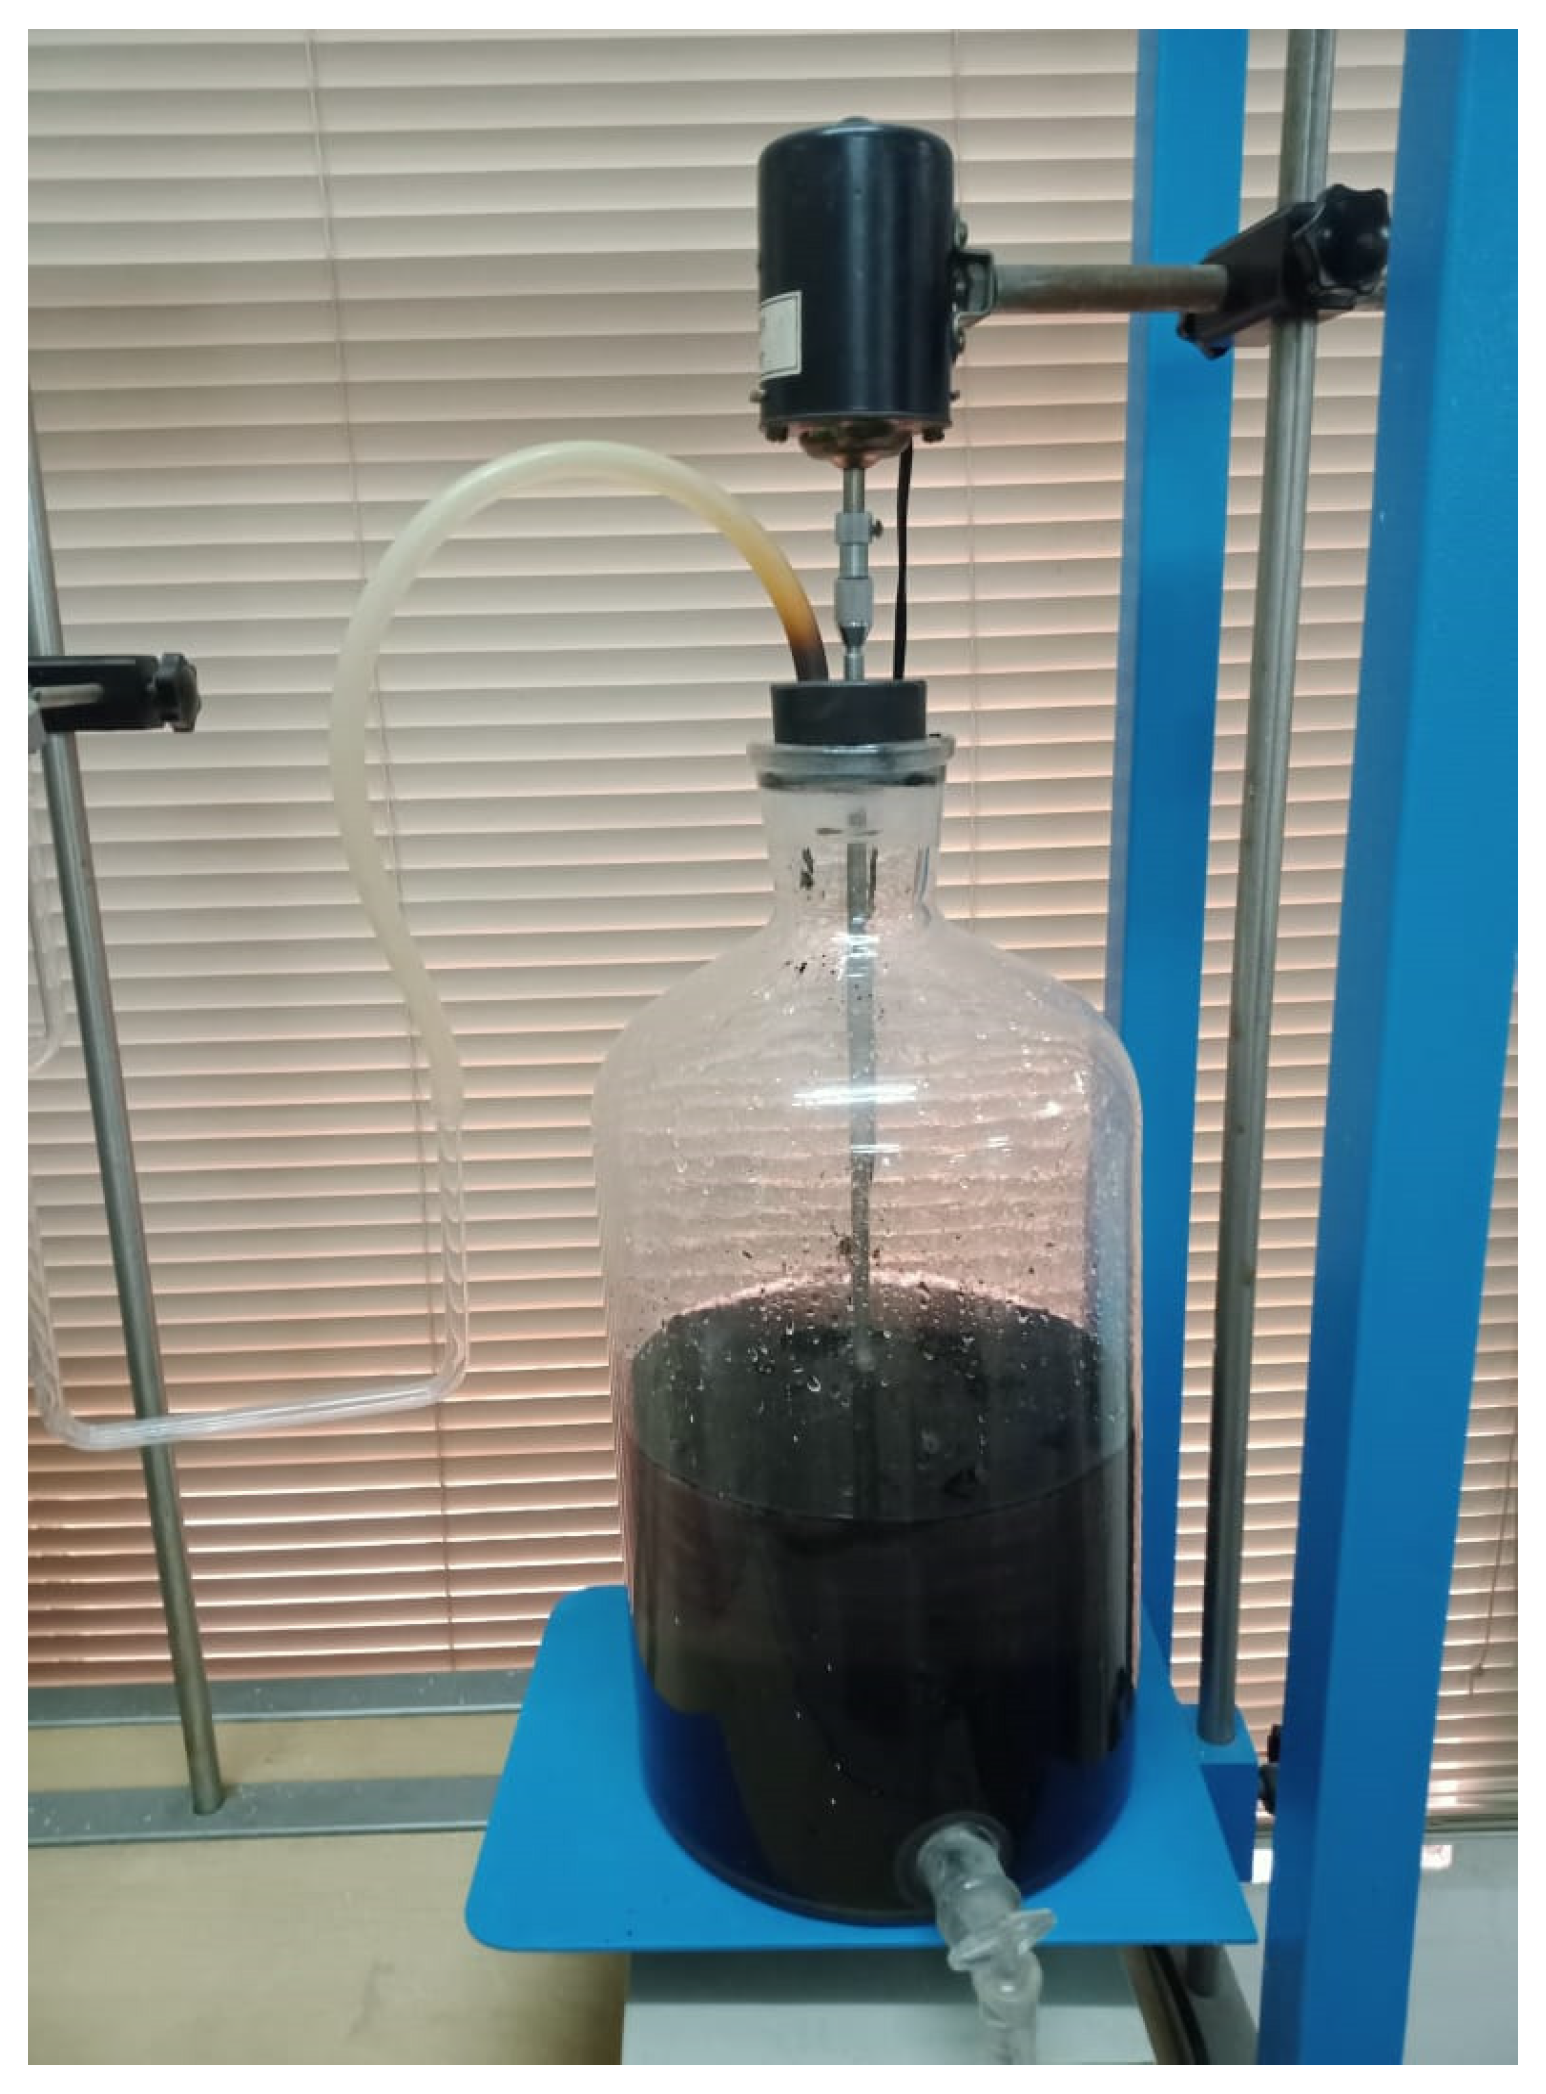
2. Material and Methods

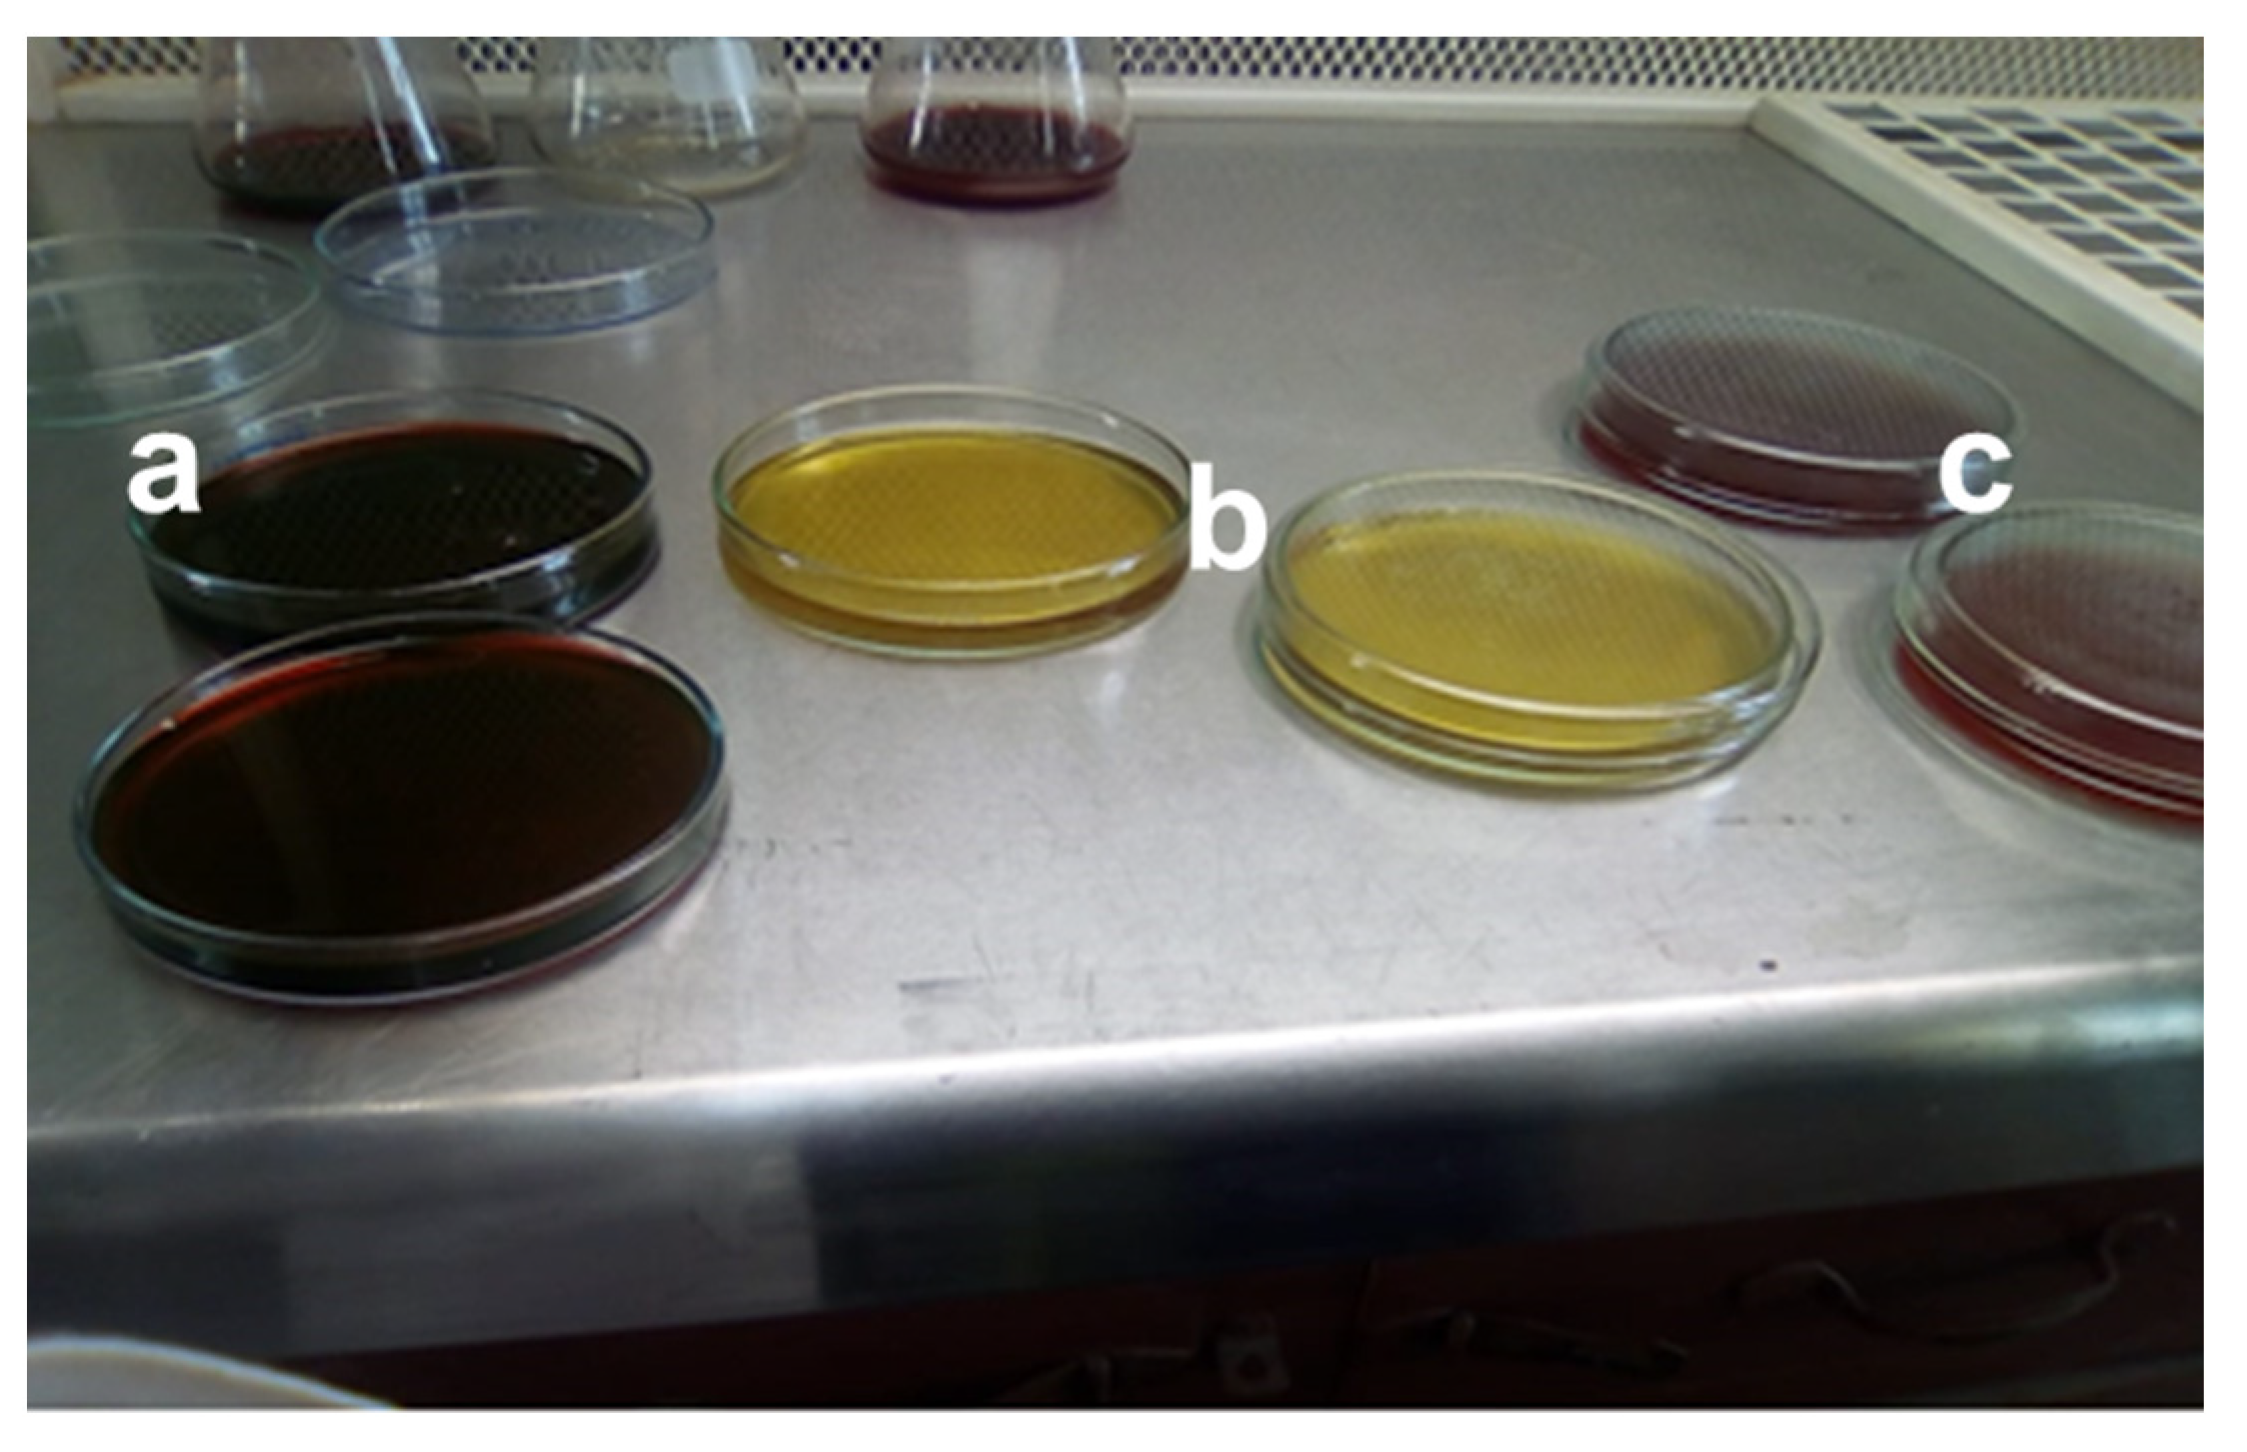
2.1. Sample Preparation

Industrial effluent, specifically mango juice effluent, was taken from the private beverage industry named Rifson foods with product code (20097900), located at Multan, Punjab, Pakistan. After collecting the wastewater effluent sample, it was homogenized for 30 s in the centrifuge device. The homogenized sample was taken into the 250 mL beaker for more accuracy and reproducibility, and gently stirred with a magnetic stirring plate. The total viable count was performed using the spread plate technique on three different agars, nutrient agar (NA), eosin methylene blue (EMB) agar, and MacConkey agar. The selection of media generally depended on which microbe was being selected, because different microorganisms require different environments and growth conditions (e.g., nutrients, pH, and temperature) for their growth. In the above-mentioned agars, NA was composed of beef extract 3 g, NaCl 8 g, peptone 5 g, agar 15 g, and water as required to make it 1 L. To 100 mL of deionized water, 5.6 g of nutrient agar was added with water mixture and further heated at 100 °C. For EMB agar, 3.6 g of EMB agar was added to 100 mL of deionized water to prepare 100 mL of solution and mixed well with the help of an electronic stirrer. Similarly, for the preparation of 100 mL MacConkey agar, 5 g of MacConkey agar was added to 100 mL of deionized water and further heated to get a homogenized solution. All the agars were autoclaved for 15 min at 15 psi to sterilize culture media. Almost 100 mL of the mixture was poured into petri dishes, and for solidification, the petri dishes were placed in the laminar flow cabinet to maintain the anaerobic conditions and then placed in the incubator at a temperature of 37 °C for 24 h, as shown in Figure 1.
The effluent dilution was prepared by adding 1 mL of sample into 9 mL of distilled water for 1st dilution. Then 1 mL of 1st dilution was taken and mixed with 9 mL of distilled water for 2nd dilution. Similarly, the same method was adopted to prepare the 3rd, 4th, 5th, and 6th dilutions which can be viewed in Supporting Material Figure S1. Then, for the growth of microbes, 1 mL of each dilution prepared was spread evenly over the incubated agar samples on petri dishes using the inoculum method. Afterwards, the petri dishes were placed in the laminar flow cabinet to maintain the anaerobic conditions and then placed in the incubator at 37 °C for 24–48 h.

2.2. Experimental Design

An anaerobic batch reactor having dimensions of length 50 cm, diameter 15 cm and a capacity of 10 L was used in the experiment, as shown in Figure 2. An anaerobic sludge process was carried out in the batch reactor. Three steps were involved in the process: in the first step, 5 L of beverage industrial wastewater effluent was added to a single batch reactor; in the second step, 3 mg/L of activated carbon powder (200 mesh, Ash 6% (max)) was added to remove odor and pollutants by mixing it for 3 h.
During the settling process, the 100 mL of sample was collected at the specific time interval of 2 days till the total HRT (hydraulic retention time) of 13 days was reached. The collected 7 samples were then analyzed using the American Society for Testing and Material (ASTM) standard to generate data for substrate removal parameters. In the third step, the flocs were allowed to settle down in the absence of air (anaerobic condition), and then were discharged from the batch reactor. At the same time, the top layer of the wastewater was removed separately. The anaerobic conditions were maintained within the reactor by tightly closing the reactor inlet. In the settling phase, anaerobic sludge was allowed to settle down over 13 days.

2.3. Characterization of Beverage Industry Wastewater

The characterization of wastewater was performed using different water-based pollution indicators. In this study, the degree of wastewater pollution was expressed according to the mean values of pollution indicators: chemical oxygen demand (COD), as shown in Supporting Material Figure S2, pH, and volatile suspended solids (VSS). The values of these parameters were calculated by the American Society for Testing and Material (ASTM).

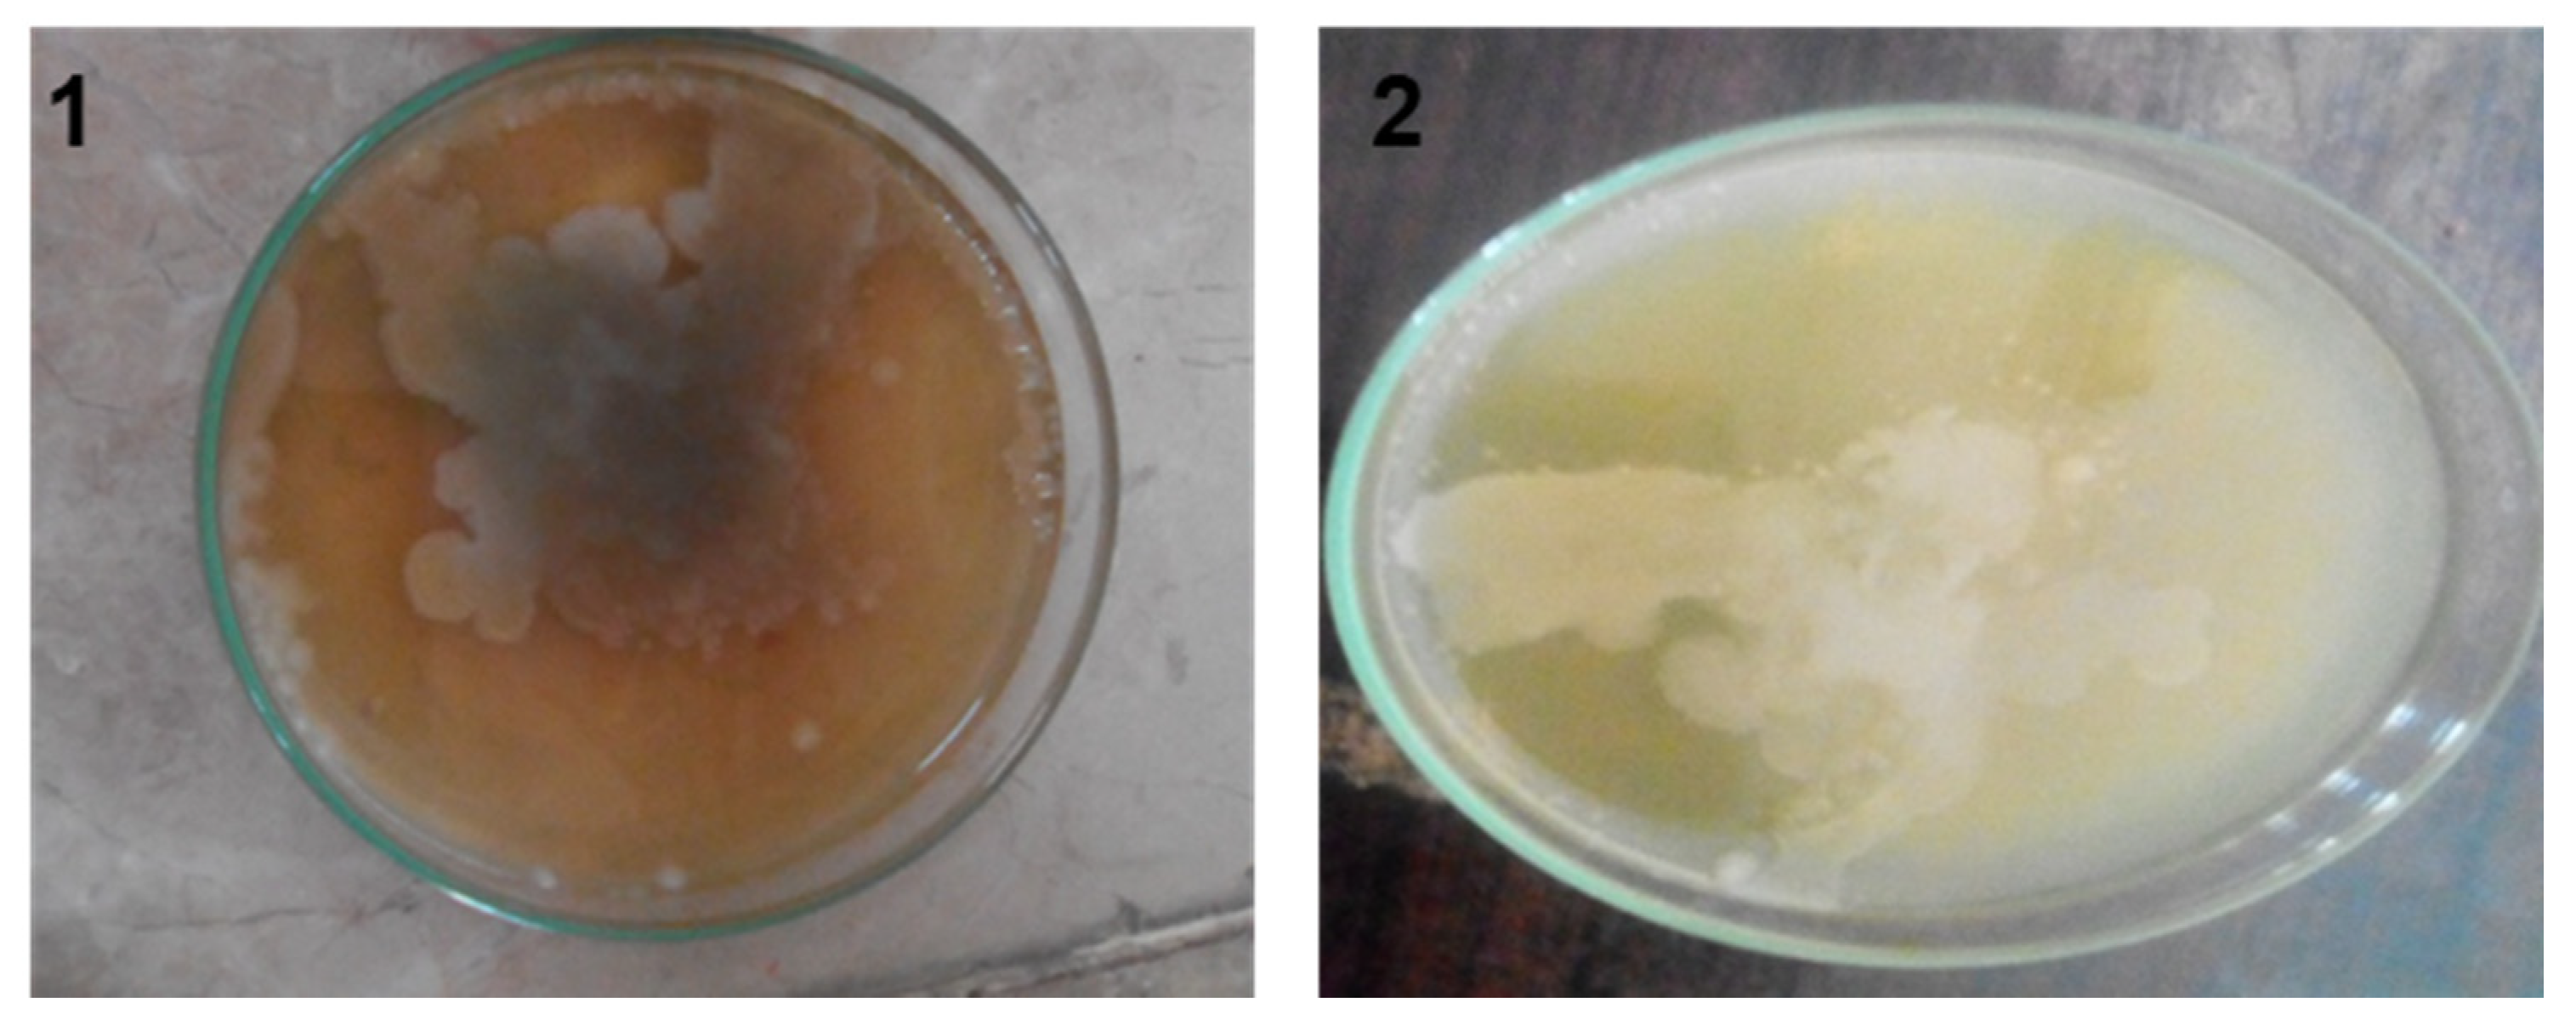
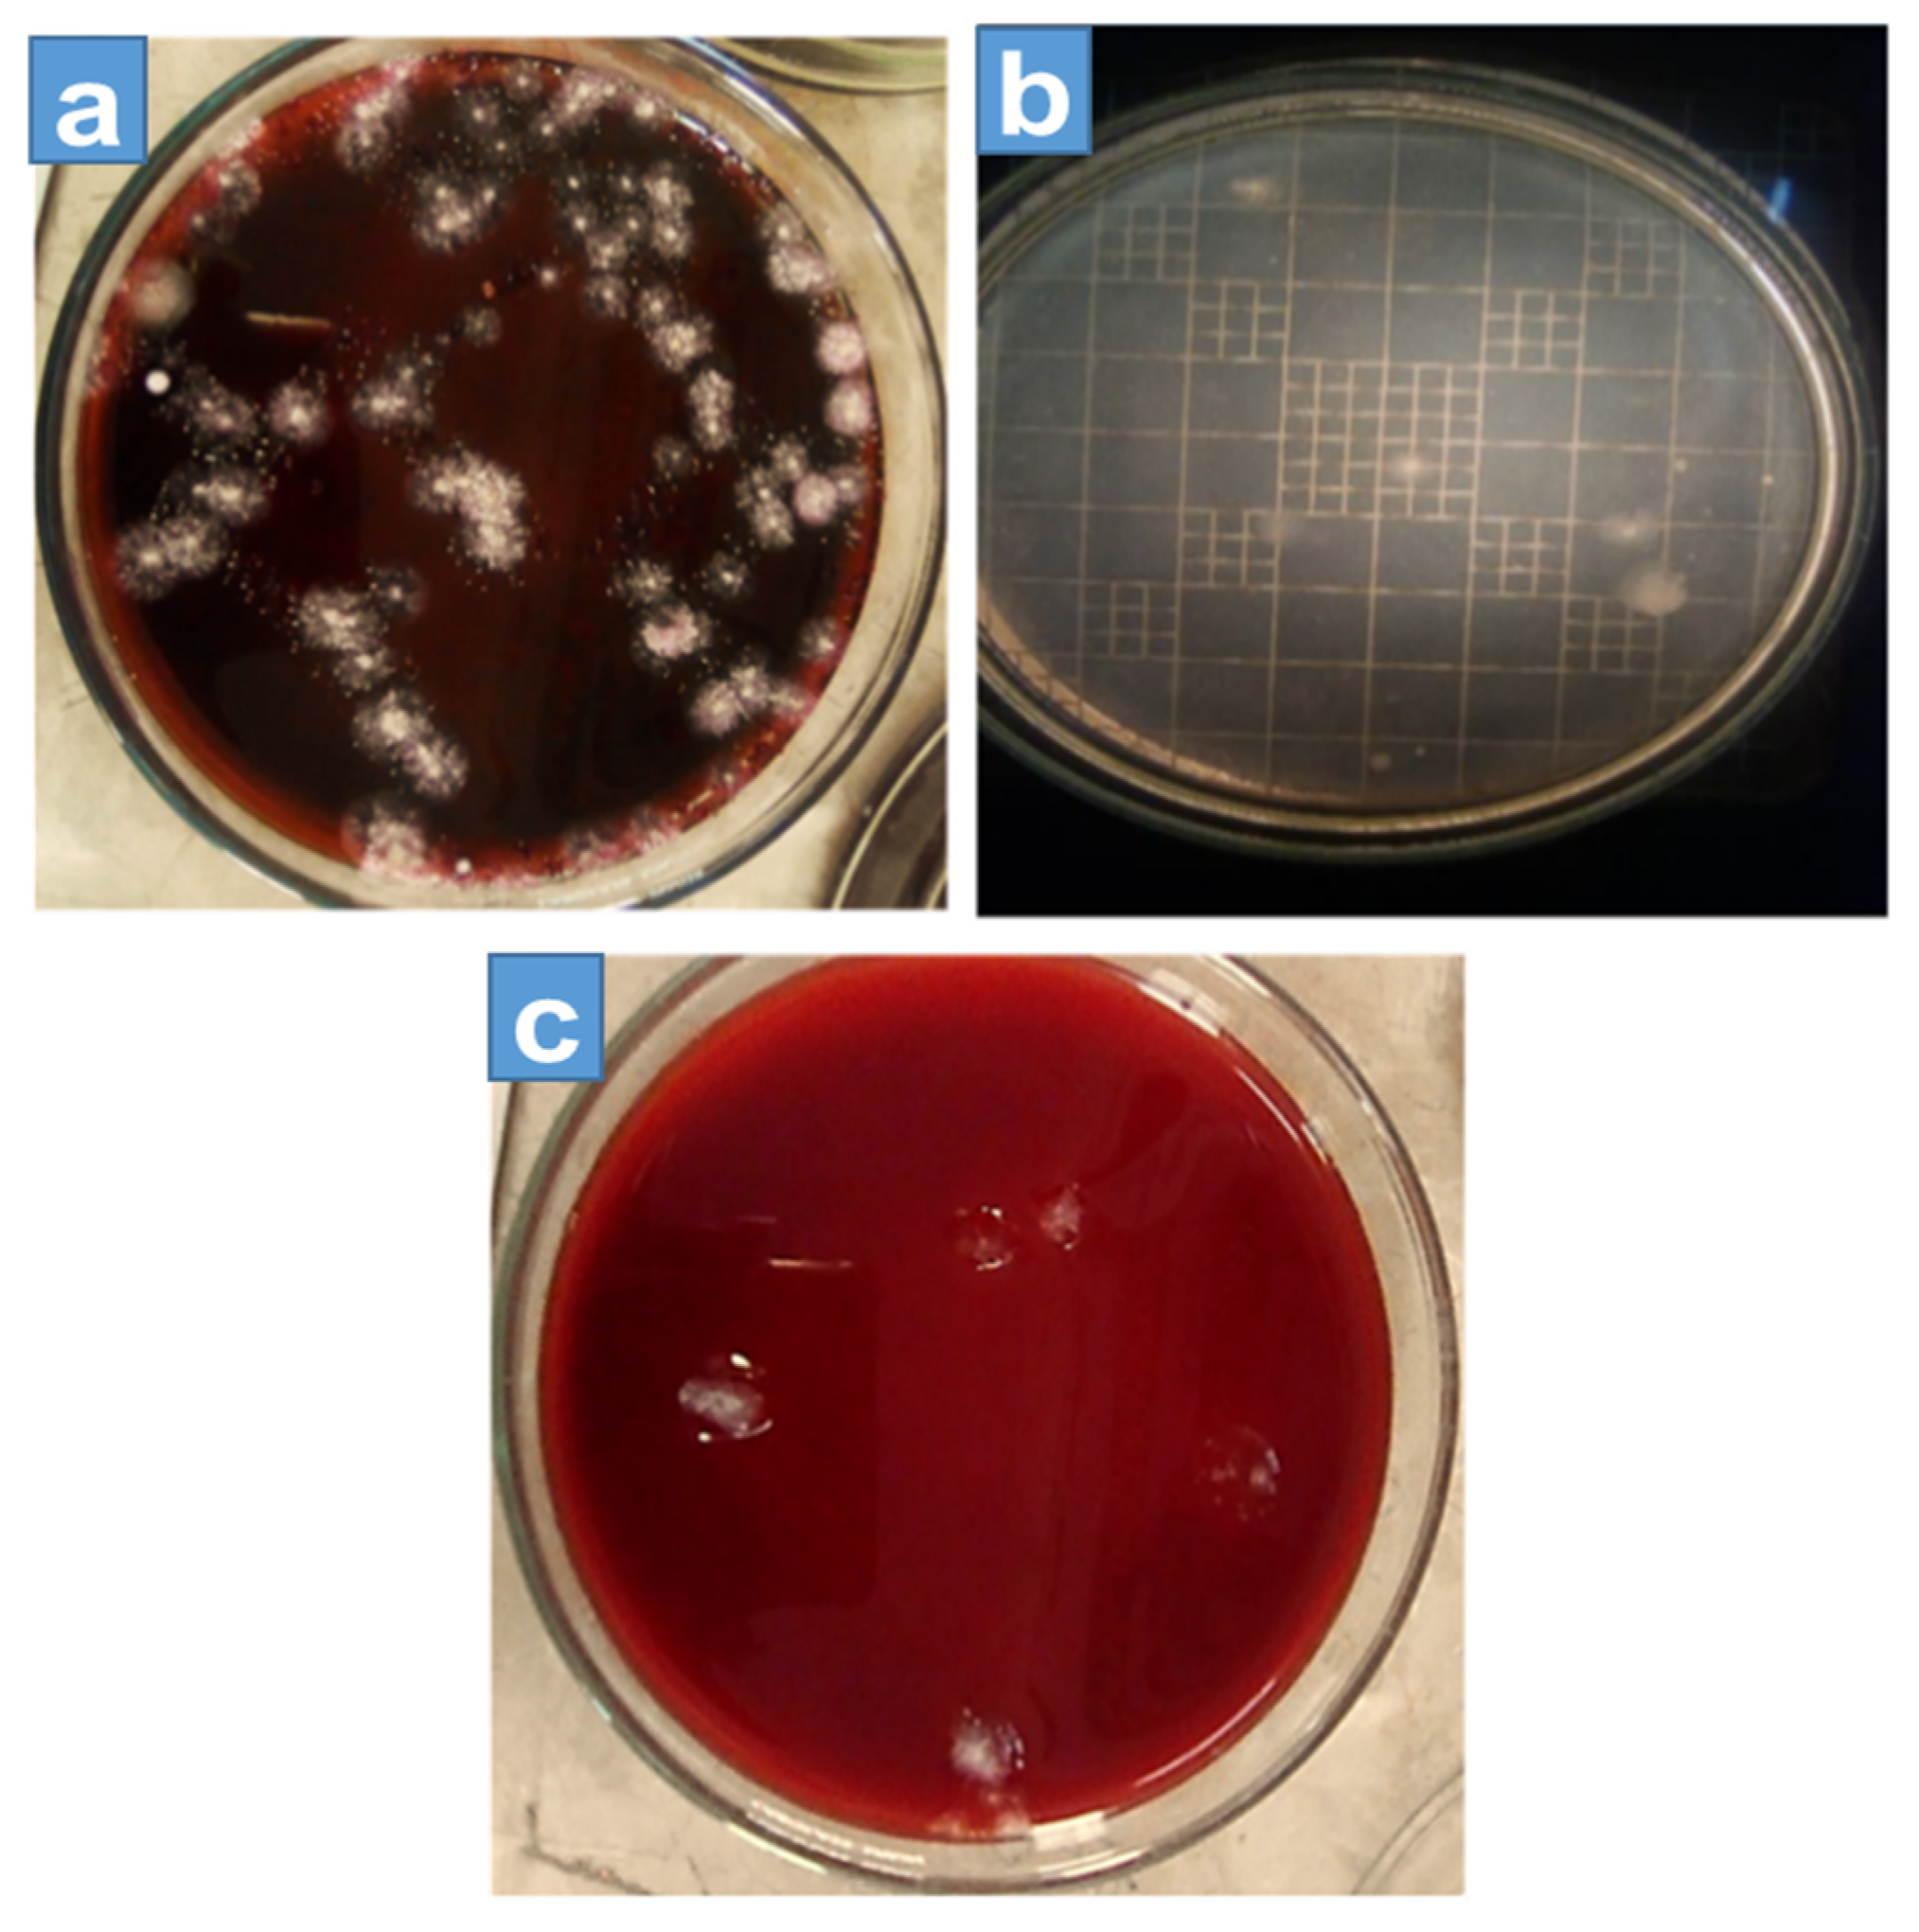
2.4. Gram Staining & Catalase Test

In the Gram staining test, firstly, the smear was rinsed with the methyl violet for one minute and then further heated to achieve the stain. The slide was gently rinsed and saturated with iodine for 1 min, and then rinsed with water and further decolorized with a Gram decolorizer, i.e., acetone and alcohol for 30 s. A drop of counterstain safranin was added for 1 min and then rinsed with water. The slide was dried with bibulous paper and observed through a microscope to analyze the Gram-positive or -negative test. Simultaneously, a catalase test was carried out to identify the presence of aerobic and anaerobic microbes. For this, 2–3 mL of H2O2 solution was added to the test tube to analyze the catalase colonies. In this analysis, the active bubbling behavior was analyzed.

2.5. Kinetic Modeling

Kinetic modeling was used to determine the interaction between microbes’ growth and their surrounding environment (anaerobic condition). Moreover, it was used for calculating the degradation caused by microbes under constant temperature conditions. The numerical values of kinetic parameters can be used for the analysis, optimization, design, and operation of biological processes at the laboratory and large-scale conditions [15]. Therefore, this method was used for a better understanding of microbial kinetics performed in this study.

2.5.1. Microbial Growth Kinetics

The emergence of microbial or biological kinetic theory, proper design, and the operation of anaerobic sludge processes were calculated by using kinetic parameters such as growth yield, the maximum rate of substrate utilization per unit mass of biomass (k), saturation coefficient (Ks), and microbial decay coefficient (Kd). These equations represent biological (sludge) growth and substrate utilization rates in biological kinetic coefficients, food-to-biomass ratio, and the mean cell residence time. Typically, the bio-kinetic theory allows the prediction of soluble effluent substrate concentration (BOD: biological oxygen demand, COD: chemical oxygen demand, TOC: total organic carbon), mixed liquor suspended solids concentration (MLSS), nutrient requirements (nitrogen and phosphorus), oxygen requirements, and daily sludge production [16]. Thus, it can be deduced that the model’s success depends on the bio-kinetic coefficients used in the prospective modeling. The values of kinetic coefficients growth yield (Y), the maximum rate of substrate utilization per unit mass of biomass (k), saturation coefficient (Ks), and microbial decay coefficient (Kd) significantly influence the design of the anaerobic sludge process. These values are highly dependent upon the characteristics of the industrial wastes containing wastewater. Numerous investigators have enhanced the treatment efficiency by developing microbial kinetics and substrate utilization equations [17]. Microbial stoichiometry and kinetics were used to solve problems related to input, output, substrate, and growth [18], etc.
The microbial kinetics used in this study were as follows:
N t = N 0 2 n
The initial number of cells = N0
After time t, number of cells = Nt
Every measurement should be done in the lag phase.
X t = X 0 2 n
Initial biomass concentration = X0
After time t, biomass concentration = Xt
Number of divisions = n
l o g X t = l o g X 0 +   n l o g 2
n = l o g X t l o g X o l o g 2
n = 3.32   l o g ( X t X 0 )
The colony-forming unit decreased with the increase in the number of dilutions. The growth rate (µ) was calculated by the following calculations [19,20].
Rate of multiplication of cells = µ × number of cells produced
L o g 10   C F U t   -   l o g 10   C F U 0   =   μ m ( t   -   t ° )
L o g 10   C F U t   -   l o g 10   C F U 0     ( t   -   t 0 ) = μ m
where colony-forming unit (CFU), time t, and specific growth rate μ represent the population density or cell concentration, while regression resulted in an exponential slope as the growth rate (h−1).
The CFU was calculated by the formula:
C F U / m l   =   No .   of   colonies   x   dilution   factor   Volume   of   a   culture   plate

2.5.2. Degradation of Organic Matter and Kinetic Analysis

To investigate the degradation efficiency of organic matter, industrial wastewater was mixed with activated carbon and allowed to settle for a certain period. The industrial waste contained both aerobic and anaerobic bacteria, or facultative anaerobes from which only anaerobic bacteria grew by utilizing a COD as a substrate. Then, the specific growth rate value was calculated from the COD concentration using a graph plotting COD concentration (on Y-axis) against time (on X-axis) [21].
μ = l n N 2 N 1 / ( T 2 T 1 )
where:
N1 = COD at point 1 at time T1
N2 = COD at point 2 at time T2
T1 = initial time of degradation
T2 = final time of degradation

2.5.3. Solid Retention Time SRT

The relationship between specific growth rate (μ) and maximum growth rate (μmax) relates to the Michaelis–Menten equation as follows [22].
Solid   Retention   Time   =   S R T =   V   x   X X W + X e
XW = suspended sludge concentration
Xe = effluent concentration
K = slope = 0.0066 mg/L COD
V = V _ m a x . S K s + S
By rearranging the equation for microorganisms, the Monod growth equation is expressed as:
Specific   Growth   Rate   =   μ = μ _ m a x . S K s + S    
where:
Ks = half-saturation constant, mass volume−1 (mg/L)
S = mass of soluble substrate removed
μmax = maximum specific growth rate of the organism
S at which μ = ½ = μmax
Microbial growth rate can be expressed by the following formula [23]:
d X d t = Y t d s d t k d X
where:
X = mixed liquor volatile suspended solids (MLVSS)
(dX/dt) = net rate of change in biomass
S = mass of soluble substrate removed
Yt = true cell yield coefficient
Kd = cell decay coefficient
The observed cell yield in the complete system decreases as the sludge age increases.
Cell yield in systems can also be expressed as:
                  d X d t = Y d s d t
where:
Y = observed cell yield coefficient
(dX/dt) = net rate of change in biomass
The growth in the secondary system is directly proportional to the mass of cells present on agar; the rate must be taken as growth rate per unit mass.
d X d t X = μ
The stringent environmental regulation on industrial effluents leads to an increase in the trend toward reducing the COD of industrial effluent before disposal. The sample was collected after 2 days from the reactor as shown in Figure S3 and examined for COD. COD was examined by the method given by ASTM, furthermore to measure the COD removal efficiency of the effluent. The COD removal efficiency is calculated by the following formula:
COD   removal   Efficiency   CRE   =   C O D i n i t i a l     C O D f i n a l C O D i n i t i a l     ×   100

3. Result and Discussion

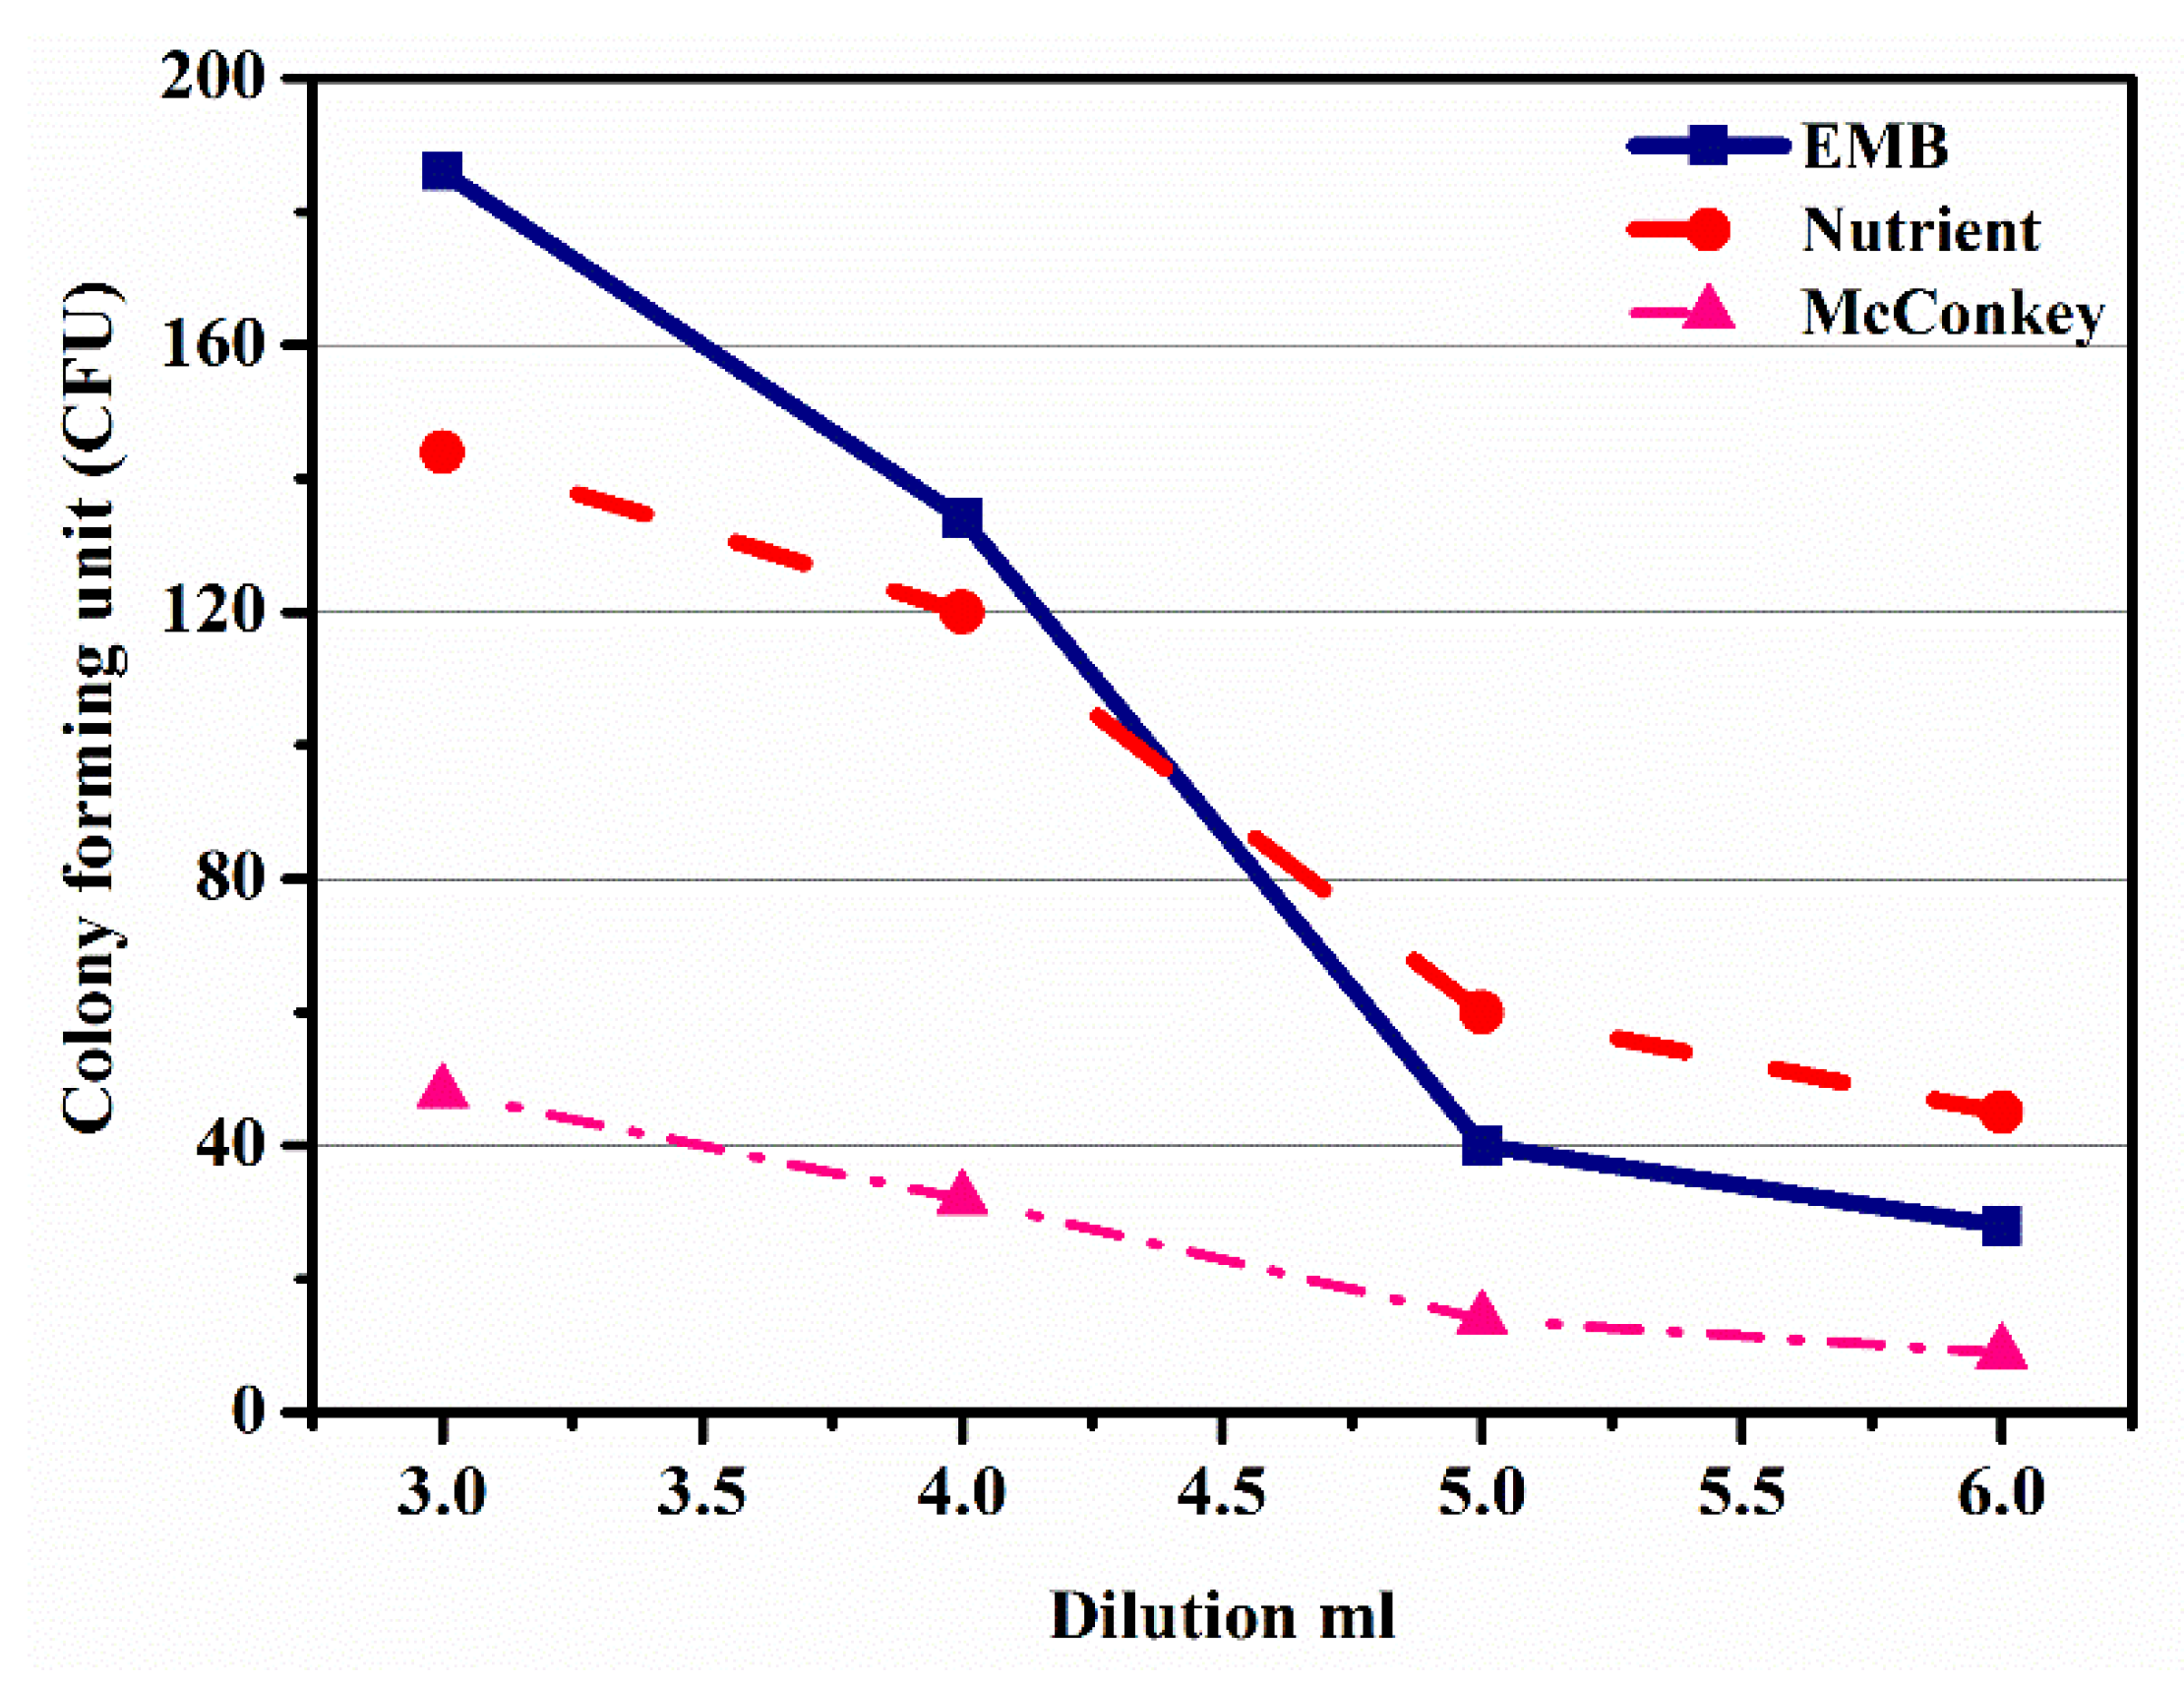
3.1. Microbiology of Beverage Industrial Effluent Using Gram Staining and Catalase Test

The Gram staining test of the industrial beverage effluent identified the presence of two types of bacteria. These are identified as Gram-positive and Gram-negative bacteria as shown in Table 1.
In the Gram-negative test, effluent indicated the light red color as shown in Figure S4, due to the presence of Gram-negative bacteria in the sample. In the catalase test, negative results were obtained, which indicated the presence of anaerobic bacteria or facultative anaerobes which are microbes capable of growing in the absence of oxygen in the fermentation process [22]. The most commonly reported bacterial genera include Acetobacter, Alicyclobacillus, Bacillus, Gluconobacter, Lacto-bacillus, Leuconostoc, Zymomonas, and Zymobacter. Among yeasts, Pichia, Candida, Saccharomyces, and Rhodotorula are commonly encountered genera responsible for the spoilage of juices [19]. Certain common molds such as Penicillium sp., Aspergillus sp., Eurotium, Alternaria, Cladosporium, Paecilomyces, and Botrytis have also been reported in the spoilage of fruit juices [19]. The results of the Gram staining test show the presence of Gram-positive bacteria such as lactic acid bacteria (LAB), Acetobacter (anaerobic Gram-positive bacteria), Streptococcus, Staphylococcus, Gluconobacter, and Bacillus bacteria in the industrial beverage effluent, whereas the Campylobacter coli (C. coli), Escherischia coli (E. coli), Salmonella, Shigella, and Vibrio were identified as Gram-negative bacteria in the industrial beverage effluent.
The colony-forming unit (CFU) is the technique used for calculating the number of bacteria grown on a culture solution [19], and the colonies of microorganisms can be counted by the appearance of the colony on an agar medium. According to the density of the effluent, different multiple dilutions were prepared, which varied in order, and these dilutions were used to obtain 10 to 300 colonies of microbes per plate, and at least six plates per culture were used. Onto each plate, 1 mL of dilute effluent was poured. The plates were cultured overnight in an incubator at 37 °C (for 24–48 h). In Figure 3 and Figure 4 each plate shows a different growth ratio because of different dilutions. The first two petri dishes showed uncountable bacterial growth on the different agars because the concentration of the solution was very high. Moreover, Table 2 shows the number of colonies formed on nutrient agar, EMB agar, and MacConkey agar against different dilutions, in which the first column is about the dilutions made of the effluent.
The first two dilution results cannot be calculated, because for these dilutions, the growth of microbes on media was not possible to count. Therefore, it started from the 3rd dilution and continued to the 6th dilution for each agar. The second column shows the colony growth on EMB agar, which decreased with the increase in dilution. The third column shows the growth of nutrient agar, and similarly, the next column shows the growth of MacConkey agar. In the first two dilutions (1st and 2nd) colonies were uncountable due to the bulkiness of the sample and the formation of patches on the agars as shown in Figure 3, whereas Figure 4 shows the amount of colony growth on different agars, such as EMB, MacConkey, and nutrient agars.
Figure 5 shows the graph plotting dilutions (3rd, 4th, 5th, and 6th) in ml against subsequent colony-forming units on three different agars, EMB, NA, and MacConkey. Figure 5 shows that with an increase in dilutions, ranging from 3rd to 6th, the value of CFU decreased, which was due to the growth of the microbe on the EMB agar. From this trend, it was observed that the microbe growth slightly decreased from 3rd to 4th dilutions, while a sharp decrease was observed from 4th to 5th dilutions, and then from 5th to 6th again decreased slightly. Similarly, the nutrient agar trend showed the growth of microbes, which showed a decrease in CFU with the increase in dilution from 3rd to 6th, whereas the growth on the MacConkey agar showed a gradual decrease from 3rd to 5th dilution; however, in the 5th to 6th dilutions a sudden decrease was observed, which was due to the microbes’ steady growth. From the above discussion, it was concluded that the identification of microbes by the growth of the colonies on different agars was possible. Thus, from the above discussion, agar media affected the growth of microbes, and their concentration affected the growth of microbes.

3.2. Kinetic Modeling

3.2.1. Microbial Growth Rate

The microbial growth was analyzed in terms of colony-forming units on different agars such as EMB, NA, and MacConkey. It was observed that colony-forming units decreased with the increase in the number of dilutions from 103 to 106, as shown in Table 3. It was seen that about 10 to 300 colonies per petri dish were grown when removed from the incubator. Moreover, it can be seen in Table 3 that the value of CFU decreased with an increase in the dilutions, which was due to the reduction in the growth of microbes.
Figure 6 shows the graph between time (h) vs Log10 (CFU) of microbial growth on all three agars, i.e., EMB, nutrient, and MacConkey. The growth rate of microbes was calculated from the slope of Figure 6 (graph of time against log10 (CFU)). The growth rate (μm) was calculated as 0.03833 h−1, which was further used for the calculation of the specific growth rate (μ) using the Monod equation. In Figure 6 the graph shows the colony growth rate in terms of log10 (CFU) on EMB, MacConkey, and nutrient agars. Figure 6 shows that the minimum colony growth was on the MacConkey agar, and the colony growth on the EMB media was higher compared to the nutrient agar. The calculations of colony growth showed the highest growth of colonies on the EMB agar, as shown in Table 2 and Table 3.
The coefficient of determination (R2) values for the microbial growth which were measured on EMB, nutrient, and MacConkey agars were 0.9976, 0.97884, and 0.99637, respectively, as shown in Figure 6. The model with the best fit was selected on the basis of highest correlation coefficient (R2). The kinetic parameters of the models were estimated using the linear regression routine of origin 9.0, and the results along with the R2 are given in Table 3. The results revealed that the Monod equation had a correlation coefficient (R2) greater than 0.90, thus showing a good fit to the batch experimental data.

3.2.2. Characterization of Beverage Industry Wastewater

The result of the characterization of wastewater performed using different water-based pollution indicators is reported in Table 4. The characteristics of industrial beverage wastewater were high in organic load with chemical oxygen demand (COD) values in the range of 7000 to 130,000 mg/L. As a consequence, untreated beverage industrial wastewater disposal into water bodies can adversely affect the aquatic ecosystem. The following parameters were used to find the composition of industrial beverage wastewater chemically and physically. The degree of wastewater pollution was expressed according to mean values of pollution indicators: COD, BOD, total suspended solids, pH, and volatile suspended solids.

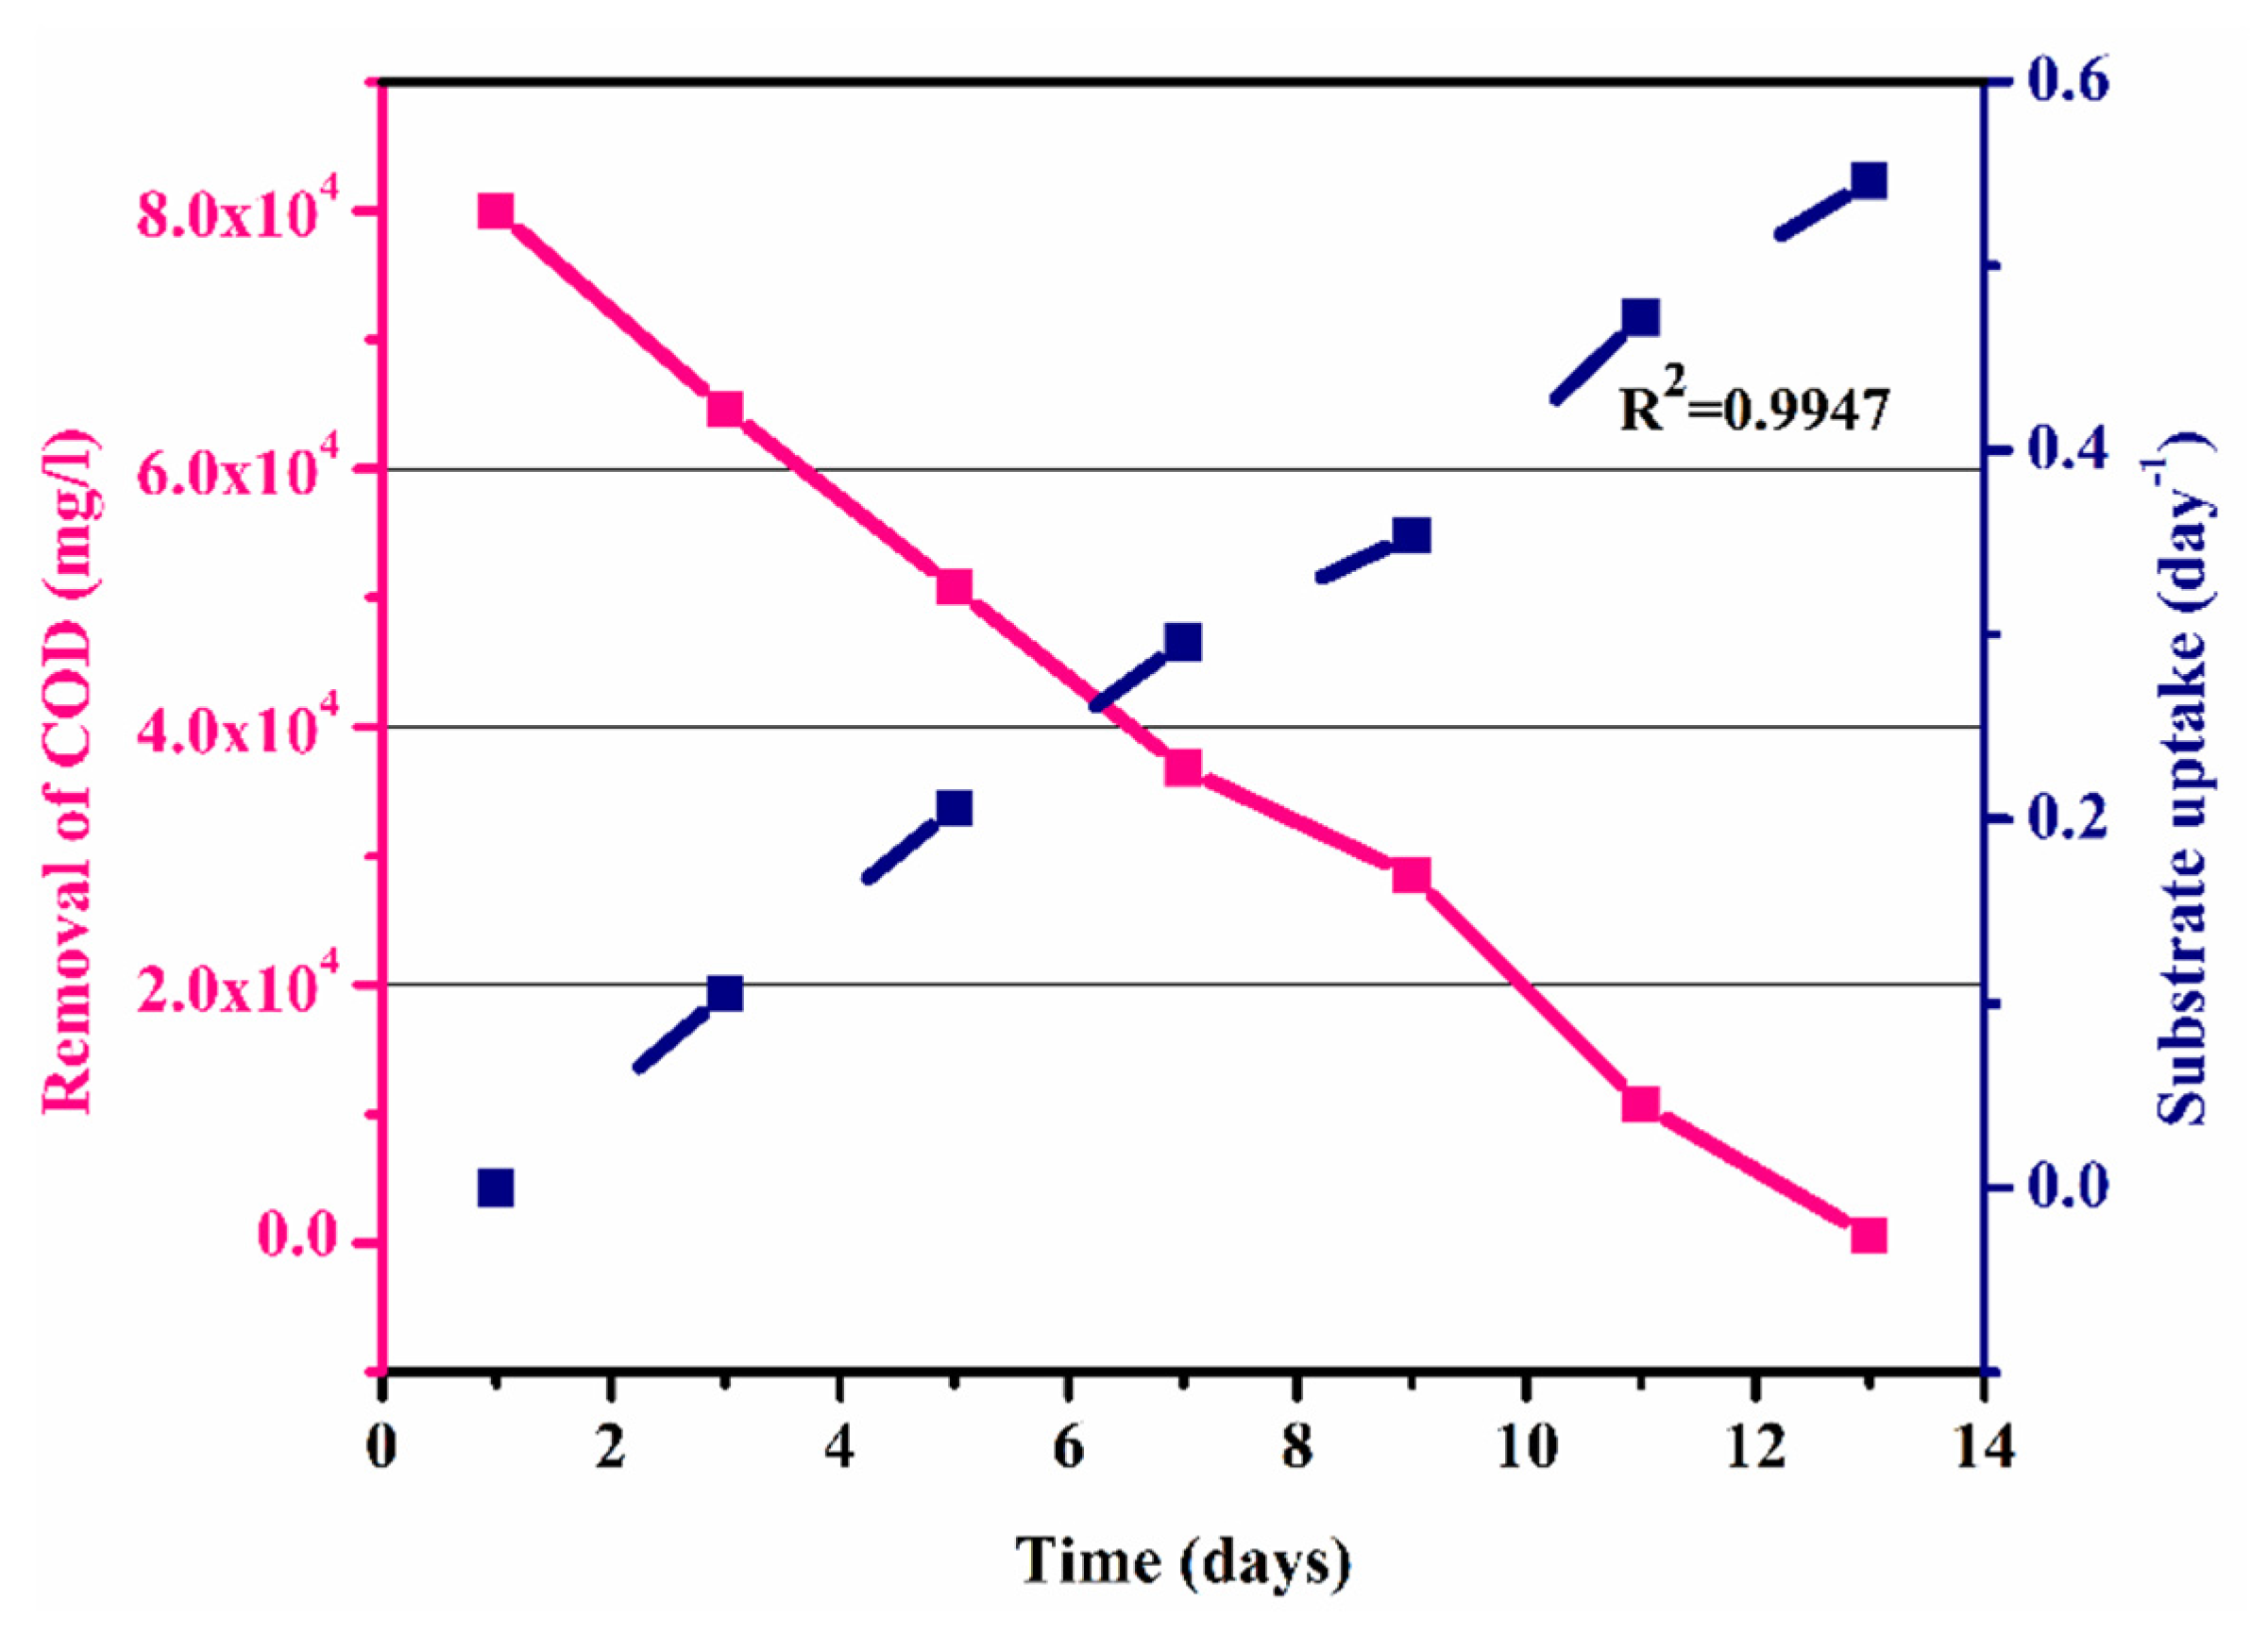
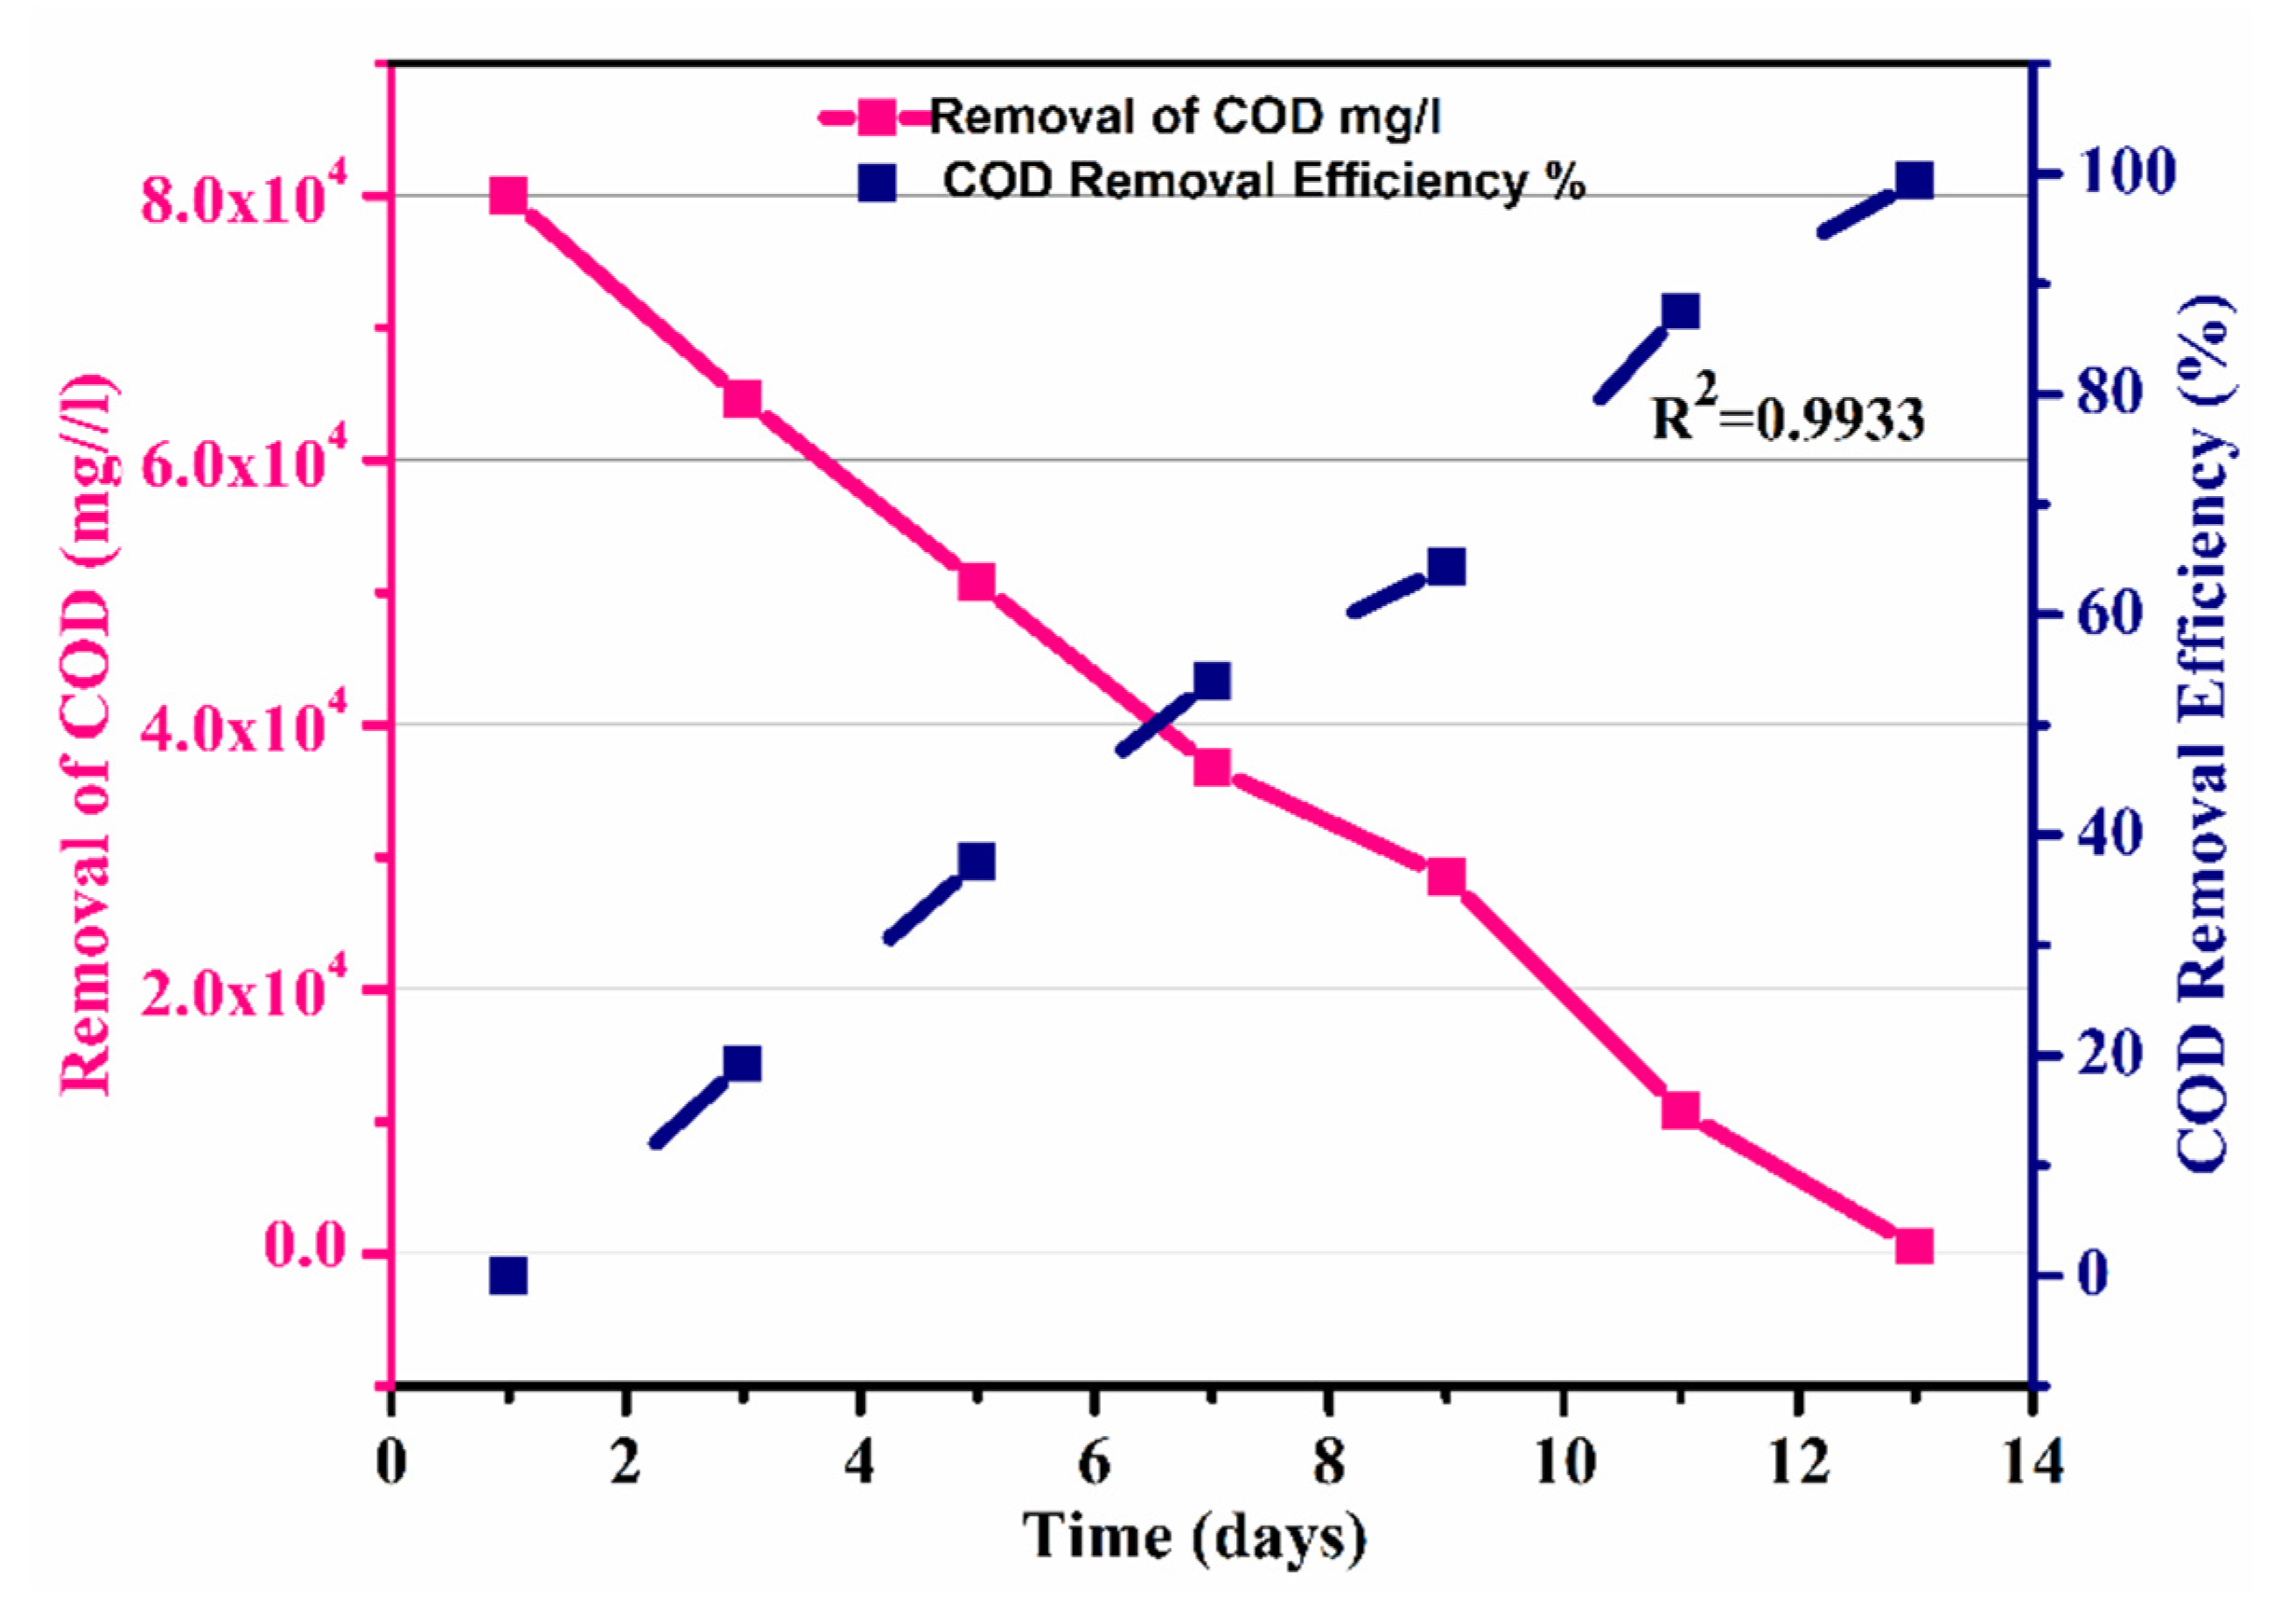
3.2.3. Degradation of Organic Matter and Kinetic Analysis

Figure 7 shows the graph of the substrate intake (day−1) against COD removal (mg/L) in an anaerobic batch process. It shows that the removal of COD increased with the increase in substrate utilization with time, which was due to the growth of microbes within the process as shown in Figure 7. The maximum substrate utilization of 0.54 day−1 and a coefficient of determination (R2) of 0.9947, as shown in Figure 7, were observed. Thus, substrate concentration and microorganism growth were directly interrelated. The graph shows that the COD was calculated as 80,000 mg/L, which gradually decreased to 550 mg/l with the passage of HRT of 13 days (Table 5).

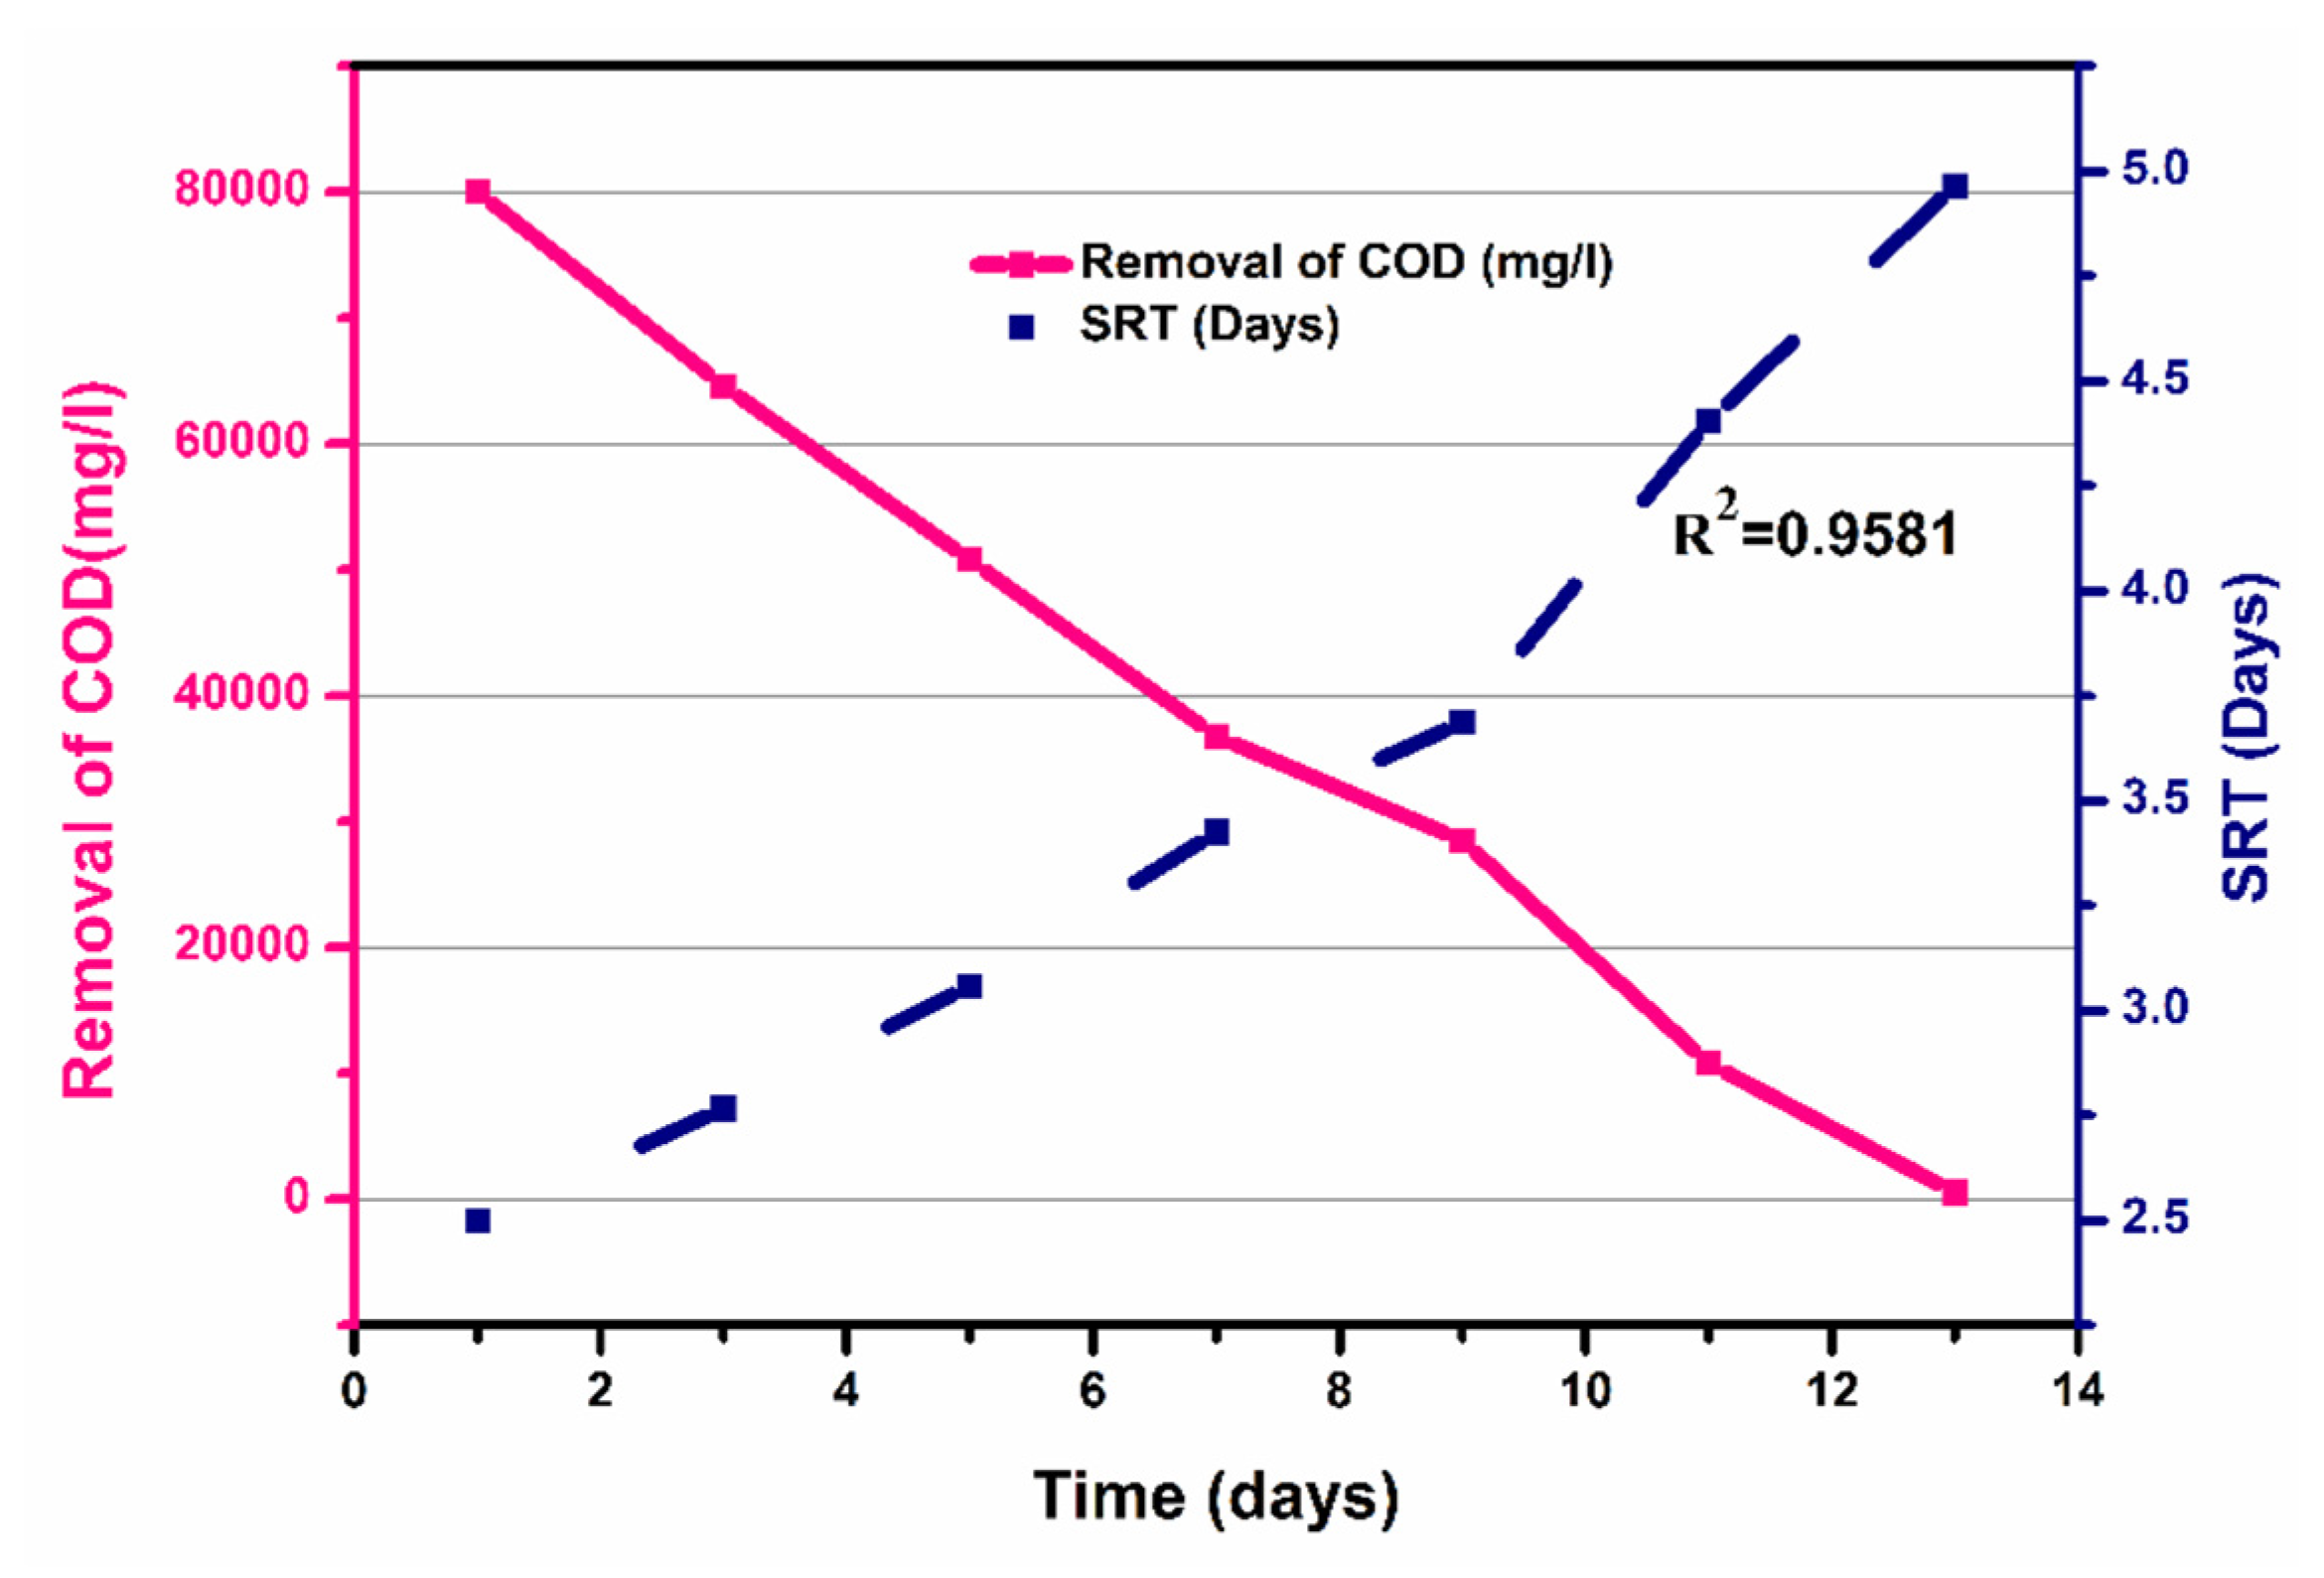
3.2.4. Solids Retention Time (SRT)

Table 5 represents the SRT of the wastewater calculated. The SRT values show the solid retention time taken by the wastewater in the batch reactor. It was observed that the SRT values increased with the decrease in COD values, which was due to the fact that the contact time between the bacteria and substrate decreased with time.
Furthermore, the efficiency of the process was calculated, which showed that efficiency also increased with the decrease in COD removal, and an overall efficiency of 99.31 % was observed, as shown in Figure 8.
Figure 9 shows the COD removal (mg/L) and SRT (day), for a time interval of 1 to 13 days. It shows that COD removal decreased from 80,000 mg/L to 550 mg/L as the SRT increased from 2.5 to 4.965 days, with a coefficient of determination R2 =0.9933. The decrease in COD removal was due to decrease in the contact time between the bacteria and substrate. Overall, the calculated HRT was 13 days, while a calculated SRT of 26 days was observed, as shown in Figure 9. To evaluate the kinetic parameters of beverage wastewater (Table 6), firstly, the substrate constant was calculated by plotting COD removal (mg/L) against time (days), and a slope of COD removal/time was obtained, as shown in Figure S5, from which Ks was estimated as 3500 mg/L. The growth rate of microbes was calculated from the slope of Figure 6 (graph of time against log10 (CFU)), and the grow rate (μm) was calculated as 0.03833 h−1, which was further used for the calculation of the specific growth rate (μ) using the Monod equation. The μ value increased with increasing glucose concentration, to its maximum, and then decreased with further increasing glucose concentration. After obtaining these constants, the specific growth rate, which is also termed as the Monod equation, was estimated, represented by M, calculated by Equation (13). Moreover, the process yield represented by Y was estimated to be 0.46 mg VSS/mg COD. As microorganism growth can be inhibited by substrate, extended Monod kinetics which incorporate the inhibition constant (K) were therefore chosen for evaluating the microbial growth and substrate utilization kinetics in this study.
To further understand the efficiency of the proposed process, a comparison of the current study with the reported related literature allowed a benchmark for our process parameters to be made. For the present study, the initial characteristics of the effluent are shown in Table 7 and were compared with previously reported studies to get an idea of the efficiency and effectiveness of the proposed method. Table 7 summarizes the comparison of previously reported studies in terms of COD removal %, initial conditions of wastewater, HRT, and SRT of wastewater. It was observed that the initial conditions varied with respect to the type of wastewater studied, and the SRT and HRT reported were based on the type of reactor system used. Moreover, it can be seen that the % COD removal of beverage wastewater achieved in this studied was 99.31%, as compared to the other studies using different processes and wastewater. Therefore, this study is significant, and useful in designing a new beverage wastewater treatment technique by an anaerobic sludge system, or operations for existing anaerobic-sludge-based methods to treat beverage industry wastewater.
It can be concluded that our proposed method successfully delivered greater COD removal for the prospective industrial wastewater, even in higher COD initial conditions, which ultimately confirms the applicability of our single-stage anaerobic batch reactor to deal with industrial wastewater, and our results are consistent with a single-stage anaerobic/micro-aerobic sequencing batch reactor for treating real sewage with high COD removal [28].

4. Conclusions

In the current study, the beverage industry wastewater treatment was investigated in a batch anaerobic sludge system. The optimum conditions observed for the anaerobic sludge process were initially HRT = 24 h, SRT = 2.5 days, MLVSS =11,656 mg/L, and initial COD = 80,000 mg/L. Additionally, the calculation of kinetic coefficients based on COD values resulted in a growth yield of 0.46 (mg VSS/mg COD), saturation coefficient of 3500 (mg/L of COD), max substrate utilization of 0.00466 (mg/L COD), growth rate of microbes 0.03833/h, and max growth rate of microbes of 0.3672/h. It was also observed that the degradation of organic matter was dependent on the growth of the microbes. Moreover, a COD reduction level was analyzed for 13 days, which indicated an efficiency of our proposed process up to 99.31%. Therefore, this study is significant, and useful in designing a new beverage wastewater treatment technique by an anaerobic sludge system, or operations for existing anaerobic-sludge-based methods to treat beverage industry wastewater.

Supplementary Materials

The following are available online at https://0-www-mdpi-com.brum.beds.ac.uk/article/10.3390/separations8040043/s1, Figure S1: Different dilutions of (BIW). Figure S2. COD measuring apparatus by using open reflux method. Figure S3. Measuring COD by titration method. Figure S4. Microscopic observation of Gram staining test. Figure S5. The graph between substrate removal rate and removal of COD.

Author Contributions

Conceptualization, U.-e-H., M.S.K.; methodology, U.-e-H., M.S.K.; Review editing, W.R.; formal analysis & visualization H.G., B.M., and M.H.; funding and acquisition, M.A., F.W. All authors have read and agreed to the published version of the manuscript.

Funding

Open Access Funding by TU Wien.

Institutional Review Board Statement

Not applicable.

Informed Consent Statement

Not applicable.

Data Availability Statement

Not applicable.

Acknowledgments

The authors acknowledge the TU-Wien University Library for financial support through its Open Access Funding Program.

Conflicts of Interest

The authors declare no conflict of interest.

References

  1. Murtaza, G.; Zia, M.H. Wastewater Production, Treatment and Use in Pakistan. Available online: https://www.ais.uwater.org/ais/pluginfile.php/232/mod_page/content/128/pakistan_murtaza_finalcountryreport2012.pdf (accessed on 1 March 2021).
  2. Abdelfattah, A.; Hossain, M.I.; Cheng, L. High-strength wastewater treatment using microbial biofilm reactor: A critical review. World J. Microbiol. Biotechnol. 2020, 36, 1–10. [Google Scholar] [CrossRef] [PubMed]
  3. Foods, I.C.o.M.S.F. Microbial Ecology of Food Commodities; Aspen Publishers: New York, NY, USA, 1998; Volume 6. [Google Scholar]
  4. Ortiz-Solá, J.; Viñas, I.; Colás-Medà, P.; Anguera, M.; Abadias, M. Occurrence of selected viral and bacterial pathogens and microbiological quality of fresh and frozen strawberries sold in Spain. Int. J. Food Microbiol. 2020, 314, 108392. [Google Scholar] [CrossRef]
  5. Chen, H.; Zhang, H.; Tian, J.; Shi, J.; Linhardt, R.J.; Ye, T.D.X.; Chen, S. Recovery of High Value-Added Nutrients from Fruit and Vegetable Industrial Wastewater. Compr. Rev. Food Sci. Food Saf. 2019, 18, 1388–1402. [Google Scholar] [CrossRef] [PubMed] [Green Version]
  6. Valta, K.; Kosanovic, T.; Malamis, D.; Moustakas, K.; Loizidou, M. Overview of water usage and wastewater management in the food and beverage industry. Desalination Water Treat. 2015, 53, 3335–3347. [Google Scholar] [CrossRef]
  7. Raza, W.; Kukkar, D.; Saulat, H.; Raza, N.; Azam, M.; Mehmood, A.; Kim, K.-H. Metal-organic frameworks as an emerging tool for sensing various targets in aqueous and biological media. TrAC Trends Anal. Chem. 2019, 120, 115654. [Google Scholar] [CrossRef]
  8. Wawrzkiewicz, M.; Hubicki, Z. Anion exchange resins as effective sorbents for removal of acid, reactive, and direct dyes from textile wastewaters. Ion Exch. Stud. Appl. 2015, 37–72. [Google Scholar] [CrossRef] [Green Version]
  9. Yao, L.; Zhang, L.; Wang, R.; Chou, S.; Dong, Z. A new integrated approach for dye removal from wastewater by polyoxometalates functionalized membranes. J. Hazard. Mater. 2016, 301, 462–470. [Google Scholar] [CrossRef]
  10. He, H.; Chen, Y.; Li, X.; Cheng, Y.; Yang, C.; Zeng, G. Influence of salinity on microorganisms in activated sludge processes: A review. Int. Biodeterior. Biodegrad. 2017, 119, 520–527. [Google Scholar] [CrossRef]
  11. Franchi, O.; Cabrol, L.; Chamy, R.; Rosenkranz, F. Correlations between microbial population dynamics, bamA gene abundance and performance of anaerobic sequencing batch reactor (ASBR) treating increasing concentrations of phenol. J. Biotechnol. 2020, 310, 40–48. [Google Scholar] [CrossRef]
  12. Gebara, F. Activated sludge biofilm wastewater treatment system. Water Res. 1999, 33, 230–238. [Google Scholar] [CrossRef]
  13. Waqas, S.; Bilad, M.R.; Man, Z.; Wibisono, Y.; Jaafar, J.; Mahlia, T.M.I.; Khan, A.L.; Aslam, M. Recent progress in integrated fixed-film activated sludge process for wastewater treatment: A review. J. Environ. Manag. 2020, 268, 110718. [Google Scholar] [CrossRef]
  14. Bozkurt, Y.C.; Apul, O.G. Critical review for microwave pretreatment of waste-activated sludge prior to anaerobic digestion. Curr. Opin. Environ. Sci. Health 2020, 14, 1–9. [Google Scholar] [CrossRef]
  15. Helbling, D.E.; Johnson, D.R.; Honti, M.; Fenner, K. Micropollutant biotransformation kinetics associate with WWTP process parameters and microbial community characteristics. Environ. Sci. Technol. 2012, 46, 10579–10588. [Google Scholar] [CrossRef] [PubMed]
  16. Cheng, D.; Ngo, H.H.; Guo, W.; Chang, S.W.; Nguyen, D.D.; Liu, Y.; Shan, X.; Nghiem, L.D.; Nguyen, L.N. Removal process of antibiotics during anaerobic treatment of swine wastewater. Bioresour. Technol. 2020, 300, 122707. [Google Scholar] [CrossRef] [PubMed]
  17. Lim, M.; Patureau, D.; Heran, M.; Lesage, G.; Kim, J. Removal of organic micropollutants in anaerobic membrane bioreactors in wastewater treatment: Critical review. Environ. Sci. Water Res. Technol. 2020, 6, 1230–1243. [Google Scholar] [CrossRef]
  18. Ibrahim, A.K.C. Kinetic Parameter Studies of Activated Sludge Process For Anaerobic Pre-Treated Palm Oil Mill Effluent [TD756. 45. A286 2007 f rb]; Universiti Sains Malaysia: Penang, Malaysia, 2007. [Google Scholar]
  19. Bevilacqua, A.; Corbo, M.R.; Campaniello, D.; D’Amato, D.; Gallo, M.; Speranza, B.; Sinigaglia, M.G.R. Shelf life prolongation of fruit juices through essential oils and homogenization: A review. In Science Against Microbial Pathogens: Communicating Current Research and Technological Advances; Formatex Research Centre: Badajoz, Spain, 2011; pp. 1157–1166. [Google Scholar]
  20. Maksimović, Z.; De la Fe, C.; Rifatbegović, M. Assessment of in vitro growth characteristics of Mycoplasma ovipneumoniae. Rev. Sci. Tech. Off. Int. Epiz 2020, 39, 2. [Google Scholar]
  21. Peng, X.; Cao, J.; Xie, B.; Duan, M.; Zhao, J. Evaluation of degradation behavior over tetracycline hydrochloride by microbial electrochemical technology: Performance, kinetics, and microbial communities. Ecotoxicol. Environ. Saf. 2020, 188, 109869. [Google Scholar] [CrossRef]
  22. Lotti, T. Developing Anammox for mainstream municipal wastewater treatment. Appl. Microbiol. Biotechnol. 2016, 101, 1365–1383. [Google Scholar]
  23. Chopra, S.; Kumar, D. Characterization, optimization and kinetic study of diclofenac degradation by novel bacterial strains and their synthetic consortia. Bioremediation J. 2020, 24, 150–170. [Google Scholar] [CrossRef]
  24. Maaroff, R.M.; Jahim, J.M.; Azahar, A.M.; Abdul, P.M.; Masdar, M.S.; Nordin, D.; Abd Nasir, M.A. Biohydrogen production from palm oil mill effluent (POME) by two stage anaerobic sequencing batch reactor (ASBR) system for better utilization of carbon sources in POME. Int. J. Hydrog. Energy 2019, 44, 3395–3406. [Google Scholar] [CrossRef]
  25. Pronk, M.; De Kreuk, M.; De Bruin, B.; Kamminga, P.; Kleerebezem, R.v.; Van Loosdrecht, M. Full scale performance of the aerobic granular sludge process for sewage treatment. Water Res. 2015, 84, 207–217. [Google Scholar] [CrossRef]
  26. Gurung, K.; Ncibi, M.C.; Fontmorin, J.-M.; Särkkä, H.; Sillanpää, M. Incorporating submerged MBR in conventional activated sludge process for municipal wastewater treatment: A feasibility and performance assessment. J. Membr. Sci. Technol. 2016, 6, 3. [Google Scholar] [CrossRef] [Green Version]
  27. Tawfik, A.; El-Kamah, H. Treatment of fruit-juice industry wastewater in a two-stage anaerobic hybrid (AH) reactor system followed by a sequencing batch reactor (SBR). Environ. Technol. 2012, 33, 429–436. [Google Scholar] [CrossRef] [PubMed]
  28. Yuan, C.; Wang, B.; Peng, Y.; Li, X.; Zhang, Q.; Hu, T. Enhanced nutrient removal of simultaneous partial nitrification, denitrification and phosphorus removal (SPNDPR) in a single-stage anaerobic/micro-aerobic sequencing batch reactor for treating real sewage with low carbon/nitrogen. Chemosphere 2020, 257, 127097. [Google Scholar] [CrossRef]
Figure 1. Different types of media (a) Eosin methylene blue (EMB) agar (b) Nutrient agar (c) MacConkey agar.
Separations 08 00043 g001
Figure 2. Lab-scale anaerobic reactor for industrial beverage wastewater with 3 mg/L activated carbon for pre-treatment.
Separations 08 00043 g002
Figure 3. Colony formed on dilution 1st and 2nd on nutrient agar.
Separations 08 00043 g003
Figure 4. Colony-forming unit count on (a) MacConkey agar (b) nutrient agar, and (c) EMB agar.
Separations 08 00043 g004
Figure 5. Effect of dilution on colony-forming unit in eosin methylene blue agar, nutrient agar, and McConkey agar.
Separations 08 00043 g005
Figure 6. Dependence of log10(CFU) on time in eosin methylene blue agar, nutrient agar, and MacConkey agar.
Separations 08 00043 g006
Figure 7. COD removal and substrate uptake versus time.
Separations 08 00043 g007
Figure 8. Removal of COD and efficiency of the process over time.
Separations 08 00043 g008
Figure 9. Solid retention time of the process over time.
Separations 08 00043 g009
Table 1. Identified bacteria types in the industrial beverage wastewater sample.
Type of BacteriaGenus and Species
Gram-negative bacteriaCampylobacter coli (C. coli)
Escherichia coli (E.coli)
Pseudomonas
Salmonella spp.
Shigella spp.
Vibrio cholera
Gram-positive bacteriaLactic acid bacteria
Streptococcus
Staphylococcus
Table 2. Viable counts of the colonies on eosin methylene blue agar, nutrient agar, and on MacConkey agar.
DilutionsNumber of Colonies on EMB AgarNumber of Colonies on Nutrient AgarNumber of Colonies on
McConkey Agar
10318614448
10413412032
105406014
10628459
Table 3. Values of colony-forming units as per dilutions in eosin methylene blue agar, nutrient agar, and MacConkey agar.
AgarsNo. of DilutionsNumber of Colonies × Dilution FactorCFU/mL = Number of Colonies × Dilution Factor/Volume of Culture PlateLog10(CFU)Adj. R-Square
R2
1037.44 × 1057445.870.9976
EMB1044.8 × 1064806.68
1052.4 × 1072407.38
1061.86 × 1081868.26
1035.76 × 1055765.760.97884
Nutrient1045.36 × 1065366.72
1051.6 × 1071607.204
1061.24 × 1081248.093
MacConkey1034.8 × 104484.680.99637
1043.2 × 105325.505
10514 × 106146.14
1069.0 × 10796.95
Table 4. Characteristics of industrial wastewater.
CharacteristicsCOD
mg/L
pHBOD
mg/L
ColorVSS
mg/L
80,0004.558,000Orange11,656
Table 5. Solid retention time (SRT), substrate removal, and COD removal efficiency with time.
TimeRemoval of CODSubstrate Uptake
S 0 S e X . t S 0 S e X . t S 0 S e X . t
EfficiencySRT
Daysmg/LDay−1%Days
180,000002.5
364,6000.10519.252.767
550,8000.20637.53.058
736,8000.296543.425
928,5000.35464.33.687
1110,8000.47287.54.405
135500.54699.314.965
Table 6. Kinetic parameters obtained by removal of COD for industrial beverage wastewater.
Kinetic ConstantUnitsValue
KSmg/L COD3500
ΜL/h0.03833
μmL/h0.03672
Kmg/L COD0.0066
k-----0.0437
Ymg VSS/mg COD0.46
Table 7. Comparison of the initial characteristics of wastewater results with reported literature.
OrderReactor
Type
WastewaterpHTemperature
°C
COD
mg/L
MLSS
mg/L
HRT
h
SRT
Days
COD Removal%References
1Two-stage anaerobic batch reactorpalm oil mill effluent4.337–5786004100122090[24]
2Aerobic granular sludgeSewage wastewater---20143680001720–3863[25]
3ConventionalMunicipal Wastewater6.5–7.49–16520–850220–720122899[26]
anaerobic sludge process
4Two-stage anaerobic hybridFruit juice industrial wastewater7.526498013131-----99[27]
5Single-stage anaerobic batch reactorBeverage industrial wastewater4.520–2580,00011,656132699.31This work
Publisher’s Note: MDPI stays neutral with regard to jurisdictional claims in published maps and institutional affiliations.

