Article

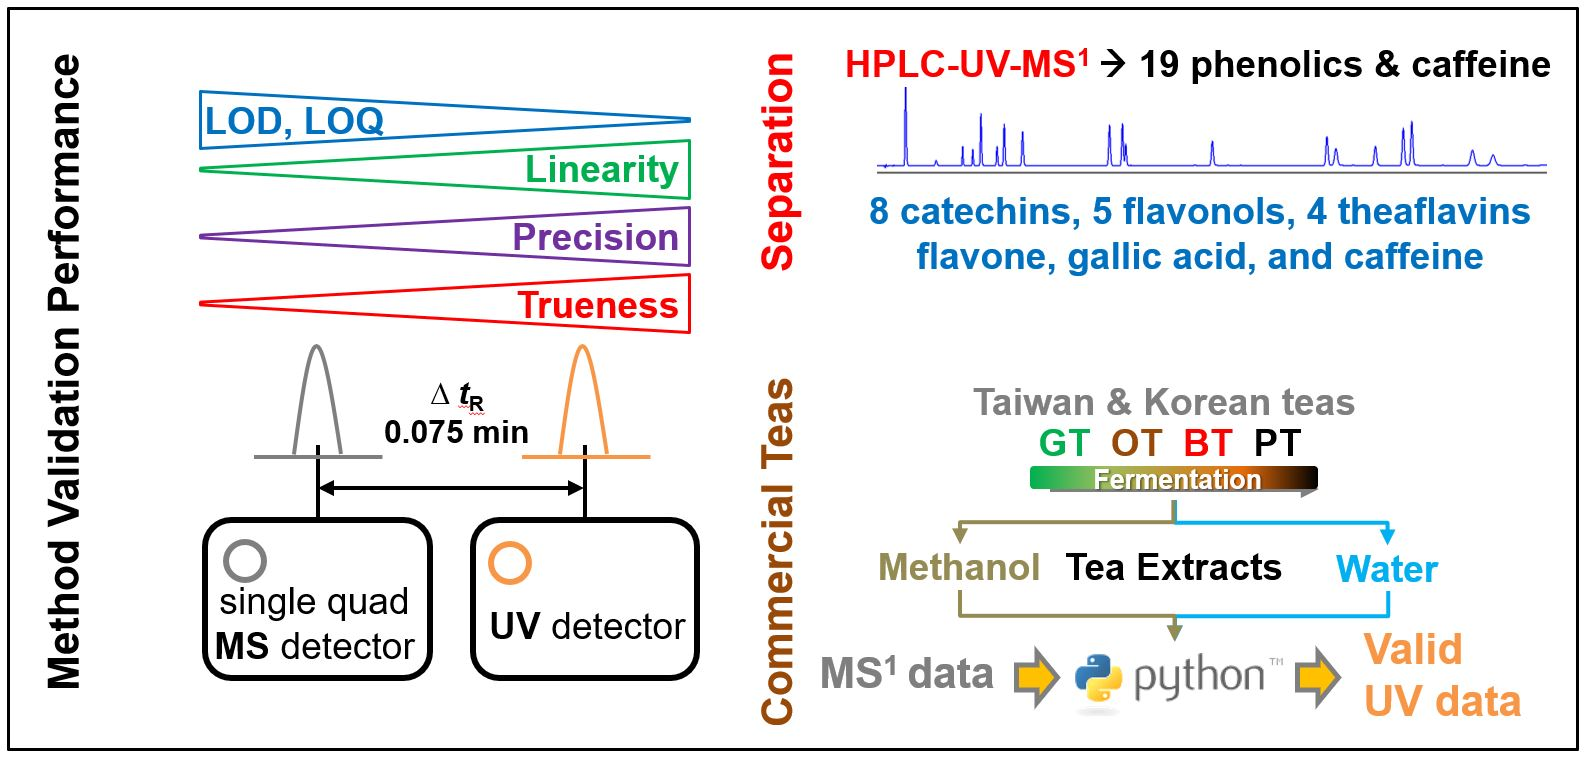
Cost-Effective Simultaneous Separation and Quantification of Phenolics in Green and Processed Tea Using HPLC–UV–ESI Single-Quadrupole MS Detector and Python Script

1
AMOREPACIFIC R&D Center, Yongin 17074, Korea
2
Solution Center, Waters Korea Ltd., Seoul 07241, Korea
3
Innovalue Partners, Seoul 06724, Korea
4
Department of Food Science and Biotechnology, Kyung Hee University, Yongin 17104, Korea
*
Authors to whom correspondence should be addressed.
Submission received: 26 February 2021 / Revised: 19 March 2021 / Accepted: 25 March 2021 / Published: 2 April 2021
(This article belongs to the Special Issue Development of Analytical Method in Food Science)

Abstract

:
Phenolic composition of green tea (Camellia sinensis) varies according to manufacturing processes that result in deglycosylation of glycosylated phenolics and condensation, epimerization, and degalloylation of flavan-3-ols (catechins). Ambiguous phenolic assignments based on UV absorbance alone can occur when the chromatographic peaks overlapped slightly. We established an improved method using an HPLC–UV coupled with a single-quadrupole MS detector (MS1) that can reject false UV peaks after checking the preceding MS1 peaks. Adjusted UV data coded by the Python algorithm were deployed to compare tea phenolics. Performance validation of the MS1 and UV analysis methods for 19 phenolics revealed a sensitivity of 0.17 and 0.47 pmol/injection, limit of detection of 15 and 33 μg/L, limit of quantification of 50 and 110 μg/L, intra-day precision of 5% and 1% relative standard deviation, and trueness of 83–135% and 97–100%, respectively. Our results suggest that the HPLC–UV–MS1 method, which is a low operational cost method, potentially provides the precise phenolic composition of teas.

Graphical Abstract

1. Introduction

Green tea (GT; Camellia sinensis) is one of the most widely consumed beverages in the world [1]. Phenolic compounds of teas, such as GT, black tea, and dark tea, are diverse and modified by tea manufacturing processes such as withering, thermal treatment, and microbial fermentation [2,3]. The health-promoting effects of some phenolic compounds have been evaluated, and they have been found to have anticancer, anti-hyperlipidemic, anti-inflammatory, anti-obesity, antioxidative, and antiviral activities [4,5,6,7,8,9]. Advanced analytical methods, accompanied with state-of-the-art technologies such as mass spectrometry, nuclear magnetic resonance, and metabolomics approach, have played a key role in determining the dose of health-beneficial bioactive phenolics, such as flavonoids, in food resources [10,11].
GT primarily contains flavan-3-ols (catechins), such as (–)-epigallocatechin (EGC) and (–)-epigallocatechin gallate (EGCG), and theaflavins, which are produced by endogenous enzymatic oxidation when polyphenol oxidases in the tea leaves are released during tea processing (Figure 1) [2]. Various flavonol and flavone glycosides are present in tea leaves, and their aglycones, such as apigenin, kaempferol, myricetin, and quercetin, can be formed by addition of exogenous enzymes [12,13]. Most flavan-3-ols can be degraded by microbial post-fermentation. A variety of intrinsic and extrinsic factors such as fermentation heat, moisture, and microbial activity cause the release of gallic acid as a result of the cleavage of galloyl moieties from galloylated flavan-3-ols, such as (−)-epicatechin gallate (ECG) and EGCG [14]. A decade ago, 68 kinds of phenolics were tentatively identified in GT and processed tea [15], and recently, 60 phenolic compounds were tentatively identified by comparing young and old green tea leaves [16].
Research has been undertaken to determine separation methods that can enhance analytical performance of the phenolic compounds present in tea. Epicatechin (EC) was first isolated from GT by crystallization of ethyl acetate extract 90 years ago [17]. Eight flavan-3-ols were simultaneously analyzed by high-performance liquid chromatography (HPLC) in 1976 [18]. By using HPLC, it has been possible to reduce the separation time of eight flavan-3-ols to within 20 min [19]. Over 45 compounds were subsequently simultaneously analyzed using ultra-performance liquid chromatography (UPLC) coupled with quadrupole time of flight (TOF) MS [10]. Furthermore, 24 compounds from GT were quantified within 3 min of run-time by using an HPLC coupled with a quadrupole MS/MS system equipped with a core–shell column [20].
Advancements in analytical instruments such as various automated samplers, high resolution MS, and Q-TOF have facilitated handling of large samples and provided high resolution and high selectivity by multiple reaction monitoring. Moreover, non-targeted metabolomic analysis of food phenolics in many botanical plants can provide a wealth of information [10,21]. However, advanced analytical instruments are expensive to purchase and maintain, require advanced training to operate, and have high operation costs (e.g., special eluents and columns). Even though over 20 compounds in various tea samples have been quantified with high-resolution instruments, resolution was generally poor, and there was also poor separation of these compounds due to the lack of analytical optimization (i.e., fronting and tailing of peaks) [3]. MS analysis has the advantage of being able to simultaneously analyze and assign many compounds even when their retention times (tR) overlap. However, this convenience cannot be achieved through HPLC-ultraviolet (UV) that is widely used in many fields of research and manufacture.
Accurate quantification of tea phenolics using high-resolution MS needs sufficient budget in many research institutes. Therefore, we have developed an alternative analytical method using MS detector with low acquisition cost that meets high specificities for the target compounds and eliminates false UV peaks according to the MS results. In this study, simultaneous detection of 20 compounds from green tea and its processed products was performed and validated using two detectors, UV and single-quadrupole mass detector (MS1) in single HPLC separation system.

2. Results and Discussion

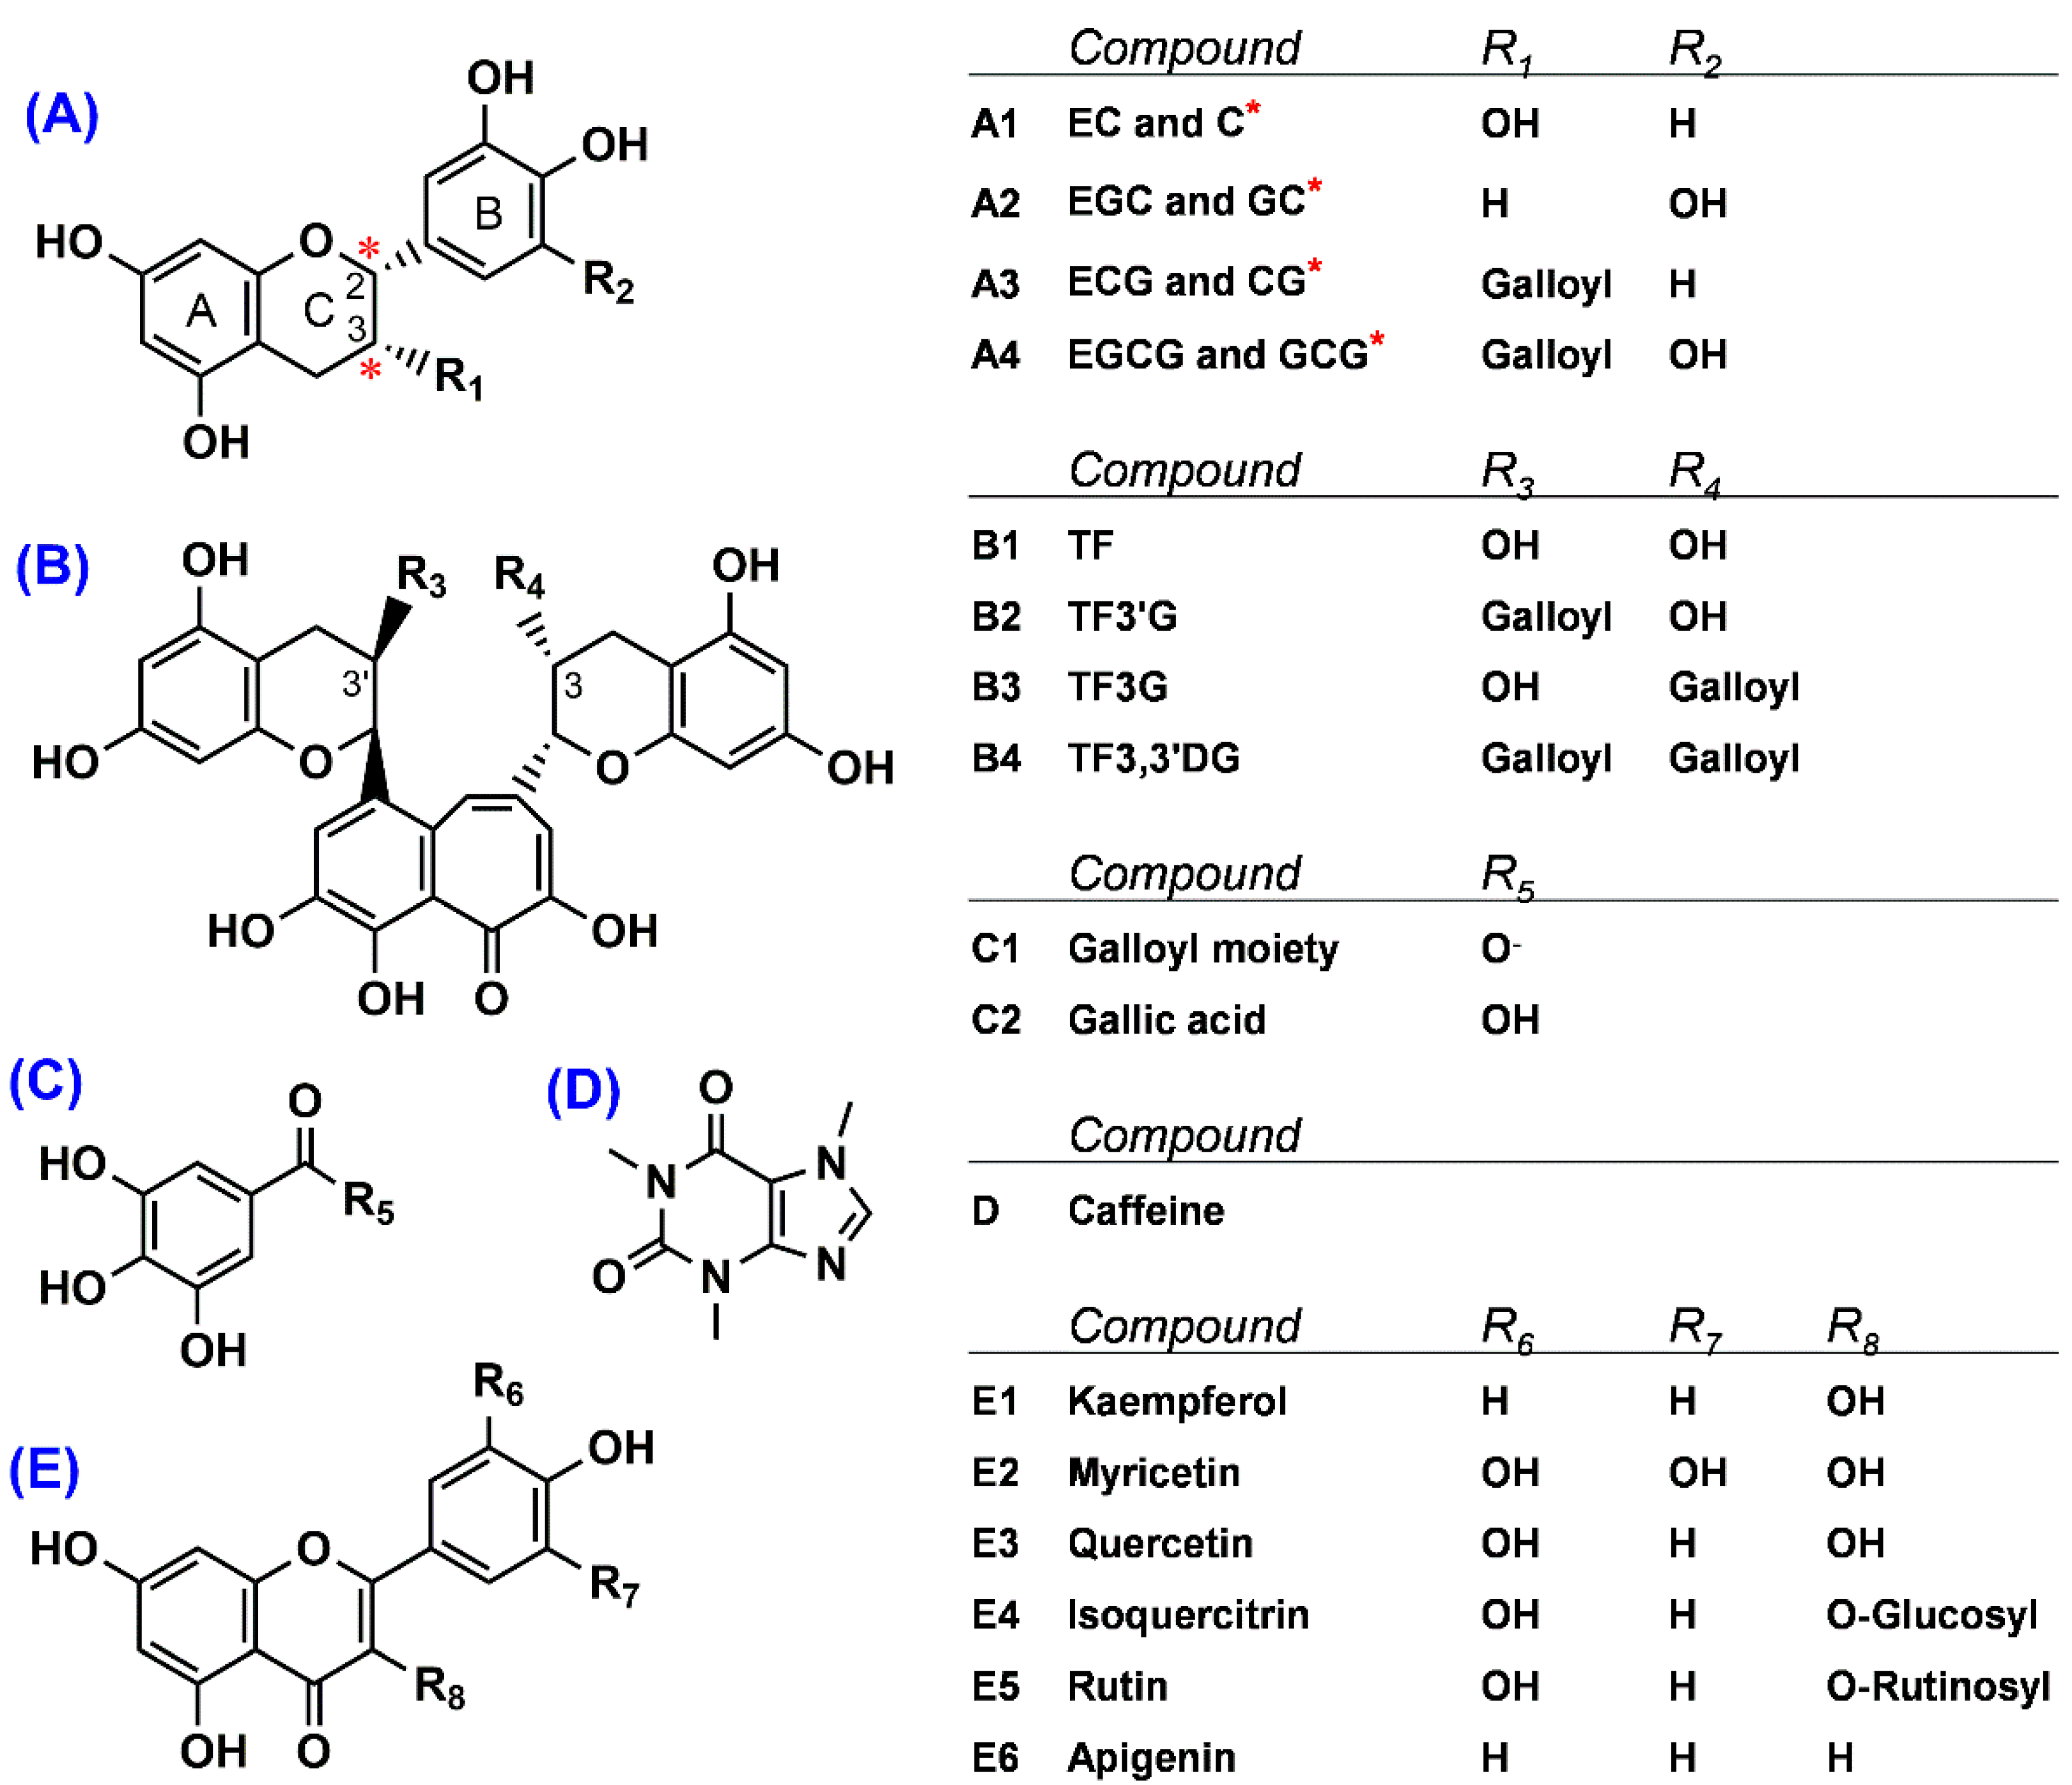
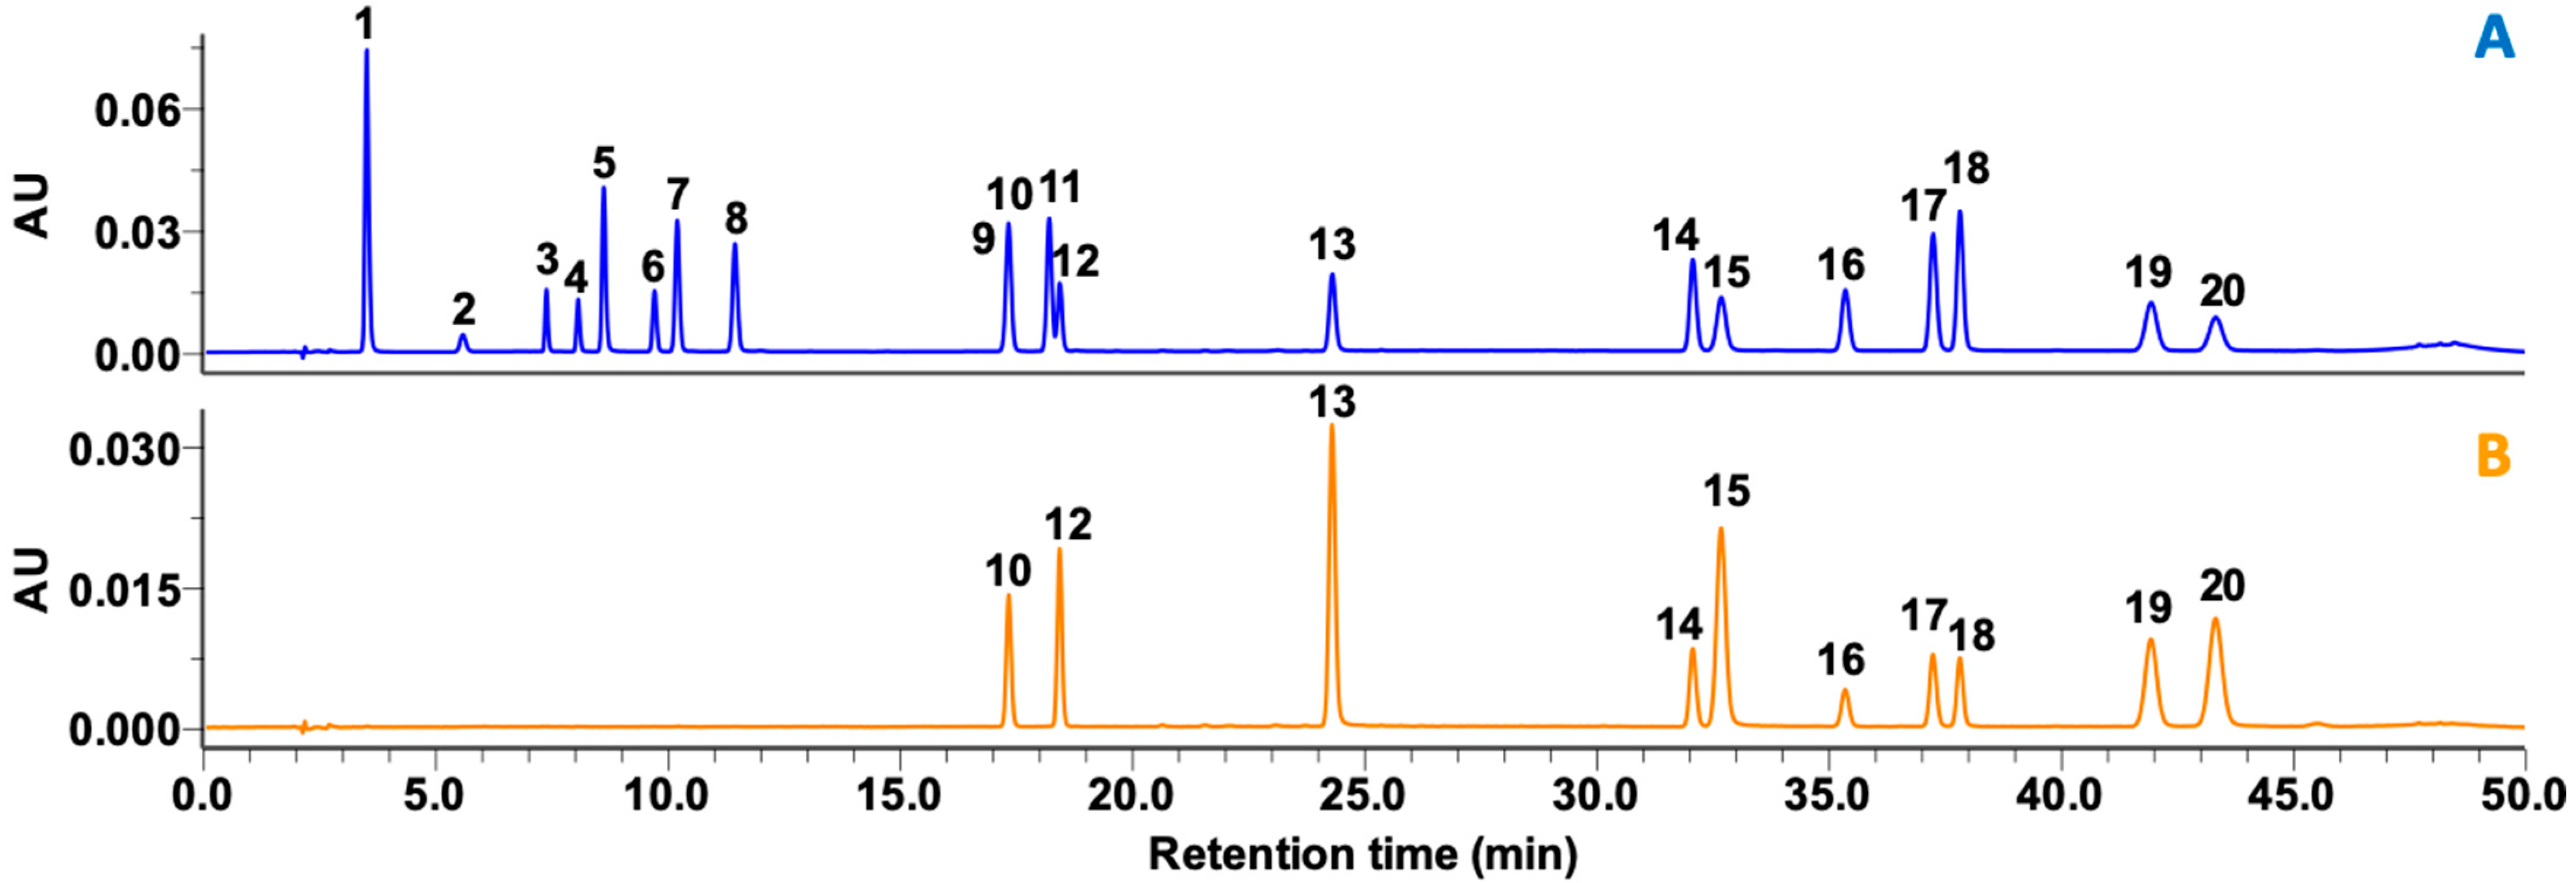
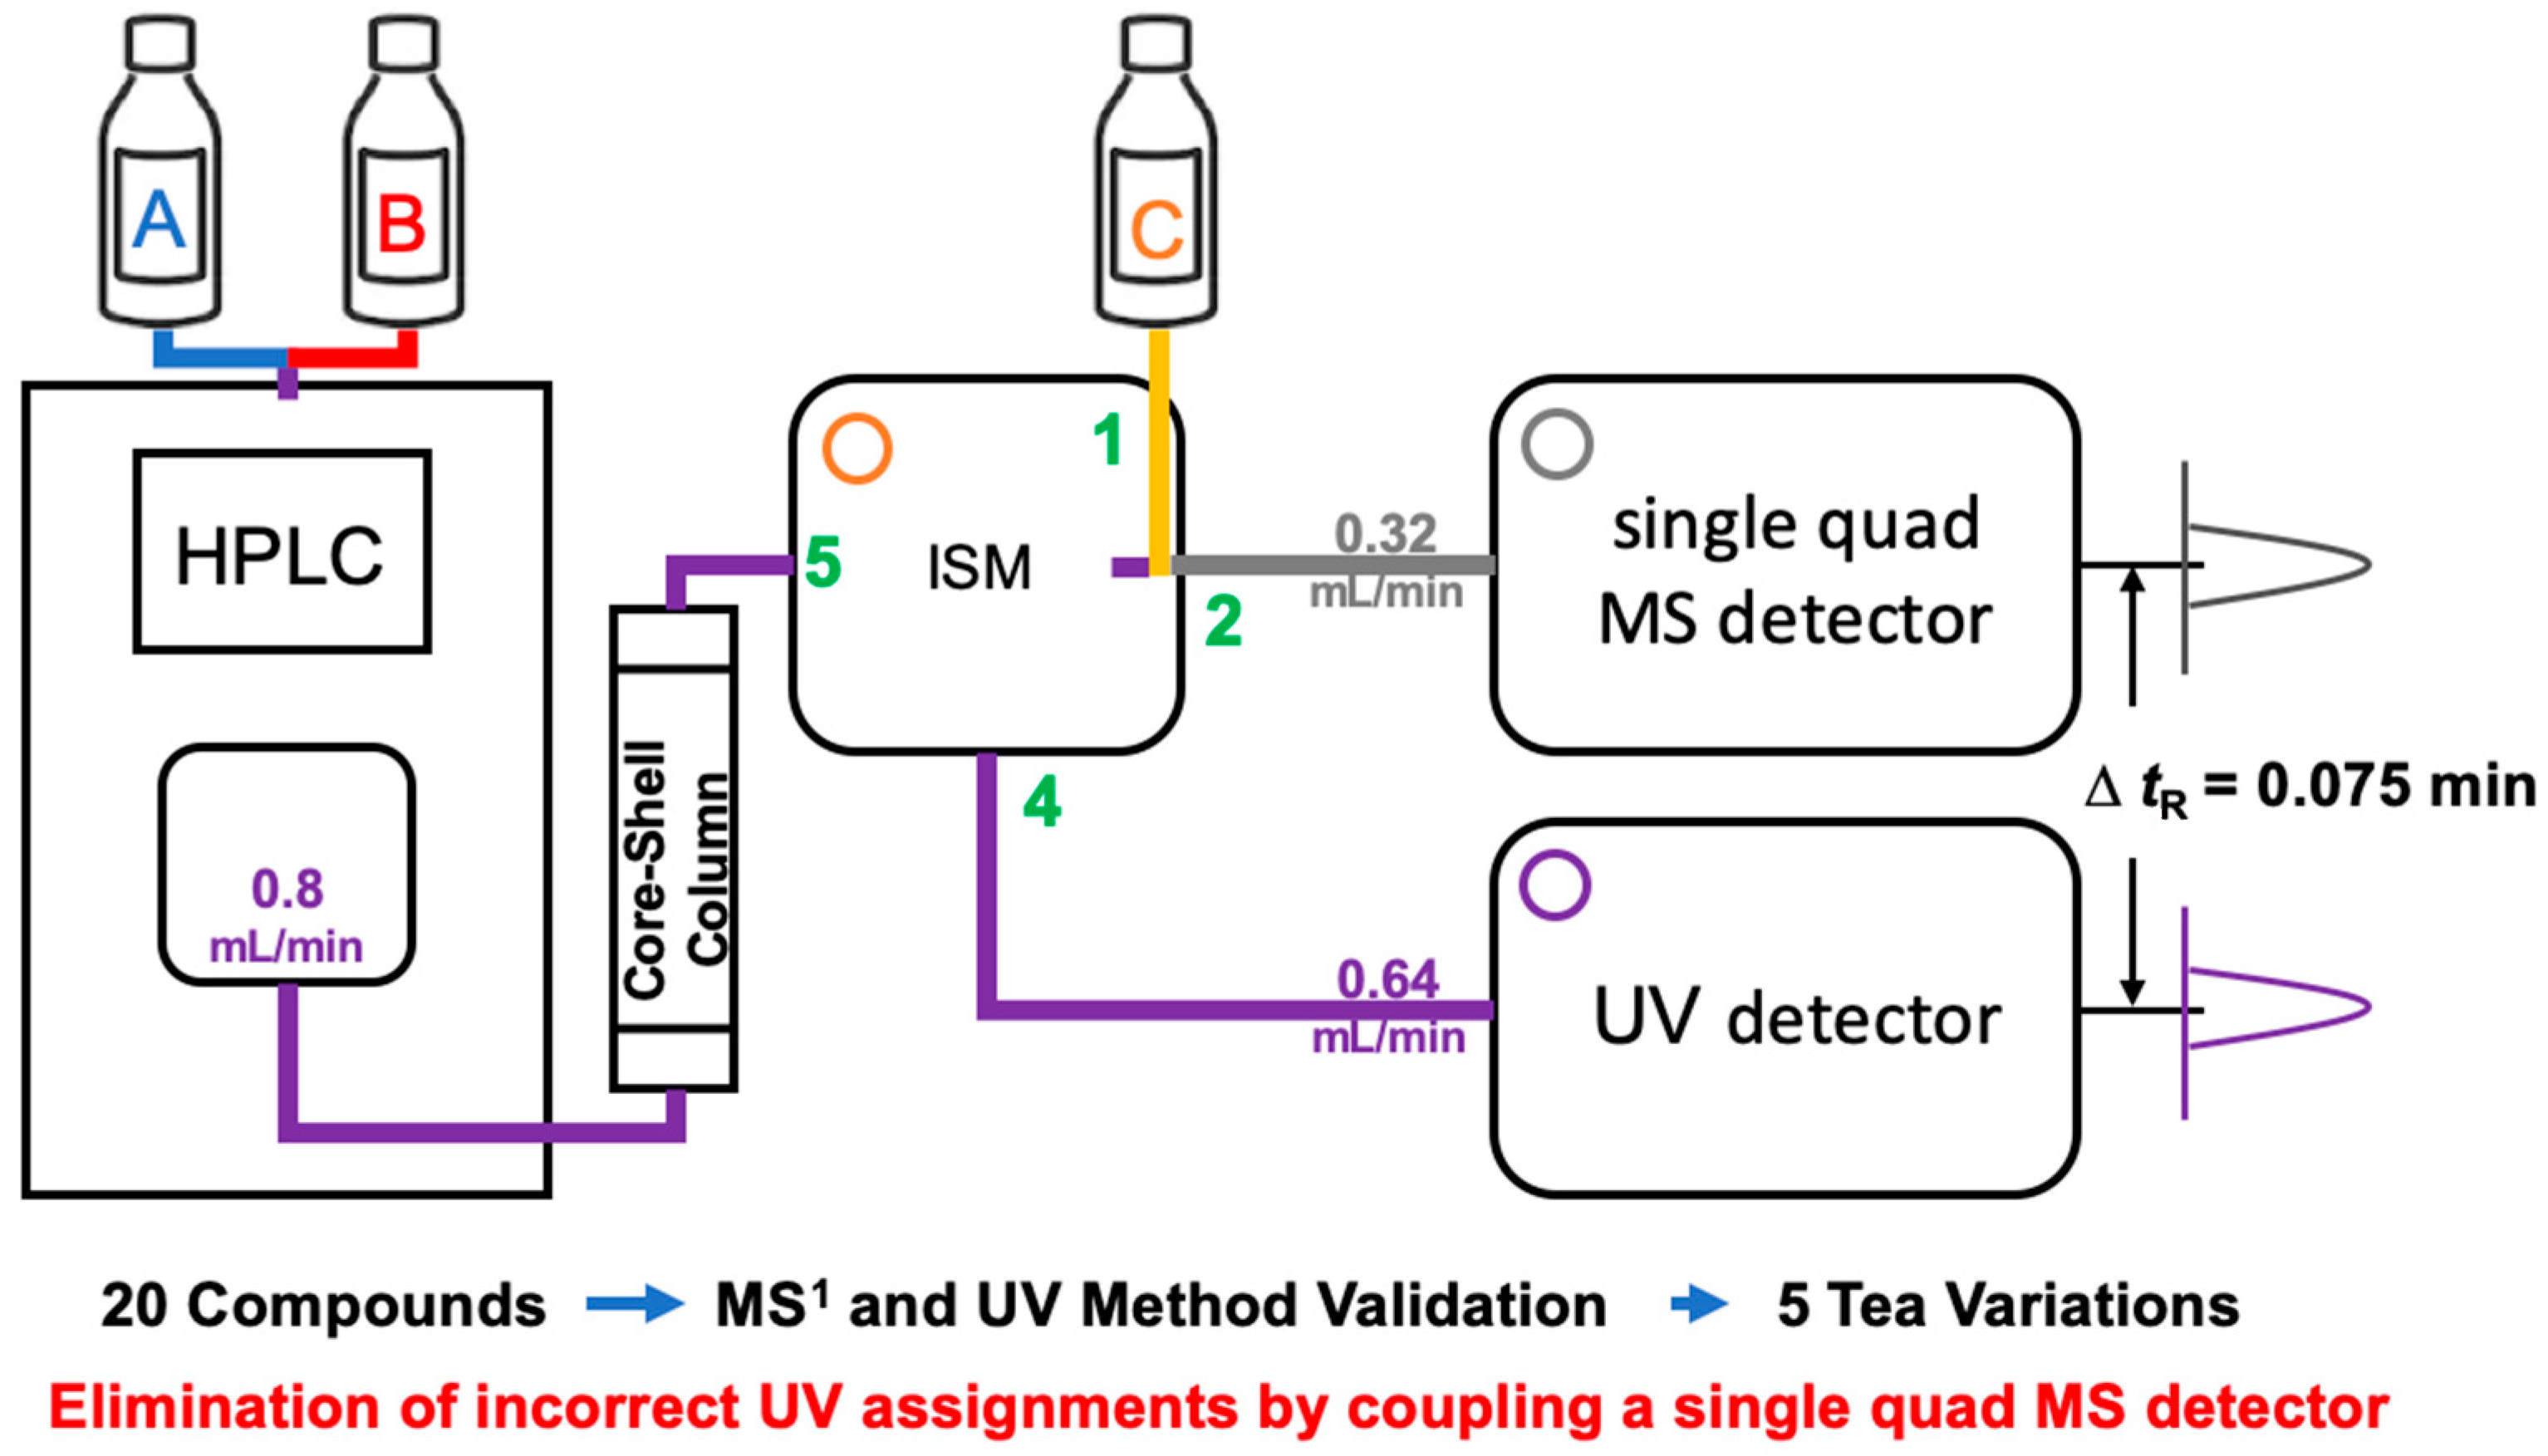
2.1. HPLC-UV and MS1 Method Development

The 20 compounds were separated using a run time of 50 min that was based on modification of previous protocols [7,22]. Separation strategies were organized into three parts: (1) a hydrophilic part (peaks 1−8), (2) a meso-hydrophilic part (peaks 9−13), and (3) a hydrophobic part (peaks 14−20) (Figure 2). Due to mutual interaction of a meso-hydrophilic part under changing elution conditions, peak overlap occurred between peaks 9 (ECG) and 10 (rutin). Excluding these two peaks, all the other peaks were clearly separated with proper resolution at both 275 and 365 nm. Even though there was overlap of peaks in UV detection, there were no overlapping peaks in mass detection (Figure S1 and Supplementary Data I).
Due to the arrangement of the two detectors, the tR gap (tR gap = tR (UV)−tR (MS1)) of each peak appeared in the precise range (0.075 ± 0.004 min; data not shown). Mass detection was conducted within a limited retention time window of acquisition time to enhance sensitivity similar to most MS/MS research. This approach can deliver more precise results and eliminate unnecessary acquisitions, which can improve inter-scan capacity during simultaneous acquisition and yield a valid number of quantification points for one peak [23]. The symmetry factors of the 20 compounds ranged from 1.02 to 1.20 and 1.03 to 1.06 for UV detection at 275 and 365 nm, respectively (data not shown). The resolution of these 20 compounds was in the range of 2.0−10.0 for UV and MS1 (data not shown), which is greater than 1.5 found on the basis of baseline-separation criteria [24].
Conditions for appropriate simultaneous separation of compounds in Camellia sp. depends on the topic of research and the compounds of interest (e.g., flavan-3-ols, theaflavins, or flavonols) [25,26,27]. Many flavonol glycosides of GT are in the meso-hydrophilic zone in reversed-phase HPLC column analysis, while polymeric compounds such as theaflavins transformed by tea processing or exogenous enzymes appear in the hydrophobic zone [7]. These chemical characteristics of flavonoids make it challenging to find a method suitable for analysis. Peaks overlap if UV detection alone is used to separate phenolic compounds in Camellia sp. [16], and consequently, many flavonol glycosides cannot be distinguished. Therefore, a proper separation method that effectively distinguishes flavonol glycosides is required. The ideal retention time range for separation in our study for most flavonol glycosides was 10−30 min (Figure S2). However, peak overlap at 275 nm was unavoidable due to co-elution of ECG or (–)-catechin gallate (CG) and flavonol glycosides. Results should therefore be interpreted carefully.

2.2. Validation of UV and MS1 Methods

Limit of detection (LOD), limit of quantification (LOQ), linearity, trueness, and precision were determined for a liquid chromatography system coupled with both UV and MS1 detectors. The validation results are summarized in Table 1. The tR values of compounds detected by UV and MS1 had an acceptable standard deviation (SD) and good resolution (Rs; data not shown). Elution conditions in the hydrophobic zone (tR > 30) resulted in relatively large SDs (>0.2%), whilst the repeatability of tR remained the same (average relative standard deviation (RSD) of 0.8% for both UV and MS1 detection).
Seven-point calibration curves were plotted over the 20-fold concentration range, and linearity was excellent for UV detection (R > 0.9995) and moderate for MS1 detection (R > 0.990 except for apigenin). Sensitivity ranged from 0.11 to 2.66 pmol/injection and from 0.07 to 0.53 pmol/injection for UV and MS1 detection, respectively (data not shown). LOD ranged from 5 to 162 μg/L for UV detection and from 4 to 47 μg/L for MS1 detection. LOQ ranged from 16 to 539 μg/L for UV detection and from 13 to 158 μg/L for MS1 detection (Table 1). The sensitivity of MS1 detection was 0.4−14.4-fold higher than that of UV detection (data not shown). The LODs of MS1 detection were twofold higher than those reported for determination of flavan-3-ols by MS/MS instrumentation [28]. Furthermore, LOD of UV detection was two orders of magnitude lower than that reported previously [3,29].
The trueness of spiked compounds ranged from 97.23% to 99.65% recovery in the UV detection, whereas that of spiked compounds ranged from 83.56% to 135.35% recovery in the MS1 detection (Table 1). UV detection showed better trueness compared with MD1 detection. Some phenolics (e.g., kaempferol, myricetin, and apigenin) and caffeine caused poor trueness in the MS1 detection. Intra-day precision ranged from 0.2% to 1.0% RSD for UV detection and from 0.3% to 5.3% RSD for MS1 detection (Table 1). Inter-day precision ranged from 1.8% to 3.0% RSD for UV detection and from 2.1% to 25.0% RSD for MS1 detection (Table 1). Our RSD values for intra- and inter-day precisions of UV detection were four- to five-fold lower than those reported for UPLC–MS/MS instrumentation [30]. However, the inter-day precision of some compounds (e.g., myricetin and apigenin) in MS1 detection were relatively high RSD values (>20%), partly due to daily variations in MS1. Despite the shortcomings of MS1 detection, its combination with traditional UV detection is useful to overcome them. Hereafter, we discuss the utility of HPLC–UV–MS1 for analyzing tea samples.

2.3. Quantification of Commercial Tea Samples

An HPLC–UV coupled with an MS1 was used to quantify 19 phenolics and caffeine derived from representative green tea and processed tea samples. To ensure that we analyzed a diverse variety of tea samples and compounds within the tea samples, we selected five commercial tea samples: two green teas and three processed teas (one oolong tea obtained by semi-fermentation, one black tea by full-fermentation, and one dark tea by microbial fermentation). Phenolics and caffeine in the tea samples were quantified by UV detection. UV wavelengths of 275 and 365 nm were used to detect flavan-3-ols and flavonols, respectively, as reported previously [13].
Major differences in phenolic profiles among tea samples were detected as shown in Figure S2. Fermented teas contained fewer flavan-3-ols and relatively higher levels of theaflavins than the other teas analyzed. A considerable amount of flavonol glycosides disappeared from fermented teas compared to unfermented teas. Retention times of phenolics and caffeine in the five tea samples were effectively reproduced at two UV wavelengths (275 and 365 nm). Tea extracts contain various compounds that can be difficult to detect by UV detection alone. As described in Figure S2, transformed compounds such as complex polyphenols or phenolic acid derivatives exhibit similar tR values to those of epimerized flavan-3-ols (e.g., (−)-gallocatechin (GC)) [16,31]. Therefore, UV quantification may lead to inaccurate findings. If invalid quantification occurs, the difference in tR between UV and MS1 will be outside the valid range of 0.06−0.09 min (Figure S3). Therefore, post-processing of UV quantification was performed using an algorithm coded in Python that matches the UV peak with the corresponding MS1 data indexed by the same injection ID. In total, 839 lines of MS1 data and 1927 lines of UV data were processed using Empower 3 software (Waters Corp., Milford, MA, USA) (Supplementary Data II). Without the mechanistic post-processing of UV data, however, manual inspection of UV data must be undertaken to obtain valid data based upon MS1 data. Therefore, we adopted the following matching logic: (1) same injection ID matching, (2) gap in tR, (3) rejection/collection of invalid/valid matching, and (4) quantification with the valid UV peak. Using these post-data processing steps, we were able to obtain a reliable quantification summary.
Similar to the results reported by many previous researchers [2,3,14,16,26,31], green teas (GT from Taiwan, GTT; and GT from Korea, GTK) contain mainly flavan-3-ols (45−120 mg/g) and some flavonol glycosides, and oolong tea (oolong tea from Taiwan, OTT) and black tea (black tea from England, BTE) contain theaflavins (4−12 mg/g) and gallic acid (1.7−1.9 mg/g) (Table 2). Most flavan-3-ols disappeared from post-fermented tea (post-fermented (dark) tea from South Korea, PTK), whereas a relatively large amount of gallic acid (4.5−5.0 mg/g) was present due to cleavage of the galloyl moiety from flavan-3-ols (Table 2).
To compare the effects of solvents on the extraction of phenolics, we investigated two extraction conditions: an experimental condition (60% (v/v) aqueous methanol with sonication at ambient temperature) and a consumer usage condition (infusion with hot water at 80 °C for 3 min). Briefly, the content of hydrophilic compounds (gallic acid and EGC) and meso-hydrophilic compounds (rutin and isoquercitrin) in solution was similar between the aqueous methanol extract and hot water infusion for all five teas (Table 2). The content of relatively hydrophilic compounds (caffeine, EC, and EGCG) in the hot water infusion was statistically different from that in the 60% (v/v) aqueous methanol extract. Interestingly, among the four epicatechins (EC, ECG, EGC, and EGCG), the content of ECG in 60% (v/v) aqueous methanol extracts of GTT and OTT was 4.6- and 9.0-fold higher than that in the hot water infusion, respectively. Hot water infusions of GTK, PTK, and BTE did not contain ECG, and that of GTT, GTK, OTT, PTK, and BTE did not contain theaflavins (Table 2). The content of caffeine was relatively high (20−33 mg/g) in the five tea extracts obtained using both extraction conditions. The flavone apigenin was below the LOQ or not detected for both UV and MS1 (Table 2). Quercetin and kaempferol were not present in any of the tea extracts (data not shown). The phenolic content of the tea samples by manual post-processing is presented in Table S1 for comparison.

2.4. Operational Cost Comparison

Two systems comprising HPLC–UV–MS1 and UPLC–MS/MS were compared for our separation method and representative method, respectively. For the simple comparison, instruments were exampled with the same manufacture. Separation columns and solvents were adopted in accordance with the requirements of the instruments. We set 2000 injections per column and 5000 injections per year; thereafter, operational costs (consumables, discipline of researcher, and maintenance of instrument) per year, initial costs of instrumentation, and total costs (sum of operational cost and initial cost) per 5 years were evaluated (Table S2). Briefly, the operational cost of the two systems were almost the same (approximately USD 35,000 per year) due to longer analysis time of HPLC–UV–MS1 and the expensive requirements of UPLC–MS/MS system. Ultimately, a cost-effective analysis can be achieved with the HPLC–UV–MS1 system (approximately USD 260,000 for 5 years) owing to the initial cost of the instrumentation compared with the four times higher price of the UPLC–MS/MS system (approximately USD 470,000 for 5 years).

3. Materials and Methods

3.1. Chemicals and Reagents

Apigenin (purity > 95.0%), (−)-EC (purity > 99.0%), (−)-ECG (purity > 99.0%), (−)-EGC (purity > 99.0%), (−)-EGCG (purity > 99.0%), (−)-catechin (C) (purity > 99.0%), CG (purity > 99.0%), GC (purity > 99.0%), (−)-gallocatechin gallate (GCG) (purity > 99.0%), theaflavin (purity > 90.0%), theaflavin 3-O-gallate (purity > 90.0%), theaflavin-3′-O-gallate (purity > 90.0%), and theaflavin-3,3′-O-digallate (purity > 90.0%) were purchased from FUJIFILM Wako Pure Chemical Industries, Ltd. (Osaka, Japan). Caffeine (purity > 99.0%), dimethyl sulfoxide (DMSO), gallic acid (purity > 94.5%), isoquercitrin (purity > 90.0%), kaempferol (purity > 97.0%), myricetin (purity > 96.0%), rutin (purity > 94.0%), and quercetin (purity > 95.0%) were purchased from Sigma-Aldrich Co., LLC (St. Louis, MO, USA). Formic acid, mass-grade acetonitrile, HPLC-grade acetonitrile, and methanol were purchased from Thermo Fisher Scientific Inc. (Waltham, MA, USA). Water for HPLC was purchased from Burdick and Jackson (Muskegon, MI, USA). Other chemicals used in this study were of analytical reagent grade.

3.2. Instrumentation and Analytical Conditions

The analytic methods were modified from that of previously report [22]. An Alliance HPLC (Waters Corp.) equipped with a quaternary pump with a Poroshell 120 SB ODS column (120 Å, 2.7 μm, 4.6 × 150 mm; Agilent Technologies, Inc., Santa Clara, CA, USA) was used for separation. The flow rate was 0.8 mL/min, the column temperature was set to 30 °C, and the injection volume was 5 µL. Gradient elution was performed with 0.1% (v/v) formic acid in water (solvent A) and 0.1% (v/v) formic acid in acetonitrile (solvent B). Linear elution was performed as follows: 92% A/8% B at 0 min, 92% A/8% B at 2 min, 88% A/12% B at 3 min, 84% A/16% B at 4 min, 84% A/16% B at 12 min, 80% A/20% B at 15 min, 80% A/20% B at 18 min, 76% A/24% B at 22 min, 74% A/26% B at 32 min, 72% A/28% B at 35 min, 72% A/28% B at 43 min, 40% A/60% B at 46 min, 92% A/8% B at 47 min, and 92% A/8% B at 50 min. The eluent was divided by the Waters Isocratic Solvent Manager (ISM) into two detectors: four-fifths to the Waters 2996 UV detector and one-fifth to the ACQUITY QDa mass detector (Waters Corp.) using a 4:1 splitter (Figure 3). Thirty percent (v/v) of mass-grade acetonitrile in mass-grade water was combined with the inlet of the mass detector with a 0.16 mL/min flowrate using the ISM. Caffeine, flavan-3-ols, gallic acid, and theaflavins were monitored at 275 nm with a sampling rate of 2 points/s. Flavonols and flavones were detected at 365 nm with a sampling rate of 2 points/s. MS1 was performed using the following parameters: capillary voltage, 0.8 kV; probe temperature, 600 °C; electrospray ionization (ESI) source temperature, 120 °C; and desolvation nitrogen gas pressure, 90 psi. Cone voltages were allocated according to the chemical being analyzed: caffeine, 5 V; gallic acid and flavan-3-ols, 10 V; and others, 15 V. Single-ion recording was performed in positive mode for caffeine and negative mode for phenolics. Mass data acquisitions of phenolics and caffeine analyzed in this study were performed in a time window of ±1−±2.5 min on the basis of their tR (Table 3). All data were collected and processed using Empower 3 software (Waters Corp.).

3.3. Stock Solutions and Commercial Tea Sample Preparations

Fresh stock solutions (100 and 200 mg/L) containing 20 analyzed compounds (caffeine and 19 phenolics) were prepared by mixing 2000 mg/L of each compound in DMSO. Working solutions were obtained by dilution of stock solutions with aqueous methanol.
Five different teas were chosen for evaluation and quantification of various phenolics including flavan-3-ols, theaflavins, and flavonols. Tea samples were purchased online. The origins of tea samples used in this study were as follows: GTT (Lipton Mingjianqing pyramid teabag (product name); Unilever Taiwan Co., Taipei, Taiwan), GTK (Sejak loose tea (product name); AMOREPACIFIC Co., Seoul, South Korea), OTT (Dongbangmeiren loose tea (product name); Shun Jen Tea Co., Taipei, Taiwan), PTK (Heukcha loose tea (product name); AMOREPACIFIC Co.), and BTE (English breakfast tea bag (product name); Twining and Company Ltd., Andover, UK). Tea samples were ground using a Tubemill (IKA, Staufen, Germany) at 25,000 rpm for 1 min.
Extraction of teas for quantitative analysis of phenolics and caffeine was carried out using two solvents: aqueous methanol for maximal extraction of phenolics and hot water to simulate how consumers use teas. One hundred milligrams of ground tea was added to 10 mL of 60% (v/v) aqueous methanol, and this mixture was sonicated for 10 min. Thereafter, it was filtered through a 0.45 µm GHP syringe filter (Pall Corp., Port Washington, NY, USA). Filtered samples were diluted to 100 and 500 mg/L using absolute methanol for quantitative analysis. For water extraction, 100 mg of ground tea was poured into 10 mL of thermostat-heated (80 °C) mineral water and then agitated for 3 min with shaking (500 rpm). After hot water extraction, the extract was filtered through a 0.45 µm GHP syringe filter (Pall Corp.) and diluted to 500 and 1000 mg/L using water for quantitative analysis.

3.4. Method Validation

A mixed solution of 20 standards at a concentration of 0.5−1.0 mg/L was injected into the system 10 times to calculate LOD, LOQ, and system suitability. Validation of HPLC–UV and MS1 methods was performed with the acquisition of the same injection in terms of LOD, LOQ, range, linearity, intra-day precision, inter-day precision, and trueness. Overall method validation rules that are described in “Eurachem Guide: The Fitness for Purpose of Analytical Methods, 2nd Edition 2014” were followed.

3.5. Post-Data Processing by Python Algorithm and Statistical Analyses

To quantify compounds presented in standards and samples, we applied smoothing treatment of mass chromatography data using the mathematical mean method (level 7−9) by Empower 3 software (Waters Corp.). The two sets of results obtained from UV and MS1 were exported into a spreadsheet data by Empower 3 software (Waters Corp.). Unnecessary or unmatched UV detection data with a tR gap outside of the proper range (0.06−0.09 min) were rejected. The matching algorithm was coded using Python (Python Software Foundation; www.python.org, accessed on 1 April 2021) on the basis of the same injection identification (ID) as used for MS acquisition (Figure S4 and Supplementary Data II).
Data were expressed as mean ± SD on the basis of triplicates. One-way analysis of variance was performed using comparisons of all pairs by the Tukey–Kramer honestly significant difference test with the p-value set at <0.05 using JMP 13 for Windows 7 or newer versions (SAS Institute Inc., Cary, NC, USA).

4. Conclusions

A method comprising an HPLC–UV system coupled with an MS1 was cost-effectively developed and validated in this study for simultaneous, efficient, and relatively sensitive quantification of phenolics. The HPLC–UV–MS1 method can be used to analyze the phenolic composition of complex plant-based extracts, such as green tea and processed tea, with good reproducibility and high precision. The HPLC–UV–MS1 method showed twofold lower LOD than ordinary HPLC–UV, and validation results were excellent. The HPLC–UV system coupled with an MS1 and equipped with a core–shell column exhibited high specificity and validity with an economical operation cost. Moreover, less effort is required to operate this system than more sophisticated instruments, less handling and processing of data is required, and this method can be used at research and manufacturing sites that need more accurate quality control for green and processed tea products.

Supplementary Materials

The following are available online at https://0-www-mdpi-com.brum.beds.ac.uk/article/10.3390/separations8040045/s1, Figure S1: Mass spectrometry chromatograms of 19 phenolics and caffeine standards found in green tea and processed tea. Peaks are indi-cated listed as follows; 1, gallic acid; 2, (–)-gallocatechin; 3, (–)-epigallocatechin; 4, (–)-catechin; 5, caffeine; 6, (–)-epicatechin; 7, (–)-epigallocatechin gallate; 8, (–)-gallocatechin gallate; 9, (–)-epicatechin gallate; 10, rutin; 11, (–)-catechin gallate; 12, isoquer-citrin; 13, myricetin; 14, theaflavin; 15, quercetin; 16, theaflavin 3-O-gallate; 17, theaflavin-3′-O-gallate; 18, theafla-vin-3,3′-O-digallate; 19, apigenin; and 20, kaempferol. The concentration of standard aliquots was as follows: 10 µg/mL, peaks 5, 10, 12, 13, 15, 19, and 20; and 20 µg/mL, peaks 1–4, 6–9, 14, and 16–18, Figure S2: HPLC chromatograms at UV 275 nm (left panel) and UV 365 nm (right panel) of five commercial green teas and processed teas. Samples are listed as follows: (A), green tea of Taiwan; (B), green tea of Korea; (C), oolong tea of Taiwan; (D), post-fermented tea of Korea; and (E), black tea of England. All tea samples were made into a concentration of 500 µg/mL in 50% (v/v) aqueous methanol. Refer to Figure 1 for peaks and their corresponding chemical names. The peaks 15, 19, and 20 were not showed due to being below limit of quantification, Figure S3: Retention time difference between UV detection and MS detection. Chromatograms of the same an-alyte (black tea by full-fermentation: 500 mg/L of 60% (v/v) aqueous methanol, same injection ID) are depicted in (A) UV 275 nm and (B) single-ion recording of MS (m/z: 305.07). The vertical green lines indicate the reten-tion time of compounds in the MS corresponding to that of UV. Blue numbers are the gap of tR (min) calculated as follows: tR gap = tR (UV) – tR (MS1), Figure S4: Post-processing scheme for obtaining valid UV data, Table S1: Concentrations (mg/g) of phenolics and caffeine in commercial teas determined by an HPLC system equipped with a UV detector (manually processed), Table S2: Operation cost comparison of phenolic separation using HPLC-UV-MS and UPLC-MS/MS,

Author Contributions

Conceptualization, C.-S.R.; methodology, C.-S.R.; software, C.-S.R.; validation, C.-S.R.; formal analysis, C.-S.R.; investigation, C.-S.R. and Y.-M.C.; resources, C.-S.R.; data curation, Y.-M.C. and J.-C.K.; writing—original draft preparation, C.-S.R., Y.-M.C., and J.-C.K.; writing—review and editing, C.-S.R., and D.-O.K.; visualization, C.-S.R.; supervision, D.-O.K.; project administration, C.-S.R. All authors have read and agreed to the published version of the manuscript.

Funding

This research received no external funding.

Institutional Review Board Statement

Not applicable.

Informed Consent Statement

Not applicable.

Data Availability Statement

Original raw datasets (Supplementary Data II) are available online at https://data.mendeley.com/datasets/g7mnwgx6bh/1, accessed on 1 April 2021.

Conflicts of Interest

The authors declare no conflict of interest.

Abbreviations

BTEblack tea of England
C(−)-catechin
CG(−)-catechin gallate
DMSOdimethyl sulfoxide
EC(−)-epicatechin
ECG(−)-epicatechin gallate
EGC(−)-epigallocatechin
EGCG(−)-epigallocatechin gallate
ESIelectrospray ionization
GAgallic acid
GC(−)-gallocatechin
GCG(−)-gallocatechin gallate
GTKgreen tea of Korea
GTTgreen tea of Taiwan
HPLC–UV–MS1high-performance liquid chromatography−ultraviolet−single-quadrupole mass spectrometry
LODlimit of detection
LOQlimit of quantification
m/zmass-to-charge
OTToolong tea of Taiwan
PTKpost-fermented tea of Korea
QDaquadrupole Dalton-based
RSDrelative standard deviation
TFtheaflavin
TF3Gtheaflavin-3-O-gallate
TF3′Gtheaflavin-3′-O-gallate
TF3,3′DGtheaflavin-3,3′-O-digallate
tRretention time
UPLC-Q-TOF/MSultra-performance liquid chromatography–quadrupole time-of-flight mass spectrometry

References

  1. Hu, J.; Webster, D.; Cao, J.; Shao, A. The safety of green tea and green tea extract consumption in adults—Results of a systematic review. Regul. Toxicol. Pharmacol. 2018, 95, 412–433. [Google Scholar] [CrossRef] [PubMed]
  2. Lee, M.-K.; Kim, H.-W.; Lee, S.-H.; Kim, Y.J.; Asamenew, G.; Choi, J.; Lee, J.-W.; Jung, H.-A.; Yoo, S.M.; Kim, J.-B. Characterization of catechins, theaflavins, and flavonols by leaf processing step in green and black teas (Camellia sinensis) using UPLC-DAD-QToF/MS. Eur. Food Res. Technol. 2018, 245, 997–1010. [Google Scholar] [CrossRef] [Green Version]
  3. Zhao, C.N.; Tang, G.Y.; Cao, S.Y.; Xu, X.Y.; Gan, R.Y.; Liu, Q.; Mao, Q.Q.; Shang, A.; Li, H.B. Phenolic profiles and antioxidant activities of 30 tea infusions from green, black, oolong, white, yellow and dark teas. Antioxidants 2019, 8, 215. [Google Scholar] [CrossRef] [Green Version]
  4. Wolfram, S.; Wang, Y.; Thielecke, F. Anti-obesity effects of green tea: From bedside to bench. Mol. Nutr. Food Res. 2006, 50, 176–187. [Google Scholar] [CrossRef]
  5. Henning, S.M.; Niu, Y.; Lee, N.H.; Thames, G.D.; Minutti, R.R.; Wang, H.; Go, V.L.W.; Heber, D. Bioavailability and antioxidant activity of tea flavanols after consumption of green tea, black tea, or a green tea extract supplement. Am. J. Clin. Nutr. 2004, 80, 1558–1564. [Google Scholar] [CrossRef] [PubMed]
  6. Shin, C.M.; Lee, D.H.; Seo, A.Y.; Lee, H.J.; Kim, S.B.; Son, W.-C.; Kim, Y.K.; Lee, S.-J.; Park, S.-H.; Kim, N.; et al. Green tea extracts for the prevention of metachronous colorectal polyps among patients who underwent endoscopic removal of colorectal adenomas: A randomized clinical trial. Clin. Nutr. 2017, 37, 452–458. [Google Scholar] [CrossRef]
  7. Rha, C.-S.; Jeong, H.W.; Park, S.; Lee, S.; Jung, Y.S.; Kim, D.-O. Antioxidative, anti-inflammatory, and anticancer effects of purified flavonol glycosides and aglycones in green tea. Antioxidants 2019, 8, 278. [Google Scholar] [CrossRef] [PubMed] [Green Version]
  8. Zhang, Y.; Yu, Y.; Li, X.; Meguro, S.; Hayashi, S.; Katashima, M.; Yasumasu, T.; Wang, J.; Li, K. Effects of catechin-enriched green tea beverage on visceral fat loss in adults with a high proportion of visceral fat: A double-blind, placebo-controlled, randomized trial. J. Funct. Foods 2012, 4, 315–322. [Google Scholar] [CrossRef]
  9. Friedman, M. Overview of antibacterial, antitoxin, antiviral, and antifungal activities of tea flavonoids and teas. Mol. Nutr. Food Res. 2007, 51, 116–134. [Google Scholar] [CrossRef]
  10. Zhou, P.; Hu, O.; Fu, H.; Ouyang, L.; Gong, X.; Meng, P.; Wang, Z.; Dai, M.; Guo, X.; Wang, Y. UPLC-Q-TOF/MS-based untargeted metabolomics coupled with chemometrics approach for Tieguanyin tea with seasonal and year variations. Food Chem. 2019, 283, 73–82. [Google Scholar] [CrossRef]
  11. de Villiers, A.; Venter, P.; Pasch, H. Recent advances and trends in the liquid-chromatography-mass spectrometry analysis of flavonoids. J. Chromatogr. A 2016, 1430, 16–78. [Google Scholar] [CrossRef] [PubMed]
  12. Jiang, H.; Engelhardt, U.H.; Thräne, C.; Maiwald, B.; Stark, J. Determination of flavonol glycosides in green tea, oolong tea and black tea by UHPLC compared to HPLC. Food Chem. 2015, 183, 30–35. [Google Scholar] [CrossRef] [PubMed]
  13. Rha, C.-S.; Kim, S.-W.; Byoun, K.H.; Hong, Y.D.; Kim, D.-O. Simultaneous optimal production of flavonol aglycones and degalloylated catechins from green tea using a multi-function food-grade enzyme. Catalysts 2019, 9, 861. [Google Scholar] [CrossRef] [Green Version]
  14. Xu, J.; Hu, F.L.; Wang, W.; Wan, X.C.; Bao, G.H. Investigation on biochemical compositional changes during the microbial fermentation process of Fu brick tea by LC−MS based metabolomics. Food Chem. 2015, 186, 176–184. [Google Scholar] [CrossRef]
  15. Zhao, Y.; Chen, P.; Lin, L.; Harnly, J.M.; Yu, L.L.; Li, Z. Tentative identification, quantitation, and principal component analysis of green pu-erh, green, and white teas using UPLC/DAD/MS. Food Chem. 2011, 126, 1269–1277. [Google Scholar] [CrossRef] [Green Version]
  16. Liu, Z.; Bruins, M.E.; de Bruijn, W.J.C.; Vincken, J.-P. A comparison of the phenolic composition of old and young tea leaves reveals a decrease in flavanols and phenolic acids and an increase in flavonols upon tea leaf maturation. J. Food Compost. Anal. 2020, 86, 103385. [Google Scholar] [CrossRef]
  17. Tsujimura, M. On tea catechin isolated from green tea. Bull. Agric. Chem. Soc. Jpn. 1930, 6, 62–69. [Google Scholar] [CrossRef]
  18. Hoefler, A.C.; Coggon, P. Reversed-phase high-performance liquid chromatography of tea constituents. J. Chromatogr. A 1976, 129, 460–463. [Google Scholar] [CrossRef]
  19. Goto, T.; Yoshida, Y.; Kiso, M.; Nagashima, H. Simultaneous analysis of individual catechins and caffeine in green tea. J. Chromatogr. A 1996, 749, 295–299. [Google Scholar] [CrossRef]
  20. Šilarová, P.; Česlová, L.; Meloun, M. Fast gradient HPLC/MS separation of phenolics in green tea to monitor their degradation. Food Chem. 2017, 237, 471–480. [Google Scholar] [CrossRef]
  21. Mullard, G.; Allwood, J.W.; Weber, R.; Brown, M.; Begley, P.; Hollywood, K.A.; Jones, M.; Unwin, R.D.; Bishop, P.N.; Cooper, G.J.S.; et al. A new strategy for MS/MS data acquisition applying multiple data dependent experiments on Orbitrap mass spectrometers in non-targeted metabolomic applications. Metabolomics 2014, 11, 1068–1080. [Google Scholar] [CrossRef]
  22. Rha, C.-S.; Jung, Y.S.; Lee, J.-D.; Jang, D.; Kim, M.-S.; Lee, M.-S.; Hong, Y.D.; Kim, D.-O. Chemometric analysis of extracts and fractions from green, oxidized, and microbial fermented teas and their correlation to potential antioxidant and anticancer effects. Antioxidants 2020, 9, 1015. [Google Scholar] [CrossRef] [PubMed]
  23. Eidhammer, I.; Barsnes, H.; Eide, G.E.; Martens, L. Targeted quantification—Selected reaction monitoring. In Computational and Statistical Methods for Protein Quantification by Mass Spectrometry; John Wiley & Sons, Ltd.: Hoboken, NJ, USA, 2013; pp. 218–234. [Google Scholar] [CrossRef]
  24. Jang, D.; Jung, Y.S.; Kim, M.-S.; Oh, S.E.; Nam, T.G.; Kim, D.-O. Developing and validating a method for separating flavonoid isomers in common buckwheat sprouts using HPLC-PDA. Foods 2019, 8, 549. [Google Scholar] [CrossRef] [PubMed] [Green Version]
  25. Ye, Y.; Yan, J.; Cui, J.; Mao, S.; Li, M.; Liao, X.; Tong, H. Dynamic changes in amino acids, catechins, caffeine and gallic acid in green tea during withering. J. Food Compost. Anal. 2018, 66, 98–108. [Google Scholar] [CrossRef]
  26. Tao, W.; Zhou, Z.; Zhao, B.; Wei, T. Simultaneous determination of eight catechins and four theaflavins in green, black and oolong tea using new HPLC-MS-MS method. J. Pharm. Biomed. Anal. 2016, 131, 140–145. [Google Scholar] [CrossRef]
  27. Bae, I.K.; Ham, H.M.; Jeong, M.H.; Kim, D.H.; Kim, H.J. Simultaneous determination of 15 phenolic compounds and caffeine in teas and mate using RP-HPLC/UV detection: Method development and optimization of extraction process. Food Chem. 2015, 172, 469–475. [Google Scholar] [CrossRef]
  28. Spáčil, Z.; Nováková, L.; Solich, P. Comparison of positive and negative ion detection of tea catechins using tandem mass spectrometry and ultra high performance liquid chromatography. Food Chem. 2010, 123, 535–541. [Google Scholar] [CrossRef]
  29. Yang, X.R.; Ye, C.X.; Xu, J.K.; Jiang, Y.M. Simultaneous analysis of purine alkaloids and catechins in Camellia sinensis, Camellia ptilophylla and Camellia assamica var. kucha by HPLC. Food Chem. 2007, 100, 1132–1136. [Google Scholar] [CrossRef]
  30. Svoboda, P.; Vlckova, H.; Novakova, L. Development and validation of UHPLC-MS/MS method for determination of eight naturally occurring catechin derivatives in various tea samples and the role of matrix effects. J. Pharm. Biomed. Anal. 2015, 114, 62–70. [Google Scholar] [CrossRef] [PubMed]
  31. Verloop, A.J.W.; Gruppen, H.; Bisschop, R.; Vincken, J.-P. Altering the phenolics profile of a green tea leaves extract using exogenous oxidases. Food Chem. 2015, 196, 1197–1206. [Google Scholar] [CrossRef]
Figure 1. Structures of 19 phenolics and caffeine found in green tea and processed green tea. (A) Flavan-3-ols, (B) theaflavins, (C) phenolic acid, (D) alkaloid, and (E) flavonols and flavone. * Two chiral centers, located at the C2- and C3-position of the B ring of flavan-3-ols, denote a form of (−)-non-epimer (2S, 3R) compared to (−)-epimer (2R, 3R). Compound names are indicated as follows: GC, (–)-gallocatechin; EGC, (−)-epigallocatechin; C, (–)-catechin; EC, (–)-epicatechin; EGCG, (–)-epigallocatechin gallate; GCG, (–)-gallocatechin gallate; ECG, (–)-epicatechin gallate; CG, (–)-catechin gallate; TF, theaflavin; TF3G, theaflavin-3-O-gallate; TF3′G, theaflavin-3′-O-gallate; and TF3,3′DG, theaflavin-3,3′-O-digallate.
Separations 08 00045 g001
Figure 2. HPLC traces at wavelengths of (A) 275 nm and (B) 365 nm of 19 phenolics and caffeine standards found in green tea and processed teas. Peaks are indicated as follows: 1, gallic acid; 2, GC; 3, EGC; 4, C; 5, caffeine; 6, EC; 7, EGCG; 8, GCG; 9, ECG; 10, rutin; 11, CG; 12, isoquercitrin; 13, myricetin; 14, TF; 15, quercetin; 16, TF3G; 17, TF3′G; 18, TF3,3′DG; 19, apigenin; and 20, kaempferol. The concentrations of standard aliquots were as follows: 10 µg/mL, peaks 5, 10, 12, 13, 15, 19, and 20; and 20 µg/mL, peaks 1−4, 6−9, 14, and 16−18.
Separations 08 00045 g002
Figure 3. Diagram of an HPLC–UV system coupled to a single-quadrupole mass spectrometry (MS1) detector system. A, B, and C denote solvents used in the mobile phase of HPLC and the isocratic solvent manager (ISM). Green numbers 1 and 5 indicate mean input, while green numbers 2 and 4 indicate mean output of flow portions in the ISM.
Separations 08 00045 g003
Table 1. Method validation of UV detection versus mass detection.
Method aClass bCompound ctRd (min)LOD e
(μg/L)
LOQ f
(μg/L)
Linearity
(R g)
Trueness h
(Recovery% ± CI j)
Precision (RSD i; %)
Intra-Day kInter-Day l
UVPAGallic acid3.53 ± 0.015 ± 017 ± 00.999998.64 ± 0.360.462.31
F3LGC5.47 ± 0.06162 ± 12539 ± 390.999998.28 ± 0.240.392.63
F3LEGC7.36 ± 0.0420 ± 268 ± 60.999599.20 ± 0.360.592.97
F3LC8.03 ± 0.0536 ± 1120 ± 40.999899.27 ± 0.270.432.00
ALCaffeine8.58 ± 0.075 ± 116 ± 20.999999.13 ± 0.150.241.80
F3LEC9.62 ± 0.0826 ± 286 ± 80.999999.16 ± 0.260.422.20
F3LEGCG10.09 ± 0.0910 ± 132 ± 20.999998.80 ± 0.290.472.74
F3LGCG11.29 ± 0.1216 ± 252 ± 50.999999.65 ± 0.420.692.16
F3LECG17.10 ± 0.1817 ± 456 ± 130.999898.77 ± 0.410.662.31
FLRutin17.11 ± 0.2047 ± 2158 ± 90.999998.90 ± 0.500.821.99
F3LCG18.02 ± 0.1515 ± 248 ± 60.999898.36 ± 0.400.662.38
FLIsoquercitrin18.26 ± 0.1630 ± 799 ± 240.999999.31 ± 0.280.452.11
FLMyricetin24.12 ± 0.1518 ± 261 ± 50.999897.23 ± 0.220.362.26
TFTF31.82 ± 0.2422 ± 273 ± 50.999999.00 ± 0.250.413.00
FLQuercetin32.41 ± 0.2038 ± 1127 ± 50.999899.04 ± 0.140.242.49
TFTF3G35.03 ± 0.2732 ± 4107 ± 120.999998.84 ± 0.360.582.66
TFTF3′G36.98 ± 0.2426 ± 685 ± 190.999998.85 ± 0.270.442.43
TFTF3,3′DG37.56 ± 0.2422 ± 272 ± 80.999998.70 ± 0.350.582.18
FLApigenin41.63 ± 0.2461 ± 5201 ± 160.999999.16 ± 0.400.651.89
FLKaempferol42.99 ± 0.2557 ± 2191 ± 80.999798.43 ± 0.631.032.45
MS1PAGallic acid3.44 ± 0.025 ± 019 ± 10.998398.99 ± 0.300.492.1
F3LGC5.39 ± 0.0623 ± 175 ± 40.996889.99 ± 0.631.136.3
F3LEGC7.28 ± 0.045 ± 118 ± 20.9921110.89 ± 0.871.264.3
F3LC7.96 ± 0.056 ± 119 ± 10.994492.46 ± 3.015.2612.9
ALCaffeine8.51 ± 0.068 ± 126 ± 30.9985135.35 ± 0.961.1416.7
F3LEC9.55 ± 0.088 ± 126 ± 50.9968109.40 ± 0.190.285.3
F3LEGCG10.02 ± 0.099 ± 129 ± 30.998197.74 ± 0.440.7317.2
F3LGCG11.21 ± 0.128 ± 126 ± 40.997599.10 ± 0.460.748.4
F3LECG17.03 ± 0.1647 ± 9158 ± 300.9965102.90 ± 1.031.625.1
FLRutin17.04 ± 0.2011 ± 235 ± 60.9901104.03 ± 0.640.996.1
F3LCG17.94 ± 0.1519 ± 365 ± 100.9985106.77 ± 0.971.465.7
FLIsoquercitrin18.19 ± 0.157 ± 222 ± 50.9920112.64 ± 1.101.587.2
FLMyricetin24.05 ± 0.1511 ± 137 ± 50.9941119.39 ± 1.351.8324.6
TFTF31.74 ± 0.2317 ± 156 ± 30.9949104.39 ± 1.281.974.3
FLQuercetin32.34 ± 0.197 ± 124 ± 10.9922112.54 ± 1.301.866.8
TFTF3G34.96 ± 0.2646 ± 3154 ± 100.9994102.08 ± 1.292.042.7
TFTF3′G36.90 ± 0.2425 ± 183 ± 40.999498.56 ± 1.001.644.9
TFTF3,3′DG37.49 ± 0.2419 ± 265 ± 70.9992134.22 ± 1.221.4723.2
FLApigenin41.56 ± 0.244 ± 013 ± 10.971983.56 ± 1.462.8221.2
FLKaempferol42.93 ± 0.2512 ± 239 ± 70.9983125.85 ± 2.733.5019.5
a UV: ultraviolet, MS1: single mass spectrometer. b Abbreviations are listed as follows: AL; alkaloid; F3L, flavan-3-ol; FL, flavonol/flavone; PA, phenolic acid; TF, theaflavin. c Refer to the abbreviations of compounds in Figure 1. d tR: retention time. e LOD: limit of detection. f LOQ: limit of quantification. g R: correlation coefficient. h Trueness includes an accuracy term (n = 6). i RSD: relative standard deviation. j CI: confidence interval (95%). k Intra-day variation of analysis (n = 6). l Inter-day variation of analysis (n = 6 × 3 days).
Table 2. Concentrations (mg/g) of phenolics and caffeine in commercial teas as determined by an HPLC system equipped with a UV detector (processed by Python code).
Compound aTea Extract b
GTT
MeOH
GTT
Water
GTK
MeOH
GTK
Water
OTT
MeOH
OTT
Water
PTK
MeOH
PTK
Water
BTE
MeOH
BTE
Water
Gallic acid0.48 ± 0.07d c0.51 ± 0.01d0.28 ± 0.04d0.28 ± 0.02d1.95 ± 0.04c1.91 ± 0.10c5.00 ± 0.32a4.50 ± 0.09b1.72 ± 0.17c1.84 ± 0.06c
GCn.d. d3.43 ± 0.25an.d.1.76 ± 0.08bn.d.n.d.n.d.1.98 ± 0.22b #n.d.n.d.
EGC27.27 ± 2.20ab23.19 ± 0.04ab28.68 ± 1.90a22.06 ± 1.01b8.28 ± 5.67c3.22 ± 1.25d4.77 ± 0.55cd5.69 ± 1.19cd2.40 ± 1.22d3.00 ± 0.20d
Cn.d.n.d.n.d.n.d.n.d.<LOQ e2.64 ± 0.52bn.d.10.20 ± 2.79a8.83 ± 0.73a
Caffeine24.88 ± 0.93c19.74 ± 0.55e26.40 ± 1.68bc20.85 ± 0.56de31.95 ± 0.72a24.18 ± 0.54cd32.64 ± 2.16a29.49 ± 0.49ab26.61 ± 3.31bc23.50 ± 0.29cde
EC7.26 ± 0.63b6.54 ± 0.10b9.81 ± 0.49a7.86 ± 0.19b3.71 ± 0.78c1.64 ± 0.60d1.60 ± 0.30d1.61 ± 1.31d3.54 ± 1.49c1.79 ± 0.30d
EGCG61.20 ± 0.36a22.80 ± 2.15b63.17 ± 4.14a15.35 ± 4.65c12.12 ± 0.52c1.94 ± 0.17d0.35 ± 0.02d #n.d.2.80 ± 0.49dn.d.
GCG<LOQ<LOQn.d.n.d.n.d.n.d.n.d.n.d.n.d.n.d.
ECG15.51 ± 0.26a3.35 ± 0.59bc #13.92 ± 1.16an.d.5.83 ± 0.00b #<LOQn.d.n.d.4.78 ± 0.14b #n.d.
Rutin1.87 ± 0.08a1.51 ± 0.04an.d.n.d.0.86 ± 0.09b0.68 ± 0.06bn.d.n.d.1.83 ± 0.43a1.77 ± 0.06a
Isoquercitrin0.92 ± 0.12b0.72 ± 0.03bc #n.d.n.d.0.35 ± 0.01cd #0.24 ± 0.06dn.d.n.d.1.22 ± 0.22a1.06 ± 0.10ab #
TFn.d.n.d.n.d.n.d.0.73 ± 0.05bn.d.n.d.n.d.2.63 ± 0.39an.d.
TF3Gn.d.n.d.n.d.n.d.1.65 ± 0.04bn.d.n.d.n.d.5.04 ± 1.15an.d.
TF3′Gn.d.n.d.n.d.n.d.0.61 ± 0.00bn.d.n.d.n.d.1.97 ± 0.39an.d.
TF3,3′DGn.d.n.d.n.d.n.d.1.23 ± 0.44bn.d.n.d.n.d.2.83 ± 0.90an.d.
Apigenin<LOQn.d.n.d.n.d.<LOQn.d.n.d.n.d.n.d.n.d.
a Compounds are listed in ascending order of retention time. Some compounds (CG, quercetin, and kaempferol) were not detected by UV. b Abbreviations: GTT, green tea of Taiwan; GTK, green tea of Korea; OTT, oolong tea of Taiwan; PTK, post-fermented tea of Korea; BTE, black tea of England. MeOH: 60% (v/v) aqueous methanol, Water: 80 °C hot water. c Results are shown as means ± standard deviations (n = 3−6; # marked results indicate n = 2). Different letters in the same row indicate significant differences according to the Tukey–Kramer honestly significant difference test (p < 0.05). d n.d.: not detected. e <LOQ: below limit of quantification.
Table 3. Parameters of 19 phenolic and caffeine compounds obtained using UV and MS1 methods.
ClassCompoundUV MS1
tRa
(min)
Wavelength
(nm)
tR
(min)
SIR b Window
(min)
m/z
(Polarity c)
Cone Voltage
(V)
PAGallic acid3.53275 3.442.5−4.5169.02 (−)10
F3LGC5.47275 5.394.5−8.0305.07 (−)10
F3LEGC7.36275 7.284.5−8.0305.07 (−)10
F3LC8.03275 7.967.0−10.5289.08 (−)10
ALCaffeine8.58275 8.515.0−10.0195.08 (+)5
F3LEC9.62275 9.557.0−10.5289.08 (−)10
F3LEGCG10.09275 10.029.0−12.0457.08 (−)10
F3LGCG11.29275 11.219.0−12.0457.08 (−)10
F3LECG17.10275 17.0316.0−19.0441.09 (−)10
FLRutin17.11365 17.0416.0−18.0609.15 (−)15
F3LCG18.02275 17.9416.0−19.0441.09 (−)10
FLIsoquercitrin18.26365 18.1917.0−19.0463.10 (−)15
FLMyricetin24.12365 24.0523.0−25.0317.04 (−)15
TFTF31.82275 31.7430.5−33.0563.13 (−)15
FLQuercetin32.41365 32.3431.0−33.5301.04 (−)15
TFTF3G35.03275 34.9633.5−38.0715.14 (−)15
TFTF3′G36.98275 36.9033.5−38.0715.14 (−)15
TFTF3,3′DG37.56275 37.4936.0−38.5867.15 (−)15
FLApigenin41.63365 41.5640.5−43.0269.05 (−)15
FLKaempferol42.99365 42.9342.0−45.0285.05 (−)15
a Retention time (tR) was determined by averaging values (n = 10). b Single-ion recording (SIR) was accomplished within the time zone of each compound to acquire a valid sampling rate. c Positive (+) and negative (−) polarities were set according to the characteristics of each compound.
Publisher’s Note: MDPI stays neutral with regard to jurisdictional claims in published maps and institutional affiliations.

