
GC Analysis of Seven Seed Oils Containing Conjugated Fatty Acids


U.S. Department of Agriculture, Agricultural Research Service, Beltsville Human Nutrition Research Center, Methods and Application of Food Composition Lab, 10300 Baltimore Ave, Beltsville, MD 20705, USA
*
Author to whom correspondence should be addressed.
Separations 2021, 8(4), 51; https://0-doi-org.brum.beds.ac.uk/10.3390/separations8040051
Submission received: 1 February 2021
/
Revised: 30 March 2021
/
Accepted: 14 April 2021
/
Published: 15 April 2021
Abstract
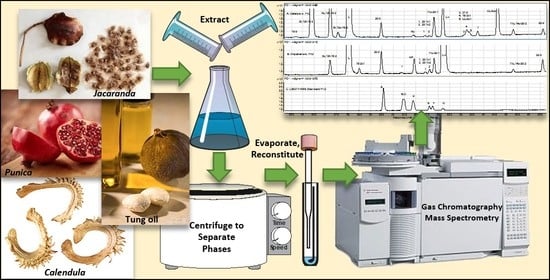
:The fatty acid compositions, including isomer compositions, of seven seed oils containing conjugated fatty acids (CFA) were determined. Seed oils were extracted using a modified Folch extraction, converted to fatty acid methyl esters, and analyzed by gas chromatography (GC) with mass spectrometry and flame ionization detection. The MS detector was operated in positive-ion chemical ionization mode using methane reagent gas. GC was performed using two columns providing different retention characteristics: a poly(ethylene glycol) column and a more polar biscyanopropyl column. The complimentary information provided by the two columns was crucial to peak identification in several cases. The major CFA species in the samples are well known but all contained lesser amounts of additional CFA that have not been widely reported. All samples contained multiple species of conjugated linolenic acid, and two samples also contained small amounts of conjugated linoleic acid. The seed oils of Jacaranda mimosifolia and Calendula officinalis were found to contain 8c,10t,12t-18:3, the natural occurrence of which has only been recently reported in some other samples. The seed oil of Impatiens balsamina has been reported to contain four conjugated 18:4 species, and we present evidence for a fifth conjugated 18:4 isomer.
1. Introduction
Conjugated fatty acids (CFA) are polyunsaturated fatty acids (PUFA) with two or more carbon-carbon double bonds that are separated by a carbon–carbon single bond. CFA usually include a mixture of cis (c) and trans (t) double bonds. Examples include rumenic acid, 9c,11t-18:2, an isomer of linoleic acid (L), 9c,12c-18:2, and α-eleostearic acid, 9c,11t,13t-18:3, an isomer of α-linolenic acid (Ln), 9c,12c,15c-18:3. Examples of CFA are known with conjugation across two, three, and four carbon–carbon double bonds. There are also examples of CFA having additional, non-conjugated carbon–carbon double bonds, such as rumelenic acid, 9c,11t,15c-18:3. Diconjugated FA are often referred to as conjugated linoleic acids (CLA), and triconjugated FA are often referred to as conjugated linolenic acids (CLNA). Following this pattern, we refer to tetraconjugated FA as conjugated stearidonic acids (CSDA), after stearidonic acid, 6c,9c,12c,15c-18:4.
In comparison with their corresponding non-conjugated isomers, CFA exhibit differences in their physical, chemical, and biological properties. For example, they exhibit characteristic UV absorption bands [1], have greater susceptibility to oxidation [2,3,4,5] and isomerization [4,6,7], and there is evidence that they have anti-carcinogenic and other health-related properties [8]. CLA occur mainly in animal sources, and there is dietary exposure through consumption of meat and dairy foods [9]. However, CLA are usually present as only a small percentage of the total FA content in such foods. CLNA and CSDA are found in plant sources, and they can be present as a high percentage of total FA content. For example, punicic acid, 9c,11t,13c-18:3, can occur in over 70% of the total FA content in the oil of pomegranate (Punica granatum) seeds [10,11]. Mostly, however, CLNA and CSDA occur in plant sources that are not commonly used as food. Pomegranate is an exception, though consumption of punicic acid depends upon ingestion of the seeds and not just the arils. There have been some efforts at transgenic incorporation of CFA into food sources, though with limited success [12].
The susceptibility of CFA to oxidation and isomerization is an important consideration in their chemical analysis. In the preparation of the fatty acid methyl esters (FAME) of CFA, a common approach for analysis is gas chromatography (GC), where the choices of methylating reagent, temperature, and time of reaction are relevant factors. Basic reagents such as NaOCH3 and tetramethylguanidine (TMG) are recognized as preserving the endogenous distributions of CFA when present as triacylglycerols (TAG) and in some other forms, but they are not effective in converting FA to FAME in all types of lipids [7,13,14]. Acidic reagents such as methanolic HCl, H2SO4, and BF3 are more broadly applicable for conversion of FA to FAME, but they are known to cause isomerization of CFA to a degree that depends on the temperature and time of the reaction [6,7,13,14,15]. Extensive isomerization, including migration of double bonds, can occur under sufficiently harsh conditions. Under milder conditions, geometric isomerization may still occur, especially the conversion of cis double bonds of CFA to the more stable trans forms. At sufficiently short reaction times and low temperatures, isomerization may be avoided, but there is a tendency toward incomplete conversion of FA to FAME. Another potential problem with the use of acidic methylating reagents for CLA analysis is the production of artifacts, particularly the formation of allylic methoxy species [15].
Many plant sources of CLNA are known to contain a single, predominant CLNA species, as in the case of Punica granatum and punicic acid. Tung oil from the seeds of the tung tree, Vernicia fordii, is an example of a plant source having two prominent CLNA isomers, α-eleostearic acid (9c,11t, 13t-18:3) and β-eleostearic acid (9t,11t,13t-18:3) [16]. Several published reports have noted the presence of minor amounts of additional CLNA isomers in samples with a single, predominant isomer [10,11,16]. Seven naturally occurring CLNA are well known in plant sources, and their configurations and common names are given in Table 1. There is a recent report of four additional CLNA (10t,12t,14t-18:3, 11t,13t,15c-18:3, 11t,13t,15t-18:3, and 8c,10t,12t-18:3) occurring at low levels in melon and other fruit seed samples [17]. FA with conjugation across the 5, 7, 9 positions have been reported for some red seaweed species [18]. To our knowledge, there have been no reports of naturally occurring CLNA species of configuration ccc, cct, tcc, or tct. Two naturally occurring CSDA isomers, α-parinaric acid and β-parinaric acid, are well known [13], and these are also listed in Table 1.
In this work, we report the FA composition, excluding oxygenated FA, of seven CFA-containing seed oil samples. Lipids were extracted from seeds of Jacaranda mimosifolia, Punica granatum, Momordica charantia, Impatiens balsamina, Calendula officinalis, and Catalpa ovata. A sample of tung oil was also purchased and analyzed. FA in seeds are predominately in the form of triacylglycerols (TAG) stored in the seed oil bodies [19]. Oil samples were treated with a methanolic base for the conversion of FA to FAME and analyzed by GC-FID and GC-MS using positive ion chemical ionization with methane as the reagent gas (PCI-CH4). PCI-CH4 is useful in analysis of FAME because it provides characteristic ions indicative of molecular weight, although it provides limited structural information and is of limited help in distinguishing between isomers [20]. Ions characteristic of molecular weights observed for FAME by PCI-CH4 included [M + H]+, [M − H]+, [M + 29]+, [M + 41]+, [M + H − 32]+, and [M + H − 50]+, though which of these were prominent varied. For a given FAME and its isomers, three to five of these ions were typically prominent, depending on the FAME. For example, for the 18:0 FAME and most other saturated FAME, [M + H]+, [M − H]+, and [M + 29]+ were especially prominent ions. For the FAME of 18:1 isomers, [M + H]+, [M + 29]+, [M + H − 32]+, and [M + H − 50]+ were prominent.
Samples were run on two GC columns with differences in FAME retention properties that were helpful in confirming the identities of some peaks. One was a column with a poly(ethylene glycol) stationary phase. Such columns separate FAME according to carbon number and degree of unsaturation but do not separate monoenoic cis and trans isomers [21]. The other was a column with a more polar biscyanopropyl stationary phase that is effective at separation of monoenoic cis and trans isomers [21]. Relative performance with regard to isomers of PUFA is more complex, but there are definite retention differences on the two columns.
Analyzing the seven seed oil samples together in a single study was beneficial in that the major CFA in each sample being known, they effectively served as standards that were helpful in identifying minor CFA peaks in the other samples. Similarly, the identification or partial identification of certain other peaks was helped by comparison among the samples, as later described for specific cases.
2. Materials and Methods
Samples. Tung oil was obtained from Sigma-Aldrich (St. Louis, MO, USA). Catalpa ovata, Calendula officinalis, Punica granatum, and Jacaranda mimosifolia seeds were obtained from Sheffield’s Seed Co., Inc. (Locke, NY, USA). Momordica charantia (hybrid Gori) seeds were obtained from Seeds of India (Marlboro, NJ, USA). Impatiens balsamina seeds were obtained from Outsidepride.com (Independence, OR, USA).
Reagents and Solvents. Optima™ Grade Methanol and certified A.C.S. grade petroleum ether were from Fisher Scientific (Fair Lawn, NJ, USA). Chloroform and isooctane were HPLC grade from Sigma-Aldrich (St. Louis, MO, USA). Deionized water was from an in-house Millipore (Bedford, MA, USA) Milli-Q Water Purification System.
Sodium hydroxide and potassium hydroxide (Aldrich Chemical Company, Milwaukee, WI, USA), sodium chloride (Sigma Chemical Company, St. Louis, MO, USA), potassium bicarbonate and sodium nitrite (Sigma-Aldrich), and potassium chloride (Fisher Scientific) were all reagent grade. Nitric acid was J.T. Baker Ultrex. 3 N methanolic HCl and 0.5 N methanolic base (sodium metal in methanol/NaOCH3) were from Supelco (Bellefonte, PA, USA).
Extraction of Lipids from Seed Samples. Seeds were used as received and were ground in an electric grinder (Smart Grind, Black & Decker, Towson, MD, USA). Lipid extractions were based on the method of Folch et al. [22] Ground seed samples (250 mg to 1 g) were placed in 25 mL or 50 mL glass screw top tubes with Teflon-lined caps. Extraction with 2:1 chloroform:methanol was conducted in two stages and with a combined solvent to sample ratio (mL/g) of 30:1 rather than the single stage 20:1 ratio specified by Folch et al. [22] In the first stage, half the total solvent amount was added to the tube containing the seed sample, along with a magnetic stir bar. Samples were stirred, with periodic vortexing, for 20 min. Samples were then centrifuged at 1000 rpm for 2 min, and the supernatant was collected using a Pasteur pipet. The supernatant was washed with a 0.2× volume of 0.9% KCl. Phase separation was aided by centrifugation (1000 rpm for 2 min), and the lower chloroform layer was collected. The extraction and washing procedure was then repeated on the sample but with a stirring and vortexing period of 10 min. The two washed chloroform portions were combined, and solvent was evaporated to constant mass at room temperature under a stream of nitrogen gas, leaving a final, oily residue. Lipid residue yields ranged from 14% (Catalpa o. and Calendula o.) to 24% (Momordica c.). Residues were reconstituted with isooctane and stored in a −20 °C freezer when not used immediately.
Derivatization Procedures. Two base treatments and one acid treatment were used for conversion of FA to FAME. Base treatment 1 was used routinely. Base treatment 2 and the acid treatment were used in the specific cases later mentioned. Unless otherwise noted, sample sizes were 20 to 25 mg of residue or oil.
Base Treatment 1 [23]. 1 mL of 0.5N NaOCH3 in methanol was added to each sample. Samples were vortexed and placed in a heating block at 50 °C for 15 min. After a brief cooling period, 1.5 mL of isooctane were added. Samples were vortexed, and then 4 mL of saturated aqueous NaCl solution were added. Samples were again vortexed, and the isooctane layer was collected using a Pasteur pipet. A second extraction using 1.5 mL of isooctane was then performed, and the resulting isooctane layer was combined with that from the first extraction. A washing step using 2 mL of 2% KHCO3 was then performed, giving the final isooctane extract used for GC analysis.
Base Treatment 2 [23]. 0.5 g of oil was mixed with 4 mL of petroleum ether and 1 mL of 2 M KOH in methanol. Samples were vortexed for 30 s and left to settle at room temperature for 30 min. The petroleum ether layer was collected using a Pasteur pipet.
Acid Treatment [23]. 1.5 mL of methanol and 1 mL of 3N HCl in methanol were added to each sample. Samples were then vortexed and placed in a heating block at 50 °C for 1 h. Extraction with isooctane was performed as described for base treatment 1.
GC Standards. Multi-component FAME standards GLC 68B (16 FAME from C14 to C24) and GLC 463 (52 FAME from C4 to C24) were obtained from Nu-Check Prep (Elysian, MN, USA). CLA standards UC-59M and UC-61M were also obtained from Nu-Check Prep, as was methyl tricosanoate. Methyl pentacosanoate was obtained from Santa Cruz Biotechnology, Inc. (Dallas, TX, USA). Methyl hexacosanoate was obtained from Matreya LLC (Pleasant Gap, PA, USA). The methyl ester of 7c-18:1 was obtained from Larodan (Solna, Sweden). Standard L6031, containing the FAME of the eight geometrical isomers of 9,12,15-18:3, was obtained from Sigma-Aldrich. Standards were prepared as isooctane solutions at total FAME concentrations ranging from 0.2 mg/mL to 2 mg/mL.
In lieu of a commercial standard, a published procedure was adapted to produce the geometric isomers of linoleic acid (9c,12c-18:2) [24]. A commercial corn oil sample with L at about 70% of FA content was first treated with methanolic KOH, as described above for base treatment 2, to convert FA to FAME. The recovered petroleum ether was evaporated under N2 to yield the neat FAME oil (0.47 g recovered). To the FAME oil were added 2 drops of 6 M nitric acid and 0.2 mL of 2 M sodium nitrite. The sample was held at 40 °C for 10 min., after which 2 mL of deionized water and 2 mL heptane were added. After vortexing and settling, the heptane portion was recovered. A second extraction with 2 mL of heptane was performed, and the resulting heptane portion was combined with the first one. Further dilution with heptane was carried out to give an appropriate GC signal level. Additionally, using base treatment 2 for conversion of FA to FAME, a small amount of trans-18:2 isomers was observed for the presumably deodorized corn oil as received. The observed distribution was 0.02%, 0.28%, 0.21%, 99.5% for the tt, ct, tc, and cc isomers, respectively. For the isomerized oil, the observed distribution was 7%, 20%, 20%, 53%.
Gas Chromatography and Mass Spectrometry. Two GC systems were used. One system was equipped with a single FID detector, and one with the effluent split between a mass selective detector (MSD) and an FID.
GC and GC-MS Apparatus
The GC-FID system was an Agilent Technologies (Santa Clara, CA, USA) 6890N GC with G2613A injector, split/splitless inlet, flame ionization detector (FID) and using OpenLabs CDS ChemStation Edition for GC Systems (Rev. C.01.05) software. The GC-MS instrument was an Agilent Technologies 5975C Inert XL EI/CI MSD with a 7890A GC System and G4513A injector, split/splitless inlet, G3180B two-way splitter with makeup gas, auxiliary FID, and using MassHunter GC/MS Acquisition software (version B.07.00 SP1.1549).
6890N GC-FID Method
The column for GC-FID was a Supelco (Bellefonte, PA, USA) SP-2560 (100 m × 0.25 mm × 0.2 µm film thickness) using hydrogen as the carrier gas with operation in constant flow mode at 1.3 mL/min. For the FID, the total hydrogen flow was set at 35 mL/min, air flow at 350 mL/min, and make-up gas (N2) flow at 25 mL/min. Experiments were conducted in split mode with a 100:1 split. The inlet temperature was 250 °C, and the FID temperature was 260 °C. The temperature program was as follows: initially 70 °C, then a gradient of 7.8 °C/min to 130 °C, followed by a gradient of 3.1 °C/min to 189 °C with a 2 min hold, then a gradient of 1.6 °C/min to 200 °C, and finally a gradient of 3.2 °C/min to 230 °C, with a 22 min hold. The run time was 67 min, and 1 µL was injected.
5975C/7890A GC-MSD-FID Methods
Method 1. The first column used for GC-MS/FID was also a Supelco SP-2560 (100 m × 0.25 mm × 0.2 µm film thickness) using helium as the carrier gas operated in constant flow mode at 1 mL/min. As above, the total hydrogen flow for the FID was set at 35 mL/min, air flow at 350 mL/min, and make-up gas (N2) flow at 25 mL/min. GC-MS/FID experiments were conducted in split mode with a 50:1 split. The inlet temperature was 250 °C, and the FID temperature was 260 °C. The temperature program started with an initial temperature of 70 °C, with a temperature gradient of 5 °C/min to 130 °C, then a gradient of 2 °C/min to 180 °C and a gradient of 1 °C/min to 196 °C, and finally a gradient of 2 °C/min to 230 °C with 30 min hold. The MSD was operated in a positive chemical ionization mode with methane reagent gas (PCI-CH4). The scan range was from m/z 50 to m/z 450 at 1.9 Hz.
Method 2. The second column used for GC-MS/FID was a Supelco Omegawax 250 (30 m × 0.25 mm × 0.25 µm film thickness) with helium carrier gas in constant flow mode at 1 mL/min. The inlet temperature was 250 °C, and the FID temperature was 270 °C. The FID again used hydrogen flow at 35 mL/min, air flow at 350 mL/min, and make-up gas (N2) flow at 25 mL/min. Operation was in split mode at 50:1 split, and 1 µL was injected. The temperature program had an initial temperature of 70 °C, a temperature gradient of 10 °C/min to 170 °C, and then a gradient of 1 °C/min to 250 °C, with 1 min hold. The run time was 91 min. The MSD was operated in PCICH4 mode, with scans from m/z 50 to m/z 450 at 0.9 Hz.
Calculations. FID peaks were manually integrated within the Agilent Chemstation data analysis software, and retention time versus peak area data were transferred to an Excel spreadsheet for further analysis. FAME mass percentages were obtained directly, and these were converted to mole percentages. Molar response factors based on the FID responses of the FAME of the GLC 68B standard were applied to the mole percentages. The corrected molar percentages were used for construction of Table 2. The data in Table 3, Table 4, Table 5, Table 6 and Table 7 are from the individual isomer percentages of the relevant total isomer peak area.
3. Results and Discussion
Figure 1 shows portions of FID chromatograms obtained using the SP-2560 column that include the major FAME peaks obtained for the seven CLNA-containing samples. From top to bottom, the samples are Jacaranda m., Punica g., Momordica c., Impatiens b., Vernicia f. (tung oil), Calendula o., and Catalpa o. The order follows the retention time (RT) order of the most abundant CLNA FAME for each sample. The methyl ester of jacaric acid is the earliest eluting of these, at about 74 min. It is followed in order by the FAME of punicic acid, α-eleostearic acid (the major CLNA species found in Momordica c. and Impatiens b. seeds and in tung oil), α-calendic acid, and catalpic acid. Tung oil (Figure 1E) has a second prominent CLNA species, β-eleostearic acid, with FAME RT a little longer than that of the catalpic acid FAME. Another CLNA, β-calendic acid, known to occur in Calendula o. (16), has FAME RT a little past that of the FAME of β-eleostearic acid, but the peak is too small to see in Figure 1F. Considering the cis/trans configurations of the three conjugated double bonds of each isomer, the retention order on the SP-2560 column can be described as ctc < ctt < ttc < ttt. The retention order of 8,10,12 versus 9,11,13 is not consistent. For ctc and ttc, the 8,10,12 isomer has an earlier RT than the 9,11,13 isomer, but the opposite is observed for the ttt isomers.
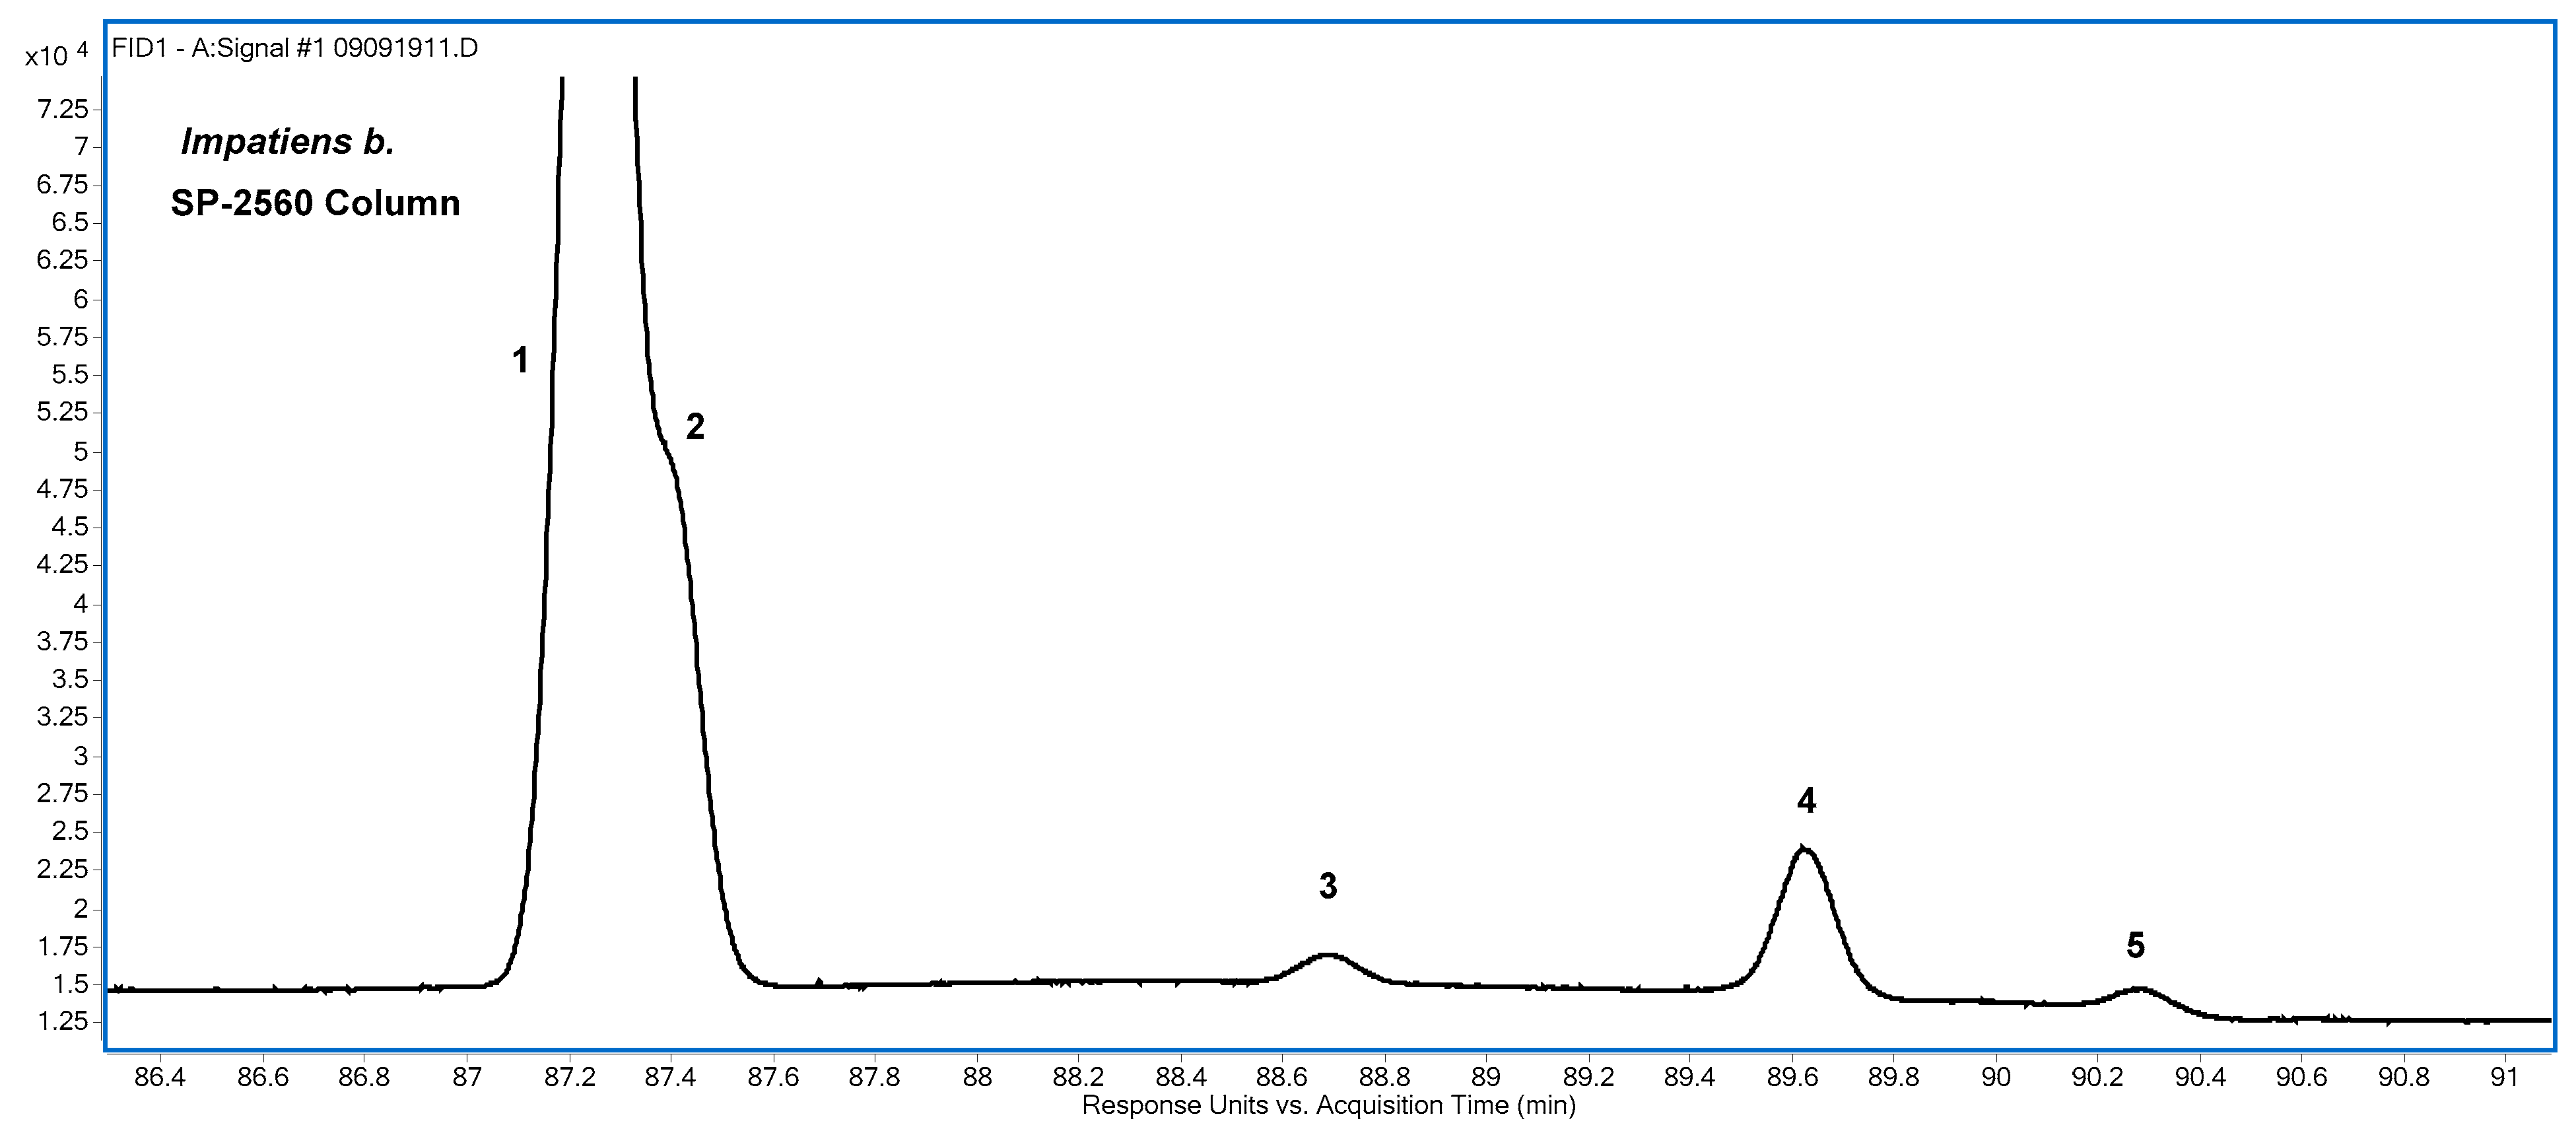
For five of the seven samples, the dominant CLNA FAME is the most prominent peak in the FID chromatograms. For Jacaranda m. (Figure 1A), the peak for the linoleic acid FAME is slightly larger than that for jacaric acid. For Impatiens b. (Figure 1D), the α-linolenic acid FAME is the most prominent peak, and there is only a small peak for the α-eleostearic acid FAME. Impatiens species are known to contain the conjugated 18:4 FA isomers α-parinaric acid and β-parinaric acid (Table 1). In Figure 1D, the peak for the FAME of α-parinaric is seen at about 87 min. Six species of FA, including isomers, account for almost all the obvious peaks in the chromatograms in Figure 1. These are: 16:0, 18:0, 18:1, 18:2, 18:3, and 18:4.
Table 2 provides a more detailed look at the FA distributions found for each sample and includes relative abundances for species found down to 0.01%. Relative quantitation was performed on FID chromatograms obtained using the SP-2560 column. Results obtained using the Omegawax column were examined as needed for help in resolving uncertainty about peak identification. Only FID peaks that were present at ≥0.01% and with identification supported by MS (peaks observed in extracted ion chromatograms (EIC) using the ions characteristic of molecular weight, established from the mass spectrum of known FAME, and with matching confirmed by examination of extracted peak mass spectra), or that matched the RT on both columns with a peak identified in another sample, were used in constructing the table. Isomers are grouped together in Table 2, so, e.g., the entries for 18:3 include the sum of the area percentages for all 18:3 species found (Ln and all other non-conjugated 18:3 plus all CLNA).
A small amount of methyl laurate (12:0) was found for Punica g., but no FAME smaller than 14:0 was confirmed for any other sample. The FAME of the odd-carbon FA 15:0, 17:0, and 23:0 were found in small amounts for all samples, but 19:0, 21:0, and 25:0 were not uniformly detected. The FAME of palmitic acid (16:0) was prominent for all samples. The FAME of a single 16:1 isomer, palmitoleic acid (9c-16:1), was observed for all samples except Momordica c. No other 16:1 isomers were confirmed.
In total, the FAME of 18-carbon FA accounted for over 90% of the integrated signal for all samples. The lowest 18-carbon FA content was found for Impatiens b., at 91.85%. The others ranged from 94.77% (Calendula o.) to 97.52% (Momordica c.). The 18:3 isomers were, in total, the most abundant 18-carbon FA for all samples except for Jacaranda m., for which the total 18:2 isomers were more abundant. For Catalpa o., the total of 18:2 isomers was only slightly less than the 18:3 total, and for Impatiens b., the total of 18:4 isomers was only slightly less than the 18:3 total. Momordica c. was found to contain 30% of stearic acid (S; 18:0), which was much higher than for any of the other samples. Total 18:1 isomers ranged from 1.71% for Momordica c. to 15.78% for Impatiens b. The total 18:4 content for Impatiens b. was found to be 27.5% of its total FA content. The presence of 18:4 was not confirmed for any other sample. The isomer distributions for 18:1, 18:2, 18:3, and 18:4 are discussed in more detail below. The total of FAME found for FA greater than 18 carbons ranged from about 0.5% for Impatiens b. to about 1.3% for Jacaranda m. and tung oil. Of these longer FA, only two unsaturated species were observed: 20:1 (11c-20:1 and smaller amounts of two other isomers), found in all samples, and 20:2 (a single isomer, 11c,14c-20:2), found in all except Momordica c. FAME of 20:0, 22:0, and 24:0 were found in all samples. Small amounts of the FAME for 26:0 were found for Punica g., Jacaranda m., Catalpa o., and Impatiens b. Fame of any FA larger than 26:0 were not confirmed for any sample.
3.1. 18:1. Isomers
As indicated in Table 3, oleic acid (9c-18:1) was by far the most abundant 18:1 isomer found for all samples, and cis-vaccenic acid (11c-18:1) was the second most abundant. A small amount of a third isomer, designated 18:1x1, was also found for all samples. Three other 18:1 isomers, 9t, 11t, and 6c, are listed in Table 3 because they are present in the GLC 463 standard, but none of the three were confirmed for any of the samples. On the SP-2560 column, the 18:1x1 isomer eluted at a position between the 9t- and 11t-18:1 isomers, as shown in Figure 2. With 100 m 100% cyanopropyl polysiloxane columns, it is possible to separate most of the trans-18:1 isomers, and the position of 18:1x1 in Figure 2 is consistent with what was observed for 10t-18:1 by Kramer, et al. [25,26]. The 18:1x1 peak was not observed with the Omegawax column, presumably due to overlap with 9c- or 11c-18:1.
3.2. 18:2. Isomers
Table 4 gives the 18:2 isomer distribution as a percentage of the total integrated 18:2 FID signal for each sample. Linoleic acid was the major isomer for all, but several of the samples had other prominent 18:2 isomers. A total of seven 18:2 isomers were found. The commercial standards used contained L (in both GLC 68B and GLC 463) and 9t,12t-18:2 (in GLC 463). The isomerized corn oil sample described above established the RT of the two other 9,12-18:2 isomers. The elution order of the geometric L isomers on highly polar cyanopropyl columns such as SP-2560 (USP G5 phases) is known to be tt < ct < tc < cc [24,27].
Six 18:2 isomers were observed in Catalpa o., and Figure 3A shows the relevant portion of its FID chromatogram on the SP-2560 column. About 27% of its 18:2 content was found to be 9t,12t. This isomer was not observed for any of the other samples. Two 18:2 isomers of Catalpa o. matched the retention times of the ct- and tc-9,12-18:2 isomers of the isomerized corn oil sample. The matches were also observed on the Omegawax column, and it is assumed these isomers are 9c,12t and 9t,12c. The 9c,12t isomer was found in all samples and was present at about 10% of total 18:2 signal for Momordica c. and tung oil. The 9t,12c isomer was found only in Catalpa o.
Another isomer, designated 18:2x1, was found only in Impatiens b. It eluted a short time after L on the SP-2560 column (Figure 3B). On the Omegawax column it also eluted shortly after L (Figure 4B), although the overall elution order of the 18:2 isomers was different on the two columns. For Catalpa o. on the Omegawax column (Figure 4A), 9t,12t and 9c,12t elute just after L and cannot be distinguished from each other by RT. The coelution of these two isomers on the Omegwax column was confirmed using the isomerized corn oil sample. The position of 9c,12t can be clearly seen for Impatiens b., for which 9t,12t is not present, in Figure 4B. 9t,12c elutes after 9c,12t on both columns (Figure 3A and Figure 4A), and it has the same RT as 18:2x1 of Impatiens b. on the Omegawax column (Figure 4A,B). However, the RT of the four 9,12-18:2 geometric isomers having all been established, 18:2x1 must be an 18:2 positional isomer.
The other two unknown 18:2 isomers elute after α-Ln on both columns, suggesting that they are conjugated 18:2 species. They are given the designations CLAx1 and CLAx2 in Table 4 and Figure 3 and Figure 4. Both CLA isomers were found in Jacaranda m. and Catalpa o., but their presence was not confirmed in any of the other samples. The elution on the SP-2560 column of CLAx1 near 21:0 suggests it is a ct- or tc-CLA isomer, and the later elution of CLAx2 in the region of 20:2 isomer elution suggests it is a tt-CLA isomer [13]. RT matching with Nu-Check UC-59M and UC-61M standards indicates that CLAx1 is the 10t,12c isomer and that CLAx2 is 8t,10t, 9t,11t, or 10t,12t. The latter three isomers elute at the same RT under the conditions used, just after the 11t,13t isomer, similar to what was reported by Cruz-Hernandez et al. [13].
3.3. 18:3. Isomers
Table 5 gives the 18:3 isomer distributions and includes conjugated and non-conjugated species. The GLC 68B standard contains only one 18:3 isomer, α-Ln, and the GLC 463 standard contains two 18:3 isomers, α-Ln and 6c,9c,12c-18:3 (γ-Ln). All samples contain α-Ln, but Impatiens b. is the only sample for which it is a large percentage of the total 18:3. No γ-Ln was observed for any sample.
A few of the samples contained small amounts of other non-conjugated 18:3 isomers. A total of three were found. Two of the three are identified as geometric isomers of 9,12,15-18:3 by RT matching with peaks observed for the L6031 standard. The order of elution for the eight geometric 9,12,15-18:3 isomers on highly polar cyanopropyl columns can be stated as ttt < ctt < tct < ttc + cct < ctc < tcc < ccc [24,27,28,29]. The ctt and tct isomers are typically close in RT and may even be coincident, depending on the particular column and temperature program. It is similar for the ttc and cct isomers, but they are more difficult to separate. Considering the known isomer relative concentrations, peaks observed for the L6031 standard on the SP-2560 column in this work are consistent with the order given above (Figure 3C). The resolution of the L6031 peaks is not as good on the Omegawax column (Figure 4C), and the time range over which they elute is about half that of the SP-2560 column. Additionally, the elution order on the Omegawax column is not the same as on the SP-2560 column and does not follow any obvious pattern with respect to the cis/trans configuration of the double bonds.
A peak observed for Catalpa o., labeled ttc in Figure 3A, is a RT match to the fourth peak, labeled D, of L6031, a coelution of the ttc and cct 9,13,15-18:3 isomers, on the SP-2560 column (Figure 3C). There is a peak with similar RT, labeled cct, for Impatiens b. (Figure 3B); however, its RT is about 3 s past the apex of L6031 D, while the RT of the Catalpa o. peak is virtually identical to the apex of L6031 D. The L6031 peak is slightly skewed, suggesting that the less abundant cct isomer has a slightly longer RT than the more abundant ttc component and the tentative identifications of the Catalpa o. peak as the ttc isomer and the Impatiens b. peak as the cct isomer.
Results for the Omegawax column verify that the Catalpa o. and Impatiens b. peaks are from different isomers. The Catalpa o. peak, labeled ttc in Figure 4A, matches the latest eluting isomer peak of L6031, labeled F in Figure 4C, which is again, by consideration of peak areas, a mixture of a (1c, 2t) isomer and a (2c, 1t) isomer. The Impatiens b. peak, labeled cct in Figure 4B, matches the first eluting L6031 isomer, labeled A in Figure 4C. The latter is a (2c, 1t) isomer, and, considering the SP-2560 results, it is the cct isomer.
From the SP-2560 results and the identification of the cct isomer in Impatiens b., it follows that the Catalpa o. peak under consideration, and likewise the (1c, 2t) component of L6031 peak F on the Omegawax column, is the ttc isomer. The elution order of the α-Ln geometric isomers on the Omegawax column can thus be partially described as A (cct) < B (ccc) < C (ttt + ctt or tct) < D (ctt or tct) < E (ctc or tcc) < F (ttc + ctc or tcc).
An unknown 18:3 isomer, labeled 18:3x1 in Table 5 and Figure 3A and Figure 4A, was only found in tung oil and in Catalpa o. It elutes later than any of the L6031 peaks on both columns, so the positions of its double bonds must be other than 9,12.15.
The elution order of the CLNA isomers was the same for both columns, but the separation of the isomers, and especially of the FAME of punicic acid and α-eleostearic acid, was better on the Omegawax column, Figure 5. Overlap of the FAME of punicic acid and α-eleostearic acid on the SP-2560 column hid the presence of the smaller of the two isomers for Punica g., Momordica c., Impatiens b., and tung oil. For Catalpa o., for which both isomers are minor components, they could be distinguished but were only partially separated, with a resolution of approximately 0.5.
Figure 5 shows the CLNA regions of the FID chromatograms of the seven samples obtained using the Omegawax column. The samples used to obtain Figure 5 were diluted by between 2:1 and 10:1 from normal analysis levels to give better RT matching between the largest CLNA peak in each sample with the much smaller corresponding peaks in other samples. The abundance of the dominant CLNA species for most of the samples, e.g., punicic acid for Punica g. and α-eleostearic acid for tung oil, resulted in peak fronting at the sample concentrations used for determination of the FA profiles presented in this work. However, such concentrations were necessary to obtain peak area and RT estimates of minor components, and some peaks, which are assigned a percentage in Table 5, are only faintly seen or are not observed in the chromatograms of Figure 5.
It can be seen in Figure 5 that the FAME of 22:0, behenic acid, elutes within the region of CLNA FAME elution. Another potential interfering FAME on the Omegawax column is that of all-cis-5,8,11,14,17-20:5 (eicosapentaenoic acid (EPA)), and the FAME of erucic acid (22:1) elutes just after the CLNA region. On the SP-2560 column, potential interfering FAME include those of EPA, nervonic acid (24:1), and 22:3. The FAME of lignoceric acid (24:0) elutes just before the CLNA region on the SP-2560 column. However, no evidence of the FAME of EPA, 22:1, 24:1, or 22:3 was found for any of the samples.
Four of the samples (Punica g., Momordica c., tung oil, and Catalpa o.) contained all four of the 9,11,13-18:3 isomers listed in Table 1. Three of the 9,11,13-18:3 isomers were found in the Impatiens b. sample. Catalpic acid was not detected in Impatiens b., which has a much lower total CLNA level than the other samples. None of the 8,10,12-18:3 isomers could be verified for any of these five samples.
Jacaranda m. contained the three 8,10,12-18:3 isomers listed in Table 1 and gave a fourth CLNA peak that does not match the RT of any of the isomers in Table 1. As is apparent in Figure 5 and as mentioned earlier, the well-known CLNA isomers elute according to the pattern ctc < ctt < ttc < ttt, and this order holds on both columns used in this work. The FAME of the two ctc isomers, jacaric acid and punicic acid, have a ΔRT of about 0.13 min in Figure 5 (peaks 1 and 2); the two ttc isomers (α-calendic and catalpic) have a ΔRT of about 0.19 min (peaks 5 and 6); and the two ttt isomers (β-eleostearic and β-calendic, peaks 7 and 8) have a ΔRT of about 0.28 min. The separation of ctc and ctt (peaks 1 vs. 4 and 2 vs. 3) is about 1 min in Figure 5; the separation of ctt and ttc is about 1 min (peaks 4 vs. 5 and 3 vs. 6); and the separation of ttc and ttt is about 1.7 min (peaks 5 vs. 8 and 6 vs. 7). Since it is close in RT to α-eleostearic acid (ΔRT about 0.2 min on both columns), it is proposed that the unidentified CLNA peak (peak 4) for Jacaranda m. is from the 8,10,12 analog to α-eleostearic acid, 8c,10t,12t-18:3. Calendula o. likewise contained the three 8,10,12-18:3 isomers listed in Table 1 and a small amount of the probable 8c,10t,12t-18:3 isomer. No 9,11,13-18:3 isomers could be verified for Jacaranda m. or Ca lendula o.
The probable presence of the 8c,10t,12t-18:3 isomer in Jacaranda m. and Calendula o. is in agreement with the observation of Wang, et al. [17] of the natural occurrence of this isomer, which had not previously been reported.
3.4. 18:4. Isomers
CSDA isomers are the predominant CFA species found in Impatiens b. The isomer distribution based on integration of the 18:4 FAME FID peaks is given in Table 6, and the CSDA region of an FID chromatogram of Impatiens b. obtained using the SP-2560 column is shown in Figure 6. Hamberg (29) identified four 9,11,13,15-18:4 isomers from an Impatiens b. sample and reported the following relative abundances determined by GC with a methyl silicone column: α-parinaric acid (74%); 9c,11t,13t,15t-18:4 (18%); 9t,11t,13t,15c-18:4 (4%); and β-parinaric acid (4%). Using capillary electrophoresis (CE) and UV detection, Ohman et al. (30) reported the same four CSDA isomers in a sample of Impatiens b. They did not report relative abundances, but a sample electropherogram suggests an approximate distribution of: cttc (70%), cttt (15%), tttc (10%) and tttt (5%). The relative abundance estimates in Table 6 were obtained using the SP-2560 column.
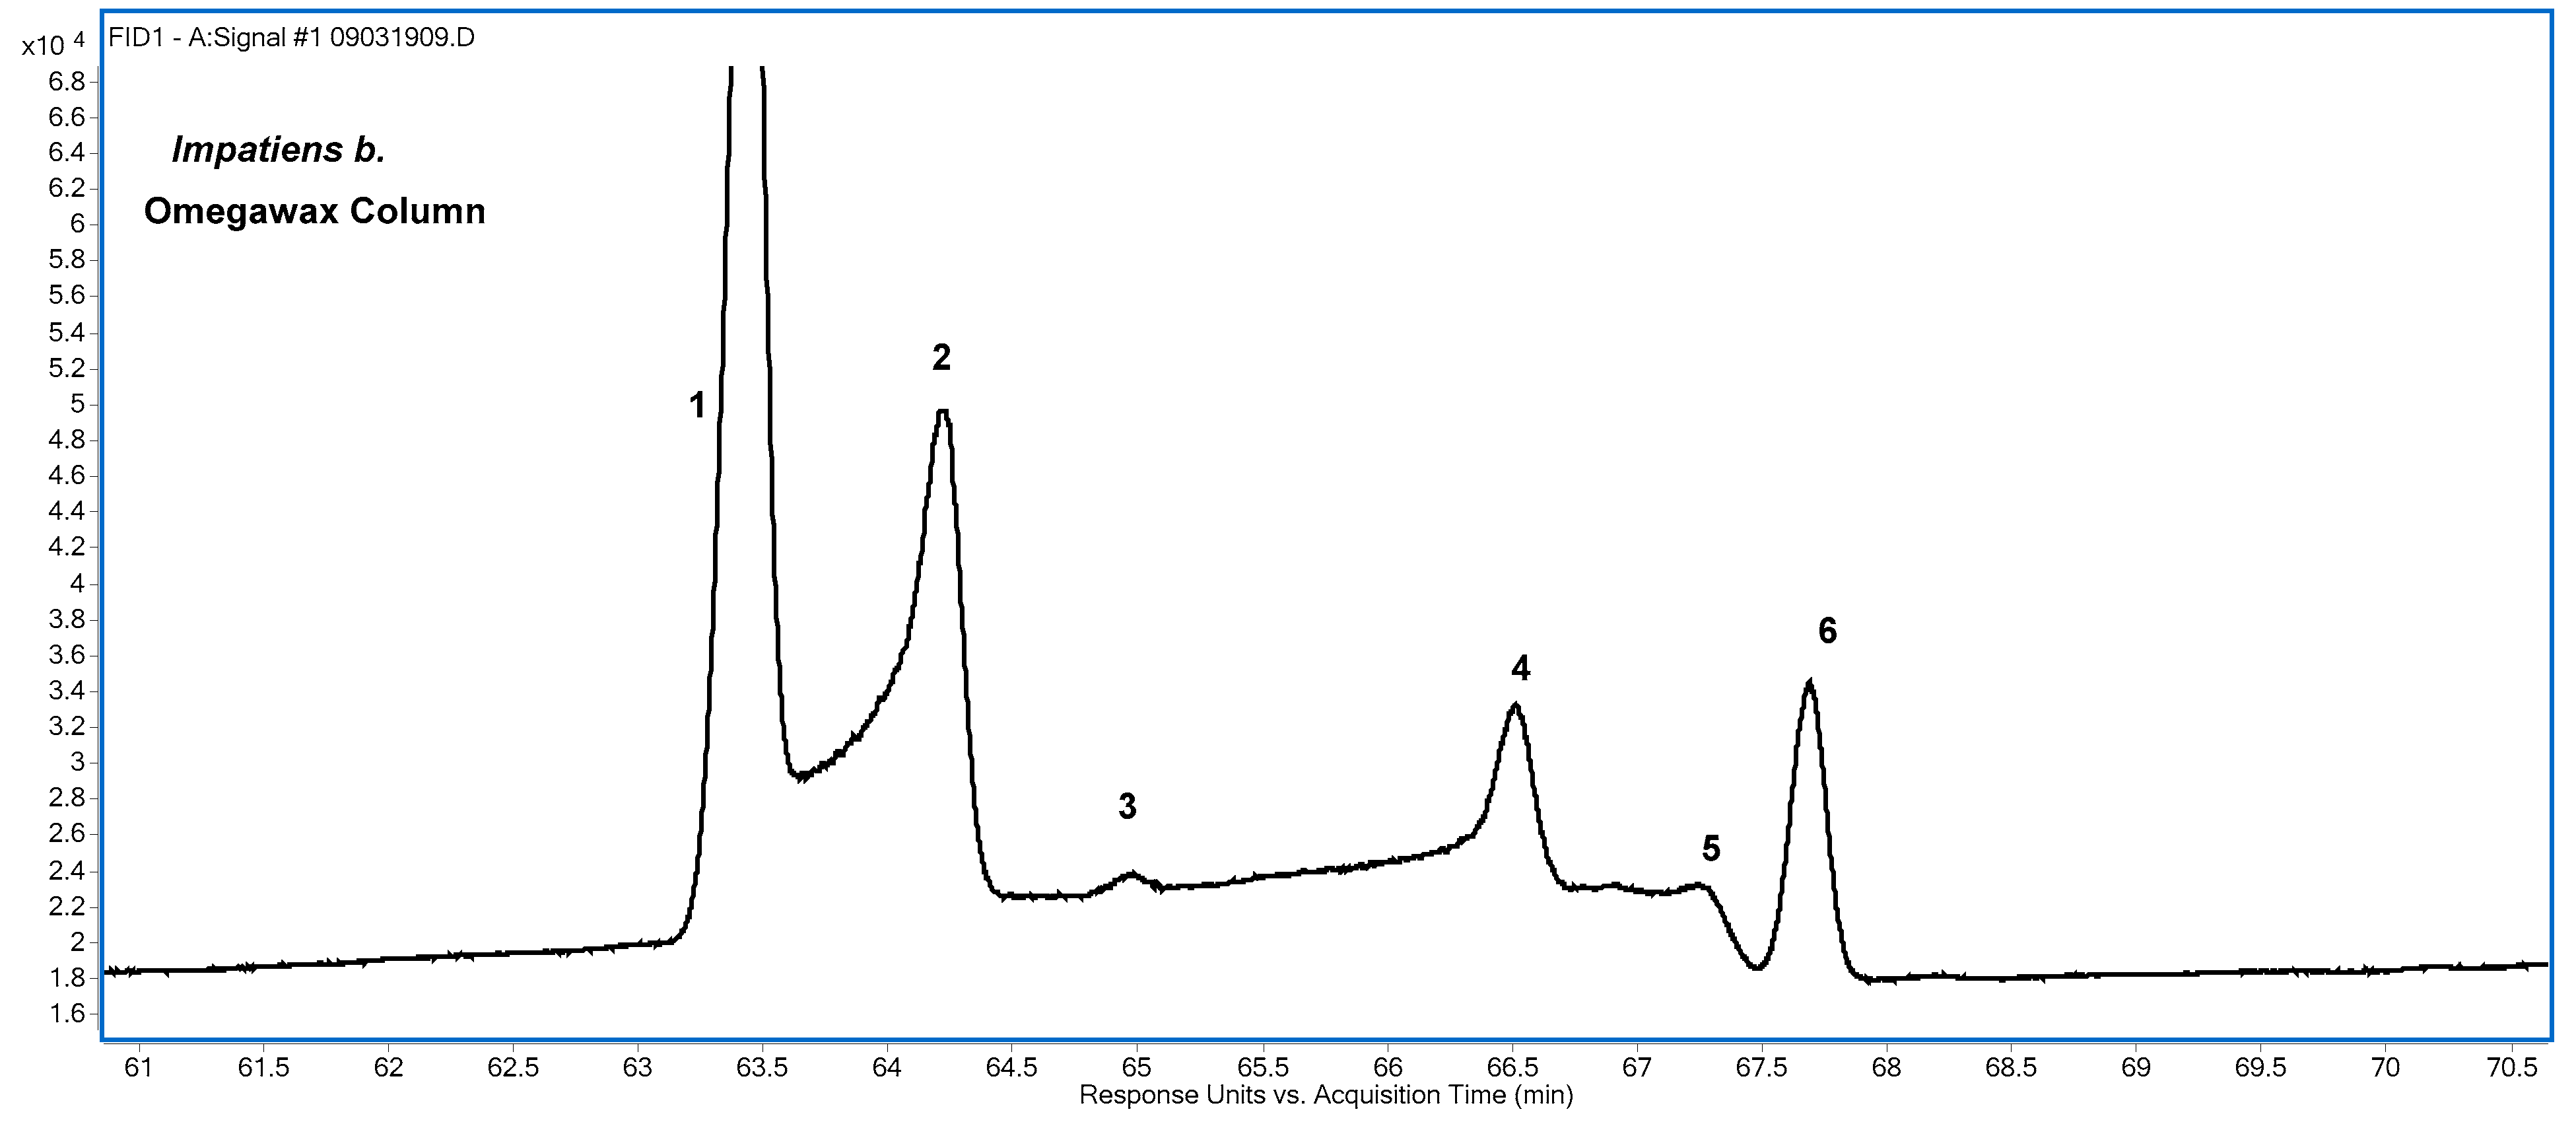
The first peak in Figure 6 has two incompletely resolved components, introducing some uncertainty into the peak area assignments; but based on relative areas, they are assigned as the FAME of α-parinaric acid and its cttt isomer. The two peaks are better separated on the Omegawax column (Figure 7), but the underlying ‘hump’ makes quantitative estimates problematic. The hump presumably consists primarily of unresolved FAME of CSDA, and such an interpretation is supported by examination of the PCI-CH4 mass spectra of various portions of it. Although not obvious in Figure 6, a similar hump is observed using the SP-2560 column, but it is smaller. Integration of the entire hump areas of Figure 6 and Figure 7, including peaks, and then subtracting the peak areas indicates that about 10% of the total CSDA FID signal is unresolved on the SP-2560 column, and about 55% is unresolved on the Omegawax column.
Hamberg [30] cautioned that thermal cis-to-trans isomerization can occur during GLC analysis of CSDA and estimated that it occurred to the extent of about 5% to 8% for a given CSDA isomer under the conditions used. Such isomerization occurring in the GC inlet would result in errors in estimates of endogenous CDSA isomers and possibly produce non-endogenous isomers. Isomerization occurring on-column would seem likely to cause peak broadening. The inlet temperatures used in the SP-2560 method and the Omegawax method in this work were both 250 °C. The oven temperatures at the time of elution were similar: about 230 °C for the SP-2560 method and about 225 °C for the Omegawax method. The time of exposure to elevated temperatures can also influence the degree of isomerization of conjugated PUFA [7], but here the RT of CSDA FAME is longer on the SP-2560 column (about 88 min) than on the Omegawax column (about 65 min). It appears that the larger hump area on the Omegawax column has more to do with its poorer resolution of the CSDA FAME than with thermal isomerization occurring during GC analysis.
Following Hamberg [30] and Ohman et al. [31], the third largest peak in Figure 6, peak 4, is assigned as the FAME of the tttc isomer of α-parinaric acid. The two smallest peaks, peaks 3 and 5, are each about 1% of the CSDA FAME FID area. A significant increase in the area of peak 5 upon use of the acid treatment for the conversion of FA to FAME suggests that it is the FAME of the tttt isomer, β-parinaric acid. Peak 3 appears to be a fifth CSDA isomer. It exhibits a small peak in the extracted ion chromatogram (EIC) obtained using ions characteristic of the known CSDA isomers, but, unlike in the FID chromatogram, its EIC peak is smaller than that observed for β-parinaric acid, and the extracted peak mass spectrum is of poor quality due to the weak signal level. Peak 3 is therefore not included as part of the isomer distribution given in Table 6, pending further investigation. Apart from this possible fifth CSDA isomer, the major differences among the CSDA abundance estimates of this work, Hamberg [30] and Ohman et al. [31] are for the tttc and tttt isomers. Sample-to-sample differences may account for some portion of the differences, but treatment differences, including extraction, derivatization, and instrumental, may also have an influence.
3.5. 20:1. Isomers
Three 20:1 isomers were observed at the same retention times in all seven samples, consistent with these being the same three isomers in all seven samples. The distributions are shown in Table 7. The GLC-463 standard contains the 5c-, 8c-, and 11c-20:1 isomers. On the SP-2560 column, the 20:1 isomers elute in the same region as the non-conjugated 18:3 isomers (Figure 3). On the Omegawax column, they elute after 20:0 and in the same region as tt-CLA isomers (CLAx2 in Figure 4A). The major isomer found for all samples was 11c-20:1. On the SP-2560 column, the two less abundant 20:1 isomers of the samples have RT close to that of the 8c-20:1 isomer of GLC-463. One isomer elutes slightly before 8c-20:1, and the other elutes slightly after it. Following Kramer et al. [32], the later eluting isomer, designated 20:1x2 in Figure 3 and Table 7, is probably 9c-20:1, although 14t-20:1 cannot be excluded. The earlier eluting isomer, designated 20:1x1, is probably one of 13t, 14t-, 6c-, or 7c-20:1. On the Omegawax column, the two less abundant 20:1 isomers elute together, just before 11c-20:1 and very close to the tt-CLA isomer found for Jacaranda m. and Catalpa o., designated as CLAx2 in Figure 4A.
4. Conclusions
The FA distributions of seven CFA-containing seed oil samples were determined, including isomer distributions for 18:1, 18:2, 18:3, 18:4, and 20:1 FA. Quantification was performed, after conversion of FA to FAME by base-catalyzed methylation, using FID data, but the use of MS with PCI-CH4 was helpful in establishing FAME molecular weights. The use of two columns with different retention characteristics, i.e., one with a poly(ethylene glycol) stationary phase and one with a bis-cyanopropyl stationary phase, was also helpful in peak identification. Highly polar cyanopropyl columns are considered essential for analysis of milk and meat samples containing multiple CLA species (13, 14), and they are also superior to less polar columns for analysis of samples containing CLNA and CSDA. However, complimentary information obtained using a poly(ethylene glycol) column was crucial in peak identification in several instances in this work. Contrary to what might be expected, separation of CLNA and CSDA isomers was better on the Omegawax column than on the SP-2560 column, although peak definition and hence quantitative estimates were superior with the SP-2560 column.
In addition to the major CFA components, which are well known for these samples, all seven samples were found to contain small amounts of additional CFA. Four samples, Punica g., Momordica c., Vernicia f. (tung), and Catalpa o., were found to contain all four of the known, naturally occurring 9,11,13-CLNA isomers: punicic acid, α-eleostearic acid, catalpic acid, and β-eleostearic acid. Three of these were observed in the Impatiens b. sample, which contains lower levels of CLNA than the other 9,11,13-CLNA-containing samples, but catalpic acid was not detected. Jacaranda m. and Calendula o. were found to contain the three well-known, naturally occurring 8,10,12-CLNA isomers: jacaric acid, α-calendic acid, and β-calendic acid, plus a fourth isomer, 8c,10t,12t-18:3, which, until recently, had not been observed to occur naturally. There is evidence of a fifth CSDA isomer in Impatiens b., for which four CSDA isomers have been previously reported (29, 30), but additional work is needed for confirmation. The reported distributions account for 99% or more of the total FID peak areas observed for the samples. Additional work is required to identify the peaks not accounted for, which may be due to oxygenated FA or species other than FA.
Author Contributions
Conceptualization, R.G. and W.B.; methodology, R.G.; software, R.G.; validation, R.G., W.B.; formal analysis, R.G.; investigation, R.G.; resources, R.G., W.B.; data curation, R.G.; writing—original draft preparation, R.G.; writing—review and editing, R.G., W.B.; visualization, R.G.; supervision, W.B.; project administration, W.B.; funding acquisition, W.B. All authors have read and agreed to the published version of the manuscript.
Funding
This work was supported by the USDA Agricultural Research Service and received no external funding. Mention or use of specific products or brands do not represent or imply endorsement by the USDA.
Institutional Review Board Statement
Not applicable.
Informed Consent Statement
Not applicable.
Data Availability Statement
The data presented in this study are available on request from the corresponding author. The data are not publicly available because the USDA does not maintain a generally-accessible public data archive.
Conflicts of Interest
The authors declare no conflict of interest.
References
- Hopkins, C.Y.; Chisholm, M.J. A survey of the conjugated fatty acids of seed oils. J. Am. Oil Chem. Soc. 1968, 45, 176–182. [Google Scholar] [CrossRef] [PubMed]
- Yang, L.; Leung, L.K.; Huang, Y.; Chen, Z.-Y. Oxidative stability of conjugated linoleic acid isomers. J. Agric. Food Chem. 2000, 48, 3072–3076. [Google Scholar] [CrossRef]
- Tsuzuki, T.; Igarashi, M.; Iwata, T.; Yamauchi-Sato, Y.; Yamamoto, T.; Ogita, K.; Suzuki, T.; Miyazawa, T. Oxidation rate of conjugated linoleic acid and conjugated linolenic acid is slowed by triacylglycerol esterification and α-tocopherol. Lipids 2004, 39, 475–480. [Google Scholar] [CrossRef]
- Cowan, J.C. Isomerization and trans-esterification. J. Am. Oil Chem. Soc. 1950, 27, 492–499. [Google Scholar] [CrossRef]
- Yang, L.; Cao, Y.; Chen, J.-N.; Chen, Z.-Y. Oxidative stability of conjugated linolenic acids. J. Agric. Food Chem. 2009, 57, 4212–4217. [Google Scholar] [CrossRef] [PubMed]
- Park, Y.; Albright, K.J.; Cai, Z.Y.; Pariza, M.W. Comparison of methylation procedures for conjugated linoleic acid and artifact formation by commercial (trimethylsilyl) diazomethane. J. Agric. Food Chem. 2001, 49, 1158–1164. [Google Scholar] [CrossRef]
- Chen, J.; Cao, Y.; Gao, H.; Yang, L.; Chen, Z.-Y. Isomerization of conjugated linolenic acids during methylation. Chem. Phys. Lipids 2007, 150, 136–142. [Google Scholar] [CrossRef] [PubMed]
- Hennessy, A.A.; Ross, P.R.; Fitzgerald, G.F.; Stanton, C. Sources and bioactive properties of conjugated dietary fatty acids. Lipids 2016, 51, 377–397. [Google Scholar] [CrossRef] [PubMed]
- Chin, S.; Liu, W.; Storkson, J.; Ha, Y.; Pariza, M. Dietary sources of conjugated dienoic isomers of linoleic acid, a newly recognized class of anticarcinogens. J. Food Compos. Anal. 1992, 5, 185–197. [Google Scholar] [CrossRef]
- Sassano, G.; Sanderson, P.; Franx, J.; Groot, P.; Van Straalen, J.; Bassaganya-Riera, J. Analysis of pomegranate seed oil for the presence of jacaric acid. J. Sci. Food Agric. 2009, 89, 1046–1052. [Google Scholar] [CrossRef]
- Alcaraz-Mármol, F.; Nuncio-Jáuregui, N.; Calín-Sánchez, Á.; Carbonell-Barrachina, Á.A.; Martínez, J.J.; Hernández, F. Determination of fatty acid composition in arils of 20 pomegranates cultivars grown in Spain. Sci. Hortic. 2015, 197, 712–718. [Google Scholar] [CrossRef]
- Bates, P.D.; Browse, J. The pathway of triacylglycerol synthesis through phosphatidylcholine in Arabidopsis produces a bottleneck for the accumulation of unusual fatty acids in transgenic seeds. Plant J. 2011, 68, 387–399. [Google Scholar] [CrossRef] [PubMed]
- Deng, Z.; Dugan, M.; Santercole, V.; Kramer, J.; Or-Rashid, M.; Cruz-Hernandez, C.; Delmonte, P.; Yurawecz, M.; Kraft, J.; Banni, S.; et al. Systematic analysis of trans and conjugated linoleic acids in the milk and meat of uminants. In Advances in Conjugated Linoleic Acid Research; AOCS Press: Champaign, IL, USA, 2006; pp. 45–93. [Google Scholar]
- Delmonte, P.; Services, H.; Fardin-kia, A.R.; Services, H.; Aldai, N.; Mossoba, M.M.; Services, H. Analysis of conjugated and other fatty acids. In Conjugated Linoleic Acids and Conjugated Vegetable Oils; Sels, B., Philippaerts, A., Eds.; Royal Society of Chemistry: London, UK, 2014; Chapter 7; pp. 172–231. [Google Scholar]
- Kramer, J.K.G.; Fellner, V.; Dugan, M.E.R.; Sauer, F.D.; Mossoba, M.M.; Yurawecz, M.P. Evaluating acid and base catalysts in the methylation of milk and rumen fatty acids with special emphasis on conjugated dienes and total trans fatty acids. Lipids 1997, 32, 1219–1228. [Google Scholar] [CrossRef]
- Takagi, T.; Itabashi, Y. Occurrence of mixtures of geometrical isomers of conjugated octadecatrienoic acids in some seed oils: Analysis by open-tubular gas liquid chromatography and high performance liquid chromatography. Lipids 1981, 16, 546–551. [Google Scholar] [CrossRef]
- Wang, D.H.; Wang, Z.; Le, K.P.; Cortright, J.R.; Park, H.G.; Tobias, H.J.; Brenna, J.T. Potentially high value conjugated linolenic acids (CLnA) in Melon Seed Waste. J. Agric. Food Chem. 2019, 67, 10306–10312. [Google Scholar] [CrossRef] [PubMed]
- Bhaskar, N.; Kinami, T.; Miyashita, K.; Park, S.B.; Endo, Y.; Fujimoto, K. Occurence of conjugated polyenoic fatty acids in seaweeds from the Indian Ocean. Zeitschrift Fur Naturforsch 2004, 59, 310–314. [Google Scholar] [CrossRef]
- Tzen, J.; Cao, Y.; Laurent, P.; Ratnayake, C.; Huang, A. Lipids, proteins, and structure of seed oil bodies from diverse species. Plant Physiol. 1993, 101, 267–276. [Google Scholar] [CrossRef] [PubMed] [Green Version]
- Vine, J. Analysis of fatty acid methyl esters by high-resolution gas chromatography-chemical ionisation mass spectrometry. J. Chromatogr. A 1980, 196, 415–424. [Google Scholar] [CrossRef]
- Kramer, J.K.G.; Blackadar, C.B.; Zhou, J. Evaluation of two GC columns (60-m SUPELCOWAX 10 and 100-m CP sil 88) for analysis of milkfat with emphasis on CLA, 18:1, 18:2 and 18:3 isomers, and short- and long-chain FA. Lipids 2002, 37, 823–835. [Google Scholar] [CrossRef]
- Folch, J.; Lees, M.; Sloane-Stanley, G.H. A simple method for the isolation and purification of total lipides from animal tissues. J. Biol. Chem. 1957, 226, 497–509. [Google Scholar] [CrossRef]
- Christie, W.W. Preparation of ester derivatives of fatty acids for chromatographic analysis. In Advanced in Lipid Methodology-Two; Oily Press Ltd.: Scotland, UK, 1993; pp. 69–111. [Google Scholar]
- Grandgirard, A.; Julliard, F.; Prevost, J.; Sébédio, J.L. Preparation of geometrical isomers of linolenic acid. J. Am. Oil Chem. Soc. 1987, 64, 1434–1440. [Google Scholar] [CrossRef]
- Kramer, J.K.G.; Cruz-Hernandez, C.; Or-Rashid, M.; Dugan, M.E.R. The use of total trans-11 containing FA, rather than total “n−7” FA, Is recommended to assess the content of FA with a positive health image in ruminant fats. Lipids 2004, 39, 693–695. [Google Scholar] [CrossRef]
- Kramer, J.K.G.; Cruz-Hernandez, C.; Deng, Z.; Zhou, J.; Jahreis, G.; Dugan, M.E.R. Analysis of conjugated linoleic acid and trans 18:1 isomers in synthetic and animal products. Am. J. Clin. Nutr. 2004, 79, 1137S–1145S. [Google Scholar] [CrossRef] [Green Version]
- Brühl, L. Determination of trans fatty acids in cold pressed oils and in dried seeds. Fette Seifen Anstrichm. 1996, 98, 380–383. [Google Scholar] [CrossRef]
- Wolff, R.L. Heat-induced geometrical isomerization of α-linolenic acid: Effect of temperature and heating time on the appearance of individual isomers. J. Am. Oil Chem. Soc. 1993, 70, 425–430. [Google Scholar] [CrossRef]
- Hejazi, L.; Ebrahimi, D.; Guilhaus, M.; Hibbert, D.B. Discrimination among geometrical isomers of α-linolenic acid methyl ester using low energy electron ionization mass spectrometry. J. Am. Soc. Mass Spectrom. 2009, 20, 1272–1280. [Google Scholar] [CrossRef] [PubMed] [Green Version]
- Hamberg, M. Oxidation of octadecatrienoic acids in the red alga lthothamnion coralliodes: Strucrural and stereochemical studies of conjugated tetraene fatty acids and bis allylic hydroxy acids. J. Chem. Soc. Perkin Trans. 1993, 24, 3065–3072. [Google Scholar] [CrossRef]
- Öhman, M.; Wan, H.; Hamberg, M.; Blomberg, L.G. Separation of conjugated linoleic acid isomers and parinaric fatty acid isomers by capillary electrophoresis. J. Sep. Sci. 2002, 25, 499–506. [Google Scholar] [CrossRef]
- Kramer, J.K.G.; Hernandez, M.; Cruz-Hernandez, C.; Kraft, J.; Dugan, M.E.R. Combining results of two GC separations partly achieves determination of all cis and trans 16:1, 18:1, 18:2 and 18:3 except CLA isomers of milk fat as demonstrated using Ag-ion SPE fractionation. Lipids 2008, 43, 259–273. [Google Scholar] [CrossRef] [PubMed]
Figure 1.
FID (flame ionization detector) chromatograms obtained using SP-2560 column of FAME (fatty acid methyl esters) of seven samples containing CLNA (conjugated linolenic acids).
Figure 1.
FID (flame ionization detector) chromatograms obtained using SP-2560 column of FAME (fatty acid methyl esters) of seven samples containing CLNA (conjugated linolenic acids).

Figure 2.
FID chromatograms of Jacaranda m. and GLC 463 FAME standard on SP-2560 column showing positions of 18:1 isomers.
Figure 2.
FID chromatograms of Jacaranda m. and GLC 463 FAME standard on SP-2560 column showing positions of 18:1 isomers.

Figure 3.
Chromatograms showing the 18:2 and non-conjugated 18:3 isomers on the SP-2560 column. (A) FID of Catalpa o. (B) FID of Impatiens b. (C) FID of L6031 standard containing the eight geometric 9,12,15-18:3 isomers. The configuration of the L6031 peaks is A ttt; B ctt; C tct; D ttc and cct; E ctc; F tcc; G ccc. Peaks marked ‘?’ in 3A and3 are unknowns for which MS evidence is not sufficient to support identification.

Figure 4.
Chromatograms showing the 18:2 and non-conjugated 18:3 isomers on the Omegawax 250 column. (A) FID of Catalpa o., (B) FID of Impatiens b., and (C) FID of L6031 standard containing the eight geometric 9,12,15-18:3 isomers. The configuration of the L6031 peaks is A cct; B ccc (shoulder); C ttt and (2t, 1c); D (2t, 1c); E (2c, 1t) (shoulder); F ttc and (2c, 1t). Peaks marked ‘?’ in 4A and 4B are unknowns for which MS evidence is not sufficient to support identification. Peaks for 20:1x1 and 20:1x2 are not seen in the FID chromatogram for Catalpa o. (4A) due to co-elution with the larger CLAx2 peak.

Figure 5.
CLNA Regions of FID chromatograms of FAME of seven samples obtained using the Omegawax 250 column. Samples diluted compared to normal analysis levels to facilitate retention time matching. Numbered peaks are FAME of 1. Jacaric acid (8c,10t,12c); 2. Punicic acid (9c,11t,13c); 3. α-eleostearic acid (9c,11t,13t); 4. Probable 8c,10t,12t-18:3; 5. α-calendic acid (8t,10t,12c); 6. Catalpic acid (9t,11t,13c); 7. β-eleostearic acid (9t,11t,13t); 8. β-calendic acid (8t,10t,12t). Grouping numbered peaks according to geometric configuration: peaks 1 and 2 are ctc; peaks 3 and 4 are ctt; peaks 5 and 6 are ttc; and peaks 7 and 8 are ttt.

Figure 6.
CSDA region of FID chromatogram of Impatiens b. obtained using the SP-2560 column. Peak 1 is assigned as the FAME of α-parinaric acid (cttc); peak 2 is assigned as the FAME of the cttt isomer; peak 3 is a possible CSDA isomer of unknown geometric configuration; peak 4 is assigned as the FAME of the tttc isomer; and peak 5 is assigned as the FAME of β-parinaric acid (tttt).

Figure 7.
CSDA region of FID chromatogram of Impatiens b. obtained using the Omegawax column. Peak 1 is assigned as the FAME of α-parinaric acid (cttc); peak 2 is assigned as the FAME of the cttt isomer; peak 3 is a possible CSDA isomer of unknown geometric configuration; peak 4 is assigned as the FAME of the tttc isomer; and peak 5 is assigned as the FAME of β-parinaric acid (tttt). Peak 6 is squalene.


Table 1.
Common names and configurations of conjugated 18:3 and 18:4 fatty acids.
| 8,10,12-18:3 | 9,11,13-18:3 |
| jacaric acid 8c,10t,12c-18:3 | punicic acid 9c,11t,13c-18:3 |
| α-eleostearic acid 9c,11t,13t-18:3 | |
| α-calendic acid 8t,10t,12c-18:3 | catalpic acid 9t,11t,13c-18:3 |
| β-calendic acid 8t,10t,12t-18:3 | β-eleostearic acid 9t,11t,13t-18:3 |
| 9,11,13,15-18:4 | |
| α-parinaric acid 9c,11t,13t 15c-18:4 | |
| β-parinaric acid 9t,11t,13t,15t-18:4 |
Table 2.
Fatty acid percent relative compositions obtained by GC-FID for seven samples and arranged by carbon number of acid and degree of unsaturation. Relative abundances include isomer contributions and are averages from three independent analyses. Uncertainties are 95% confidence limits based on the t-distribution with 2 degrees of freedom.
| Jacaranda | Punica | Momordica | Impatiens | Tung | Calendula | Catalpa | |
|---|---|---|---|---|---|---|---|
| 12:0 | 0.00 ± 0.00 | 0.02 ± 0.01 | 0.00 ± 0.00 | 0.00 ± 0.00 | 0.00 ± 0.00 | 0.00 ± 0.00 | 0.00 ± 0.00 |
| 14:0 | 0.05 ± 0.03 | 0.03 ± 0.00 | 0.02 ± 0.01 | 0.10 ± 0.02 | 0.04 ± 0.03 | 0.08 ± 0.02 | 0.02 ± 0.00 |
| 15:0 | 0.02 ± 0.01 | 0.02 ± 0.01 | 0.03 ± 0.00 | 0.02 ± 0.01 | 0.01 ± 0.02 | 0.02 ± 0.01 | 0.03 ± 0.02 |
| 16:0 | 3.61 ± 0.15 | 3.55 ± 0.04 | 1.74 ± 0.02 | 7.36 ± 0.03 | 2.75 ± 0.34 | 4.12 ± 0.12 | 3.52 ± 0.11 |
| 16:1 | 0.03 ± 0.01 | 0.01 ± 0.01 | 0.00 ± 0.00 | 0.08 ± 0.01 | 0.01 ± 0.00 | 0.04 ± 0.02 | 0.03 ± 0.01 |
| 17:0 | 0.04 ± 0.01 | 0.06 ± 0.01 | 0.09 ± 0.01 | 0.07 ± 0.01 | 0.03 ± 0.01 | 0.04 ± 0.02 | 0.04 ± 0.04 |
| 18:0 | 5.69 ± 0.15 | 2.64 ± 0.05 | 30.24 ± 0.66 | 4.06 ± 0.04 | 2.34 ± 0.76 | 1.84 ± 0.04 | 2.37 ± 0.06 |
| 18:1 | 10.41 ± 0.30 | 6.42 ± 0.07 | 1.71 ± 0.24 | 15.78 ± 0.24 | 8.62 ± 0.33 | 4.93 ± 0.16 | 8.45 ± 0.10 |
| 18:2 | 43.31 ± 0.55 | 8.14 ± 0.12 | 3.25 ± 0.06 | 16.59 ± 0.04 | 8.49 ± 0.19 | 29.79 ± 0.12 | 41.76 ± 0.12 |
| 18:3 | 35.56 ± 0.30 | 78.03 ± 0.21 | 62.31 ± 0.48 | 27.90 ± 0.08 | 76.41 ± 1.31 | 58.20 ± 0.12 | 43.00 ± 0.23 |
| 18:4 | 0.00 ± 0.00 | 0.00 ± 0.00 | 0.00 ± 0.00 | 27.51 ± 0.14 | 0.00 ± 0.00 | 0.00 ± 0.00 | 0.00 ± 0.00 |
| 19:0 | 0.02 ± 0.01 | 0.01 ± 0.01 | 0.04 ± 0.01 | 0.00 ± 0.00 | 0.00 ± 0.00 | 0.00 ± 0.00 | 0.01 ± 0.01 |
| 20:0 | 0.47 ± 0.01 | 0.43 ± 0.00 | 0.35 ± 0.01 | 0.17 ± 0.01 | 0.17 ± 0.02 | 0.36 ± 0.01 | 0.19 ± 0.05 |
| 20:1 | 0.36 ± 0.03 | 0.41 ± 0.00 | 0.18 ± 0.01 | 0.12 ± 0.01 | 0.93 ± 0.03 | 0.28 ± 0.01 | 0.28 ± 0.01 |
| 20:2 | 0.10 ± 0.01 | 0.02 ± 0.01 | 0.00 ± 0.00 | 0.03 ± 0.01 | 0.09 ± 0.03 | 0.08 ± 0.01 | 0.08 ± 0.01 |
| 21:0 | 0.03 ± 0.02 | 0.02 ± 0.01 | 0.00 ± 0.00 | 0.00 ± 0.00 | 0.00 ± 0.00 | 0.01 ± 0.01 | 0.03 ± 0.02 |
| 22:0 | 0.18 ± 0.00 | 0.09 ± 0.01 | 0.02 ± 0.01 | 0.09 ± 0.01 | 0.05 ± 0.01 | 0.10 ± 0.01 | 0.07 ± 0.03 |
| 23:0 | 0.03 ± 0.03 | 0.02 ± 0.01 | 0.01 ± 0.01 | 0.02 ± 0.00 | 0.02 ± 0.01 | 0.02 ± 0.01 | 0.02 ± 0.00 |
| 24:0 | 0.07 ± 0.01 | 0.05 ± 0.01 | 0.01 ± 0.01 | 0.06 ± 0.01 | 0.03 ± 0.02 | 0.09 ± 0.01 | 0.06 ± 0.05 |
| 25:0 | 0.01 ± 0.01 | 0.02 ± 0.00 | 0.00 ± 0.00 | 0.01 ± 0.01 | 0.01 ± 0.01 | 0.00 ± 0.00 | 0.01 ± 0.01 |
| 26:0 | 0.02 ± 0.00 | 0.02 ± 0.00 | 0.00 ± 0.00 | 0.02 ± 0.00 | 0.00 ± 0.00 | 0.00 ± 0.00 | 0.02 ± 0.02 |
| Sum | 100.00 | 100.00 | 100.00 | 100.00 | 100.00 | 100.00 | 100.00 |
Table 3.
C18:1 Isomer distribution. Entries are percentages of total integrated 18:1 FID signal and are the means of three independent determinations. Uncertainties are 95 % confidence limits based on the t-distribution with 2 degrees of freedom.
Table 3.
C18:1 Isomer distribution. Entries are percentages of total integrated 18:1 FID signal and are the means of three independent determinations. Uncertainties are 95 % confidence limits based on the t-distribution with 2 degrees of freedom.
| Jacaranda | Punica | Momordica | Impatiens | Tung | Calendula | Catalpa | |
|---|---|---|---|---|---|---|---|
| 9t | 0.00 ± 0.00 | 0.00 ± 0.00 | 0.00 ± 0.00 | 0.00 ± 0.00 | 0.00 ± 0.00 | 0.00 ± 0.00 | 0.00 ± 0.00 |
| 18:1x1 a | 0.22 ± 0.03 | 0.22 ± 0.02 | 0.86 ± 0.15 | 0.11 ± 0.04 | 0.17 ± 0.02 | 0.36 ± 0.12 | 0.17 ± 0.05 |
| 11t | 0.00 ± 0.00 | 0.00 ± 0.00 | 0.00 ± 0.00 | 0.00 ± 0.00 | 0.00 ± 0.00 | 0.00 ± 0.00 | 0.00 ± 0.00 |
| 6c | 0.00 ± 0.00 | 0.00 ± 0.00 | 0.00 ± 0.00 | 0.00 ± 0.00 | 0.00 ± 0.00 | 0.00 ± 0.00 | 0.00 ± 0.00 |
| 9c | 97.04 ± 0.32 | 93.45 ± 0.38 | 95.63 ± 0.45 | 96.75 ± 0.03 | 95.84 ± 0.15 | 89.26 ± 0.26 | 92.27 ± 0.27 |
| 11c | 2.74 ± 0.35 | 6.33 ± 0.38 | 3.51 ± 0.59 | 3.15 ± 0.05 | 3.98 ± 0.14 | 10.38 ± 0.25 | 7.57 ± 0.22 |
| Sum | 100.00 | 100.00 | 100.00 | 100.00 | 100.00 | 100.00 | 100.00 |
a 18:1x1 is believed to be 10t-18:1 isomer.
Table 4.
18:2 Isomer distribution. Entries are percentages of the total integrated 18:2 FID signal and the means of three independent determinations. Uncertainties are 95% confidence limits based on the t-distribution with 2 degrees of freedom.
Table 4.
18:2 Isomer distribution. Entries are percentages of the total integrated 18:2 FID signal and the means of three independent determinations. Uncertainties are 95% confidence limits based on the t-distribution with 2 degrees of freedom.
| Jacaranda | Punica | Momordica | Impatiens | Tung | Calendula | Catalpa | |
|---|---|---|---|---|---|---|---|
| 9t12t | 0.00 ± 0.00 | 0.00 ± 0.00 | 0.00 ± 0.00 | 0.00 ± 0.00 | 0.00 ± 0.00 | 0.00 ± 0.00 | 27.29 ± 0.47 |
| 9c12t | 0.12 ± 0.02 | 2.97 ± 0.04 | 8.32 ± 0.21 | 0.84 ± 0.04 | 10.72 ± 0.12 | 0.04 ± 0.01 | 2.73 ± 0.05 |
| 9t12c | 0.00 ± 0.00 | 0.00 ± 0.00 | 0.00 ± 0.00 | 0.00 ± 0.00 | 0.00 ± 0.00 | 0.00 ± 0.00 | 0.21 ± 0.02 |
| L | 98.02 ± 0.09 | 97.03 ± 0.04 | 91.68 ± 0.21 | 98.86 ± 0.02 | 89.28 ± 0.12 | 99.96 ± 0.01 | 66.32 ± 0.51 |
| 18:2x1 a | 0.00 ± 0.00 | 0.00 ± 0.00 | 0.00 ± 0.00 | 0.30 ± 0.05 | 0.00 ± 0.00 | 0.00 ± 0.00 | 0.00 ± 0.00 |
| CLAx1 b | 1.69 ± 0.09 | 0.00 ± 0.00 | 0.00 ± 0.00 | 0.00 ± 0.00 | 0.00 ± 0.00 | 0.00 ± 0.00 | 0.16 ± 0.09 |
| CLAx2 c | 0.16 ± 0.04 | 0.00 ± 0.00 | 0.00 ± 0.00 | 0.00 ± 0.00 | 0.00 ± 0.00 | 0.00 ± 0.00 | 3.30 ± 0.04 |
| Sum | 100.00 | 100.00 | 100.00 | 100.00 | 100.00 | 100.00 | 100.00 |
a 18:2x1 is a non-conjugated 18:2 isomer for which the double bond positions have not been determined. b CLAx1 is a RT match to 10t,12c-18:2. c CLAx2 is likely to be one of 8t,10t-, 9t,11t-, or 10t,12t-18:2 by RT matching.
Table 5.
18:3 Isomer distribution. Entries are percentages of total integrated 18:3 FID signal and are the means of three independent determinations. Uncertainties are 95% confidence limits based on the t-distribution with 2 degrees of freedom.
Table 5.
18:3 Isomer distribution. Entries are percentages of total integrated 18:3 FID signal and are the means of three independent determinations. Uncertainties are 95% confidence limits based on the t-distribution with 2 degrees of freedom.
| Jacaranda | Punica | Momordica | Impatiens | Tung | Calendula | Catalpa | |
|---|---|---|---|---|---|---|---|
| γ-Ln | 0.00 ± 0.00 | 0.00 ± 0.00 | 0.00 ± 0.00 | 0.00 ± 0.00 | 0.00 ± 0.00 | 0.00 ± 0.00 | 0.00 ± 0.00 |
| ttca | 0.00 ± 0.00 | 0.00 ± 0.00 | 0.00 ± 0.00 | 0.00 ± 0.00 | 0.00 ± 0.00 | 0.00 ± 0.00 | 0.09 ± 0.02 |
| cctb | 0.00 ± 0.00 | 0.00 ± 0.00 | 0.00 ± 0.00 | 0.51 ± 0.05 | 0.00 ± 0.00 | 0.00 ± 0.00 | 0.00 ± 0.00 |
| Ln | 1.25 ± 0.23 | 0.03 ± 0.00 | 0.03 ± 0.01 | 93.20 ± 0.13 | 0.08 ± 0.01 | 1.15 ± 0.02 | 1.63 ± 0.08 |
| 18:3x1 c | 0.00 ± 0.00 | 0.00 ± 0.00 | 0.00 ± 0.00 | 0.00 ± 0.00 | 0.08 ± 0.02 | 0.00 ± 0.00 | 0.32 ± 0.11 |
| Jacaric | 94.16 ± 0.43 | 0.00 ± 0.00 | 0.00 ± 0.00 | 0.00 ± 0.00 | 0.00 ± 0.00 | 0.15 ± 0.03 | 0.00 ± 0.00 |
| Punicic | 0.00 ± 0.00 | 94.80 ± 0.14 | 1.27 ± 0.00 | 0.02 ± 0.00 | 2.80 ± 0.04 | 0.00 ± 0.00 | 0.13 ± 0.05 |
| α-eleost. | 0.00 ± 0.00 | 3.92 ± 0.01 | 97.70 ± 0.26 | 6.22 ± 0.08 | 72.77 ± 1.04 | 0.00 ± 0.00 | 0.15 ± 0.06 |
| CLNAx1 d | 0.88 ± 0.21 | 0.00 ± 0.00 | 0.00 ± 0.00 | 0.00 ± 0.00 | 0.00 ± 0.00 | 0.04 ± 0.02 | 0.00 ± 0.00 |
| α-Calendic | 3.03 ± 0.16 | 0.00 ± 0.00 | 0.00 ± 0.00 | 0.00 ± 0.00 | 0.00 ± 0.00 | 97.89 ± 0.35 | 0.00 ± 0.00 |
| Catalpic | 0.00 ± 0.00 | 1.01 ± 0.08 | 0.03 ± 0.01 | 0.00 ± 0.00 | 1.18 ± 0.08 | 0.00 ± 0.00 | 96.83 ± 0.26 |
| β-eleost. | 0.00 ± 0.00 | 0.25 ± 0.07 | 0.98 ± 0.25 | 0.05 ± 0.00 | 23.08 ± 1.01 | 0.00 ± 0.00 | 0.86 ± 0.06 |
| β-Calendic | 0.68 ± 0.07 | 0.00 ± 0.00 | 0.00 ± 0.00 | 0.00 ± 0.00 | 0.00 ± 0.00 | 0.77 ± 0.29 | 0.00 ± 0.00 |
| Sum | 100.00 | 100.00 | 100.00 | 100.00 | 100.00 | 100.00 | 100.00 |
a 9t,12t,15c-18:3. b 9c,12c,15t-18:3. c Non-conjugated 18:3 isomer with other than 9,12,15 double bond configuration. d Probable 8c,10t,12t-18:3
Table 6.
18:4 Isomer distribution found for Impatiens b. Entries are percentages of total integrated 18:4 FID signal and are the means of three independent determinations. Uncertainties are 95% confidence limits based on the t-distribution with 2 degrees of freedom. α-parinaric is the FAME of 9c,11t,13t,15c-18:4. β-parinaric is the FAME of 9t,11t,13t,15t-18:4.
| α-parinaric | 80.74 ± 1.70 |
| CSDAx1 a | 13.21 ± 1.23 |
| CSDAx2 b | 5.35 ± 0.64 |
| β-parinaric | 0.70 ± 0.23 |
| Sum | 100.00 |
a Probable 9c,11t,13t,15t-18:4. b Probable 9t,11t,13t,15c-18:4.
Table 7.
20:1 Isomer distributions. Entries are percentages of total integrated 20:1 FID signal and are the means of three independent determinations. Uncertainties are 95% confidence limits based on the t-distribution with 2 degrees of freedom.
Table 7.
20:1 Isomer distributions. Entries are percentages of total integrated 20:1 FID signal and are the means of three independent determinations. Uncertainties are 95% confidence limits based on the t-distribution with 2 degrees of freedom.
| Jacaranda | Punica | Momordica | Impatiens | Tung | Calendula | Catalpa | |
|---|---|---|---|---|---|---|---|
| 20:1x1 a | 2.82 ± 0.63 | 4.24 ± 0.99 | 2.02 ± 0.32 | 8.02 ± 1.07 | 0.23 ± 0.12 | 2.99 ± 1.76 | 6.41 ± 1.60 |
| 20:1x2 b | 13.17 ± 0.57 | 5.25 ± 0.56 | 5.24 ± 0.92 | 18.40 ± 0.60 | 4.70 ± 0.06 | 3.79 ± 0.89 | 4.82 ± 1.44 |
| 11c | 84.01 ± 0.72 | 90.51 ± 0.50 | 92.74 ± 0.64 | 73.58 ± 1.62 | 95.07 ± 0.11 | 93.23 ± 2.40 | 88.78 ± 1.48 |
| Sum | 100.00 | 100.00 | 100.00 | 100.00 | 100.00 | 100.00 | 100.00 |
a Probable 13t-, 14t-, 6c-, or 7c-20:1. b Probable 9c-20:1, though 14t-20:1 cannot be excluded.
Publisher’s Note: MDPI stays neutral with regard to jurisdictional claims in published maps and institutional affiliations. |
© 2021 by the authors. Licensee MDPI, Basel, Switzerland. This article is an open access article distributed under the terms and conditions of the Creative Commons Attribution (CC BY) license (https://creativecommons.org/licenses/by/4.0/).
Share and Cite
MDPI and ACS Style
Goldschmidt, R.; Byrdwell, W. GC Analysis of Seven Seed Oils Containing Conjugated Fatty Acids. Separations 2021, 8, 51. https://0-doi-org.brum.beds.ac.uk/10.3390/separations8040051
AMA Style
Goldschmidt R, Byrdwell W. GC Analysis of Seven Seed Oils Containing Conjugated Fatty Acids. Separations. 2021; 8(4):51. https://0-doi-org.brum.beds.ac.uk/10.3390/separations8040051
Chicago/Turabian StyleGoldschmidt, Robert, and William Byrdwell. 2021. "GC Analysis of Seven Seed Oils Containing Conjugated Fatty Acids" Separations 8, no. 4: 51. https://0-doi-org.brum.beds.ac.uk/10.3390/separations8040051
Note that from the first issue of 2016, this journal uses article numbers instead of page numbers. See further details here.