Article

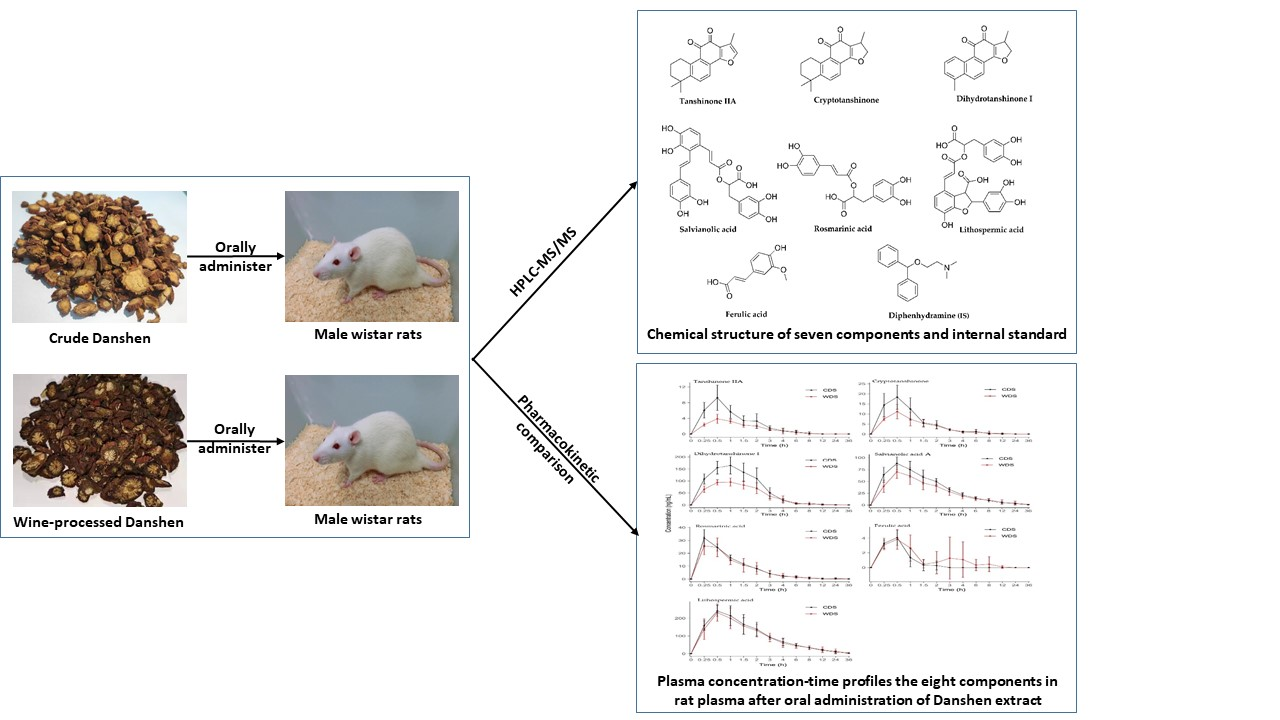
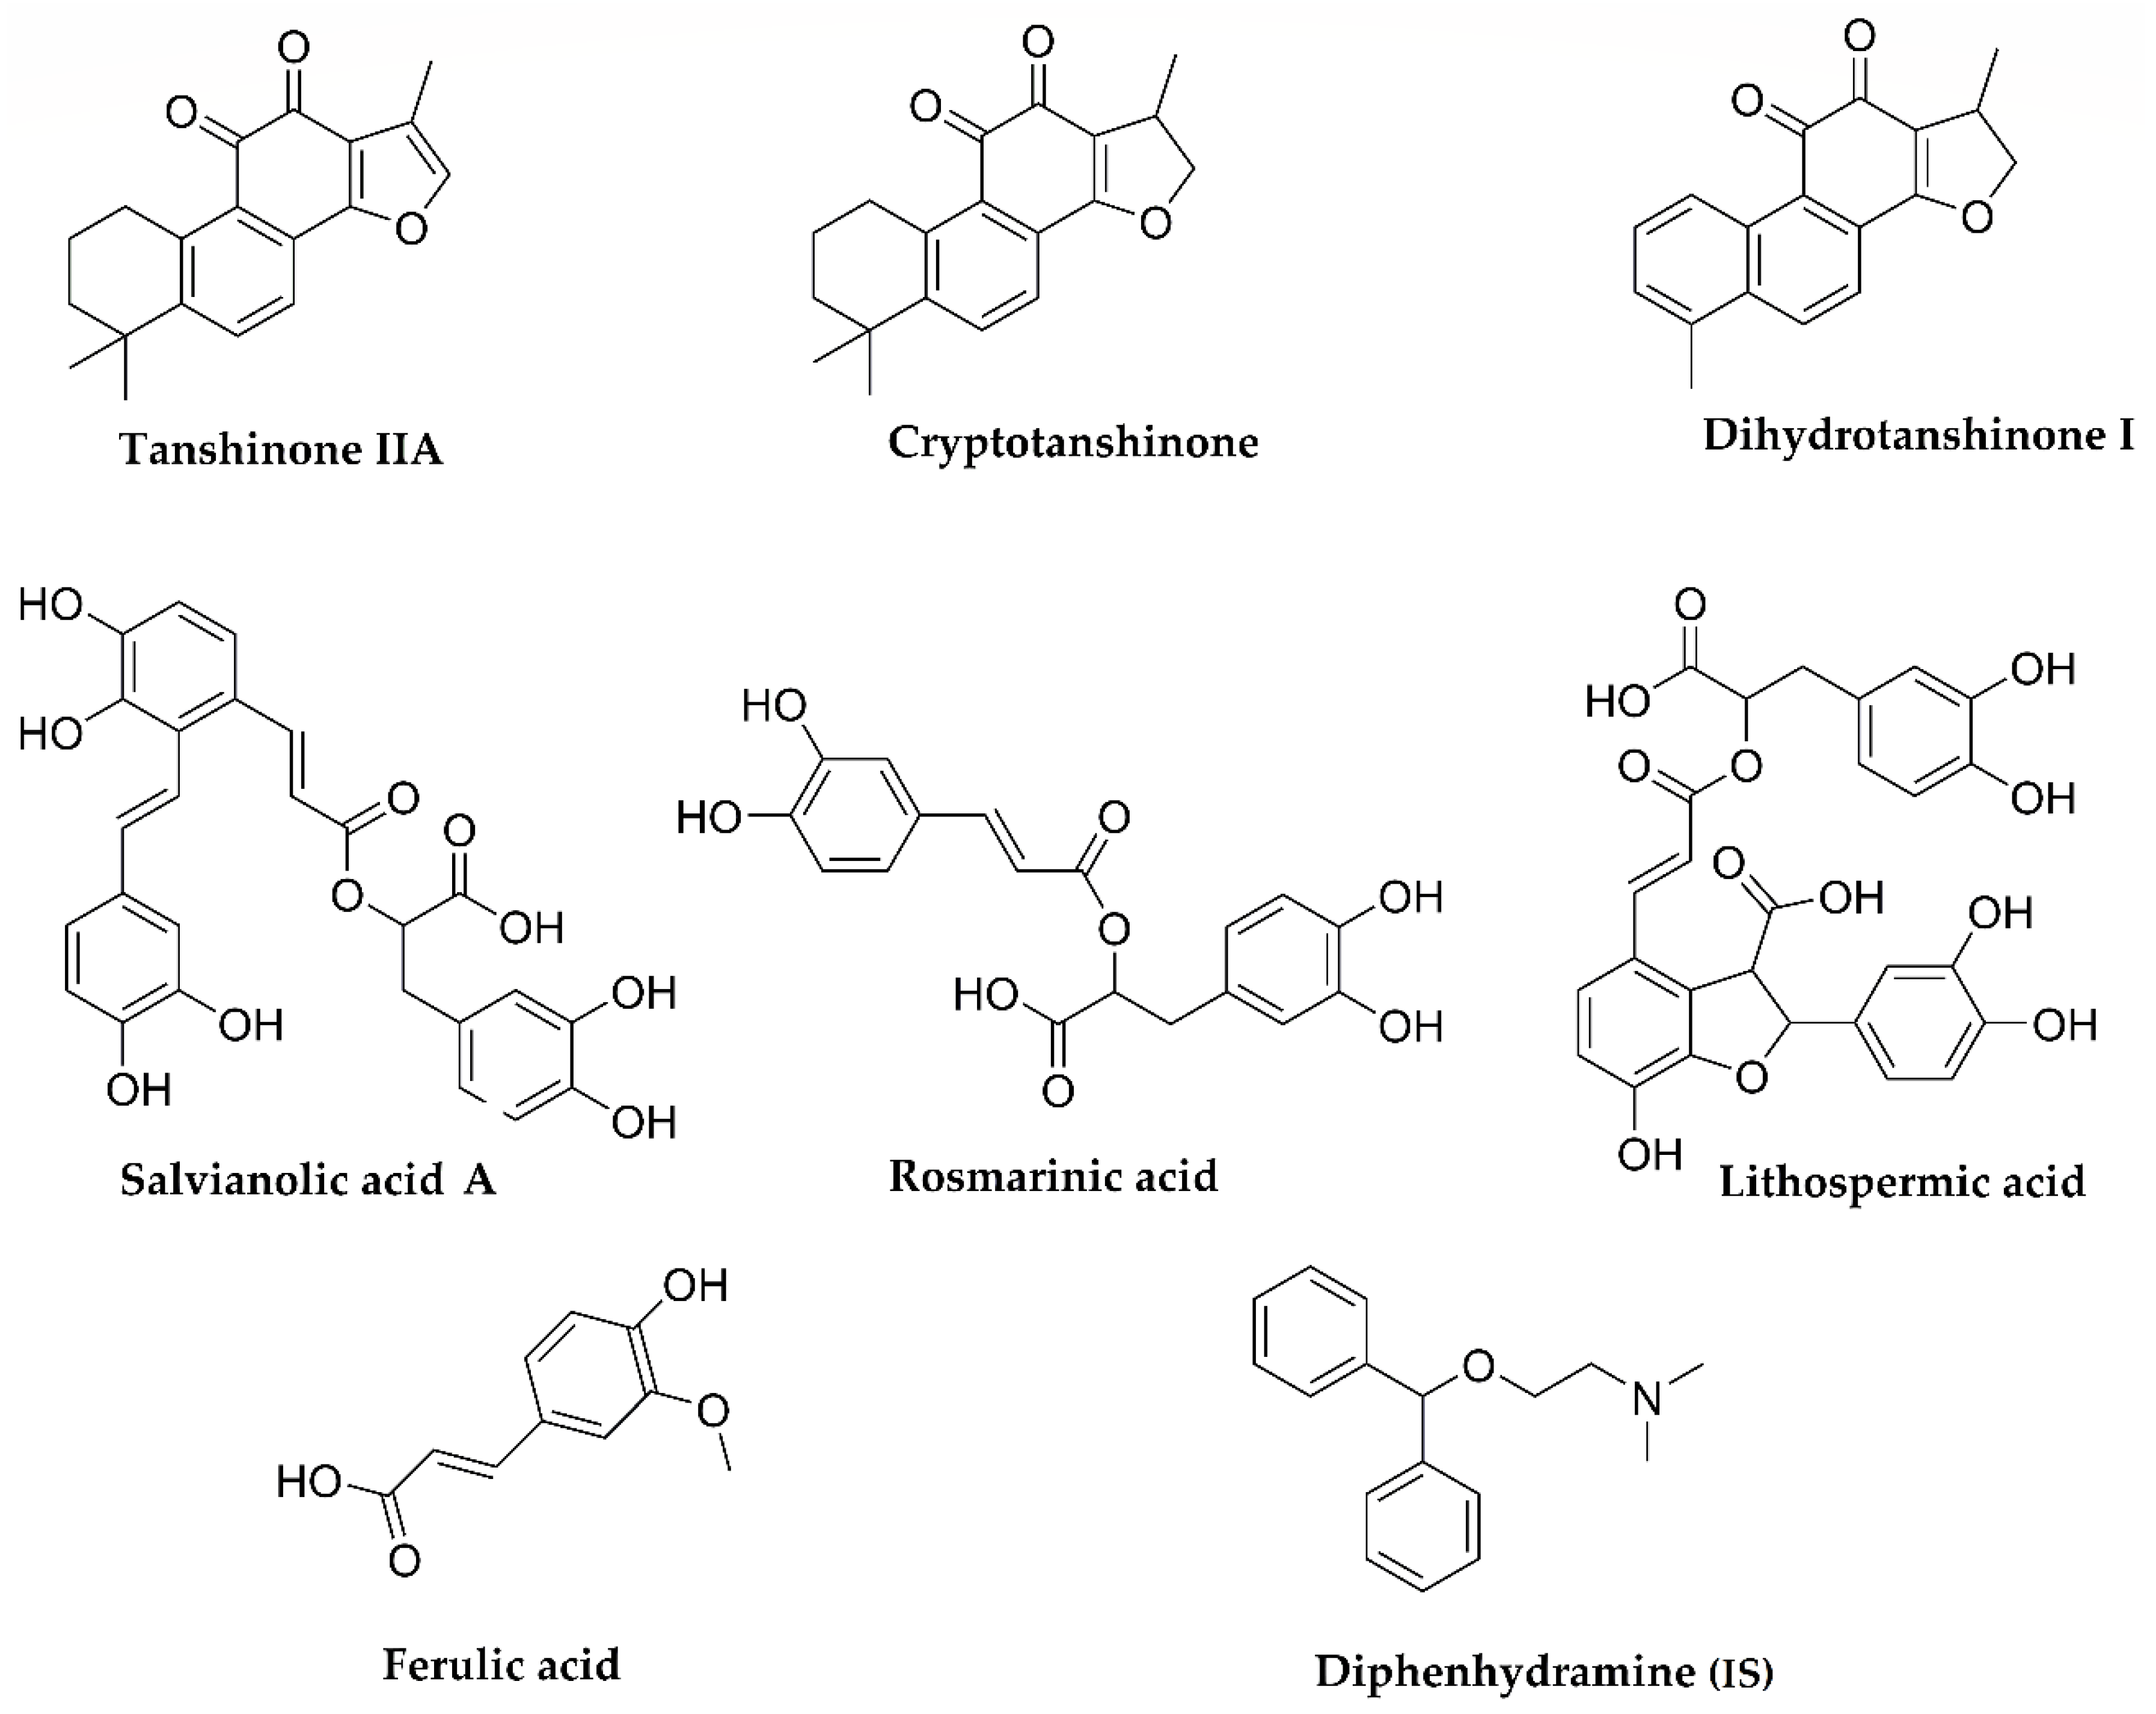
Simultaneous Determination of Seven Bioactive Constituents from Salvia miltiorrhiza in Rat Plasma by HPLC-MS/MS: Application to a Comparative Pharmacokinetic Study

1
Department of Pharmacy, Qilu Hospital of Shandong University, Cheeloo College of Medicine, Jinan 250012, China
2
Shandong Institute for Food and Drug Control, Jinan 250101, China
3
School of Pharmaceutical Sciences, Shandong University, Jinan 250012, China
4
College of Agriculture & Life Science, University of Wisconsin, Madison, WI 53706, USA
5
College of Pharmacy, Shandong University of Traditional Chinese Medicine, Jinan 250355, China
*
Authors to whom correspondence should be addressed.
Both these authors contribute equally to this work.
Submission received: 30 May 2021 / Revised: 25 June 2021 / Accepted: 25 June 2021 / Published: 29 June 2021
(This article belongs to the Collection State of the Art in Separation Science)

Abstract

:
The roots of Salvia miltiorrhiza (Danshen) is a precious herbal medicine used to treat cardiovascular diseases. This study establishes a high-performance liquid chromatography-tandem mass spectrometric (HPLC-MS/MS) method to quantify seven bioactive constituents from Danshen in rat plasma simultaneously. Chromatographic separation is performed on an Agilent Eclipse Plus C18 column (150 mm × 2.1 mm, 5 μm), utilizing a gradient of acetonitrile and 0.2% formic acid aqueous solution as the mobile phase, at a flow rate of 0.6 mL/min. We conduct a tandem mass spectrometric detection with electrospray ionization (ESI) interface via multiple reaction monitoring (MRM) in both positive and negative ionization mode. Our results show that a linear relationship is established for each analyte of interest over the concentration range of 0.5–300 ng/mL with r ≥ 0.9976. The validated method is successfully used to compare the pharmacokinetic properties of crude and wine-processed Danshen extract orally administered to rats. Cmax of tanshinone IIA, Cmax, and AUC0-t of dihydrotanshinone I decrease significantly (p < 0.05) in the wine-processed group. No significant changes for other compounds are observed. These results might provide meaningful information for the further application of wine-processed Danshen and understanding of wine-processing mechanisms.

Graphical Abstract

1. Introduction

Bioactive components of the roots of Salvia miltiorrhiza (Danshan) have been developed into various formulations clinically to treat microcirculatory disturbance-related diseases, such as heart disease, chronic hepatitis, diabetes, early cirrhosis, cerebral ischemia, and cancer [1,2,3]. Chemical investigation of Danshen in the past few years has revealed that two major types of secondary metabolites were responsible for its therapeutic effects: lipophilic tanshinones and hydrophilic phenolic acids [4,5]. These components exhibited multiple biological activities via different mechanisms. For example, tanshinone IIA and dihydrotanshinone I could enhance autophagy and induce proteasomal degradation of the Tau protein, resulting in increased Amyloid-β clearance and decreased Tau phosphorylation, making them potential candidates for AD treatment in the future [6,7]. Cryptotanshinone and tanshinone I exhibit vigorous antiviral activities against SARS-CoV-2 with IC50 values of 5.63 and 2.21 μmol/L, respectively [8]. Salvianolic acids, rosmarinic acid, caffeic acid, ferulic acid, and lithospermic acid are four representative hydrophilic phenolic acids isolated from Danshen [9,10]. Among them, salvianolic acid A can reduce cardiotoxicity induced by arsenic trioxide through decreasing cardiac mitochondrial injury and shows great potential against cancer cells via targeting various signaling pathways [11,12]. Rosmarinic acid, ferulic acid, and lithospermic acid play several biological roles, including free radical scavenger, inhibitor of prooxidant enzymes that catalyze free radical production, and enhancer of scavenger enzyme [13,14,15].
Pharmacokinetic description of the bioactive components in Danshen will provide scientific evidence regarding their properties of adsorption, distribution, metabolism, and excretion in vivo. Understanding the pharmacokinetic properties of each component enables prescribers to choose appropriate dose and dose intervals to ensure the safety and efficiency of drug application. HPLC–MS/MS method has been extensively applied to determine the pharmacokinetic profiles of different bioactive components from Danshen because of its high sensitivity and specificity [16,17,18]. An efficient UPLC/MS/MS method that employs isocratic elution and positive/negative ionization switching analysis, has been established for the determination of four salvianolic acids and four tanshinones in Danshen simultaneously in 2 min [19]. However, several aspects still need to be improved for their application in biological samples. Higher sensitivity and efficiency, as well as a larger concentration range for the quantification, remain to be achieved by optimizing the HPLC-MS/MS and sample pretreatment conditions.
Wine-processing is a traditional method for treating herbal medicine before clinical use to achieve multiple purposes: modify the taste, reduce the toxicity, and enhance the biological activity [20,21]. Wine-processed Danshen has been reported to possess enhanced blood—quickening and stasis—transforming, as well as antimicrobial activities. Although the crude and wine-processed Danshen exhibited different chemical profiles, detailed exploration of the chemical basis behind medicinal property changes after the processing has not been performed yet [22,23,24]. Moreover, a comparison between pharmacokinetic properties of crude and wine-processed Danshen in vivo, which is meaningful for their clinical reasonable application and understanding the wine-processing mechanism, has not been characterized yet.
In the current work, a sensitive and efficient method for simultaneous quantification of seven bioactive constituents from Danshen in plasma samples was developed and applied to compare the pharmacokinetic properties of crude and wine-processed Danshen extract orally administered to rats. Hydrophobic tanshinones, including tanshinone IIA, cryptotanshinine, and dihydrotanshinone I, as well as hydrophilic phenolic acids, including salvianolic acid A, rosmarinic acid, ferulic acid, and lithospermic acid (Figure 1), were simultaneously determined for the first time at a concentration range of 0.5–300 ng/mL with r ≥ 0.9976 in 8 min. Pharmacokinetic parameters, such as AUC, Cmax, and t1/2, were determined and compared. This will provide information about the influence of wine-processing on the pharmacokinetics, as well as the pharmacological activity of Danshen bioactive components.

2. Materials and Methods

2.1. Chemical Reagents

Danshen were collected from Jinan Green Chinese Herbal Pieces Co., (Jinan, Shandong, China) and authenticated by Professor Xu Lingchuan in the field. The wine-processed Danshen were collected from Shandong Jianlian Shengjia Traditional Chinese Medicine Co. (Jinan, Shandong, China) and authenticated by Professor Xu Lingchuan. Tanshinone IIA (Lot: 110766-200416), cryptotanshinone (Lot: 110852-201307), rosmarinic acid (Lot: 11871-201303), ferulic acid (Lot: 110773-200608), and diphenhydramine (Lot: 100066-200807) were purchased from China National Institutes for Food and Drug Control. Salvianolic acid A (Lot: B20260), lithospermic acid (Lot: B21683), and dihydrotanshinone I (Lot: B20357) were purchased from Shanghai Yuanye Biotechnology Co. Ultra-pure water and chemicals, such as acetonitrile and formic acid of analytical grade purity, were used in the experiment.

2.2. Instruments, Liquid Chromatography, and Mass Spectrometry Conditions

A Nanospace SI-2 HPLC system (Shiseido, Japan) equipped with a NASCA 5100 autosampler, a vacuum degasser unit, and a binary pump, and an Agilent C18 column (150 mm × 2.1 mm, 5 μm) were selected for chromatographic analysis. An API 5500 Q-Trap triple quadrupole mass spectrometer (AB SCIEX, Concord, ON, Canada) equipped with a TurboIonSpray source was used for mass detection. Data were processed on Analyst 1.5.2 software package. The solvent flow was diverted from the MS after the first minute of the gradient. Samples were ionized using an electrospray ion (ESI) source in both positive and negative mode. The ionization voltage for positive and negative mode was +4.5 kV and −4.0 kV, respectively. The source temperature was set at 55 °C. Nitrogen was used as the curtain gas (35 psi), nebulizer gas (GS1, 55 psi), and turbo gas (GS2, 55 psi).

2.3. Preparation of Calibration Standards, Internal Standard (IS), and Quality Control (QC) Samples

To prepare the stock solution of calibration standards and QC samples, all compounds were dissolved in acetonitrile to a final concentration of 1 mg/mL. The stock solutions were serially diluted with acetonitrile to prepare the working solutions of calibration standards and QC samples. The calibration standards were prepared by spiking a specific volume of the working solutions into the corresponding biological samples to yield a final concentration of 0.5, 1, 3, 5, 10, 30, 50, 100, and 300 ng/mL, respectively. Diphenhydramine at 400 ng/mL was used as the IS working solution. The low, medium, and high levels of QC samples containing analytes at the concentration of 0.5, 5, and 240 ng/mL were prepared in the same manner. All the solutions were stored at 4 °C for further use.

2.4. Preparation of Crude and Wine-Processed Danshen Extract

Extracts were prepared according to the following procedures. Powder of crude and wine-processed Danshen were firstly extracted twice by heating reflux at 80 °C for 2 h in 80% ethanol, and the extract was concentrated with rotary evaporation under vacuum at 60 °C. The residual was then extracted twice with water by heating reflux at 80 °C for 2 h and concentrated in the same manner. Extract obtained after the four extractions were combined and dried, and then crushed into powder for further experiments. The contents of tanshinone IIA, cryptotanshinone, dihydrotanshinone I, salvianolic acid A, rosmarinic acid, ferulic acid, and lithospermic acid were 28.3 ± 0.08, 19.6 ± 0.22, 64.0 ± 1.36, 217.0 ± 2.32, 505.0 ± 4.91, 14.9 ± 0.22, 1240.0 ± 13.5 ng/mg in crude Danshen extract, and 33.5 ± 1.13, 23.1 ± 1.07, 72.3 ± 1.39, 166.0 ± 3.56, 564.0 ± 4.97, 16.5 ± 0.43, 1010.0 ± 4.32 ng/mg in wine-processed Danshen extract, respectively.

2.5. Preparation and Handling of Biological Samples

An aliquot of 10 µL IS working solution (400 ng/mL) and 200 µL acetonitrile were added into a 20 µL plasma sample. The mixture was vortex mixed for 5 min to precipitate the proteins and then centrifuged at 14,000 rpm for 10 min at 4 °C. The supernatant was transferred to a 1.5 mL Eppendorf tube, and 5 μL of the supernatant was injected into the HPLC-MS/MS system for analysis.

2.6. Method Validation
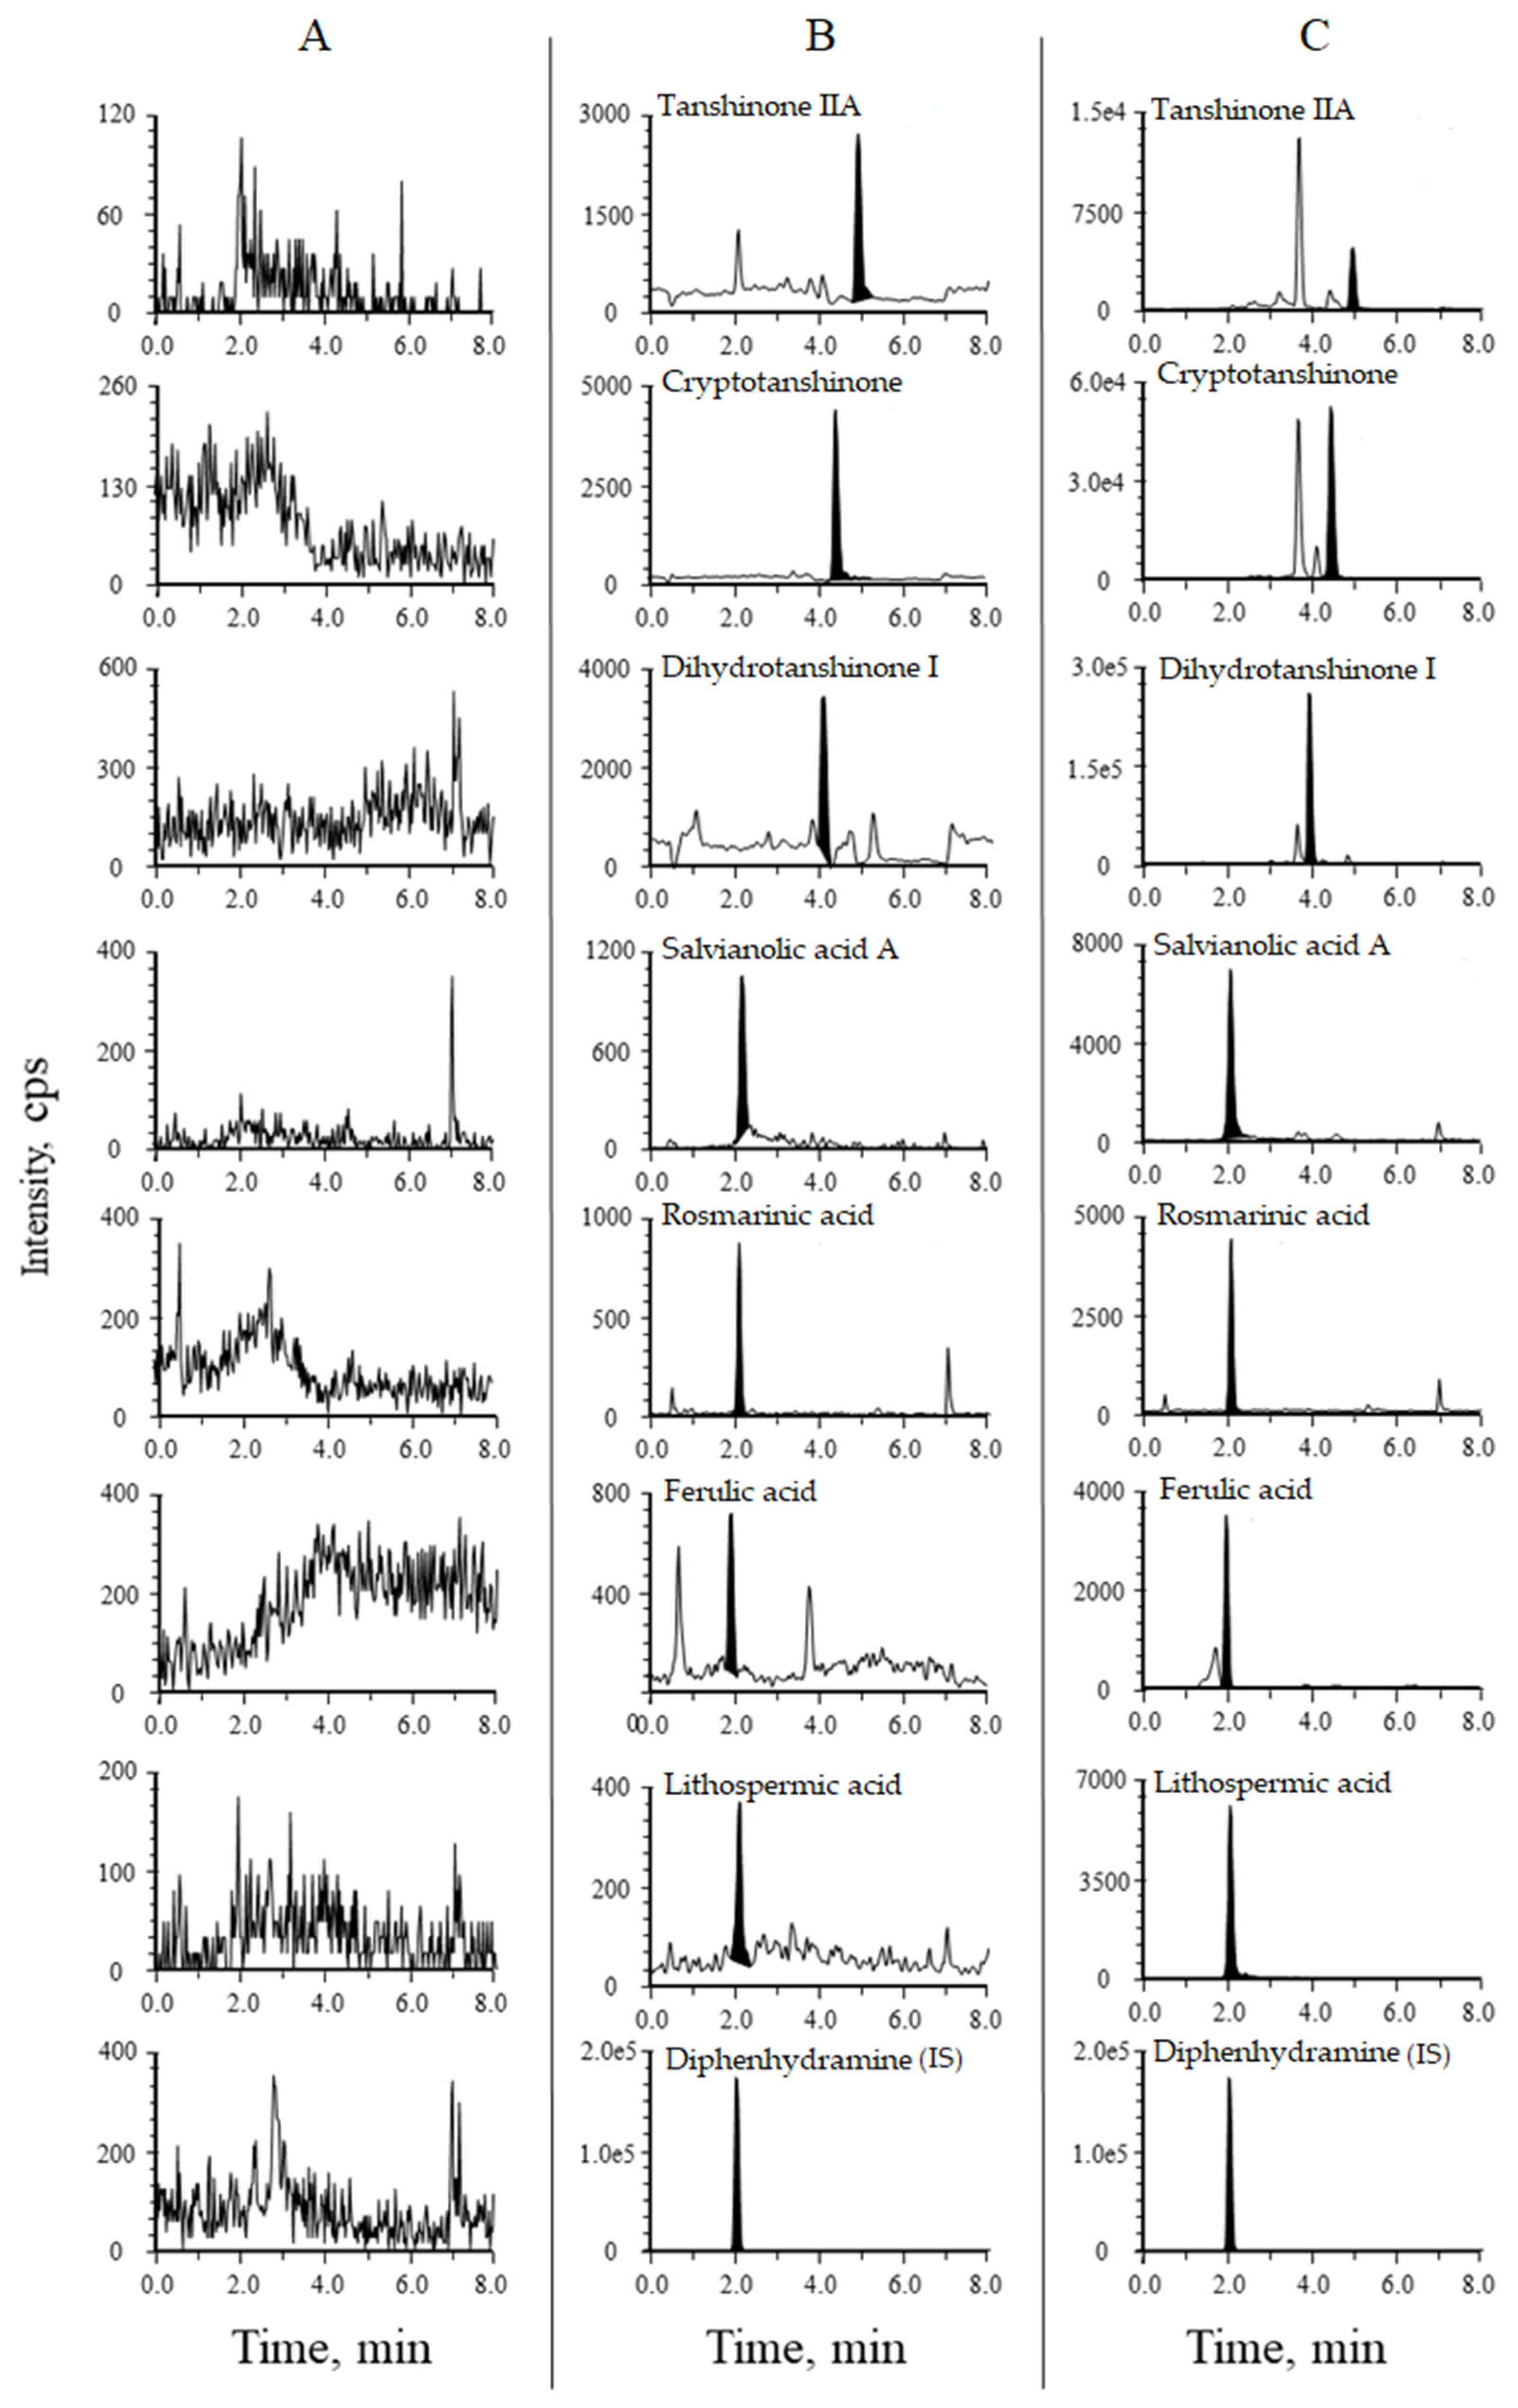
The HPLC-MS/MS method was developed and validated according to the Guidance for Industry Bioanalytical Method Validation [25]. The full validation, including selectivity, linearity, accuracy, precision, matrix effect, extraction recovery, and stability, was carried out in the plasma matrix.

2.6.1. Selectivity

To evaluate the selectivity of the method, the chromatogram of blank plasma samples from six different lots of rats was compared with those of corresponding plasma samples spiked with a standard solution of the seven analytes, and plasma samples after oral administration of Danshen extract.

2.6.2. Linearity and Lower Limit of Quantification (LLOQ)

The final concentration of calibration standards for plotting the calibration curve was 0.5, 1, 3, 5, 10, 30, 50, 100, and 300 ng/mL. The curve was plotted with the mass concentration of each drug in the plasma on the abscissa (X), and the peak area ratio of the drug to the IS on the ordinate (Y). The weighting factor 1/x2 was used for the best fit line of y = kx + c using linear regression analysis. The correlation coefficient (r) of 0.995 or better was considered as the best response for quantification analysis. The concentration of analytes in the QCs or test samples was calculated based on the regression parameters obtained from the calibration curves. The analyte response at the LLOQ should be at least 10 times of blank response.

2.6.3. Accuracy, Precision, and Recovery

Intra-day precision and accuracy were estimated at three different QC levels, i.e., 0.5, 5, and 240 ng/mL, by analyzing six replicates in a single day. The inter-day precision was determined by analyzing the three different QC samples on nine different runs in three consecutive days. Relative error (RE) and related standard deviation (RSD) were used to evaluate the accuracy and the precision, respectively. The mean values for RE and RSD should be within 15% of the actual value except at LLOQ, where it should not deviate from the mean value by more than 20%.
The recovery of each analyte at three different concentrations was evaluated by comparing the relative peak area of the analyte spiked in the rat plasma to that of the standard directly dissolved in solvent at the same concentration. The ratio gives the recovery.

2.6.4. Stability and Matrix Effect

The stability of the analytes was evaluated in triplicates at three different QC levels: 0.5 ng/mL, 5 ng/mL, and 240 ng/mL. A freeze-thaw stability experiment was performed by subjecting the QC samples to three freeze and thaw cycles from −80 °C to room temperature. Samples were left overnight in an autosampler setting at 4 °C or at room temperature for 4 h to evaluate their autosampler stability and benchtop stability. Bias was calculated against the freshly prepared QC samples. Samples with a difference within ±15% were considered stable. The matrix effect on the quantification of analytes was evaluated by comparing the peak area ratio of the analyte spiked in plasma samples to that of the standard directly dissolved in solvent at the same concentration.

2.7. Application to a Pharmacokinetic Study

Male Wistar rats (220–230 g, n = 12) used in the experiments were supplied by the Lab Animal Center of Shandong University (Grade II, Certificate No. SYXK 2013-0001). Rats fasted for 12 h before drug administration and for a further 2 h after dosing, and have free access to water during experiments. The experimental protocol was approved by the University Ethics Committee and conformed to the “Principles of Laboratory Animal Care” (NIH publication no. 85-23, revised 1985). The rats were randomly divided into two groups (six in each group) and conducted with a single oral dose of crude and wine-processed Danshen extract suspended in water (10 g/kg), respectively.
After oral administration, 150 μL of blood samples were collected from the jugular vein at different time points (before dosing and at 0.25, 0.5, 1.0, 1.5, 2.0, 4.0, 4.5, 6.0, 12.0, 24.0, and 48.0 h post-dosing) and put into heparinized tubes, which were centrifuged at 3000× g for 10 min at 4 °C. The supernatant was stored at −80 °C and analyzed using the method described above within one month. The plasma concentration of different drugs at different time points was determined based on the standard curve. The plasma drug concentration was plotted on the ordinate, and time was on the abscissa, yielding the concentration–time curves.
Parameters, including the peak plasma concentration (Cmax) and time to peak concentration (Tmax), were obtained from experimental observations. The other pharmacokinetic parameters were analyzed using the program TOPFIT (version 2.0; Thomae GmbH, Germany) according to a non-compartmental model. The linear trapezoidal rule to approximately the last point was used to calculate the area under the plasma concentration–time curve (AUC0-t). Dividing the area under the first moment–time curve (AUMC0-t) by the area under the curve (AUC0-t) yields the mean residence time (MRT). Total oral body clearance (CL/F) was calculated using the following equation: CL/F = dose/AUC0-t. All results were expressed as mean ± standard deviation (SD). Statistical comparisons between different groups were analyzed using SPSS version 20.0 (SPSS Inc., Chicago, IL, USA) by an analysis of variance (ANOVA).

3. Results and Discussion

3.1. Method Development

3.1.1. Optimization of the HPLC-MS/MS Conditions

Methanol-water or acetonitrile-water as the mobile phase in the gradient elution system was firstly compared in the aspects of retention time, signal intensity, and resolution. We found that the acetonitrile-water mobile phase system yielded chromatographic peaks with better resolution and intensity than methanol-water did. The addition of 0.2% formic acid into the mobile phase significantly increased the signal intensity of the eight compounds and improved their peak shapes. Thus, the acetonitrile (A)/water (B) with 0.2% formic acid was selected as the elution solvent system. The HPLC gradient system was set up as follows—13% of A for 0.5 min, then linearly increased to 90% of A in 2.5 min, and finally a decrease to 13% of A in 0.5 min prior to column re-equilibration. The total running lasted 8 min.
The standard solution of the seven analytes and the IS was separately introduced into the ESI source in either positive or negative ionization mode to determine the pattern of the most abundant ions in these compounds. The four phenolic acids showed an intense signal response and less noise in negative mode, while the three tanshinones and IS provided higher signal intensity in positive mode. Based on these results, we designed a segment-program to detect the eight compounds with the most vital signals in both positive and negative modes. Optimal MS parameters for the MRM scan mode were listed in Table 1.

3.1.2. Optimization of Extraction Procedure

Protein precipitation, solid-phase extraction, and liquid phase extraction are three commonly used methods for sample extraction. Protein precipitation using organic solvents has been widely accepted because of its high efficiency, convenience, and low cost [26,27]. In the current study, different organic solvents for protein precipitation were attempted during sample preparation. Finally, acetonitrile was selected because of its excellent efficiency, preferable recovery (87.3~105.6%), and little matrix effect. In the case of methanol, the recovery of rosmarinic acid, and lithospermic acid is relatively poor.

3.2. Method Validation

3.2.1. Specificity

Figure 2 shows the typical MRM chromatograms of blank plasma, blank plasma spiked with the seven analytes and IS, and the sample collected from rats at 1h after oral administration of crude Danshen extract. Peaks of all the seven components and IS, at the retention times of 4.89 min (tanshinone IIA), 4.45 min (cryptotanshinone), 4.00 min (dihydrotanshinone I), 2.10 min (salvianolic acid A), 2.09 min (rosmarinic acid), 1.97 min (ferulic acid), 2.09 min (lithospermic acid) and 2.23 min (IS), did not interfere with those from endogenous substances.

3.2.2. Linearity and LLOQ

The linear ranges, regression equations, and correlation coefficients of the seven analytes are shown in Table 2. All calibration curves exhibited good linearity over the concentration range from 0.5 ng/mL to 300 ng/mL with correlation coefficient (r) ranging from 0.9956 to 0.9976. Based on a signal peak-to-noise ratio = 10, the LLOQs for all the eight compounds were 0.5 ng/mL.

3.2.3. Precision, Accuracy

The intra-day and inter-day precisions (RSD) of the seven analytes at three different concentration levels ranged from 2.2% to 9.3%, while the accuracy (RE) of the samples ranged from −2.1% to 6.4% (Table 3). All these values were within the acceptable range, implying that the method was reproducible and reliable.

3.2.4. Extraction Recoveries and Matrix Effects

The extraction recoveries and matrix effects of the investigated analytes in rat plasma are shown in Table 3. The recovery rates of the investigated analytes ranged from 87.3% to 105.6%, with SD values lower than 8.7%, 7.9%, and 8.4% at three concentration levels, respectively. The matrix effects of the eight analytes of interest varied from 86.7% to 112.4%, with SD values lower than 7.1%, 6.8%, and 6.5% at low, medium, and high concentrations, respectively. These results suggested that the sample processing method for extraction of analytes from biological samples exhibited high efficiency, and the recoveries for all the eight analytes were in acceptable ranges. No significant matrix effect existed.

3.2.5. Stability

All the seven analytes were stable in rat plasma under different experimental conditions: 4 °C for 24 h (RE: −9.6~9.2%, RSD ≤ 9.8%), −80 °C for 30 days (RE: −8.8~9.2%, RSD ≤ 8.9%), and after three freeze thaw cycles at −20 °C (RE: −3.3~7.2%, RSD ≤ 8.6%). All the results were within the acceptance criteria of ±15% deviation from the nominal concentration (Table 4).

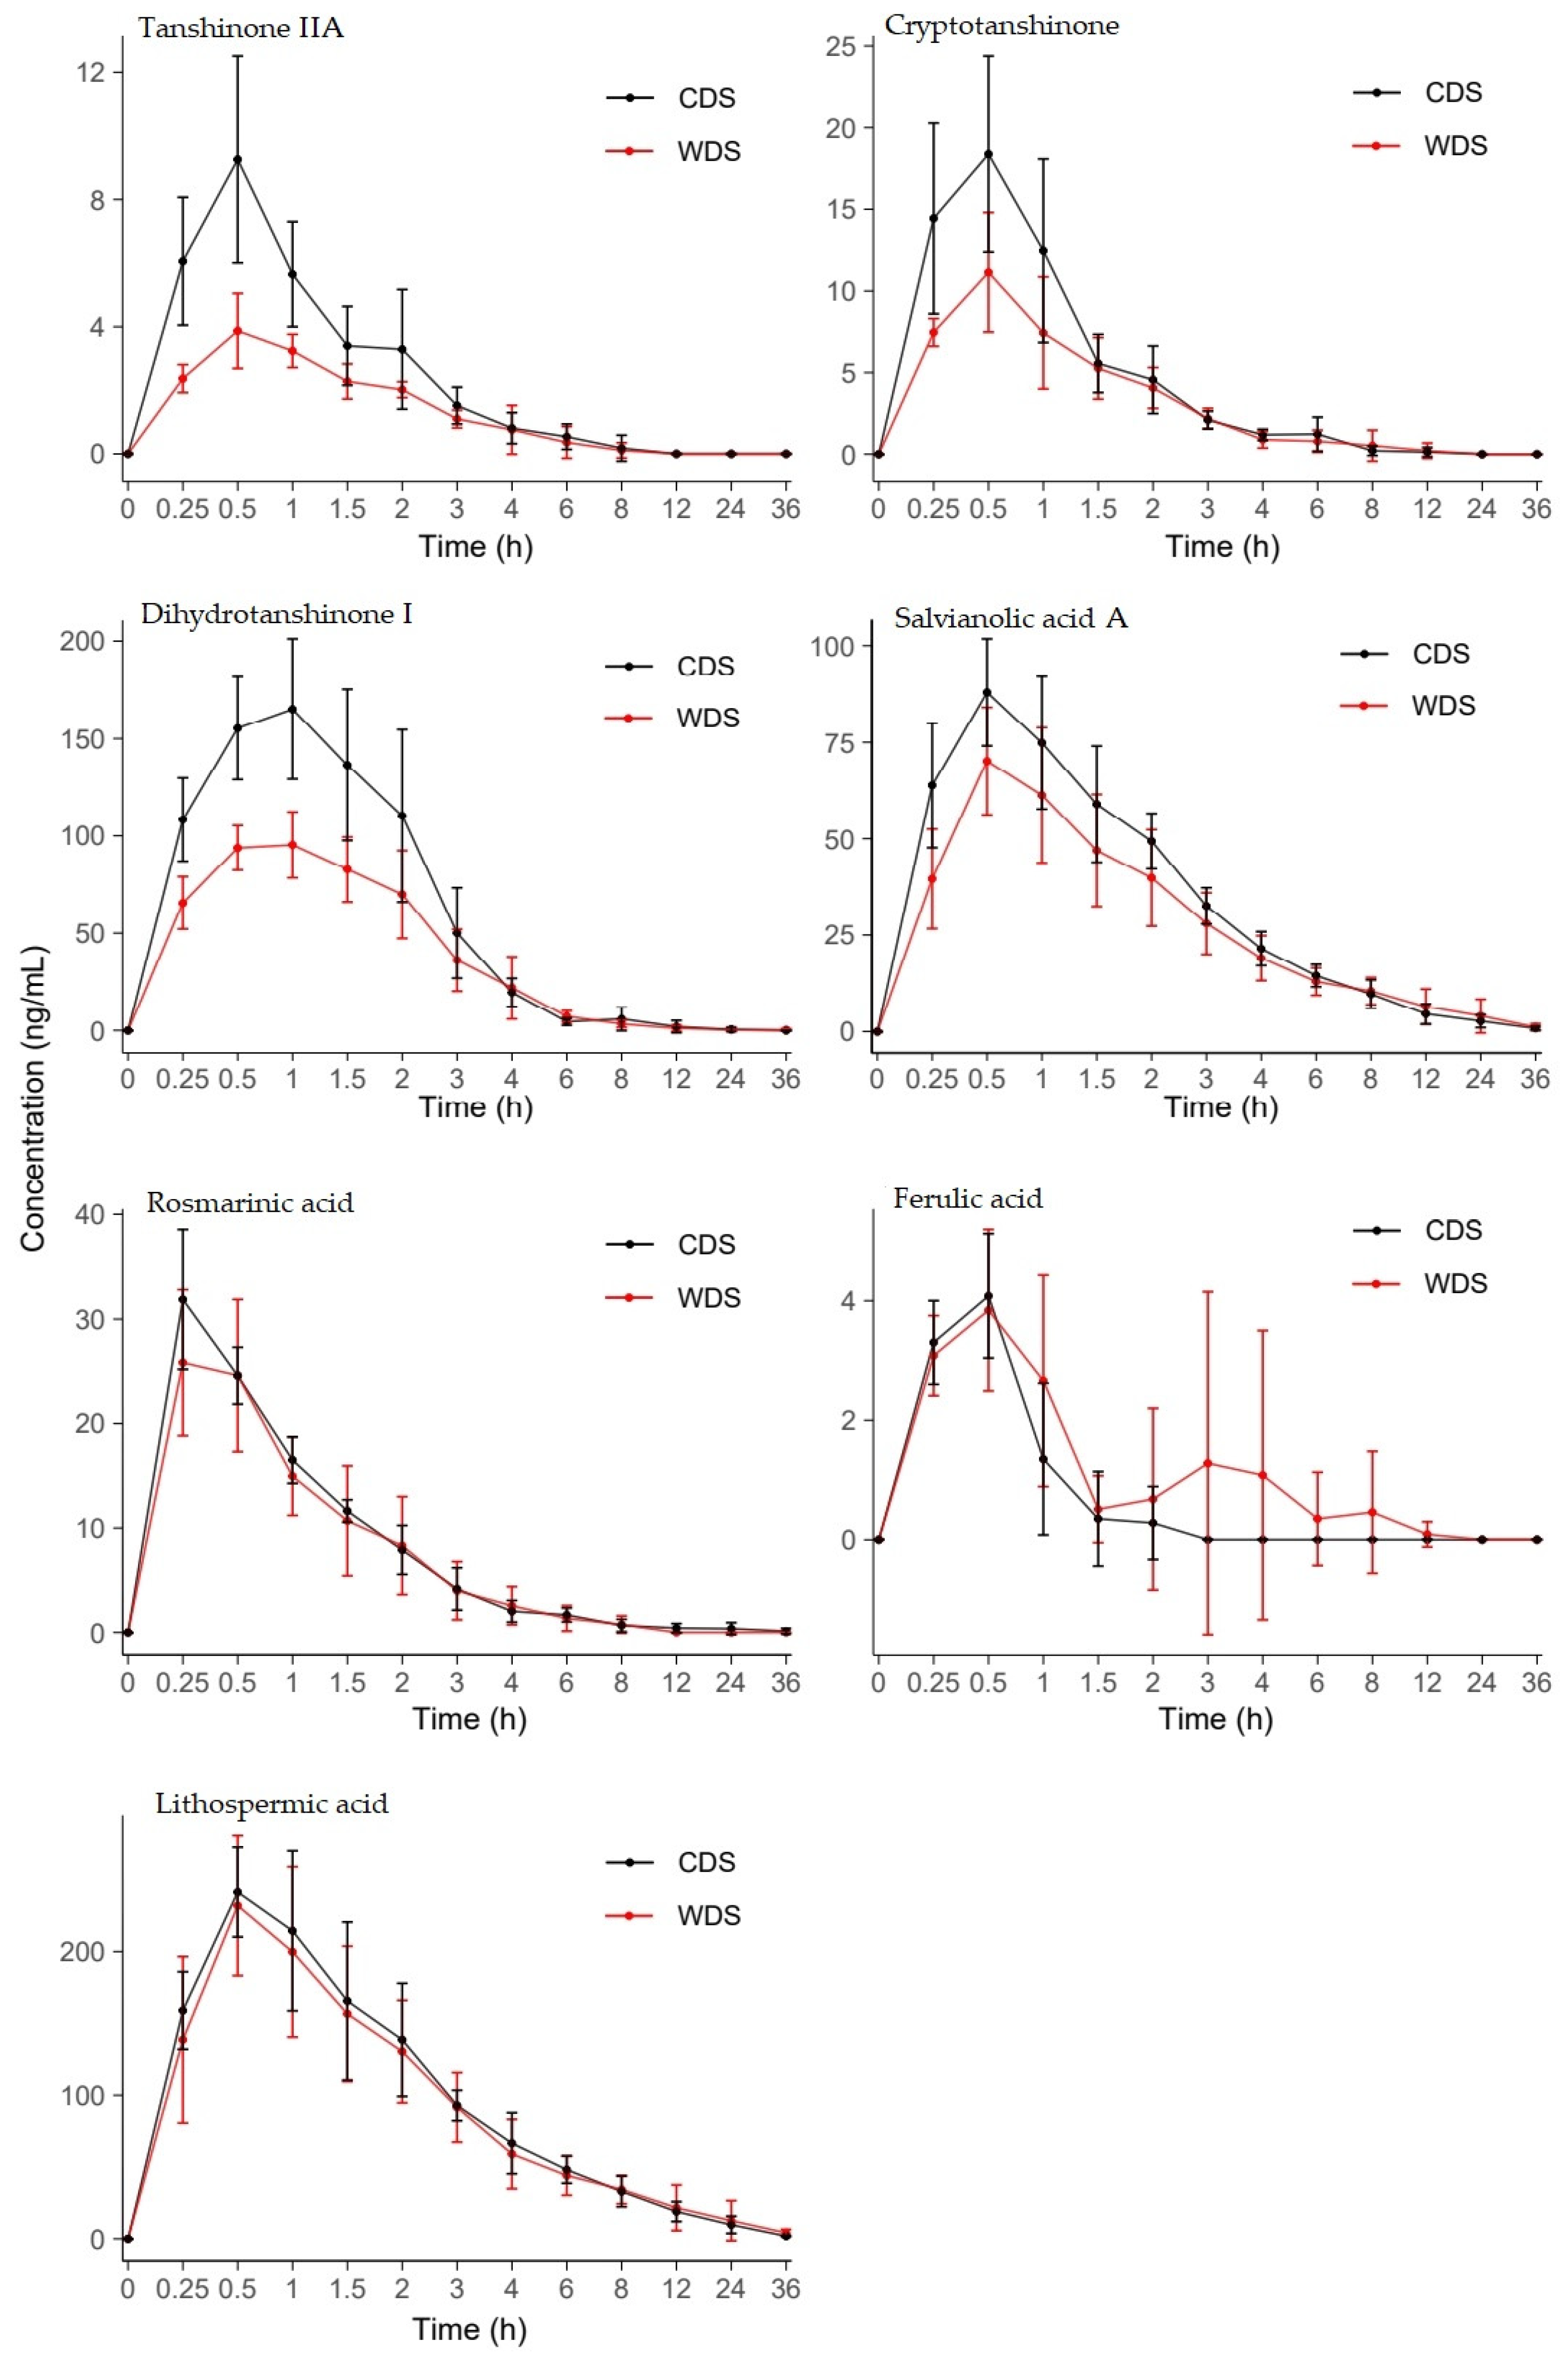
3.3. Pharmacokinetic Study

The above-validated method was successfully applied to a comparative pharmacokinetic study in rats after oral administration of crude and wine-processed Danshen extract at a dose of 10 g/kg. The mean plasma concentration-time profiles of seven analytes are plotted and presented in Figure 3. The main non-compartmental pharmacokinetic parameters are listed in Table 5.
Based on the concentration–time curves and the pharmacokinetic parameters, the effect of wine-processing on the pharmacokinetics of the seven ingredients of Danshen in the rats were examined. As shown in Figure 3, the plasma concentration of all the components reached maximum quickly (Tmax < 1 h), and wine-processing did not change the Tmax values significantly. Compared to the crude Danshen group, the Cmax of all the hydrophobic tanshinones decreased to some extent, and a significant decrease was observed for tanshinone IIA and dihydrotanshinone I (p < 0.05) in the wine-processed Danshen group. As to the hydrophilic acids, we did not see any obvious differences in Cmax between the two groups. In addition, the AUC0-t and AUC0- of dihydrotanshinone I decreased significantly; CL/F of salvianolic acid A and dihydrotanshinone I increased significantly in the wine-processed Danshen group.

4. Discussion and Conclusions

Danshen extract has been widely utilized in the treatment of cardiovascular-related diseases clinically [28]. Processing crude Danshen with wine has long been considered to enhance its biological activities; however, the mechanisms supported by adequate evidence are not clear yet. In the current study, we developed and optimized an HPLC-MS/MS method to simultaneously quantify seven bioactive components of Danshen in rat plasma for the first time. A model in which both positive and negative ions were detected simultaneously was built without losing the specificity and sensitivity (LLOQ = 0.5 ng/mL). Besides, the complete analysis takes a period as short as 8 min. With the sensitive method, a small quantity of biological sample (5 μL) at each time point was needed for the analysis, and no additional pre-column derivatization of the compounds was required. By employing a simple one-step protein precipitation approach for sample pretreatment and a relatively quick procedure for chromatographic separation (running time = 8 min), we were able to rapidly analyze the samples in a highly efficient manner. The establishment of the method is valuable for the quick quantification of various Danshen active components in biological samples, providing information about their pharmacokinetical behavior in vivo, explaining their efficiency model. Moreover, the study will direct the development of an analytical method for therapeutic monitoring the components, ensuring the safety and effectiveness of drug application.
Pharmacokinetic comparison between crude and wine-processed Danshen revealed that all the active ingredients in Danshen extract were absorbed fastly in vivo. This is consistent with their clinical application in the treatment of acute cardiovascular diseases. However, we observed significant decreases for Cmax of tanshinone IIA and dihydrotanshinone I, and AUC for dihydrotanshinone I in wine-processed Danshen group. These results were completely contrary to our initial expectations: increased contents of tanshinone IIA and dihydrotanshinone I in wine-processed Danshen would result in higher plasma maximum concentration and absorption. By referring to previous literature, we speculate that the results might be attributed to the faster tissue distribution of the components in wine-processed Danshen group after initial absorption. As reported, processing of Chuanxiong Rhizoma with wine significantly decreased the AUC0-t values of its four active compounds, while increased their apparent volume of distribution (Vd), indicating wider tissue distribution [29]. Wine-processing also modified the distribution model of some flavonoids in Radix scutellariae: increased distribution in the rat upper-energizer tissues (lung and heart) and decreased distribution in the rat middle-and lower-energizer tissues (spleen, liver, and kidney) [30]. Thus, wine-processing might enhance the biological activity of Danshen by accelerating its distribution into target tissues. Detailed mechanisms about drug distribution into different tissues still need to be further investigated in subsequent studies.
Regarding the four hydrophilic acids, no significant differences between the pharmacokinetic parameters were found between the crude and wine-processed Danshen. A second peak was observed in the plasma-concentration profile of ferulic acid in the WDS group. We then did literature searching and found that the bimodal phenomenon was widely observed in pharmacokinetic profiles of constituents from traditional herbal medicine, which was probably due to distribution, reabsorption, and enterohepatic circulation [31,32]. Therefore, we guess that the second peak for ferulic acid in WDS might also be attributed to the above reasons. Further study is required to demonstrate the underlying mechanism. Our findings indicate that wine-processing of Danshen may modify the pharmacokinetic properties of some active components. However, the modification is limited, which might restrict its application in clinics. Since processing traditional herbal medicines is time-consuming and sometimes expensive, comparative study of the in vivo efficiency and pharmacokinetics between crude and processed medicines is rather necessary and meaningful. Our finding will provide useful suggestions for the doctors about the reasonable application of crude or processed Danshen.

Author Contributions

Conceptualization, S.W. and H.L.; methodology, Y.Z. and W.C.; software, Y.Z. and N.W.; validation, Y.Z., W.C., H.L. and S.W.; formal analysis, Y.Z., N.W. and W.C.; investigation, Y.Z., W.K., N.W. and W.C.; resources, Y.Z. and W.C.; data curation, Y.Z., W.K., N.W., J.S. and W.C.; writing—original draft preparation, Y.Z.; writing—review and editing, Y.Z. and J.S.; visualization, Y.Z. and W.C.; supervision, S.W. and H.L.; project administration, S.W. and H.L.; funding acquisition, X.L., S.W. and H.L. All authors have read and agreed to the published version of the manuscript.

Funding

This research was funded by Key Research and Development Project of Shandong Province (2017GSF218049), Young Scholars Program of Shandong University (2018WLJH93), and National Natural Science Foundation of Shandong Province (ZR2020MH374).

Institutional Review Board Statement

The experimental protocol was approved by the University Ethics Committee and conformed to the “Principles of Laboratory Animal Care” (NIH publication no. 85-23, revised 1985).

Informed Consent Statement

Not Applicable.

Data Availability Statement

All Data is contained within the article.

Acknowledgments

The authors gratefully acknowledge Xu Lingchuan for Danshen authentication.

Conflicts of Interest

The authors declare no conflict of interest.

References

  1. Jung, I.; Kim, H.; Moon, S.; Lee, H.; Kim, B. Overview of salvia miltiorrhiza as a potential therapeutic agent for various diseases: An update on efficacy and mechanisms of action. Antioxidants 2020, 9, 857. [Google Scholar] [CrossRef]
  2. Fang, Z.; Zhang, M.; Liu, J.; Zhao, X.; Zhang, Y.; Fang, L. Tanshinone IIA: A Review of its Anticancer Effects. Front. Pharmacol. 2021, 11, 2189. [Google Scholar] [CrossRef]
  3. Li, Z.; Xu, S.; Liu, P. Salvia miltiorrhizaBurge (Danshen): A golden herbal medicine in cardiovascular therapeutics. Acta Pharmacol. Sin. 2018, 39, 802–824. [Google Scholar] [CrossRef] [PubMed] [Green Version]
  4. Cao, M.; Liu, Y.; Jiang, W.; Meng, X.; Zhang, W.; Chen, W.; Peng, D.; Xing, S. UPLC/MS-based untargeted metabolomics reveals the changes of metabolites profile of Salvia miltiorrhiza bunge during Sweating processing. Sci. Rep. 2020, 10, 1–10. [Google Scholar] [CrossRef] [PubMed]
  5. Wang, X.; Morris-Natschke, S.; Lee, K. New developments in the chemistry and biology of the bioactive constituents of Tanshen. Med. Res. Rev. 2007, 27, 133–148. [Google Scholar] [CrossRef] [PubMed]
  6. Cai, N.; Chen, J.; Bi, D.; Gu, L.; Yao, L.; Li, X.; Li, H.; Xu, H.; Hu, Z.; Liu, Q.; et al. Specific degradation of endogenous Tau protein and inhibition of Tau fibrillation by tanshinone IIA through the ubiquitin-proteasome pathway. J. Agric. Food Chem. 2020, 68, 2054–2062. [Google Scholar] [CrossRef]
  7. Ren, B.; Liu, Y.; Zhang, Y.; Zhang, M.; Sun, Y.; Liang, G.; Xu, J.; Zheng, J. Tanshinones inhibit hIAPP aggregation, disaggregate preformed hIAPP fibrils, and protect cultured cells. J. Mater. Chem. B 2017, 6, 56–67. [Google Scholar] [CrossRef] [PubMed]
  8. Zhao, Y.; Du, X.; Duan, Y.; Pan, X.; Sun, Y.; You, T.; Han, L.; Jin, Z.; Shang, W.; Yu, J.; et al. High-throughput screening identifies established drugs as SARS-CoV-2 PLpro inhibitors. Protein Cell 2021, 1–12. [Google Scholar] [CrossRef]
  9. Li, X.; Du, F.; Jia, W.; Olaleye, O.; Xu, F.; Wang, F.; Li, L. Simultaneous determination of eight Danshen polyphenols in rat plasma and its application to a comparative pharmacokinetic study of DanHong injection and Danshen injection. J. Sep. Sci. 2017, 40, 1470–1481. [Google Scholar] [CrossRef]
  10. Liu, X.; Jin, M.; Zhang, M.; Li, T.; Sun, S.; Zhang, J.; Dai, J.; Wang, Y. The application of combined 1 H NMR-based metabolomics and transcriptomics techniques to explore phenolic acid biosynthesis in Salvia miltiorrhiza Bunge. J. Pharm. Biomed. Anal. 2019, 172, 126–138. [Google Scholar] [CrossRef]
  11. Zhang, C.; Pan, Y.; Cai, R.; Guo, S.; Zhang, X.; Xue, Y.; Wang, J.; Huang, J.; Wang, J.; Gu, Y.; et al. Salvianolic acid A increases the accumulation of doxorubicin in brain tumors through Caveolae endocytosis: The regulatory mechanism of BTB permeability induced by Salvianolic acid A. Neuropharmacology 2020, 167, 107980. [Google Scholar] [CrossRef] [PubMed]
  12. Yang, Z.; Chen, Y.; Yan, Z.; Xu, T.; Wu, X.; Pi, A.; Liu, Q.; Chai, H.; Li, S.; Dou, X. Inhibition of TLR4/MAPKs pathway contributes to the protection of salvianolic acid A against lipotoxicity-induced myocardial damage in cardiomyocytes and obese mice. Front. Pharmacol. 2021, 12, 76. [Google Scholar] [CrossRef]
  13. Chan, K.; Ho, W. Shing Anti-oxidative and hepatoprotective effects of lithospermic acid against carbon tetrachloride-induced liver oxidative damage in vitro and in vivo. Oncol. Rep. 2015, 34, 673–680. [Google Scholar] [CrossRef] [PubMed] [Green Version]
  14. Singh, Y.; Rai, H.; Singh, G.; Singh, G.; Mishra, S.; Kumar, S.; Srikrishna, S.; Modi, G. A review on ferulic acid and analogs based scaffolds for the management of Alzheimer’s disease. Eur. J. Med. Chem. 2021, 215, 113278. [Google Scholar] [CrossRef] [PubMed]
  15. Li, M.; Cui, M.; Kenechukwu, N.; Gu, Y.; Chen, Y.; Zhong, S.; Gao, Y.; Cao, X.; Wang, L.; Liu, F.; et al. Rosmarinic acid ameliorates hypoxia/ischemia induced cognitive deficits and promotes remyelination. Neural Regen. Res. 2020, 15, 894–902. [Google Scholar] [CrossRef]
  16. Ma, W.; Peng, Y.; Wang, W.; Bian, Q.; Wang, N.; Lee, D.Y.W.; Dai, R. Pharmacokinetic comparison of five tanshinones in normal and arthritic rats after oral administration of Huo Luo Xiao Ling Dan or its single herb extract by UPLC-MS/MS. Biomed. Chromatogr. 2016, 30, 1573–1581. [Google Scholar] [CrossRef]
  17. Lu, P.; Xing, Y.; Xue, Z.; Ma, Z.; Zhang, B.; Peng, H.; Zhou, Q.; Liu, H.; Liu, Z.; Li, J. Pharmacokinetics of salvianolic acid B, rosmarinic acid and Danshensu in rat after pulmonary administration of Salvia miltiorrhiza polyphenolic acid solution. Biomed. Chromatogr. 2019, 33, e4561. [Google Scholar] [CrossRef]
  18. Xie, X.; Miao, J.; Sun, W.; Huang, J.; Li, D.; Li, S.; Tong, L.; Sun, G. Simultaneous determination and pharmacokinetic study of four phenolic acids in rat plasma using UFLC–MS/MS after intravenous administration of salvianolic acid for injection. J. Pharm. Biomed. Anal. 2017, 134, 53–59. [Google Scholar] [CrossRef]
  19. Lin, H.; Lin, T.; Chien, H.; Juang, Y.; Chen, C.; Wang, C.; Lai, C. A rapid, simple, and high-throughput UPLC-MS/MS method for simultaneous determination of bioactive constituents in Salvia miltiorrhiza with positive/negative ionization switching. J. Pharm. Biomed. Anal. 2018, 161, 94–100. [Google Scholar] [CrossRef]
  20. Su, T.; Yu, H.; Kwan, H.; Ma, X.; Cao, H.; Cheng, C.; Leung, A.; Chan, C.; Li, W.; Cao, H.; et al. Comparisons of the chemical profiles, cytotoxicities and anti-inflammatory effects of raw and rice wine-processed Herba Siegesbeckiae. J. Ethnopharmacol. 2014, 156, 365–369. [Google Scholar] [CrossRef]
  21. Sun, T.; Zhang, H.; Li, Y.; Liu, Y.; Dai, W.; Fang, J.; Cao, C.; Die, Y.; Liu, Q.; Wang, C.; et al. Physicochemical properties and immunological activities of polysaccharides from both crude and wine-processed Polygonatum sibiricum. Int. J. Biol. Macromol. 2020, 143, 255–264. [Google Scholar] [CrossRef] [PubMed]
  22. Huang, Z.; Jiang, M.; Yi, Y.; Zeng, R.; Huang, Y.; Wu, P. Effects of Processed Radix Salviae Miltiorrhizae and Radix et Rhizoma Rhei with Wine on Functions of Blood Platelet and Anticoagulation of Rat. Chin. Tradit. Pat. Med. 2001, 23, 341–342. [Google Scholar] [CrossRef]
  23. Li, C.; Zhao, L.; Yang, Y.; Kang, W. Antimicrobial activity of Salvia miltiorrhiza and different processed products. Chin. Tradit. Pat. Med. 2011, 33, 1948–1951. [Google Scholar] [CrossRef]
  24. Cui, W.; Li, H.; Zhang, X.; Song, M.; Diao, J.; Zhang, D.; Wang, X. Analysis of five qualitative change compounds before and after wine processing of Salvia miltiorrhiza by UPLC-QE/MS. Chin. Tradit. Pat. Med. 2019, 41, 844–849. [Google Scholar] [CrossRef]
  25. FDA Guidance for Industry Bioanalytical Method Validation Guidance for Industry Bioanalytical Method Validation. 2018, 1–44. Available online: https://www.fda.gov/regulatory-information/search-fda-guidance-documents/bioanalytical-method-validation-guidance-industry.
  26. Zhang, D.; Sun, L.; Li, H.; Cui, Y.; Liu, S.; Wu, P.; Zhao, D.; Zhao, P.; Zhang, X. Pharmacokinetic comparison of nine bioactive components in rat plasma following oral administration of raw and wine-processed Ligustri Lucidi Fructus by ultra-high-performance liquid chromatography coupled with triple quadrupole mass spectrometry. J. Sep. Sci. 2020, 43, 3995–4005. [Google Scholar] [CrossRef] [PubMed]
  27. Shi, B.; Li, Q.; Feng, Y.; Dai, X.; Zhao, R.; Zhao, Y.; Jia, P.; Wang, S.; Yu, J.; Liao, S.; et al. Pharmacokinetics of 13 active components in a rat model of middle cerebral artery occlusion after intravenous injection of Radix Salviae miltiorrhizae-Lignum dalbergiae odoriferae prescription. J. Sep. Sci. 2020, 43, 531–546. [Google Scholar] [CrossRef]
  28. Hung, Y.; Wang, P.; Lin, T.; Yang, P.; You, J.; Pan, T. Functional redox proteomics reveal that salvia miltiorrhiza aqueous extract alleviates adriamycin-induced cardiomyopathy via inhibiting ROS-dependent apoptosis. Oxid. Med. Cell. Longev. 2020, 2020, 5136934. [Google Scholar] [CrossRef]
  29. Ning, Y.; Pei, K.; Cao, G.; Cai, H.; Liu, X.; Cao, L.; Zhang, S.; Cai, B. Comparative study on pharmacokinetics of four active compounds in rat plasma after oral administration of raw and wine processed chuanxiong rhizoma. Molecules 2020, 25, 93. [Google Scholar] [CrossRef] [PubMed] [Green Version]
  30. Huang, P.; Tan, S.; Zhang, Y.; Li, J.; Chai, C.; Li, J.; Cai, B. The effects of wine-processing on ascending and descending: The distribution of flavonoids in rat tissues after oral administration of crude and wine-processed Radix scutellariae. J. Ethnopharmacol. 2014, 155, 649–664. [Google Scholar] [CrossRef] [PubMed]
  31. Du, Y.; He, B.; Li, Q.; He, J.; Wang, D.; Bi, K. Simultaneous determination of multiple active components in rat plasma using ultra-fast liquid chromatography with tandem mass spectrometry and application to a comparative pharmacokinetic study after oral administration of Suan-Zao-Ren decoction and Suan-Zao-Ren granule. J. Sep. Sci. 2017, 40, 2097–2106. [Google Scholar] [CrossRef] [PubMed]
  32. Zhang, H.; Hu, X.; Qiao, M.; Li, Y.; Cao, S.; Ding, L.; Feng, X.; Kang, N.; Zhang, D.; Qiu, F. Simultaneous determination of five isoflavones in rat plasma by LC-MS/MS: Comparative pharmacokinetic characteristics of Puerariae lobatae radix in normal and type 2 diabetic rats. J. Sep. Sci. 2019, 42, 2592–2601. [Google Scholar] [CrossRef] [PubMed]
Figure 1. Chemical structure of seven components and internal standards (IS): Tanshinone IIA; cryptotanshinone; dihydrotanshinone I; salvianolic acid A; rosmarinic acid; lithospermic acid; ferulic acid and diphenhydramine (IS).
Separations 08 00093 g001
Figure 2. Representative MRM chromatograms of blank rat plasma (A); blank plasma spiked with seven analytes and IS (B); rat plasma sample collected at 1 h after oral administration of Danshen extract (C). Tanshinone IIA, cryptotanshinone, dihydrotanshinone I and IS were detected in positive mode. Salvianolic acid A, rosmarinic acid, ferulic acid, and lithospermic acid were detected in negative mode.
Separations 08 00093 g002
Figure 3. Mean (±SD, n = 6) plasma concentration-time profiles of tanshinone IIA, cryptotanshinone, dihydrotanshinone I, salvianolic acid A, rosmarinic acid, ferulic acid, and lithospermic acid in rat plasma after oral administration of crude danshen (black) and wine-processed Danshen extracts (red). CDS, crude Danshen; WDS, wine-processed Danshen.
Separations 08 00093 g003
Table 1. MRM transitions and parameters for detecting tanshinone IIA, cryptotanshinone, dihydrotanshinone I, salvianolic acid A, rosmarinic acid, ferulic acid, lithospermic acid, and diphenhydramine.
AnalytesESI ModePrecursor Ion (m/z)Product Ion (m/z)DPCE
Tanshinone IIApositive295.1277.213026
Cryptotanshinonepositive297.1279.110029
Dihydrotanshinone Ipositive279.1261.220022
Salvianolic acid Anegative493.3295.1−100−24
Rosmarinic acidnegative359.1293.1−150−33
Ferulic acidnegative193.1134.1−100−26
Lithospermic acidnegative537.1493.1−68−11
ISpositive256.2167.120016
Abbreviations: ESI, electrospray ion; CE, collision energy; DP, declusting potential.
Table 2. Linear ranges, regression equations, and correlation coefficients of tanshinone IIA, cryptotanshinone, dihydrotanshinone I, salvianolic acid A, rosmarinic acid, ferulic acid, and lithospermic acid in rat plasma.
AnalytesConcentration Range (ng/mL)Regression EquationCorrelation Coefficient (r)
Tanshinone IIA0.5−300Y = 0.828X + 0.01370.997
Cryptotanshinone0.5−300Y = 0.125X + 0.07440.996
Dihydrotanshinone I0.5−300Y = 0.0695X − 0.02050.997
Salvianolic acid A0.5−300Y = 0.00478X + 0.01370.996
Rosmarinic acid0.5−300Y = 0.00434X + 0.004340.998
Ferulic acid0.5−300Y = 0.00332X + 0.001740.997
Lithospermic acid0.5−300Y = 0.000721X + 0.003760.996
Table 3. Summary of precision, accuracy, recovery, and matrix effect of tanshinone IIA, cryptotanshinone, dihydrotanshinone I, salvianolic acid A, rosmarinic acid, ferulic acid, and lithospermic acid in rat plasma (n = 9, three consecutive days).
AnalytesSpiked
(ng/mL)
Intra-Day Precision
RSD (%)
Inter-Day Precision
RSD (%)
Intra-Day
Accuracy
RE (%)
Recovery
Mean ± SD (%)
Matrix Effect
Mean ± SD (%)
Tanshinone IIA0.56.27.46.487.4 ± 5.0109.1 ± 3.4
5.05.25.84.389.4 ± 6.5105.4 ± 4.2
2403.44.24.791.7 ± 4.2110.3 ± 2.5
Cryptotanshinone0.57.88.92.785.3 ± 7.6102.5 ± 1.7
5.05.94.2−1.589.2 ± 3.492.3 ± 2.5
2404.75.24.691.3 ± 6.197.4 ± 6.4
Dihydrotanshinone I0.58.16.7−2.189.4 ± 6.991.4 ± 7.1
5.03.55.56.291.2 ± 7.593.9 ± 2.0
2404.35.75.592.6 ± 8.498.1 ± 5.5
Salvianolic acid A0.57.29.33.2106.7 ± 8.796.4 ± 4.1
5.06.85.70.887.9 ± 2.4106.5 ± 3.4
2404.63.62.9105.4 ± 4.7103.7 ± 3.6
Rosmarinic acid0.54.15.24.594.6 ± 4.289.4 ± 5.7
5.02.42.21.492.7 ± 5.191.6 ± 6.8
2403.35.82.6102.5 ± 7.895.5 ± 1.5
Ferulic acid0.59.28.75.587.3 ± 5.4112.4 ± 2.4
5.06.56.76.291.6 ± 4.7104.8 ± 5.1
2404.75.55.496.5 ± 6.4105.4 ± 2.8
Lithospermic acid0.57.16.52.7105.6 ± 8.792.4 ± 3.4
5.05.67.65.596.8 ± 7.989.7 ± 4.8
2402.84.06.290.9 ± 6.286.7 ± 6.5
IS400N.D.N.D.N.D.94.7 ± 5.4N.D.
Table 4. Stability of tanshinone IIA, cryptotanshinone, dihydrotanshinone I, salvianolic acid A, rosmarinic acid, ferulic acid, and lithospermic acid in rat plasma samples (n = 5).
AnalytesSpiked
(ng/mL)
Stability at 4 °C for 24 hStability at −80 °C for 30 DaysFreeze-Thaw Stability
(RSD, %)(RE, %)(RSD, %)(RE, %)(RSD, %)(RE, %)
Tanshinone IIA0.56.84.04.13.66.73.1
5.05.9−2.44.86.85.9−2.8
2406.5−2.61.62.03.04.8
Cryptotanshinone0.58.0−7.28.95.68.32.4
5.03.69.26.56.47.06.4
2403.22.45.9−3.72.81.9
Dihydrotanshinone I0.59.8−2.47.4−5.26.7−1.2
5.04.55.64.30.83.74.8
2401.91.94.03.23.04.3
Salvianolic acid A0.55.26.06.01.26.42.8
5.06.12.43.67.26.8−2.8
2401.7−0.94.8−3.64.6−3.3
Rosmarinic acid0.58.2−1.26.7−8.84.9−1.2
5.02.93.25.14.82.87.6
2401.32.53.64.13.04.3
Ferulic acid0.53.7−9.67.66.08.07.2
5.05.35.65.25.67.34.0
2403.23.66.21.54.43.0
Lithospermic acid0.57.24.83.51.64.08.4
5.03.58.44.29.28.63.6
2403.00.95.42.32.93.9
Table 5. Pharmacokinetic parameters of tanshinone IIA, cryptotanshinone, dihydrotanshinone I, salvianolic acid A, rosmarinic acid, ferulic acid, and lithospermic acid in rats after oral administration of crude Danshen and wine-processed Danshen (n = 6, mean ± SD) a.
AnalytesDoses
(mg/kg)
AUC0-t b
(ng·h/mL)
AUC0-
(ng·h/mL)
Cmax
(ng/mL)
CL/F
(L/h/kg)
Tmax
(h)
MRT
(h)
T1/2
(h)
CDSTanshinone IIA0.28315.80 ± 5.6215.80 ± 5.629.36 ± 3.17 *21.23 ± 9.600.58 ± 0.191.70 ± 0.291.73 ± 0.44
Cryptotanshinone0.19630.92 ± 11.9530.97 ± 12.0118.48 ± 5.917.36 ± 2.810.46 ± 0.091.97 ± 0.542.82 ± 1.56
Dihydrotanshinone I0.64446.17 ± 94.44 *449.09 ± 92.53 *173.67 ± 31.12 *1.49 ± 0.28 *0.83 ± 0.242.73 ± 1.393.34 ± 3.58
Salvianolic acid A2.17343.16 ± 57.06354.79 ± 56.2987.92 ± 13.826.50 ± 1.10 *0.50 ± 0.005.84 ± 0.939.12 ± 2.48
Rosmarinic acid5.0557.63 ± 12.3861.58 ± 16.7331.88 ± 6.6993.35 ± 27.270.25 ± 0.004.05 ± 3.056.65 ± 6.91
Ferulic acid0.1493.41 ± 1.353.41 ± 1.354.14 ± 1.0049.94 ± 17.000.58 ± 0.190.69 ± 0.23N.A.
Lithospermic acid12.401093.00 ± 179.051116.94 ± 183.96249.00 ± 35.2211.65 ± 1.880.67 ± 0.246.89 ± 1.147.33 ± 1.74
WDSTanshinone IIA0.3359.62 ± 2.859.60 ± 2.863.94 ± 1.12 *37.56 ± 9.280.67 ± 0.242.08 ± 0.802.06 ± 0.98
Cryptotanshinone0.23123.78 ± 8.3524.54 ± 9.7711.59 ± 3.6310.95 ± 3.710.54 ± 0.222.51 ± 1.603.29 ± 3.47
Dihydrotanshinone I0.723300.84 ± 78.25 *304.75 ± 79.61 *101.95 ± 15.35 *2.57 ± 0.70 *0.67 ± 0.242.84 ± 0.974.30 ± 4.81
Salvianolic acid A1.66340.75 ± 65.30364.27 ± 70.2373.57 ± 14.1317.27 ± 3.82 *0.58 ± 0.198.03 ± 3.1710.26 ± 4.30
Rosmarinic acid5.6447.58 ± 12.7847.62 ± 12.7927.32 ± 6.88132.83 ± 55.110.33 ± 0.121.91 ± 0.711.98 ± 1.36
Ferulic acid0.1653.73 ± 1.633.73 ± 1.634.28 ± 1.2555.9 ± 28.500.40 ± 0.120.62 ± 0.16N.A.
Lithospermic acid10.11058.43 ± 256.901131.25 ± 227.92238.67 ± 49.6610.16 ± 2.580.58 ± 0.197.19 ± 1.6110.51 ± 5.10
*, p < 0.05 compared with Crude group; a, was assessed by the Kruskal–Wallis test; b, significantly changed pharmacokinetic parameters in both groups are in bold; N.A., not applicable. CDS, crude Danshen; WDS, wine-processed Danshen.
Publisher’s Note: MDPI stays neutral with regard to jurisdictional claims in published maps and institutional affiliations.

