Article

Development of a Modified QuEChERS Procedure for the Isolation of Pesticide Residues from Textile Samples, Followed by GC–MS Determination

by
Svetlana Hrouzková
* and
Agneša Szarka
Faculty of Chemical and Food Technology, Institute of Analytical Chemistry, Slovak University of Technology in Bratislava, Radlinského 9, 81237 Bratislava, Slovakia
*
Author to whom correspondence should be addressed.
Submission received: 16 June 2021 / Revised: 15 July 2021 / Accepted: 19 July 2021 / Published: 23 July 2021

Abstract

:
Due to the use of pesticides during cotton production and/or textile storage, it is necessary to assure textile and clothing safety in order to improve the protection of human health. In this work, an efficient method was established for a multiresidue determination of 33 pesticides covering several pesticide classes such as organochlorine, organophosphate, pyrethroides, triazines, etc., in textiles by modified QuEChERS and followed by gas chromatography–mass spectrometry. Optimal conditions were selected, including the amount of the sample, type of the extraction solvent and cleaning up sorbents, until the method was finally validated. Sufficient accuracy and precision were presented by the method using spiked samples between 10 and 250 μg/kg, while recoveries from 70 to 120% and an RSD < 20% for all the pesticides were obtained; the limits of quantification were below 5 μg/kg for all studied pesticides. The presented method showed high separation efficiency with minimal sample and sorbent consumption. The validated method was successfully applied to the analysis of real samples and proved to be applicable to routine analyses.

1. Introduction

One of the most important agricultural and industrial crops in the world, after food grains and soybeans, is cotton [1,2]. More than half of all its fibers are used in the manufacture of industrial fabrics for clothing and household furnishings [2,3]. The cotton crop contains more insects than any other crop in the world; around 1300 insects found in cotton have been registered worldwide. This has caused cotton production to suffer economic damage in many countries that are particularly challenging for entomologists [1,4]. Therefore, one of the main problems in the production of cotton is pest attacks, which can cause as high as 90% of yield losses in non-pesticide treated cotton fields. Especially in the mid- and late-production stage, the repeated application of pesticides in order to protect the cotton leaves and the developing cotton balls and fiber from pest attacks is essential [5]. To achieve high yields and quality, farmers widely use pesticides to protect cotton from pests and diseases [6]. Approximately 60% of all agrochemicals in the market are applied to cotton fields. Therefore, cotton can be considered the dirtiest agricultural crop and the most chemical-intensive crop in the world [1,4]. There is increasing concern for pesticides and other chemicals contained in cotton fiber. It has been proven that various pesticides are present in raw cotton fiber samples on the market, with a content of 0.02–1.58 mg kg−1 [5]. Pesticide residues could still be identified in textile products despite the fine processing of cotton fibers. Therefore, relevant risks could have negative impacts on human health, while being especially harmful to the skin, the respiratory system, and the digestive system [6]. Preventing the huge amount of textile damage that can be caused by fungus or small animals such as rats and mice during storage is always a challenging task. Therefore, before selling, insecticides, fungicides, and another kinds of pesticides are applied; however, this could still pass through the covering material and contaminate the textiles.
Controlling the pesticide residues and developing best management practices based on these data is one of the most important aspects in the minimalization of the potential hazards of pesticides to human and environmental health. Hence, there is a need to develop efficient methods of extraction and determination of pesticides in different media such as soil, sediment, water, and food [7]. Because of the wide variety and complexity of textile matrices, samples should first be cleaned up by using a compatible sample preparation technique before injecting them into the separation and detection system. Three primary types of sample preparation methods are currently applied to isolate pesticide residues from textiles: Soxhlet extraction, solid phase extraction, and accelerated solvent extraction (ASE). These extraction methods have certain disadvantages such as their labor-intensive processes, the need for large volumes of solvent as well as being time-consuming. Therefore, developing a greener and more convenient sample pretreatment method is very important. QuEChERS has been developed as a new sample preparation method in recent years, mainly for the extraction of pesticide residues from fruits and vegetables, but much less in textiles. The development of the multi-residue QuEChERS method has become more and more important in meeting the high demand of monitoring pesticide residues at low concentrations in different samples. In comparison with conventional extraction procedures, the QuEChERS approach requires less solvent and can obtain higher recoveries. This method is usually applied to crops such as vegetables and fruits [8,9,10].
Several studies have focused on the determination of different pesticides in the soil of cotton and wheat growing areas [11]. But no efforts have been made to determine the levels of these hazardous compounds in the final textile products. Thus, the present study focused on the determination of pesticide levels in textile samples, using the modified QuEChERS method for the extraction and GC–MS for the determination of pesticide residues. Organochlorine pesticides are checked by testing laboratories, but other groups of pesticides are currently not being tested. A multi-family mix of pesticides, a lot of which exhibit endocrine-disrupting properties after resorbing through the skin of textile users, was selected; the analytical method was subsequently developed and validated. The next aim of the study was to test various approaches for the analysis of white and colored textile materials.

2. Materials and Methods

2.1. Chemicals and Reagents

The standards of pesticides were acquired from different sources (Dr. Ehrenstorfer, Augsburg, Germany; Bayer, Leverkusen, Germany; Cheminova, Harboore, Denmark; Agrovita, Ivanka pri Dunaji, Slovak), with purity higher than 95%. Stock standard solutions of the individual pesticides, at a concentration 1 mg/mL, were prepared by weighing the pesticides and dissolving them in 10 mL of toluene (Merck KGaA, Darmstadt, Germany). The working standard solution of pesticides was prepared in toluene by dilution and stored at 4 °C. This working solution contained all of the 33 studied pesticides at a concentration of 0.020 mg/mL. The calibration standards were prepared by additional dilution into acetonitrile (Merck KGaA, Darmstadt, Germany). HPLC-grade acetonitrile, ethyl acetate, hexane, and water were also obtained from Merck (Darmstadt, Germany). Every solvent used was pesticide residue grade. Anhydrous magnesium sulfate and sodium chloride were purchased from Lachema (Lachema a.s., Brno, Czech Republic). Octadecyl silica (C18) and primary secondary amine were obtained from Agilent Technologies (Avondale, PA, USA). Ethyl acetate was received from Sigma-Aldrich (Sigma Aldrich, Steinheim, Germany).

2.2. Sample Preparation

The cotton-based textiles were cut into small pieces. A modified version of the original QuEChERS procedure [12] was applied. Briefly, one gram of sample was weighed into a 50 mL centrifuge tube. Ten mL of acetonitrile was added to the sample and shaken by hand for 1 min. Subsequently, 4 g of MgSO4 and 1 g of NaCl were added, after which the sample was mixed vigorously by hand for 1 min. Finally, the mixture was centrifuged at 3700 rpm for 5 min.
For the clean-up process by dispersive solid phase extraction, different sorbents were tested on white and colored textiles.
White textile samples: a total of 2 mL of the organic phase (supernatant) was transferred to a 15 mL centrifuge tube, which contained 50 mg of PSA (primary secondary amine). The tube was shaken by hand for 1 min and subsequently centrifuged at 4000 rpm for 5 min. Finally, 1 mL of the organic phase was transferred to a vial (2 mL) for GC–MS analysis.
Colored textile samples: a total of 2 mL of the organic phase was transferred to a 15 mL centrifuge tube, which contained 50 mg of PSA and 25 mg GCB (graphitized carbon black). The tube was shaken by hand for 1 min and subsequently centrifuged at 4000 rpm for 5 min. Finally, 1 mL of the organic phase was transferred to a vial for GC–MS analysis.

2.3. Instrument and Apparatus

Analytic MC1 scales (Sartorius, Göttingen, Germany) were used for standards weighting. A high-volume centrifuge ROTOFIX 32 Hettich (Tuttlingen, Germany) was used for centrifugation.
An Agilent 6890N GC system (Agilent Technologies, Little Falls, DE, USA) was used for the separation of the pesticides. The GC was equipped with a programmable temperature vaporization (PTV) injector and an autosampler (Agilent 7683B) from the same company, which was used for the injection of 2 μL of the solutions in solvent vent injection mode. A narrow-bore capillary column CP-Sil 8 CB (Agilent Technologies, Little Falls, DE, USA) with 5% diphenyl/95% dimethylsiloxane stationary phase and 15 m × 0.15 mm i.d. × 0.15 µm film thickness was utilized for GC separation. A fused silica untreated capillary column (1 m × 0.32 mm) was used as a pre-column. Helium was used as a carrier gas at a constant flow rate of 1.2 mL/min. The initial temperature of the injector was set at 40 °C and held for 0.2 min. After that, it was increased with a gradient rate of 400 °C/min until 300 °C and held for 2 min. The temperature was subsequently increased with the same gradient rate of 400 °C/min until 350 °C and held for 5 min. The initial temperature of the chromatographic oven was set at 60 °C and held for 1.75 min; subsequently, the temperature was increased to 150 °C at a 60 °C/min rate. After that, the temperature was increased to 220 °C at a rate of 30 °C/min, followed by a rate of 12 °C/min until 250 °C, and finally increased up to 300 °C with a rate of 30 °C/min and held for 3 min. In order to reach the initial injector temperature as fast as possible for the next injection, cryogenic cooling with CO2 was used when the injector temperature reached 90 °C. The total run time was 12.75 min.
Mass spectrometric detection was carried out with an Agilent 5975 mass-selective detector (Agilent Technologies, Little Falls, DE, USA) operating in full scan (FS) and selected ion monitoring (SIM) mode, using electron ionization (EI, 70 eV). The ion source temperature was kept at 250 °C and a 3 min solvent delay time was selected.

2.4. Validation Process

Matrix-matched calibration curves were used to evaluate the linearity of the method by using blank sample extracts spiked at a concentration ranging from 0.1 μg/kg to 250 μg/L. The lowest calibration level (LCL) was determined for pesticides individually, according to the pesticide response. Each spiked extract was analyzed in triplicate. The peak area, as an analytical signal (quantification ion in SIM mode was used), was applied to a linear least-squares regression analysis.
The accuracy of the method was expressed as the recovery. It was performed in five replicates at three spiking levels (10, 50, and 250 μg/kg). The fortification of the blank textile samples with pesticides was performed before the extraction by the solution of pesticide standards at the required spiking levels, calculated to be the final concentration of the spiked sample. Standards were dissolved in acetone, which is a highly volatile solvent; the solution was applied to the sample by spraying. Spiked samples were left to stand for 30 min before their extraction. For the recovery studies, the relative peak areas of pesticides were compared with relative peak areas of matrix-matched standards. Precision was expressed as relative standard deviation (RSD) and studied as intra- and inter-day precision. Spiked samples at 10, 50, and 250 μg/kg were analyzed for intra-day precision (five replicates). Inter-day precision was studied at the same concentration levels by processing spiked samples on five different days.
As the last validation parameter, the limits of detection (LODs) and the limits of quantifications (LOQs) were calculated. LODs and LOQs were determined for the quantification ion by the signal-to-noise ratio (S/N) criteria. They were established as the lowest concentration of the analytes yielding an S/N of 3 (LODs) or 10 (LOQs).

3. Results

Thirty-three pesticides were investigated in this study using a modified QuEChERS procedure, followed by GC–MS separation and quantification. The selection of the pesticides was based on the following criteria: (i) pesticides, which could be expected in cotton materials; (ii) reported real findings of pesticides in soil and water samples near cotton fields or in cotton balls [13,14,15]; or (iii) pesticides that are suspected to be endocrine disrupting chemicals and that could possibly be resorbed through the skin.
At first, the working solution of pesticide standards solutions (prepared in acetonitrile, ethyl acetate, hexane, hexane: acetonitrile 1:1) at a concentration of 1 ng/µL was analyzed in full scan (FS) mode, followed by their classification into SIM groups according to their retention times. The fast GC–MS conditions, particularly the oven temperature program, was optimized taking into consideration the good separation of the analytes. Table 1 summarizes the studied pesticides, their retention time, and characteristic ions for the SIM method. Multi-family groups of pesticides with a wide range of physical and chemical properties were studied. Therefore, the development of a multi-residual analytical method for the determination of pesticide residues in the cotton-based textile matrix was needed.

3.1. Modification of the QuEChERS Method

In order to acquire operative extraction efficiency, the parameters, which influence the extraction performance, had to be optimized. The QuEChERS method is affected by several factors such as the sample processing or pre-treatment, sample/solvent ratio or sample weight, hydrolysis by deionized water, type of extraction solvent, and sorbent types for dispersive SPE (dSPE).
To select the optimal parameters for the QuEChERS method, fortified samples at 100 µg/kg were used. The selection of the best extraction parameters was performed by simultaneously changing and screening the different factors that affect the extraction performance according to the design of the experimental approach [1,16]. Each optimization experiment was replicated three times, and the extraction recoveries (ER) were used for the evaluation of the proposed method. The QuEChERS method is the ideal extraction procedure for the isolation of pesticides from samples with high water content; therefore, in the case of matrices with a low moisture percentage, the adding of water is necessary to prepare a slurry of the matrix before the extraction in order to make the extraction of the compounds more efficient [17,18,19]. The addition of water not only improves sample homogeneity, but also enables the effective extraction of the compounds by hydrating the particles and facilitating the access of the extraction solvent to the pesticides [17,20]. Therefore, the cotton-based textile was mixed with water before the extraction in the ratio of 1:1 sample:water (w/w).

3.2. Sample Weight Selection

Increasing the extraction sample weight causes the decrease of the dilution factor and the increase of the target pesticide sensitivity. The low density of cotton means that the increase in cotton-based textile sample weight is limited [1]. Three different weights were proposed: 1.0, 2.0, and 3.0 g. It was difficult to use the 2.0 or 3.0 g textile samples because of the high volume these would create in the QuEChERS tube. Furthermore, after the addition of 10 mL of the extraction solvent, the volume of the organic phase was too small for further clean-up and analysis. Thus, 1.0 g of the cotton-based textile was used as the optimum sample weight for the analytical procedure.

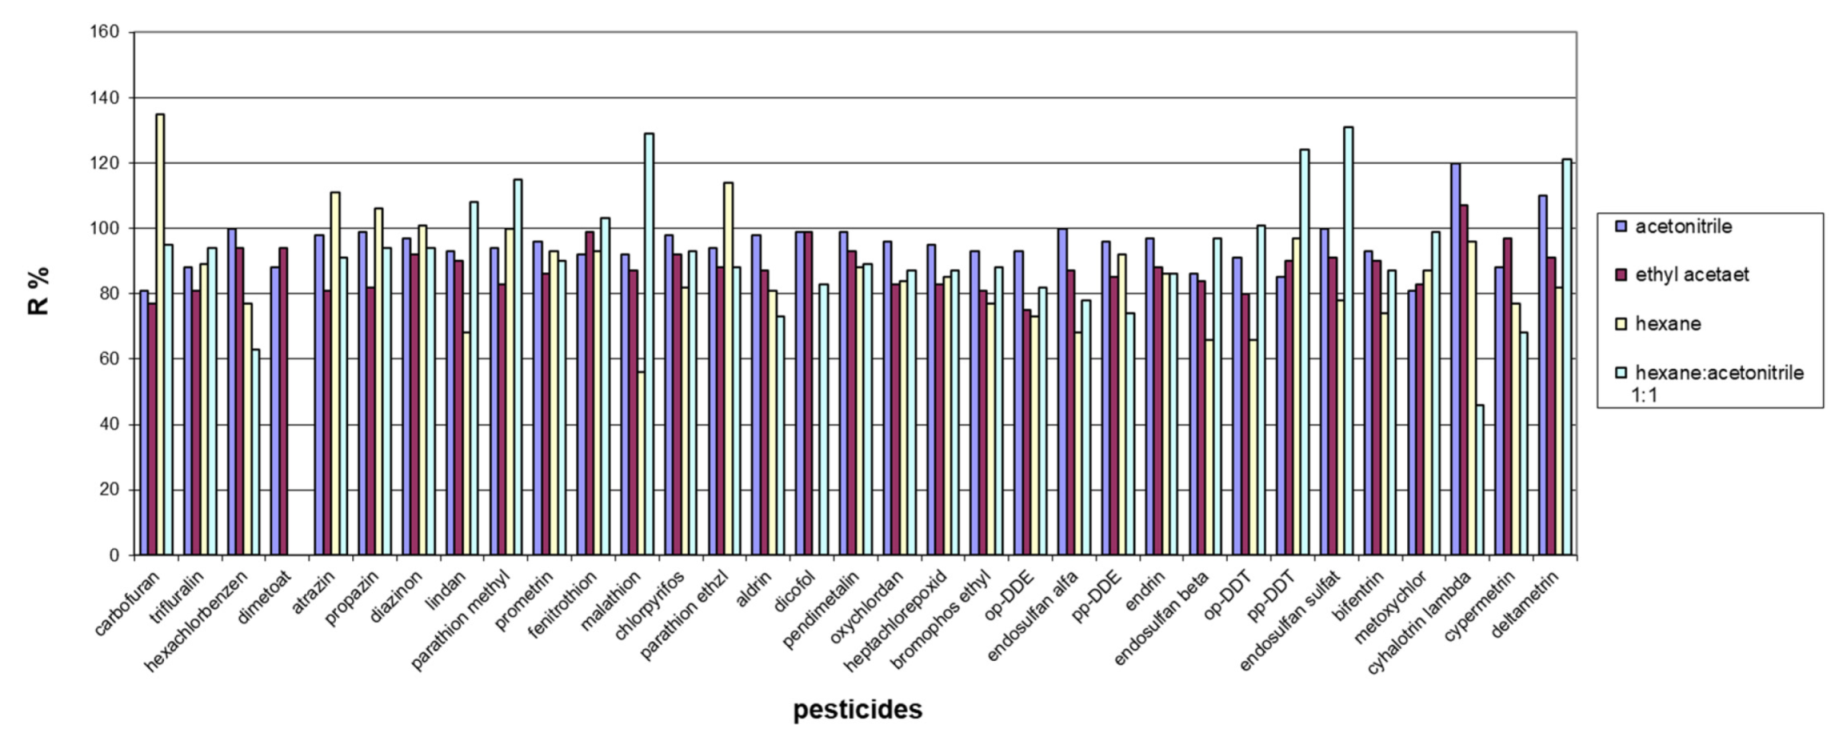
3.3. Selection of Extraction Solvent

To select the optimal extraction solvent, the recoveries of pesticides were studied by using three extracting solvents (acetonitrile, ethyl acetate, hexane) and one mixed extraction agent (hexane:acetonitrile 1:1), respectively. It should be stated that in multi-residual analytical methods, acetonitrile and ethyl acetate have usually been used as extraction solvents. To test their extraction ability for cotton-based textile samples, the effect of the extraction solvent was evaluated. Despite the many advantages of acetonitrile in extraction, it is seldom used in GC analysis due to its high toxicity, large solvent expansion volume during GC vaporization, and low volatility. The method gave satisfactory mean recoveries for all target analytes in the case of using acetonitrile or ethylacetate as the extraction solvent (Figure 1). The apparent recoveries varied from 81 to 120% when acetonitrile was the extraction solvent, and from 75 to 107% for ethylacetate. The extraction efficiency of hexane and the mixture of hexane:acetonitrile were not enough for some of the pesticides, and the recoveries ranged between 56–156% and 46–147%, respectively. The strong extraction capability of acetonitrile contributed to the satisfactory recoveries of the pesticides. It can be seen that 79% of the analyzed pesticides showed recoveries higher than 90%, with acetonitrile as the extraction solvent; therefore, acetonitrile was selected.

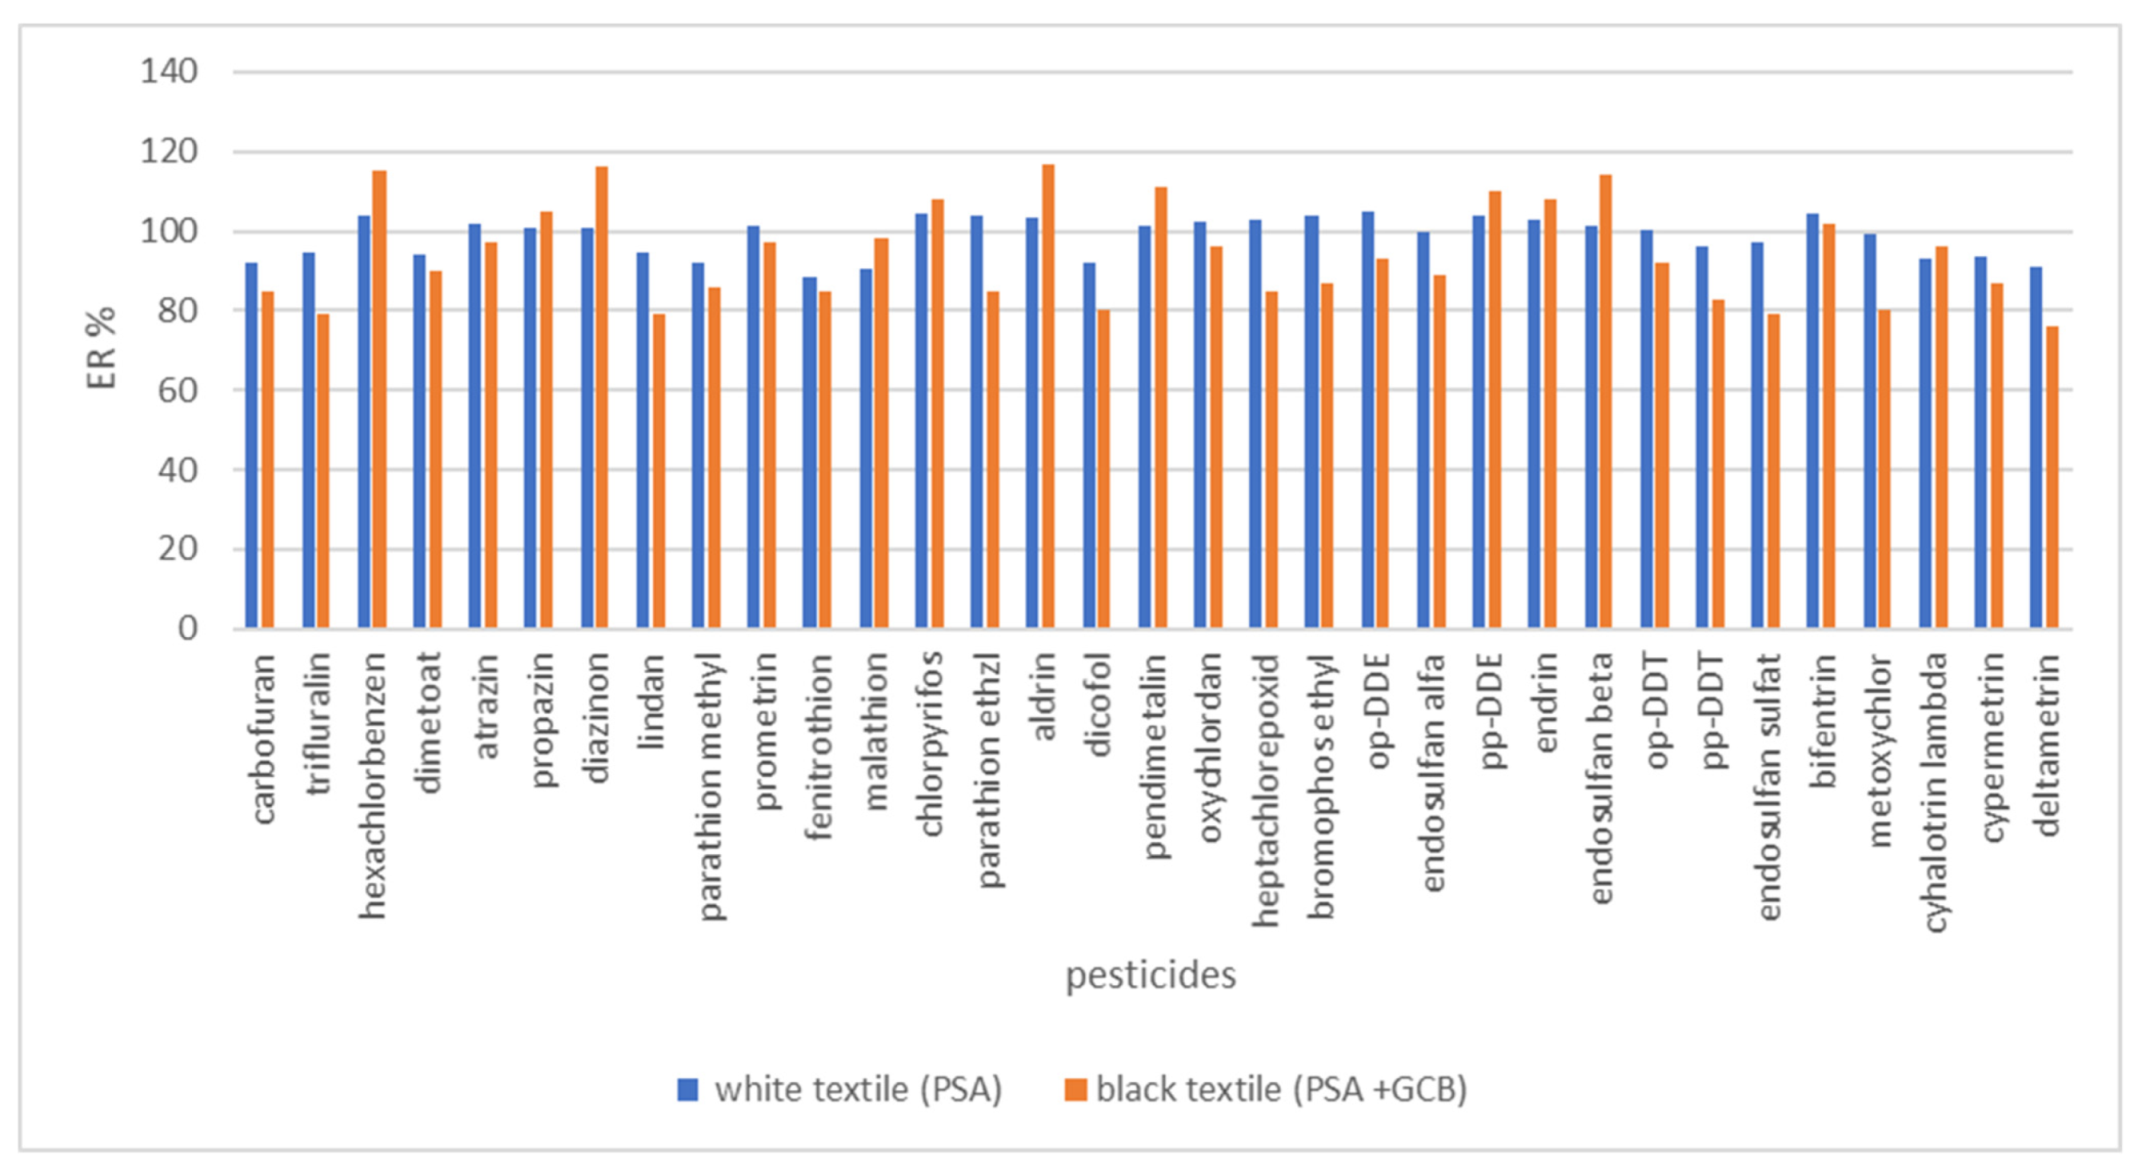
3.4. Selection of an Appropriate Sorbent for Dispersive SPE

The interfering components from the sample matrix may negatively affect the ruggedness of the GC analysis. Therefore, the most important role of extraction is not only transferring the interested analytes from the sample matrix into the extraction solvent, but also the elimination of the coextracted components of the matrix. Due to the presence of potential interferences from matrices in the final extract, the cleanup sorbents should be used to clean the extract. PSA was mainly used as the cleanup sorbent for the reduction of the interferences in several methodologies for the analysis of pesticides in various commodities. The effectiveness of the QuEChERS method was estimated with and without the purification step. The PSA sorbent was used in the cleanup step, the need for a further purification step was surveyed, and the results obtained without the cleanup were compared. It was observed that the cleanup step was necessary to reduce interferences, to improve quantification, and to not affect the signal of the chromatographic system. A consistent chromatographic response was obtained when PSA was used as a cleaning sorbent, as well as with the reduction of the GC–MS equipment maintenance and the improvement of the robustness of the proposed method. Therefore, the PSA sorbent was used for further studies.
However, for colored textiles, cleaning with PSA was not enough to obtain colorless extracts. For this reason, the mixture of PSA and GCB was tested and the results were compared with the results obtained from the use of only the PSA cleanup sorbent. Recovery values depending on the type of textile used and the selected cleaning sorbent are depicted in Figure 2. The extracts obtained with the use of a mixture of sorbents (PSA and GCB) were exactly colorless, and despite the use of the PSA and GCB, it was observed that maintenance operations of the GC system (liner and pre-column replacement) are not needed until the analysis of approximately 100 samples. The recoveries of pesticides were statistically evaluated (ANOVA test); PSA was used for the purification of white textiles, and the mixture of PSA and GCB was used for the cleanup of colored textiles. There was no significant difference between the sets of data; therefore, the white textile samples were used to validate the method.

3.5. Method Validation

The developed method was validated for white and colored textiles in terms of precision, linearity, trueness, LODs, and LOQs. The trueness of the method was formulated as recovery and the precision was expressed as relative standard deviation (RSD). The precision was evaluated as inter- and intra-day precision.
Matrix-matched standard solutions were used for the evaluation of linearity. An adequate volume of the pesticide working solution was added to the blank sample extracts after the extraction. Linearity was investigated at eight concentration levels, between 0.1 and 250 µg/kg. The method showed satisfactory linearity in the whole range of studied concentrations. The obtained determination coefficients (R2) were higher than 0.98 for all of the pesticides.
Trueness was evaluated at three concentration levels in terms of recovery; the results can be seen in Table 2. The majority of pesticides indicated recoveries between 70 and 102%, at a concentration level of 10 µg/kg. In the case of some pesticides (dimethoate, parathion methyl, malathion), the recoveries were higher than 60% but lower than 70%. However, one pesticide, dicofol, had a recovery value higher than 120%. At a concentration level of 50 µg/kg, the recoveries always ranged from 86 to 106%; and at 250 µg/kg, from 88 to 105%. The established requirements for the pesticide residue analysis were fulfilled by RSD values lower than 15%.
The precision of the method was formulated as repeatability (intra-day precision) and intermediate precision (inter-day precision). The obtained values are shown in Table 2, expressed as RSD. The repeatability of the method ranged from 1 to 15%. In the case of inter-day precision, the RSD values were a little bit higher, but lower than 20% for all pesticides.
For the calculation of the LODs and LOQs, the signal-to-noise ratio (S/N) values of 3 and 10 were used, respectively. The LODs were in the range of 0.057–1.520 µg/kg and the LOQs were at 0.190–5.000 µg/kg; details are summarized in Table 2. The obtained LODs for all of the pesticides were lower than the MRLs set by the European Union for cotton seeds as the closest possible matrix. The lowest LOD and LOQ were identified for trifluralin, while the highest values were established for malathion, dicofol, and endosulfan sulfate. For example, the obtained LODs for malathion, dicofol, and endosulfan sulfate were 1.52 µg/kg, and the MRLs for these pesticides in cotton seeds were 20, 100, and 30 µg/kg, respectively. The rated MRLs by the European Union for the studied pesticides in cotton seeds are in the range of 10–500 µg/kg (Table 2), which is much higher than the obtained LODs and LOQs by the method developed for this study. The limit of quantification for this proposed method was lower than that reported in a previously published paper [1].
An illustration of the separation of the studied mixture of pesticides is shown in Figure 3. The picture shows the overlap of ion chromatograms (quantification ions were selected and measured in SIM mode) of matrix-matched standards, at a concentration level of 50 µg/L.
For the analysis of materials with changed textile composition, a re-validation of the method is recommended.

3.6. Real Sample Analysis

The applicability of the method was tested by real sample analyses under optimized conditions. The samples were purchased from local markets. Ten textile samples were analyzed for the verification of the developed method. All the textile samples were made of 100% cotton without any material additions. For white textile samples, PSA was used in the cleanup step, and for colored samples, the mixture of PSA and GCB was applied. No pesticides were detected or quantified in the analyzed samples above the presented LODs and LOQs.

4. Conclusions

The simultaneous determination of 33 pesticides from different chemical classes in textiles was insured by a rapid, low cost, and sensitive method. Analytes were extracted by the modified QuEChERS protocol and the extracts were analyzed via the GC–MS method. Under the optimized conditions, low detection and quantification limits, wide linearity, satisfactory recoveries with good repeatability were obtained. The simplicity and versatility of the validated method allow the product safety and management departments to monitor pesticide residues in textiles. The control of pesticide residues in textiles is essential to guaranty the safety of populations against pesticides. Furthermore, an update of the legislation is needed to fill the current gap regarding the lack of residual limits, particularly for a broad range of pesticides suspected to exhibit endocrine disruption properties for textiles.

Author Contributions

Conceptualization, A.S. and S.H.; methodology, A.S. and S.H.; validation, S.H. and A.S.; resources, A.S. and S.H., writing—original draft preparation, A.S.; writing—review and editing, S.H.; supervision, S.H.; project administration, S.H.; funding acquisition, S.H. All authors have read and agreed to the published version of the manuscript.

Funding

This work was supported by the Slovak Research and Development Agency under Contract No. APVV-19-0149. This work was supported by the Scientific Grant Agency of the Slovak Republic, VEGA project No. 1/0412/20.

Institutional Review Board Statement

Not applicable.

Informed Consent Statement

Not applicable.

Conflicts of Interest

The authors declare no conflict of interest. The funders had no role in the design of the study; in the collection, analyses, or interpretation of data; in the writing of the manuscript; or in the decision to publish the results.

References

  1. Attallah, E.R.; Abdelwahed, M.H.; Abo-Aly, M.M. Development and validation of multi-residue method for determination of 412 pesticide residues in cotton fiber using GC-MS/MS and LC-MS/MS. J. Text. Inst. 2018, 109, 46–63. [Google Scholar] [CrossRef]
  2. Gordon, S.; Hsieh, Y.-L. Cotton: Science and Technology, 1st ed.; Woodhead Publishing Limited: Cambridge, UK, 2007; pp. 425–459. [Google Scholar]
  3. Reddy, N.; Yang, Y. Properties and potential applications of natural cellulose fibers from the bark of cotton stalks. Bioresour. Technol. 2009, 100, 3563–3569. [Google Scholar] [CrossRef] [PubMed]
  4. Kranthi, K.R.; Russell, D.A. Changing trends in cotton pest management. In Integrated Pest Management: Innovation-Development Process, 1st ed.; Pimentel, D., Peshin, R., Eds.; Springer Science+Business Media B.V.: Dordrecht, The Netherlands, 2009; pp. 499–541. [Google Scholar]
  5. Ma, M.; Dong, S.; Jin, W.; Zhang, C.; Zhou, W. Fate of the organophosphorus pesticide profenfos in cotton fiber. J. Environ. Sci. Health Part B 2019, 54, 70–75. [Google Scholar] [CrossRef] [PubMed]
  6. Hu, T.T.; Lu, C.M.; Li, H.; Zhang, Z.X.; Li, J. Determination of eleven organophosphorus pesticide residues in textiles by using HPLC-HRMS. Anal. Sci. 2017, 33, 1027–1032. [Google Scholar] [CrossRef] [PubMed] [Green Version]
  7. Zhang, B.; Pan, X.; Venne, L.; Dunnum, S.; McMurry, S.T.; Cobb, G.P.; Anderson, T.A. Development of a method for the determination of 9 currently used cotton pesticides by gas chromatography with electron capture detection. Talanta 2008, 75, 1055–1060. [Google Scholar] [CrossRef] [PubMed]
  8. Satyajeet, R.; Kumar, S.A.; Anshuman, S.; Sapna, Y.; Mohammed Haris, M.; Mohana Krishna Reddy, M. Comparative Evaluation of QuEChERS Method Coupled to DLLME Extraction for the Analysis of Multiresidue Pesticides in Vegetables and Fruits by Gas Chromatography-Mass Spectrometry. Food Anal. Methods 2016, 9, 2656–2669. [Google Scholar]
  9. Kim, J.; Kim, J.I.; Lee, C.W. Development and validation of a modified QuEChERS method coupled with LC-MS/MS to determine arbutin in pear peels. Food Sci. Biotechnol. 2016, 25, 987–992. [Google Scholar] [CrossRef] [PubMed]
  10. Gracia, M.; Ascension, M.; Alba, M.; Cermeño, S.; Oliva, J.; Barba, A. Determination of Nine Fungicides in Grape and Wine Using QuEChERS Extraction and LC/MS/MS Analysis. J. AOAC Int. 2015, 98, 1745–1751. [Google Scholar]
  11. Tariq, M.I.; Afzal, S.; Hussain, I. Degradation and persistence of cotton pesticides in sandy loam soils from Punjab, Pakistan. Environ. Res. 2006, 100, 184–196. [Google Scholar] [CrossRef]
  12. Anastassiades, M.; Lehotay, S.J.; Stajnbaher, D.; Schenck, F.J. Fast and easy multiresidue method employing acetonitrile extraction/partitioning and dispersive solid phase extraction for the determination of pesticide residues in produce. J. AOAC Int. 2003, 86, 412–431. [Google Scholar] [CrossRef] [PubMed] [Green Version]
  13. Yang, X.; Wang, S.; Bian, Y.; Chen, F.; Yu, G.; Gu, C.; Jiang, X. Dicofol application resulted in high DDTs residue in cotton fields from northern Jiangsu province, China. J. Hazard. Mater. 2008, 150, 92–98. [Google Scholar] [CrossRef] [PubMed]
  14. Abaga, N.O.Z.; Alibert, P.; Dousset, S.; Savadogo, P.W.; Savadogo, M.; Sedogo, M. Insecticide residues in cotton soils of Burkina Faso and effects of insecticides on fluctuating asymmetry in honey bees (Apis mellifera Linnaeus). Chemosphere 2011, 83, 585–592. [Google Scholar] [CrossRef] [PubMed]
  15. Blossom, S.; Gaganjyot, B. Monitoring of Insecticide Residues in Cotton Seed in Punjab, India. Bull. Environ. Contam. Toxicol. 2004, 73, 707–712. [Google Scholar] [CrossRef] [PubMed]
  16. Barker, T.B.; Milivojevich, A. Quality by Experimental Design, 4th ed.; Chapman and Hall/CRC: Boca Raton, FL, USA, 2016; pp. 1–754. [Google Scholar]
  17. De Matos, E.M.C.; Ribeiro, L.C.; Prestes, O.D.; da Silva, J.A.G.; de Farias, B.S.; Pinto, L.A.; Zanella, R. Multiclass method for the determination of pesticide residues in oat using modified QuEChERS with alternative sorbent and liquid chromatography with tandem mass spectrometry. Food Anal. Methods 2019, 12, 2835–2844. [Google Scholar] [CrossRef]
  18. Walorczyk, S.; Drożdżyński, D. Improvement and extension to new analytes of a multi-residue method for the determination of pesticides in cereals and dry animal feed using gas chromatography–tandem quadrupole mass spectrometry revisited. J. Chromatogr. A 2012, 1251, 219–231. [Google Scholar] [CrossRef] [PubMed]
  19. Rasche, C.; Fournes, B.; Dirks, U.; Speer, K.N. Multi-residue pesticide analysis (gas chromatography-tandem mass spectrometry detection)—Improvement of the quick, easy, cheap, effective, rugged, and safe method for dried fruits and fat-rich cereals-benefit and limit of a standardized apple purée calibration (screening). J. Chromatogr. A 2015, 1403, 21–31. [Google Scholar] [PubMed]
  20. Dors, G.C.; Primel, E.G.; Fagundes, C.A.A.; Mariot, C.H.P.; Badiale Furlong, E. Distribution of pesticide residues in rice grain and in its coproducts. J. Braz. Chem. Soc. 2011, 22, 1921–1930. [Google Scholar] [CrossRef] [Green Version]
Figure 1. Selection of extraction solvent. The dependence of the extraction recovery of individual pesticides on the selection of the solvent.
Separations 08 00106 g001
Figure 2. Extraction recovery (ER) of pesticides depending on the type of textile used and the selected cleaning sorbent.
Separations 08 00106 g002
Figure 3. Extracted ion chromatogram of matrix-matched standards, at a concentration level of 50 µg/L. Peak assignments are the following: 1 carbofuran, 2 trifluralin, 3 hexachlorobenzene, 4 dimethoate, 5 atrazin, 6 propazin, 7 diazinone, 8 lindane, 9 parathion-methyl, 10 prometrin, 11 fenitrotion, 12 malathion, 13 chlorpyrifos, 14 parathion ethyl, 15 aldrin, 16 dicofol, 17 pendimethalin, 18 oxychlordane, 19 heptachlor epoxid, 20 bromophos ethyl, 21 op DDE, 22 pp DDE, 23 endosulfan alfa, 24 endrin, 25 endosulfan beta, 26 op DDT, 27 pp DDT, 28 endosulfan sulfat, 29 bifenthrin, 30 metoxychlor, 31 cyhalotrin lambda, 32 cypermetrin, 33 deltametrin.
Separations 08 00106 g003
Table 1. List of the pesticides, their chemical classes, and GC–MS parameters (retention time, monitored ions, SIM groups).
PesticideRetention Time [min]Chemical FunctionFragment Ions [m/z]Starting Time of SIM Group [min]
Carbofuran4.207Carbamate1641491313.00
Trifluralin5.499Dinitroanyline306264307
Hexachlorobenzene5.796OCP2842862825.70
Dimethoate5.894OPP8793164
Atrazin5.968Triazine200215202
Propazin5.979Triazine214229172
Diazinone6.025OPP179137152
Lindane6.042OPP181183109
Parathion-methyl6.579OPP2631252116.30
Prometrin6.642Triazine241184226
Fenitrothion6.768OPP2771252606.74
Malathion6.808OPP173127125
Chlorpyrifos6.899OPP197314199
Parathion-ethyl6.977OPP291109139
Aldrin6.997OCP263261265
Dicofol7.117OCP139111250
Pendimethalin7.242Dinitroanyline2521622817.19
Oxychlordane7.379OCP353355115
Heptachlor epoxide7.408OCP353355351
Bromophos-ethyl7.557OPP359357303
o,p-DDE7.642OCP246248318
p,p-DDE7.997OCP2463183167.75
Endosulfan-alfa7.808OCP241239195
Endrin8.368OCP2632652818.15
Endosulfan-beta8.471OCP237239216
o,p-DDT8.500OCP235237165
p,p-DDT8.883OCP2352371658.80
Endosulfan sulfate8.923OCP229272387
Bifenthrin9.243Pyrethroid181165166
Methoxychlor9.391OCP227228274
Cyhalothrin lambda9.746Pyrethroid1811972089.56
Cypermethrin10.797Pyrethroid163165181
Deltamethrin11.952Pyrethroid181253251
Note: fragment ions in the first column were selected as quantification ions, OCP—organochlorine pesticides, OPP—organophosphorus pesticides.
Table 2. Validation results of the developed analytical method and MRLs of pesticides in cotton textile samples.
NameER% 10 µg/kg (RSD%)ER% 50 µg/kg (RSD%)ER% 250 µg/kg (RSD%)LCL [µg/kg]LOD [µg/kg]LOQ [µg/kg]MRL [µg/kg]
Carbofuran88 (6)91 (4)92 (2)50.9803.240100
Trifluralin101 (2)86 (6)95 (1)0.50.0570.19010
Hexachlorobenzene96 (7)97 (1)104 (1)50.7502.47020
Dimethoate62 (13)96 (11)94 (7)51.4004.62010
Atrazine97 (6)96 (4)102 (1)51.2103.98050
Propazin98 (4)94 (3)101 (2)0.10.0900.290
Diazinon100 (4)102 (9)101 (2)51.4024.67320
Lindane70 (10)97 (9)95 (7)51.4904.91010
Parathion methyl63 (13)90 (9)92 (7)51.3604.50020
Promethryn100 (2)97 (3)101 (2)0.10.0600.190
Fenitrothion70 (15)97 (9)88 (9)51.5004.95020
Malathion64 (9)95 (8)90 (9)51.5205.00020
Chlorpyrifos101 (3)101 (3)104 (1)0.10.0600.190300
Parathion ethyl99 (2)98 (6)104 (2)10.1490.495
Aldrin98 (3)95 (5)104 (1)50.9803.24020
Dicofol122 (11)103 (9)92 (9)51.5205.000100
Pendimethalin96 (5)92 (5)101 (4)51.3204.35050
Oxychlordan98 (4)96 (2)102 (1)0.50.3661.220
Heptachlorepoxid100 (1)96 (1)103 (2)0.50.3661.22010
Bromophos ethyl101 (1)96 (2)104 (1)0.10.0450.14920
O,p-DDE98 (3)97 (6)105 (2)0.10.0350.11850
Endosulfan alfa70 (8)92 (4)100 (3)51.1303.74030
P,p-DDE97 (1)95 (4)104 (1)0.50.1610.53850
Endrin75 (9)96 (2)103 (1)51.3904.600
Endosulfan beta100 (2)106 (5)101 (2)51.2904.25030
O,p-DDT102 (3)98 (5)100 (6)51.2604.17050
P,p-DDT99 (1)106 (10)96 (7)50.8432.80950
Endosulfan sulfat72 (14)89 (13)97 (8)51.5205.00030
Bifenthrin99 (1)95 (1)105 (1)0.50.1280.427500
Methoxychlor94 (11)95 (15)99 (13)0.10.0300.09010
Cyhalotrin lambda98 (3)95 (8)93 (8)10.2800.910200
Cypermethrin96 (2)99 (7)93 (7)10.2600.850200
Deltamethrin100 (4)102 (8)91 (5)10.2700.90020
Notes: LCL—lowest calibration level, LOD—limit of detection, LOQ—limit of quantification, MRL—maximum residue level, ER—extraction recovery, RSD—relative standard deviation.
Publisher’s Note: MDPI stays neutral with regard to jurisdictional claims in published maps and institutional affiliations.

