Article

A Rapid Analytical Approach for Monitoring Pharmaceuticals in Hospital Wastewater—A DPX-Based Procedure with Environmentally-Friendly Extraction Phase Coupled to High Performance Liquid Chromatography–Diode Array/Fluorescence Detectors

1
Departamento de Química, Universidade Federal de Santa Catarina, Florianópolis 88040-900, Brazil
2
Departamento de Agronomia, Universidade Federal de Santa Catarina, Curitibanos 89520-000, Brazil
3
Departamento de Farmacociências, Universidade Federal de Ciências da Saúde de Porto Alegre, Porto Alegre 90050-170, Brazil
*
Author to whom correspondence should be addressed.
Submission received: 25 June 2021 / Revised: 27 July 2021 / Accepted: 28 July 2021 / Published: 29 July 2021

Abstract

:
In this study, a novel analytical methodology based on disposable pipette extraction (DPX) was developed using an alternative extraction phase for the extraction/determination of six pharmaceutical compounds, including carbamazepine, diclofenac, naproxen, fluoxetine, losartan and 17α-ethinylestradiol, in samples of hospital wastewater by high-performance liquid chromatography coupled to diode array and fluorescence detectors. The performance of three extraction phases was examined, including 3-n-propyl (3-methylpyridinium) silsesquioxane chloride (Si3Py+Cl), the conductive polymer polypyrrole (PPy), and polypyrrole modified with cetyltrimethylammonium bromide (PPy.CTAB). The optimization of the experimental parameters was performed through univariate and multivariate approaches. The optimized condition was obtained with the use of 20 mg of Si3Py+Cl as extraction phase; six extraction cycles with 700 μL of sample in each cycle and 15 s of extraction time; three desorption cycles with 100 μL of ACN (same aliquot) and 15 s of desorption time; and sample pH adjusted at 3.5 and addition of 15% (w/v) of NaCl in the sample. The methodology proposed exhibited environmentally-friendly aspects with a significantly reduced volume of organic solvent (only 100 µL) and a small amount of extraction phase (20 mg). In addition, the extraction phase employed exhibits a simple synthetic procedure, low cost, and high stability in organic solvent. Moreover, the method developed exhibits high throughput (extraction time of 6.5 min per sample), and robustness. The analytical figures of merit were obtained using hospital wastewater, and the values were very satisfactory. The correlation coefficients were higher than 0.9710. LODs and LOQs ranged from 0.030 µg L−1 to 1.510 µg L−1 and 0.10 µg L−1 to 5.00 µg L−1, respectively. Relative recoveries varied from 80 to 127%, and intra-day (n = 3) and inter-day (n = 9) precision was lower than 19%.

1. Introduction

The growing population and higher life expectancy have led to an increased demand for pharmaceuticals [1]. Generally, after use, the final destination of these compounds or their metabolites, if not properly treated, is the environment. The main sources of environmental contamination consist of urine and feces from humans and animals in domestic sewage and also the incorrect disposal of drugs and the discharge of hospital wastewater [2,3]. Hospital wastewater presents a particular concern because it can represent the main source of pollution with pharmaceutical compounds [4,5]. Even with wastewater treatment, some pharmaceuticals may not be completely removed and, therefore, they can be discarded in the environment [6]. Considering that this process can be continuous, the effect of these compounds in the environment can be similar to that caused by persistent pollutants and thus could cause damage in aquatic systems and to human beings [7]. Non-steroidal anti-inflammatory drugs (NSAID), such as naproxen (NAP) and diclofenac (DCL), exhibit analgesic and antipyretic properties and can be used for headache, muscle pain, and inflammation [8]. Estrogen-based hormones such as 17α-ethinylestradiol (EE2) are widely used in the formulation of contraceptive pills. Another class of drugs that deserves attention consists of neuroactive drugs, which include antidepressants and anti-epileptic drugs. Among the various types of antidepressants, the most popular are selective serotonin reuptake inhibitors, including fluoxetine (FLU), which is indicated for the treatment of depression, anxiety, and some disorders. Among the anti-epileptic drugs, carbamazepine (CBZ) is widely used for seizures in the treatment of epilepsy and bipolar disorder [9]. Another widely used class consists of antihypertensive drugs, with losartan (LOS) as one of the most common compounds applied for the treatment of hypertension, the protection of the kidneys, and heart failure [10].
A number of methodologies used for the determination of pharmaceutical compounds described in the literature focus on a specific class of analytes [2,10,11,12]. However, the proposal of analytical methodologies with an emphasis on the determination of compounds of different chemical classes, simultaneously, is an analytical challenge since the compounds generally exhibit different physicochemical properties. Usually, before the instrumental analysis, a suitable sample preparation procedure is necessary in order to evaluate complex matrices since direct analysis is generally restricted. Sample preparation involves removing possible interfering compounds, transferring the analytes to a solution compatible with analytical instrumentation, and concentrating the analytes [13]. The choice of a suitable sample preparation procedure is typically based on the physicochemical properties of the analytes and the extraction phase, as well as the compatibility of the extraction technique with the analytical instrumentation.
Disposable pipette extraction (DPX) is a technique based on the miniaturization of solid phase extraction (SPE), and it consists of a device with capacity of 1 and 5 mL, with a sorbent material dispersed between two filters. The extraction steps involve conditioning the extraction phase to activate the sorbent sites; aspiration of the sample followed by aspiration of air, which promotes a dynamic mixture between the sample and the sorbent phase that can enhance the extraction kinetics; sample cleanup (optional); and desorption of the analytes using an appropriate solvent [14,15]. This technique exhibits some advantages, such as rapid extractions, use of small mass of extraction phase, and the use of low sample and organic solvent volumes.
There are few solid phases commercially available for DPX, with different extraction mechanisms for specific classes of compounds. Therefore, the possibility of using alternative extraction phases is a positive trend for this technique [16,17,18,19]. Among these alternative extraction phases are those based on polyaniline composites and cork [16,18]. Herein, the hybrid material named Si3Py+Cl ([3-n-propyl (3-methylpyridinium) silsesquioxane chloride]) and the conductive polymers PPy (polypyrrole) and PPy.CTAB (polypyrrole modified with cetyltrimethylammonium bromide) are promising due to the hydrogen, π-π, and hydrophobic interactions that can take place with the pharmaceutical compounds under study. In addition, the hybrid material Si3Py+Cl has already been successfully applied for the extraction of phenolic endocrine-disrupting compounds using the DPX technique [17], and the conductive polymers PPy and PPy.CTAB have recently been used to develop an efficient methodology based on DPX procedure to determine hormones and polycyclic aromatic hydrocarbons [20]. These materials are easy to obtain, present a low cost, and have shown very satisfactory stability in organic solvents. The characterization of these materials has already been performed in previous studies [17,20,21,22].
Pharmaceutical compounds can be classified as emerging pollutants, which means that the concentrations of these compounds in the environment have not yet been regulated by any legislation [23]. Analytical methods capable of quantifying and monitoring the concentrations of these compounds in environmental matrices are urgently needed, mainly due to the risks that can be related to human health and safety regarding the incorrect disposal of pharmaceutical compounds [24].
This study aim to propose a high-throughput and environmentally-friendly DPX-based procedure using alternative extraction phases (Si3Py+Cl, Ppy, and PPy.CTAB) for the determination of six pharmaceutical compounds (CBZ, DCL, NAP, FLU, LOS, and EE2) in hospital wastewater. The analytical methodology was fully optimized, and the analytical parameters of merit were determined.

2. Materials and Methods

2.1. Reagents and Materials

Analytical standards of fluoxetine (FLU), carbamazepine (CBZ), losartan (LOS), naproxen (NAP), 17α-ethinylestradiol (EE2), and diclofenac (DCL) were obtained from Sigma-Aldrich (Milwaukee, WI, USA). The chemical structure and some physicochemical proprieties of the analytes are shown in Table 1. Stock solutions at 1000 mg L−1 were prepared in methanol (MeOH), and a working solution containing a mix of the analytes at concentration of 30 mg L−1 was also prepared in MeOH. Acetonitrile (ACN), MeOH, and acetone (ACE) HPLC-grade were supplied by JT Baker (Mallinckrodt, NJ, USA). Hydrochloric acid used for pH adjustment, sodium chloride used to evaluate the salting-out effect, and formic acid used for pH adjustment of the mobile phase were obtained from Vetec (Rio de Janeiro, Brazil). Water was purified in an ultrapure water system (Mega Purity, Billerica, MA, USA). DPX pipette tips of 1 mL without sorbent material (DPX-Blank) were acquired from DPX Labs (Columbia, SC, USA). Tetraethylorthosilicate (TEOS), ethanol, chloropropyltrimethoxysilane (CPTS), toluene, and 3-methylpyridine used in Si3Py+Cl synthesis as well as a pyrrole monomer (Py) used in PPy and PPy.CTAB synthesis were obtained from Sigma-Aldrich (Milwaukee, WI, USA) and stored at 4 °C before use. Iron (III) chloride hexahydrate (FeCl3·6H2O) was obtained from Dinâmica Química Contemporânea (Indaiatuba, SP, Brazil), and the surfactant cetyltrimethylammonium bromide (CTAB) was supplied by Vetec (Rio de Janeiro, Brazil). The hospital effluent samples were collected at disposal stations of sewage treatment plants of hospitals in Florianópolis, SC, Brazil and kept under refrigeration at 4 °C in amber vials. The samples were left to decant, and the supernatant was used for extraction procedure prior to each analysis.

2.2. Synthesis and Characterization of the Extraction Phases

The Si3Py+Cl was synthesized by the sol-gel processing method, in accordance with previous work [17]. Briefly, tetraethylorthosilicate (TEOS), ethanol, and an aqueous HCl solution were mixed, and the resulting solution was stirred in a round-bottomed flask for 2.5 h at room temperature. Afterwards, a solution of 3-n-chloropropyltrimethoxysilane (CPTS) was added in the flask and the mixture was stirred for 2 h at room temperature. The temperature of the solution was raised to 328 K, and the mixture was allowed to stand open for 60 h under atmospheric conditions until the gelation process occurred. The resulting solid was washed with ethanol and then dried under vacuum at room temperature. The dry solid was mixed in a round-bottomed flask with a solution prepared by pure 3-methylpyridine and dry toluene. So, the mixture was heated at the reflux temperature of the solvent for approximately 3 h. The solid was filtered, washed with ethanol, and dried for 2 h under vacuum at room temperature.
The extraction phases PPy and PPy.CTAB were also synthesized, based on previous work, through chemical in situ polymerization of pyrrole (Py) with the use of FeCl3·6H2O as oxidant in aqueous solution containing a cation surfactant CTAB in the following proportions: oxidant/Py molar ratio = 2.3/1 and surfactant/Py molar ratio = 1/5 [20]. In this case, FeCl3·6H2O was dissolved in distilled water and the aqueous solution containing CTAB was slowly added under magnetic stirring at room temperature. After 15 min, pyrrole dispersed in distilled water was added dropwise. The polymerization was carried out for 1 h under magnetic stirring at room temperature. After 24 h, the conductive polymer PPy.CTAB was filtered, washed with distilled water, and dried at 60 °C. The synthesis of neat PPy was also carried out according to the same previously mentioned procedure but without the use of CTAB. The characterization of the extraction phases was reported in previous studies [17,20].

2.3. Instrumentation and Chromatographic Conditions

Chromatographic analysis was performed on a Shimadzu Prominence LC 20AT series HPLC system (Shimadzu, Kyoto, Japan) equipped with a fluorescence detector (RF 20A series) and a diode array detector (RF 20A series). The injection volume was 20 µL using a manual injector Rheodyne 7725i (Rohnert Park, CA, USA) at a flow rate of 1 mL min−1 of mobile phase in gradient mode. The gradient method initially applied 40% of mobile phase A (ACN acidified with 0.1% v/v of formic acid) and 60% of mobile phase B (water acidified with 0.1% v/v of formic acid), and this condition was maintained up to 17 min. Next, mobile phase A was increased from 40% to 70% from 17 to 25 min. Finally, the mobile phase was returned to the initial condition and maintained up to 30 min. Chromatographic separations were performed in reversed phase mode using a C18 column (ZORBAX Eclipse XDB®, 250 mm × 4.6 mm i.d., 5 mm film thickness, Agilent, CA, USA). The analytes CBZ and DCL were detected using a diode array detector at a wavelength of 280 nm. The other analytes were detected in a fluorescence detector using excitation and emission wavelength as follows: FLU (230/290), LOS (248/410), NAP (284/352), and EE2 (280/310). The chromatographic data were evaluated with LCsolution software (Shimadzu, Kyoto, Japan).

2.4. Optimization of DPX Procedure

The DPX procedure was fully optimized in order to obtain the best extraction conditions for the analytes using both univariate and multivariate approaches, with data processing assessed through Statistica 8.0 software (STATSOFT, Palo Alto, CA, USA).

2.5. Evaluation of Extraction Phase

Initially, the best extraction material was chosen using a univariate strategy. For this, 20 mg of each material (Si3Py+Cl, PPy and PPy.CTAB) was inserted into the DPX-Blank tips. The extractions were performed in water spiked with 100 µg L−1 of each analyte; the pH was adjusted at 4 based on the analyte pKa values; the extraction parameters were fixed in 5 cycles of extraction using 800 µL of sample (using a new aliquot in each cycle) and 15 s of extraction time per cycle. The desorption parameters were fixed in 5 cycles of 100 µL of ACN: MeOH (1:1 v/v) (using the same aliquot in all cycles) and 15 s of desorption time per cycle.

2.6. Optimization of Desorption Solvent

A simplex-lattice design with 9 experiments was used to examine the desorption solvent. In this particular case, ACN, MeOH, ACE, and mixtures of these solvents were adopted. The triangular response surface was generated using the geometric means of the chromatographic peak areas of the analytes. In this step, the best extraction phase was optimized according to the previous section, and the other parameters of the DPX procedure were fixed as previously described.

2.7. Optimization of Extraction and Desorption Steps

The extraction step was optimized according to a central composite design with 17 experiments. The variables mass of extraction phase (5 to 30 mg), volume of sample (200 to 810 µL), and the number of extraction cycles (1 to 9) were evaluated. The extraction time was fixed at 15 s in all experiments.
Regarding the desorption step, number of cycles (1 to 9) and volume of desorption solvent (100 to 300 µL) were optimized through a Doehlert design with 9 experiments. The desorption time was set at 15 s in all experiments.

2.8. Evaluation of pH and Salting-Out Effect

Other important parameters to be evaluated were the sample pH and salting-out effect. In this step, a Doehlert design with 9 experiments was adopted. The pH varied from 2 to 7 based on the analyte pKa values, and the salting-out effect was evaluated through addition of NaCl in the sample solution at concentrations ranging from 0 to 25% w/v of NaCl.

2.9. Analytical Figures of Merit and Analysis of Hospital Wastewater Samples

Calibration curves were obtained using hospital wastewater samples spiked with the analytes at different concentration ranges, as follows: for CBZ and DCL 5 to 100 µg L−1, for NAP 0.1 to 10 µg L−1, for FLU 1 to 50 µg L−1, for LOS 0.5 to 100 µg L−1, and for EE2 0.5 to 25 µg L−1. Coefficients of correlation (r) were calculated based on calibration curves. Limits of quantification (LOQs) were determined as the first concentration of linear range, and the limits of detection (LODs) were obtained by dividing the LOQs by 3.3. Accuracy of the method was evaluated at three concentration levels through relative recovery. Precision of the method was evaluated through intra-day assays at three concentration levels, and inter-day assays at one concentration level. In addition, robustness of the method was evaluated through Youden test. The main factors that can influence the response of the method were identified, and small variations were performed, simultaneously. Results were expressed through Lenth’s graphic.
Two hospital wastewater samples were collected at the outflow of sewage treatment plants of hospitals in Florianópolis, Santa Catarina state, Brazil. The samples were stored at 4 °C, before analysis they were allowed to settle, and the supernatant was submitted to the optimized DPX procedure.

3. Results and Discussion

3.1. Optimization of DPX Procedure

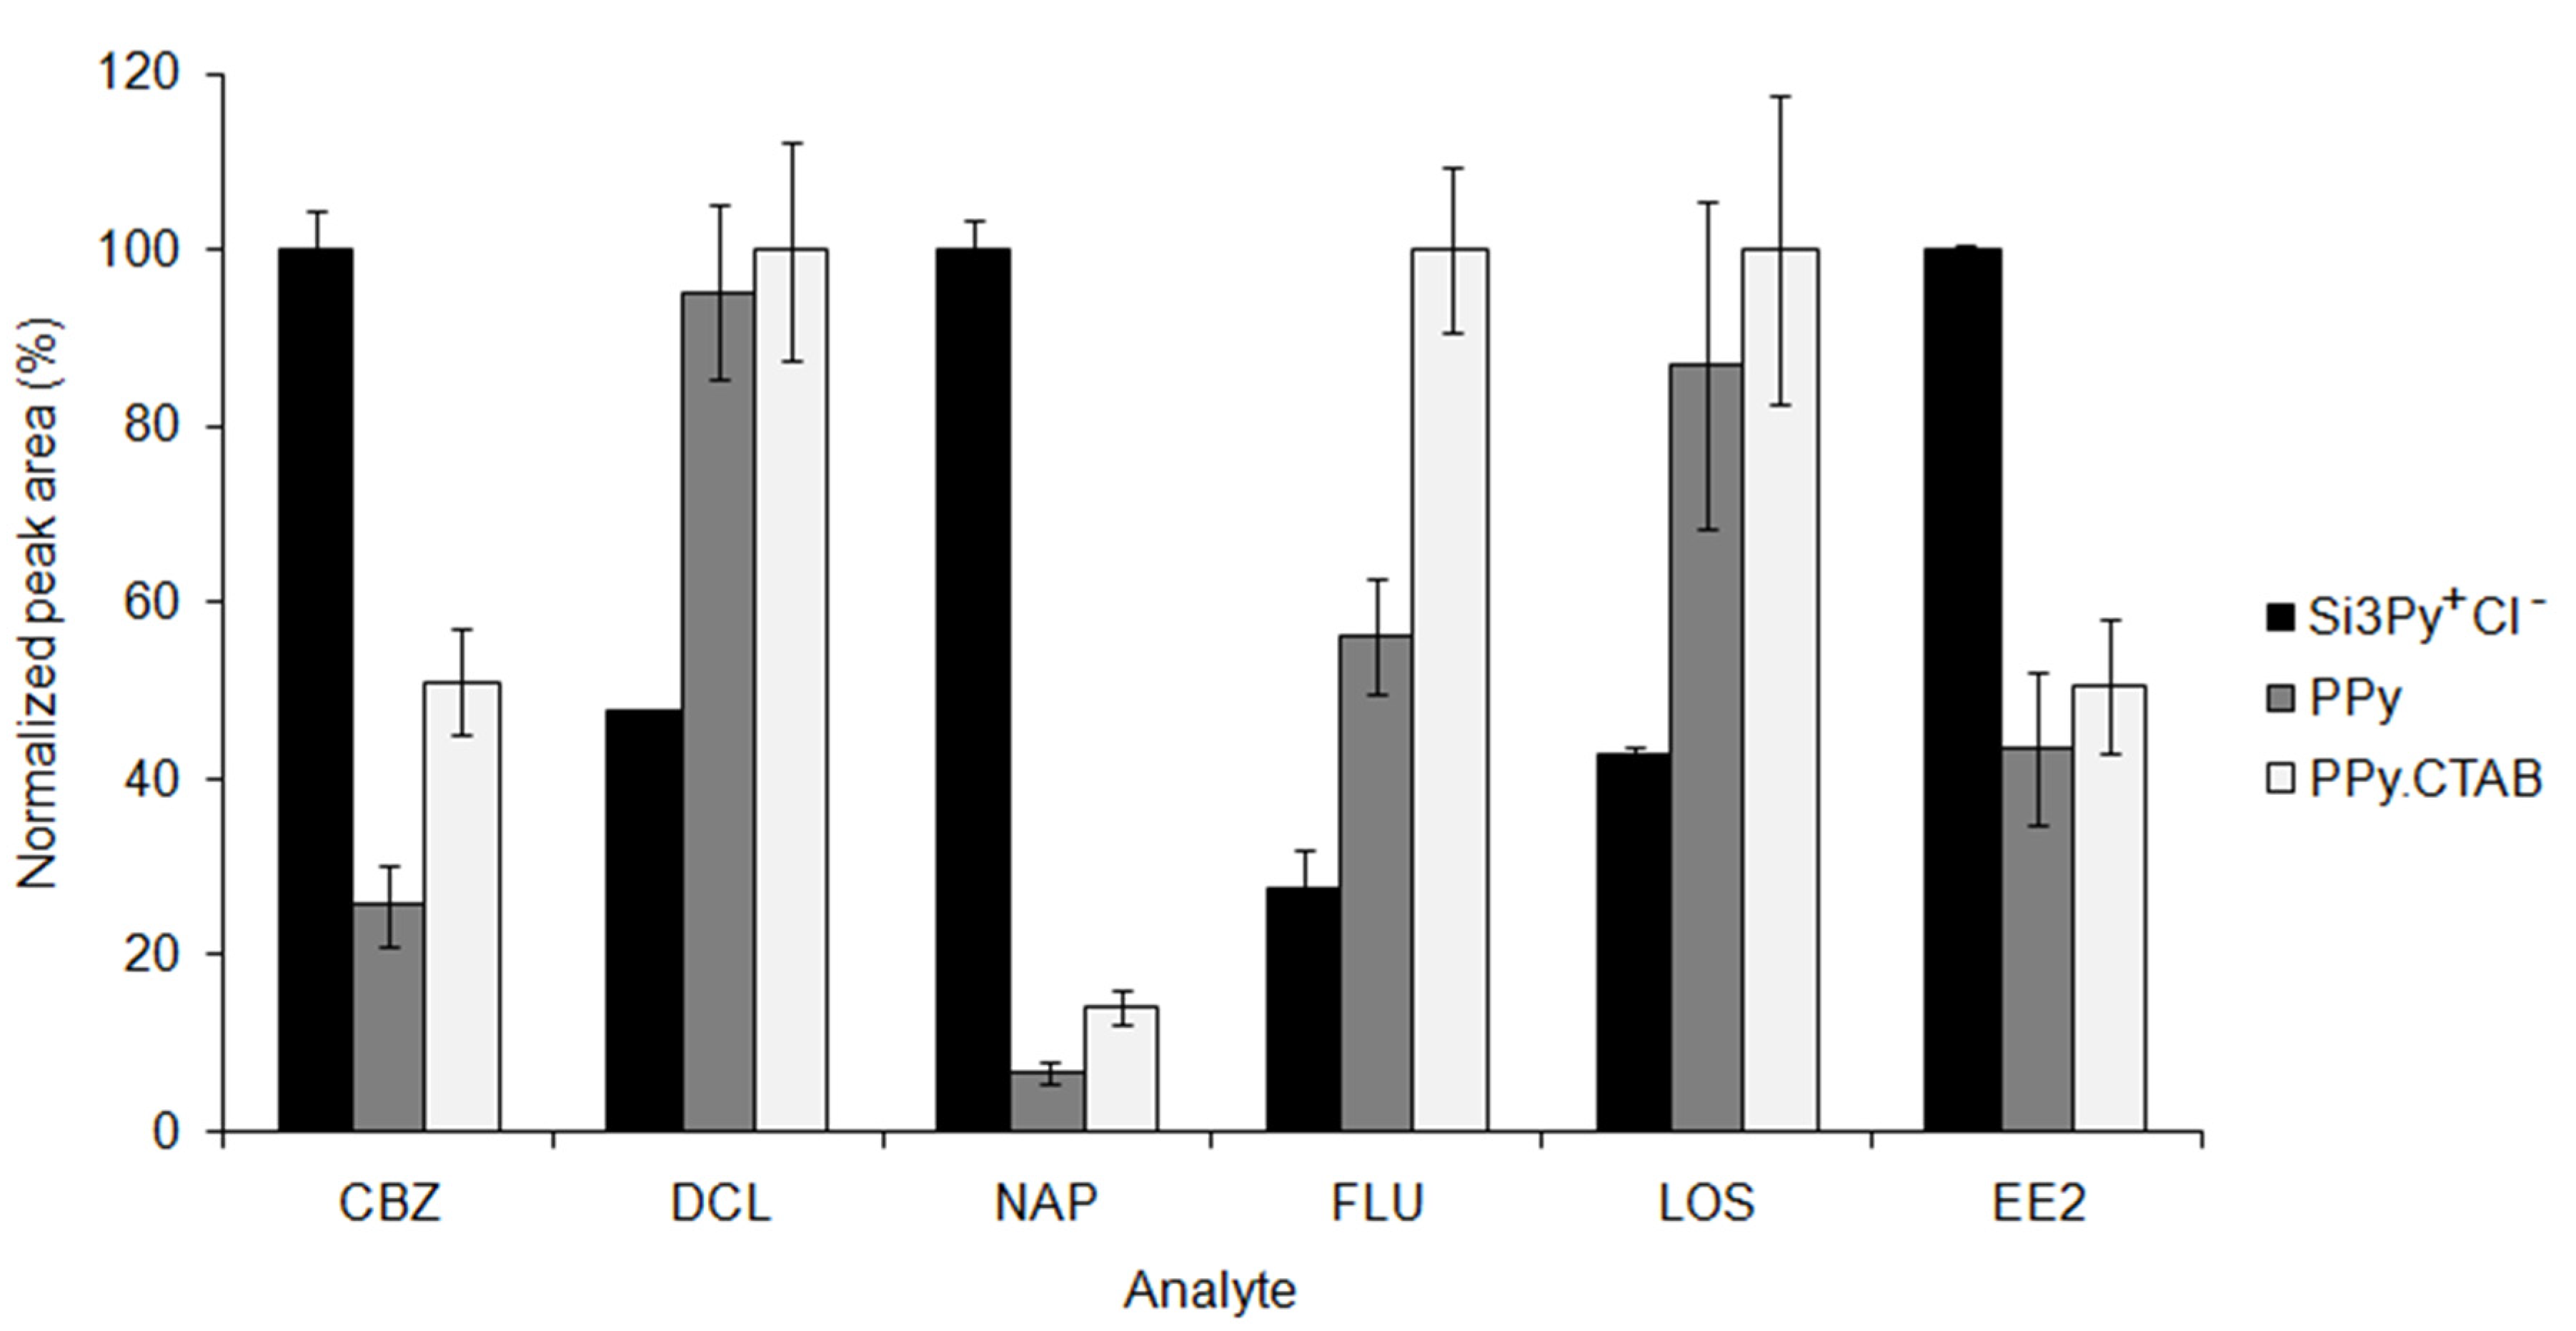
3.1.1. Evaluation of the Extraction Phase

The selection of the most effective extraction phase for extracting the analytes is a crucial step. It is necessary to employ an extraction phase that has certain characteristics, such as functional groups that can interact with the analytes, a large surface area, and porosity that can favor the extraction of the analytes from aqueous samples. In this study, the hybrid material Si3Py+Cl, which exhibits functional groups such as pyridinium and silanol that can interact with the analytes through π–π and hydrogen interactions, was evaluated. Moreover, two conductive polymers, PPy and PPy.CTAB, were also examined. These materials also present pyridinium groups that can interact with the analytes through π–π and hydrogen interactions. In addition, all the selected materials exhibit a large surface area, which can increase the contact surface of the analyte with the extraction phase [17,20].
The results of the extraction efficiency comparison of each material are shown in Figure 1. According to the bar graph of Figure 1, it was observed that for CBZ, NAP, and EE2 the hybrid material Si3Py+Cl presented the best extraction efficiency, and the conductive polymers presented the best extraction efficiency for DCL, FLU, and LOS. However, for NAP the extraction efficiency was overwhelming when using Si3Py+Cl; moreover, standard deviations were smaller when the extraction phase comprised of Si3Py+Cl was used. Thus, Si3Py+Cl was selected as the extraction phase for this study.

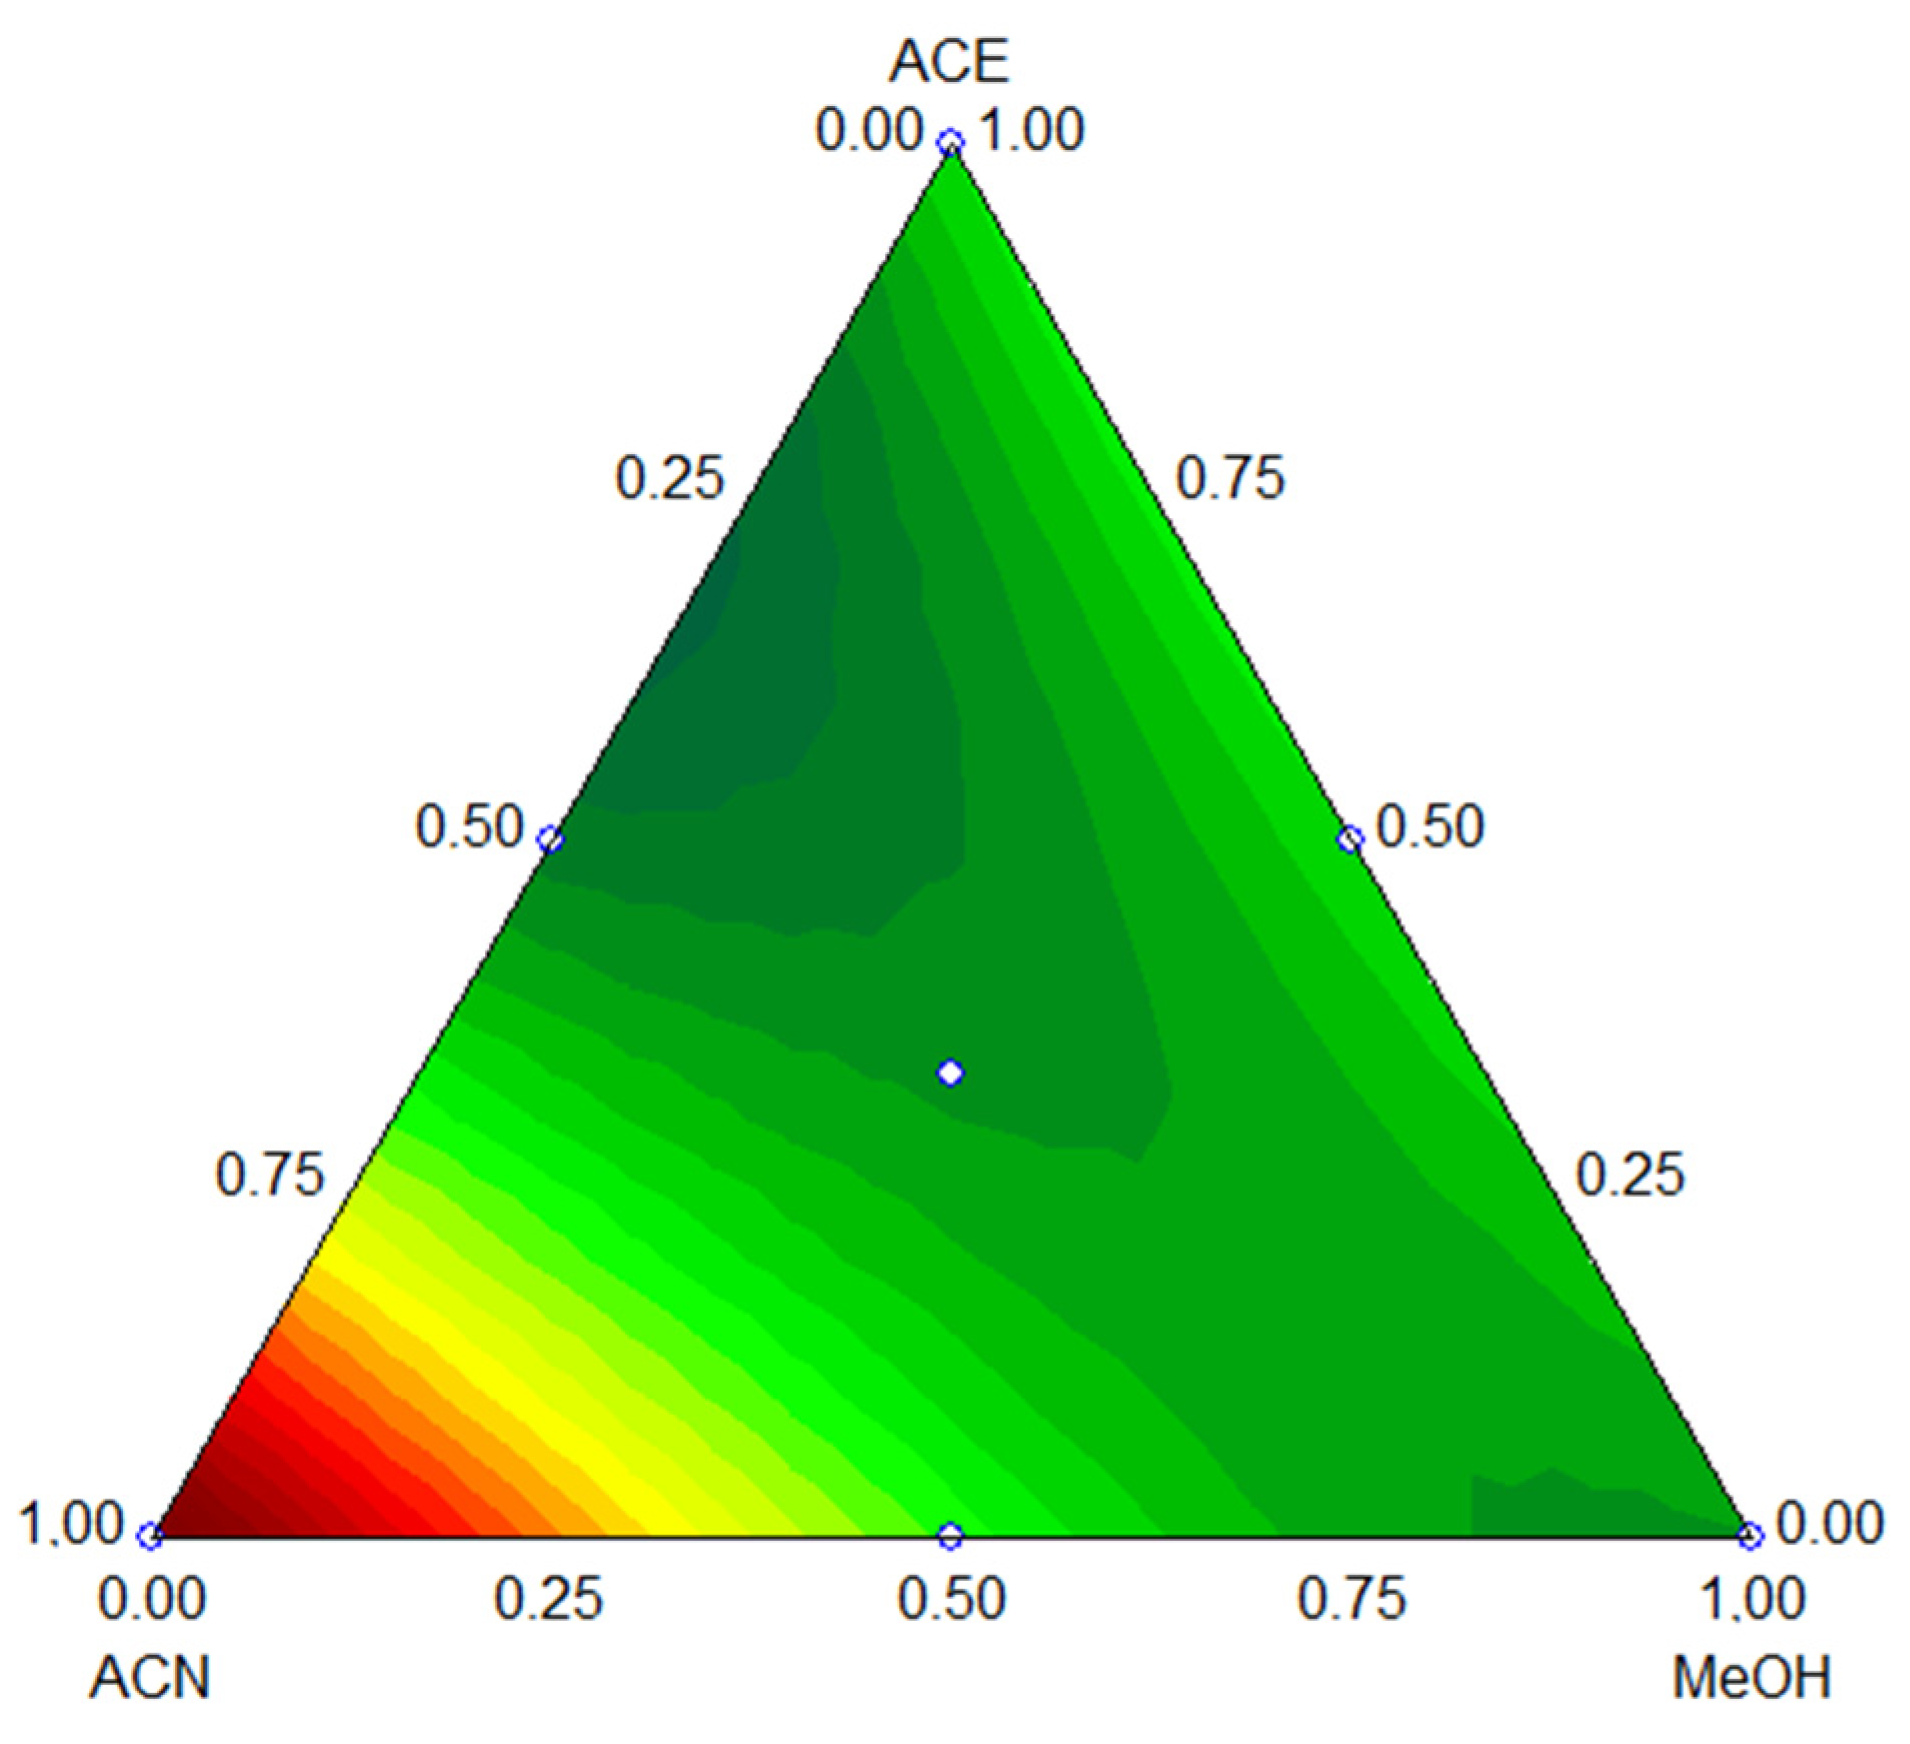
3.1.2. Optimization of the Desorption Solvent

The choice of the most suitable solvent is an important step to ensure appropriate desorption of the analytes from extraction phase and to avoid any carryover effect. A triangular surface obtained from a simplex-lattice design is shown in Figure 2. It can be observed that ACN presented the highest performance as desorption solvent when 100% of this organic solvent was used. Therefore, ACN was used in further experiments.

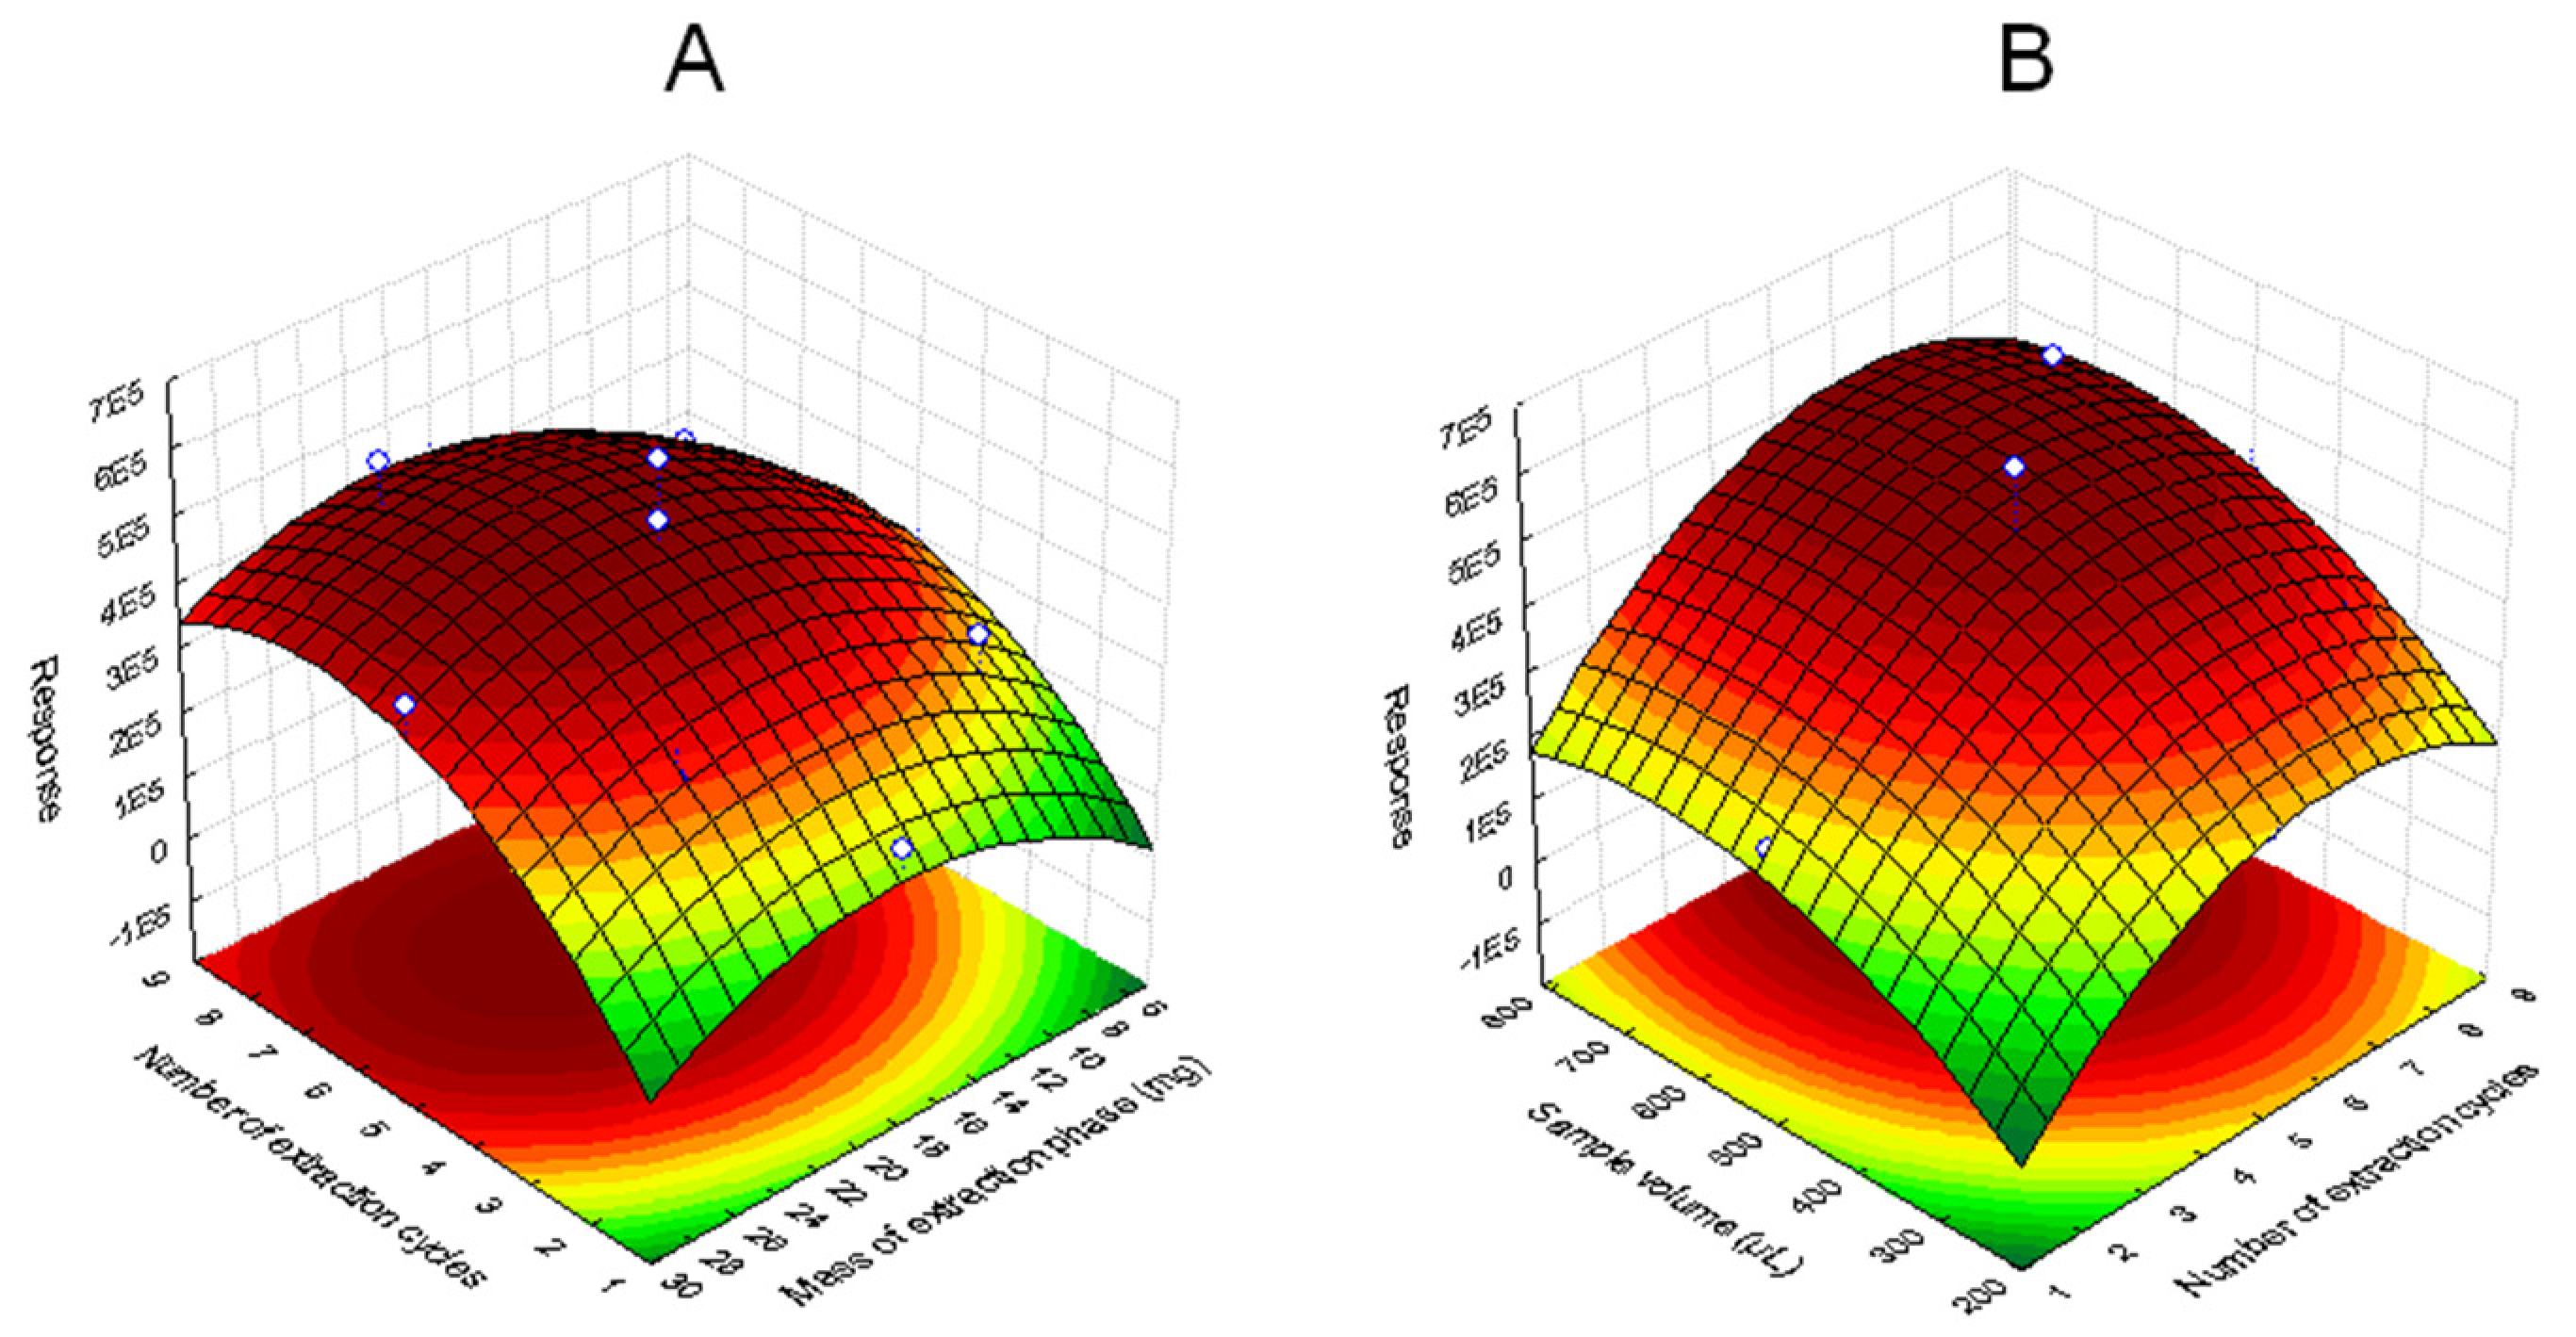
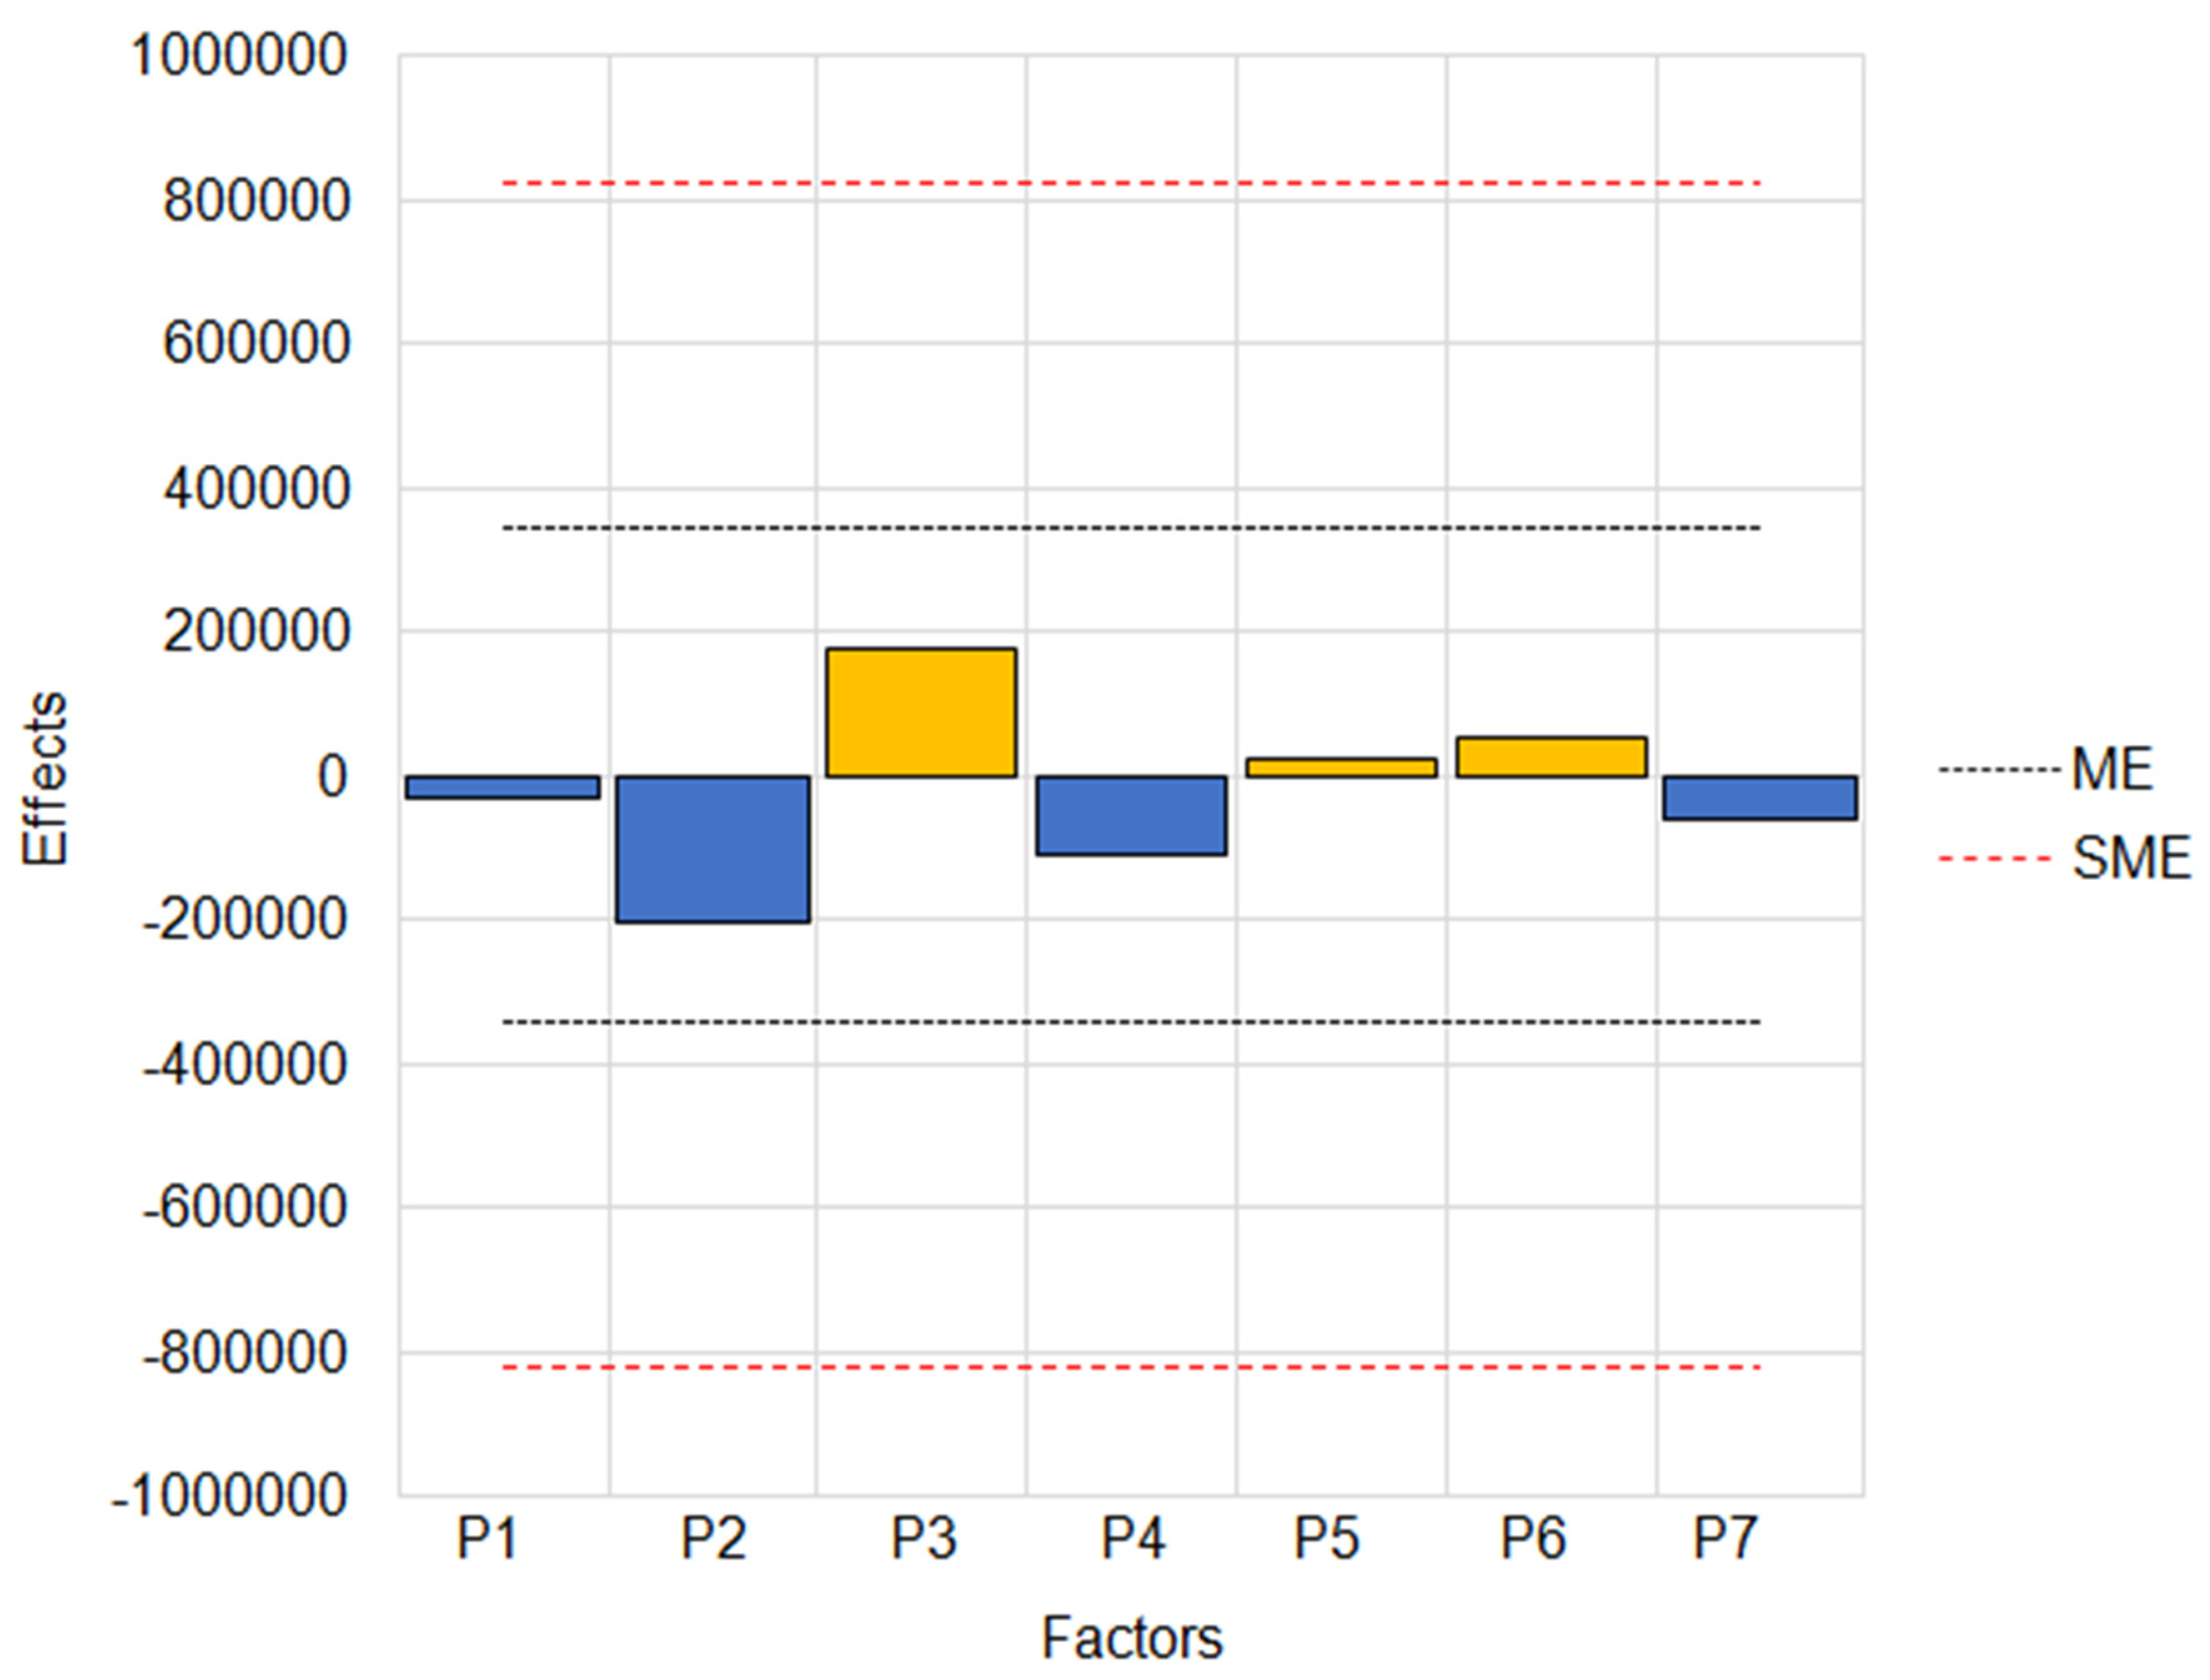
3.1.3. Optimization of Extraction Step

In this step, a central composite design with 17 experiments was employed to evaluate the number of extraction cycles (1 to 9), sample volume (200 to 810 µL), and mass of extraction phase (5 to 30 mg). The response surfaces obtained are shown in Figure 3A,B.
According to Figure 3A, the chromatographic response using low mass of extraction phase was not satisfactory; nor did a large mass exhibit good responses. This is because a large mass of extraction phase can hinder the dynamic mixture between the sample and extraction phase. Therefore, the best response was obtained with 20 mg of Si3Py+Cl. According to Figure 3B, it can be observed that enhanced chromatographic responses were obtained when the sample volumes were increased. However, the capacity of the DPX (1 mL) limits the sample volume. In this case, 700 µL of sample was the ideal volume for the DPX procedure. Regarding the number of extraction cycles, it can be noted that six cycles were enough to obtain satisfactory analytical responses. Therefore, six cycles were selected for further experiments. The mathematical function for this figure is presented in Equations (1) and (2).
According to Figure 3A, the chromatographic response using low mass of extraction phase was not satisfactory, nor did a large mass exhibit good responses. This is because a large mass of extraction phase can hinder the dynamic mixture between the sample and extraction phase. Therefore, the best response was obtained with 20 mg of Si3Py+Cl-. According to Figure 3B, it can be observed that enhanced chromatographic responses were obtained when the sample volumes were increased. However, the capacity of the DPX (1 mL) limits the sample volume. In this case, 700 µL of sample was the ideal volume for the DPX procedure. Regarding the number of extraction cycles, it can be noted that six cycles were enough to obtain satisfactory analytical responses. Therefore, six cycles were selected for further experiments. The mathematical function for this figure is presented in Equations (1) and (2).
Z = − 597122,13926468 + 127215,4901441 × x − 10962,634303935 × x2 + 25803,003356547 × y − 929,44970952146 × y2 + 431,83464609519 × x × y + 9,690852560031 × 502,647059 × x + 15,504551823089 × 502,647059 × y + 346746,501
Z = −597122,13926468 + 127215,4901441 × x − 10962,634303935 × x2+25803,003356547 × y− 929,44970952146 × y2+431,83464609519 × x × y + 9,690852560031 × 502,647059 × x + 15,504551823089 × 502,647059 × y + 346746,501

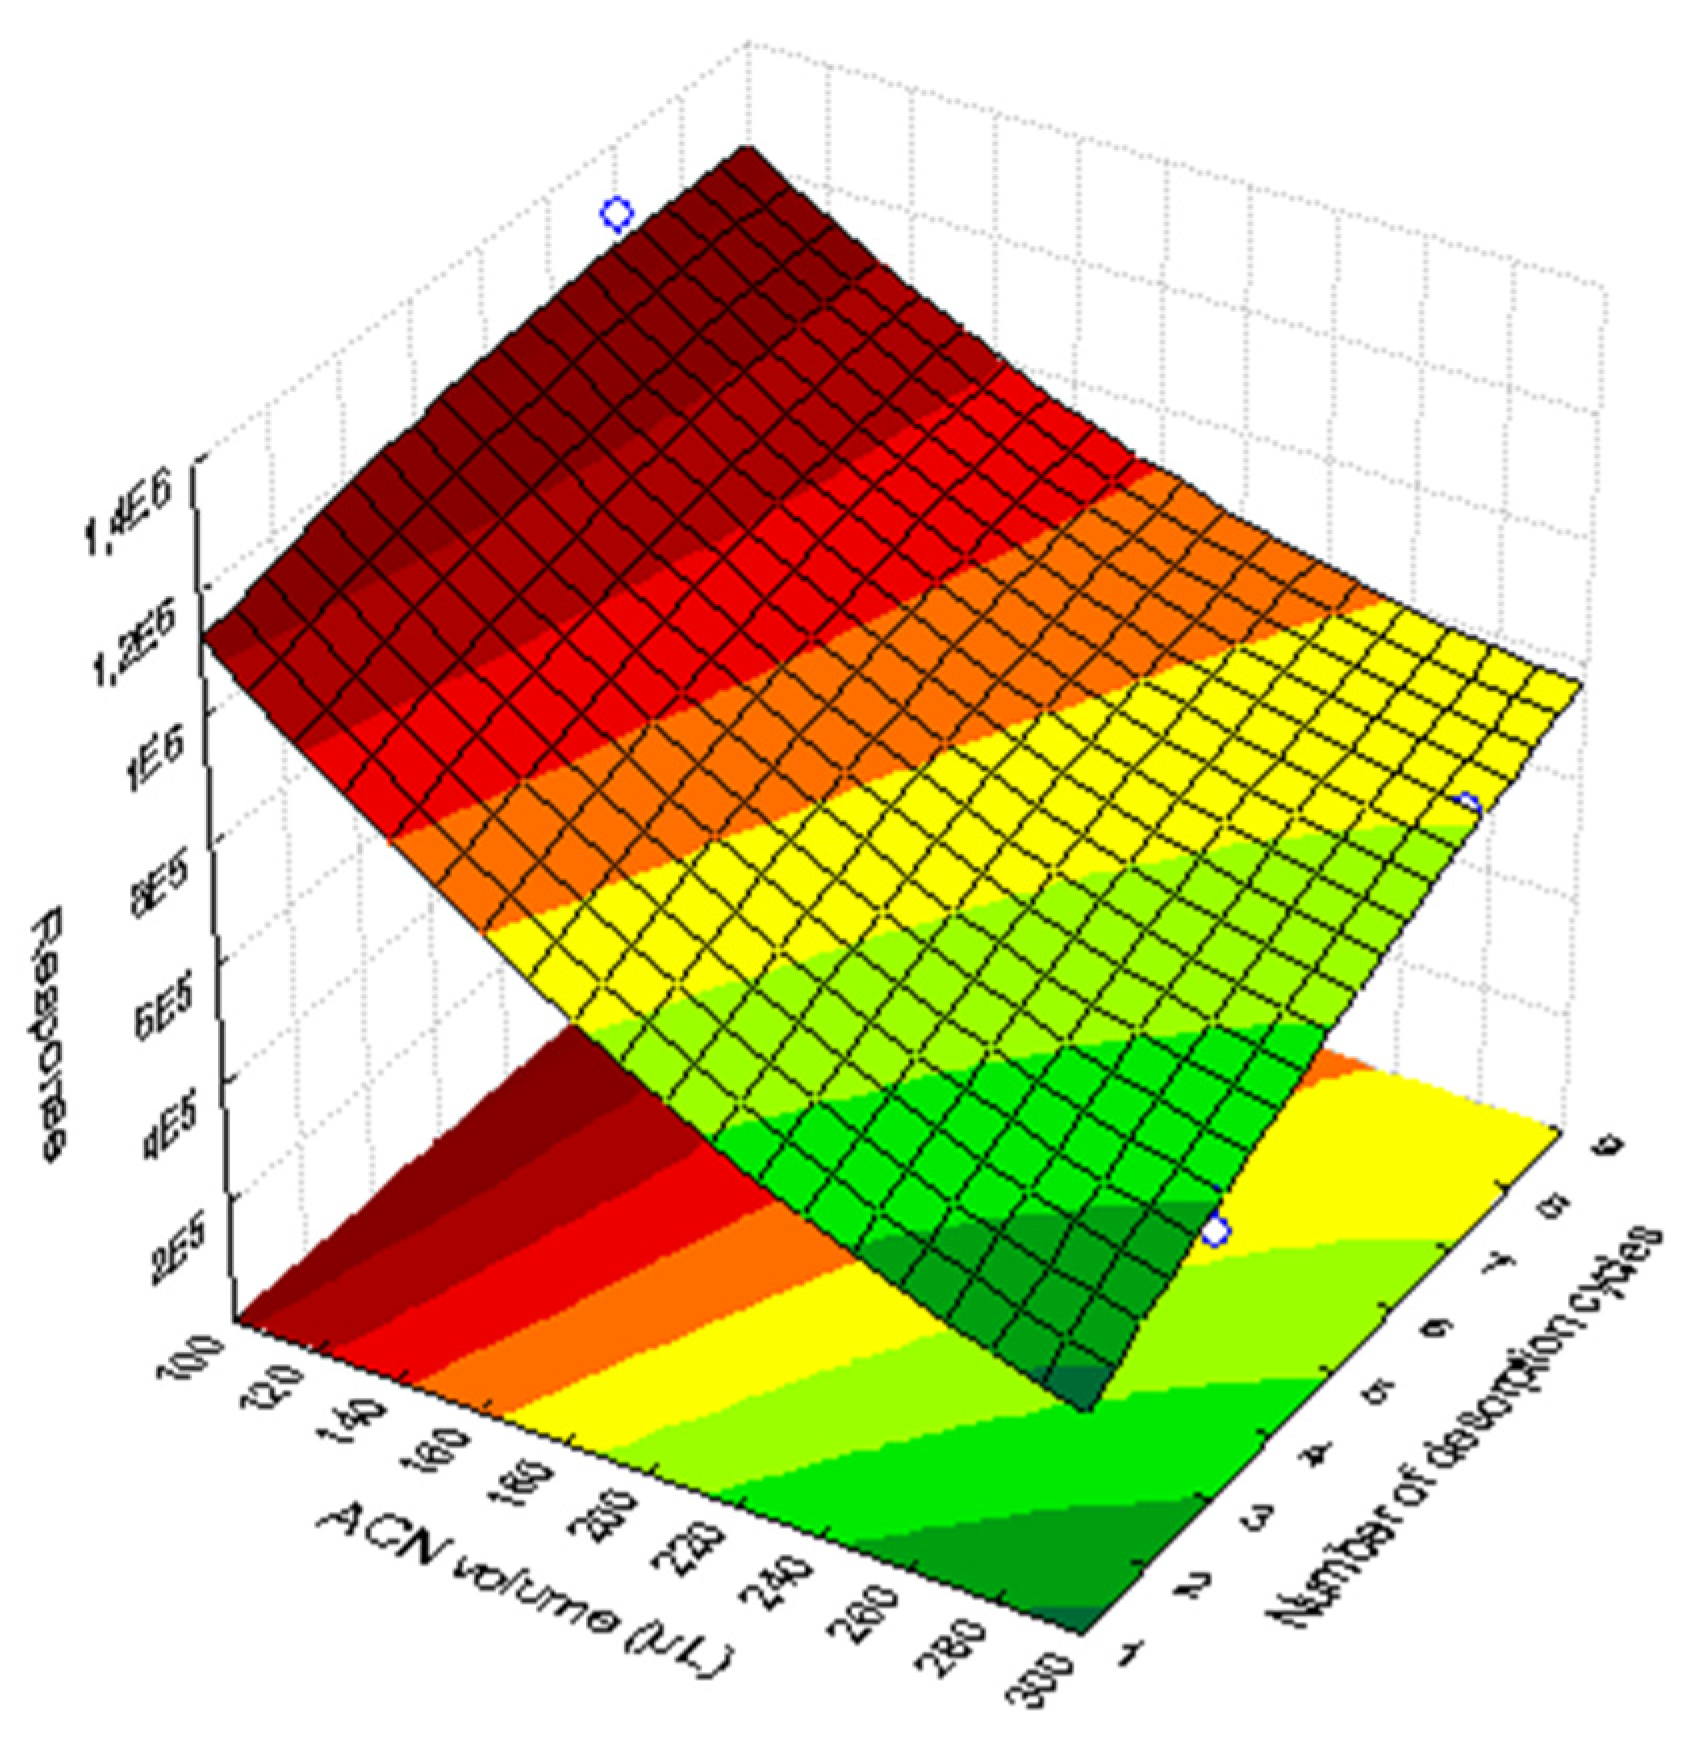
3.1.4. Optimization of the Desorption Step

A Doehlert design was used to evaluate the number of desorption cycles and volume of desorption solvent. It can be observed in Figure 4 that the best response was obtained with 100 µL of ACN. The number of desorption cycles did not present a significant influence on the overall response; thus, 3 cycles with 100 µL of ACN (same aliquot) were selected for desorbing the analytes.

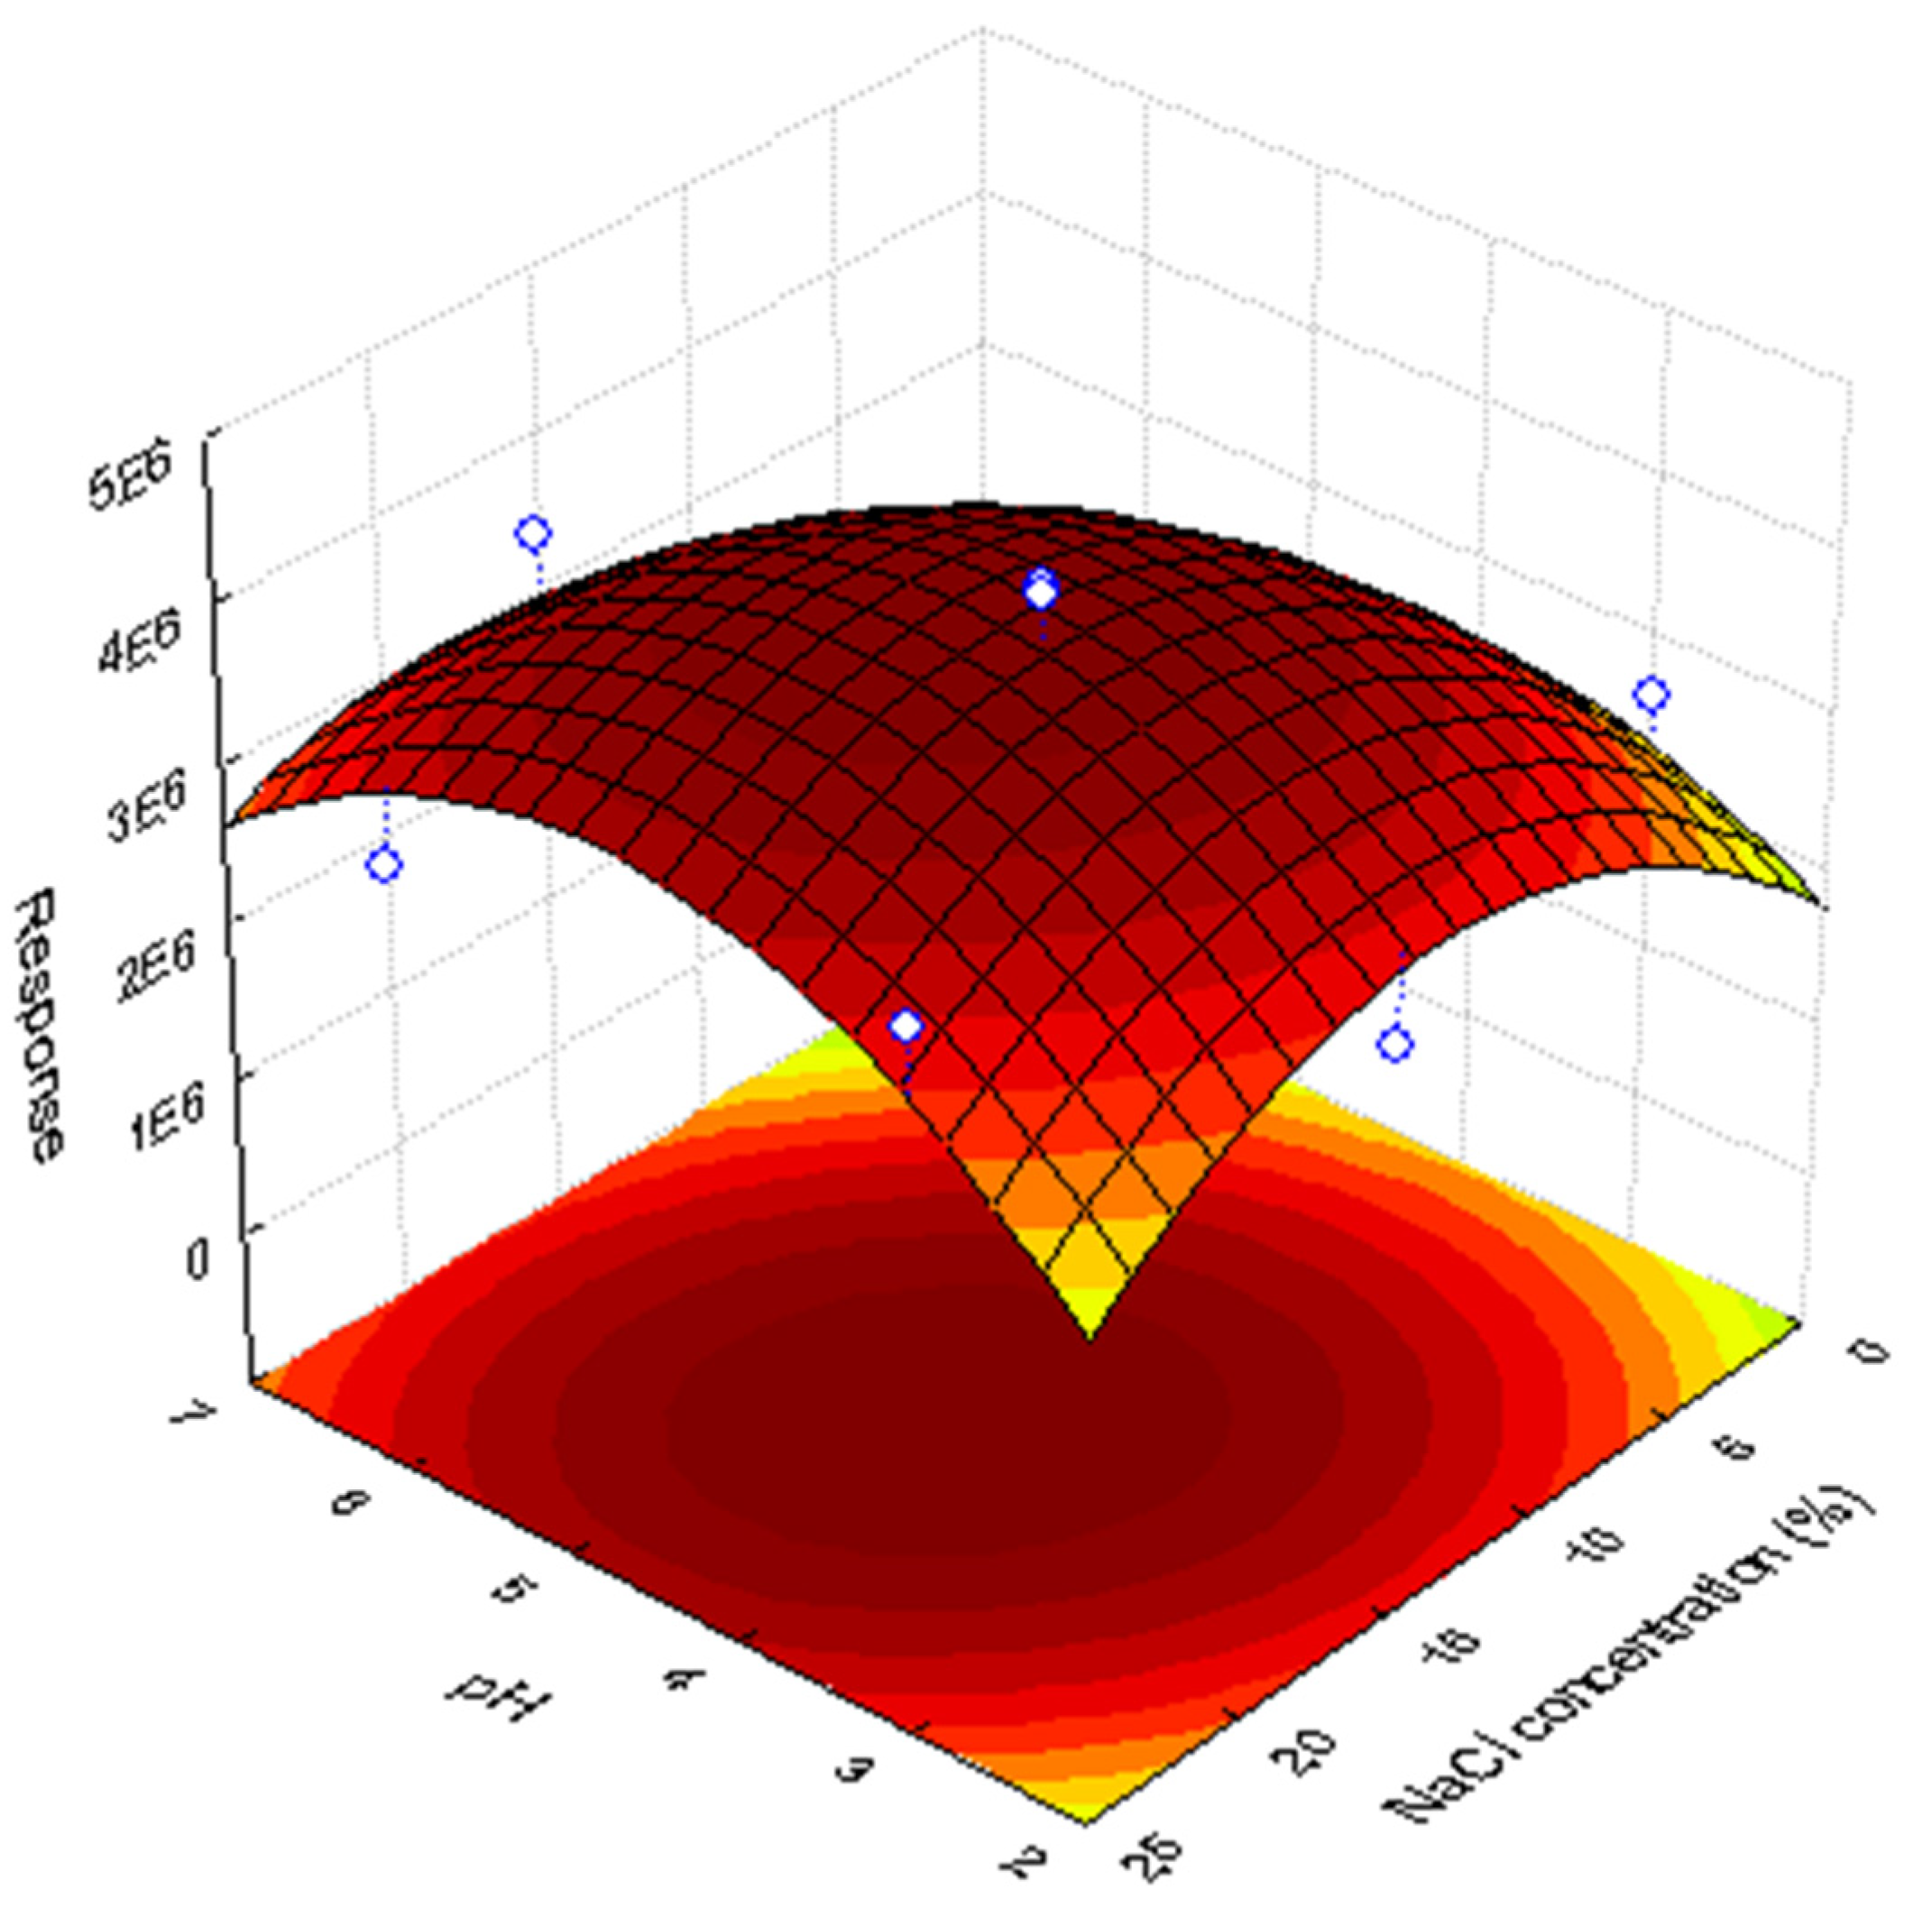
3.2. Evaluation of PH and Salting-Out Effect

A Doehlert design with nine experiments was adopted to optimize the sample pH and salting-out effect. In most of the extraction procedures, it is preferable for the analytes to remain in the neutral form to enhance the chemical interactions with the extraction phase. For acidic compounds, the pH must be 1.5 units lower than the pKa of the analytes [13]. The pKa of the analytes under study are 15.96, 4.00, 4.19, 9.80, 5.85, and 10.33 for CBZ, DCL, NAP, FLU, LOS, and EE2, respectively. As DCL exhibits a lower pKa value, the pH of the sample was evaluated from 2 to 7.
Salt addition may exhibit an influence on the mass transfer of the analyte due to the salting-out or salting-in effects. An increase in salt content can decrease the solubility of analytes in the aqueous sample, facilitating the migration to the extraction phase (salting-out effect). This effect is more pronounced in polar compounds [25]. In this particular case, it can be observed that the analytes exhibit non-polar to medium polarity aspects with log Ko/w of 2.77, 4.26, 2.99, 4.17, 5.00, and 3.90 for CBZ, DCL, NAP, FLU, LOS, and EE2, respectively. So, this parameter was evaluated from 0 to 25% w/v of NaCl. The response surface obtained is shown in Figure 5.
As can be seen in Figure 5, the best chromatographic responses were achieved over a wide range of pH and NaCl concentrations. At pH 3.5, most of the analytes are in the neutral form, which can favor the interaction with the extraction phase. Regarding NaCl concentration, 15% (w/v) of NaCl exhibited the best extraction condition.
Thus, after optimizing the experimental conditions, the following parameters were adopted: 20 mg of Si3Py+Cl as extraction phase; six extraction cycles with 700 μL of sample in each cycle and 15 s of extraction time; three desorption cycles with 100 μL of ACN (same aliquot) and 15 s of desorption time; and sample pH 3.5 and addition of 15% (w/v) of NaCl in the sample.

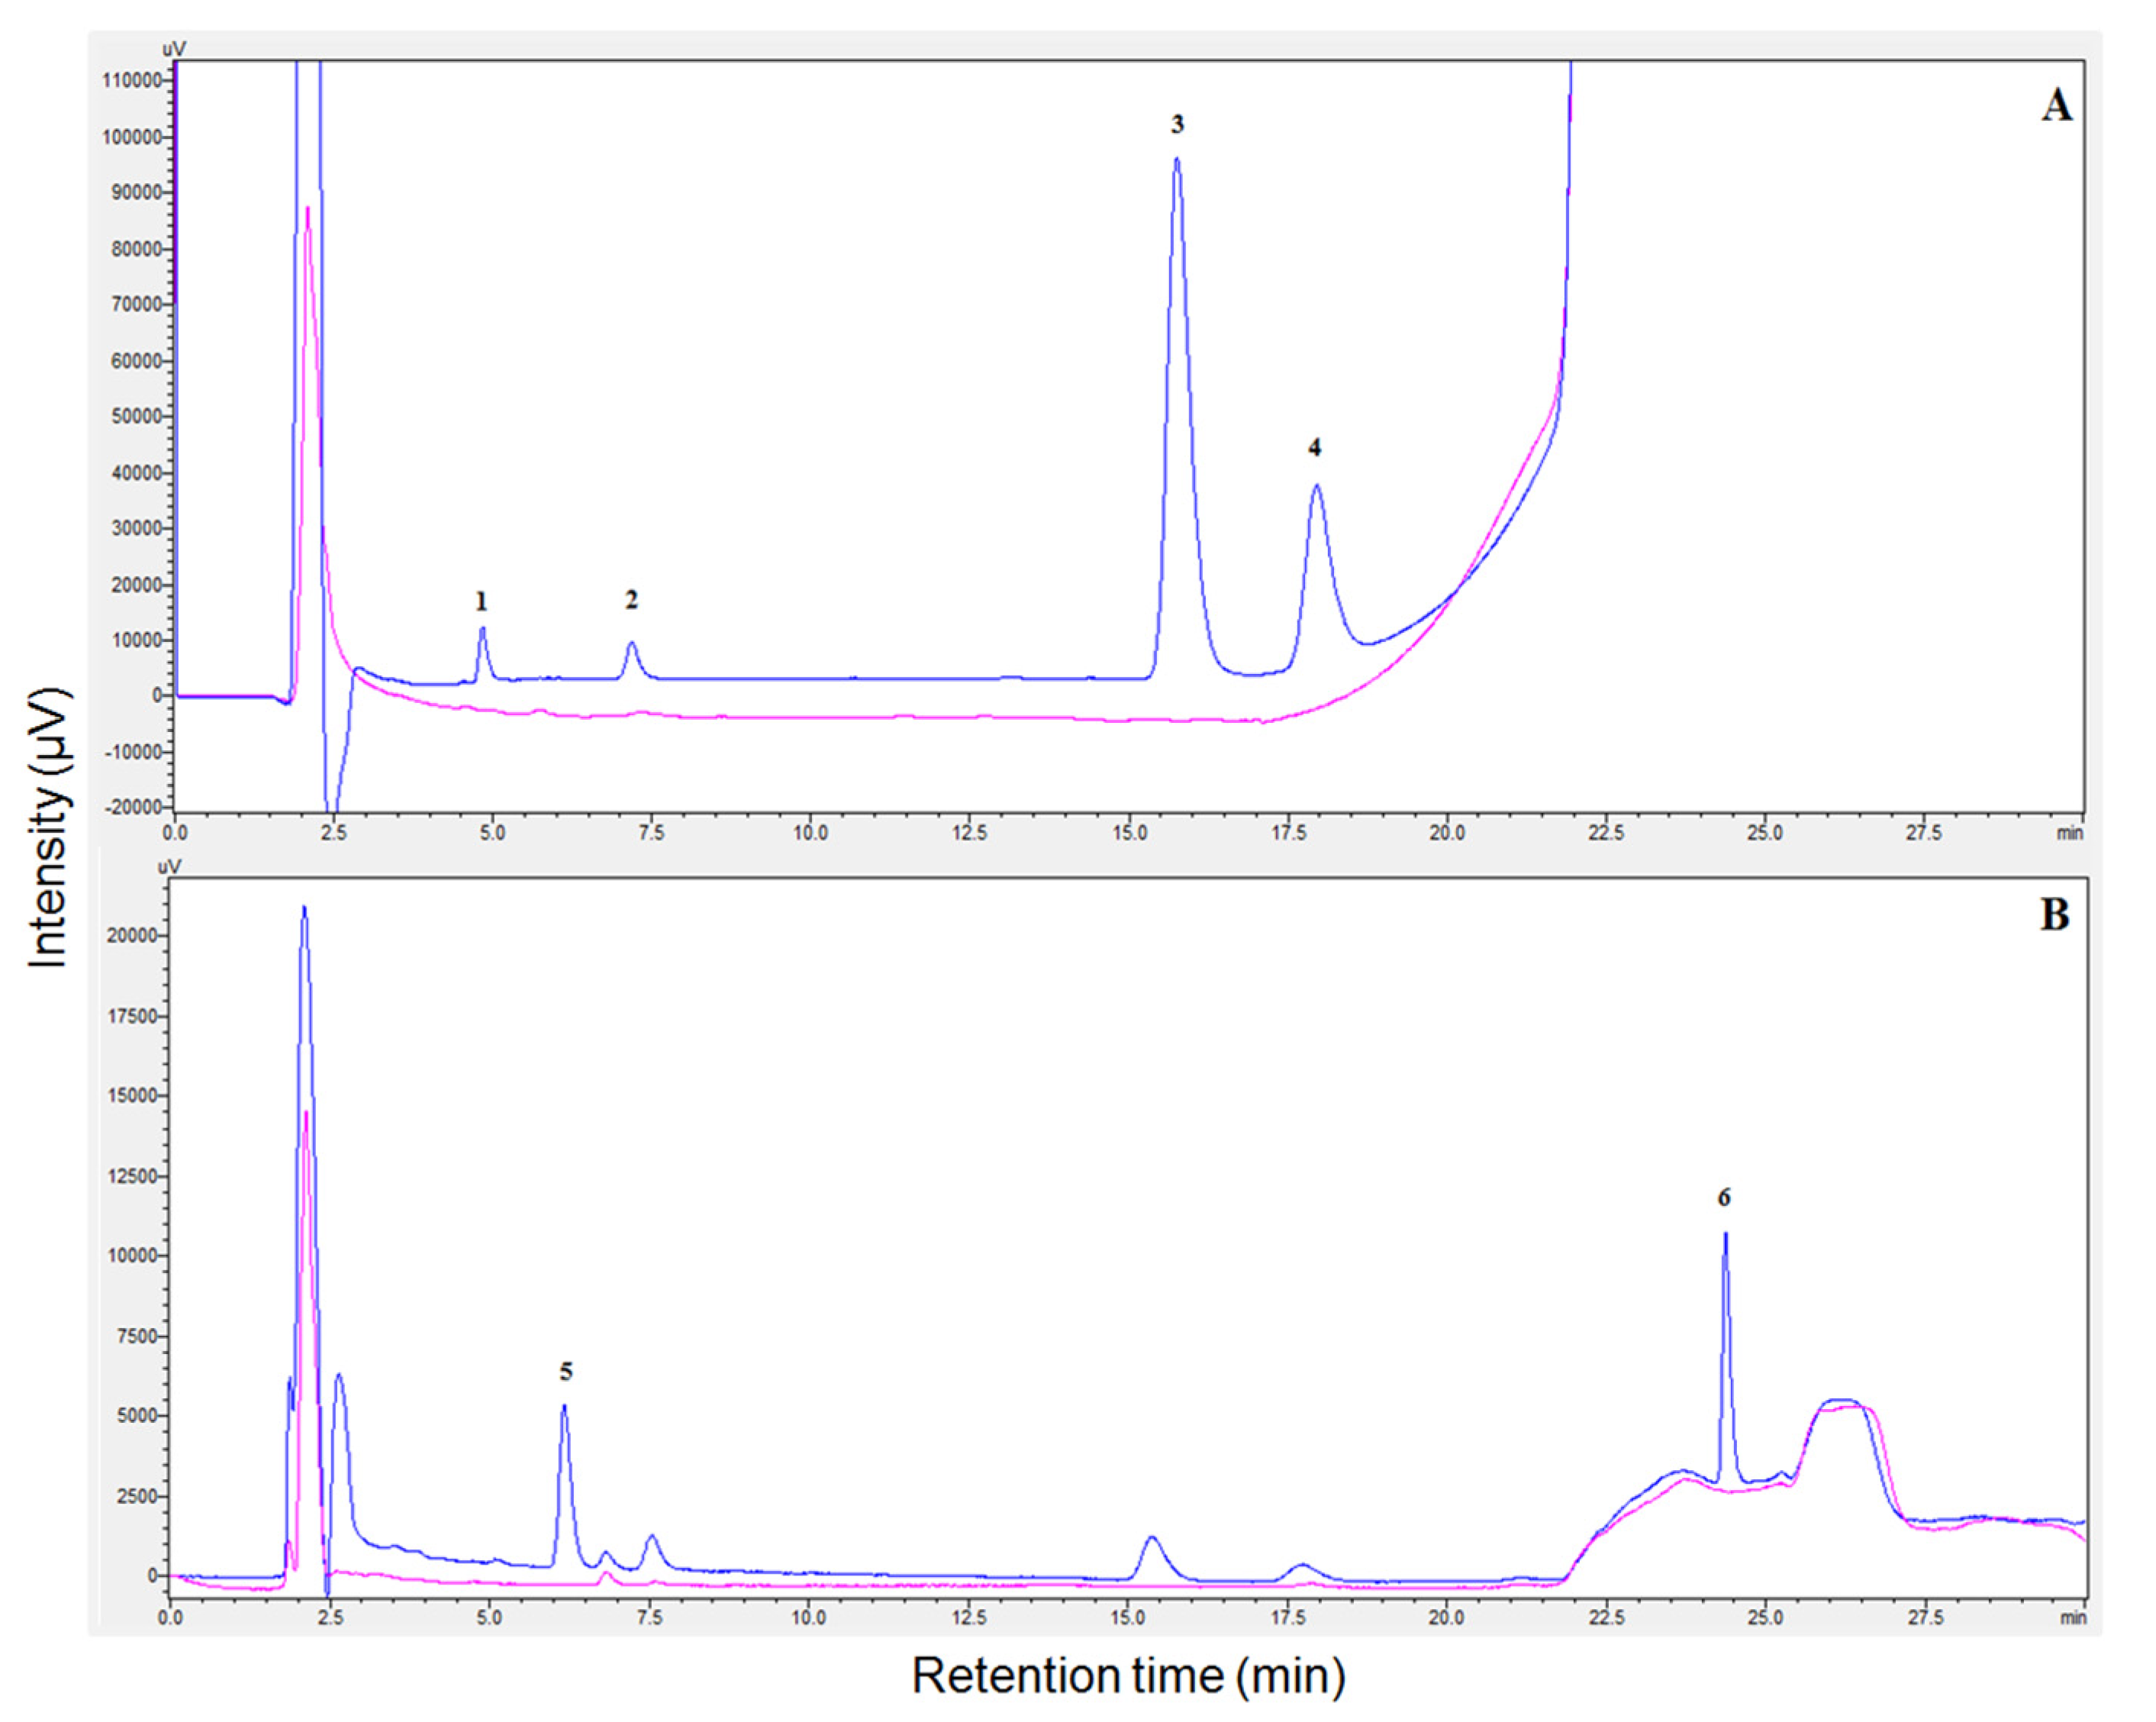
3.3. Analytical Figures of Merit and Analysis of Hospital Wastewater Samples

Calibration curves were obtained using hospital wastewater analyte-free samples spiked with the analytes at six concentration levels. The extractions/desorptions were performed under optimized conditions, and the results are shown in Table 2. The correlation coefficients (r) obtained were satisfactory, varying from 0.9710 to 0.9996, indicating a good correlation of instrument response (y) and analyte concentration (x) [26]. The LOD values ranged from 0.030 µg L−1 for NAP to 1.510 µg L−1 for CBZ and DCL, and the LOQ values ranged from 0.10 µg L−1 for NAP to 5.00 µg L−1 for CBZ and DCL.
The accuracy of the proposed method was evaluated using hospital wastewater samples spiked at three concentration levels. As can be seen in Table 3, the relative recovery obtained ranged from 80 to 127%. The precision was evaluated through intra and inter-day assays. The intra-day precision was evaluated in three concentration levels, and the inter-day precision was evaluated in one concentration level; both exhibited results lower than 19%. Most of the results are in accordance with validation guidelines [27]. Nevertheless, these results emphasized the applicability of the method developed for monitoring the pharmaceutical compounds of different classes in hospital wastewater.
The Youden test was performed to assess the robustness of the method. Small variations of the main parameters that can affect the extraction by DPX procedure were performed [28]. The parameters and variations adopted were used as follows: mass of Si3Py+Cl (18 to 22 mg), concentration of NaCl (12 to 18% w/v), sample pH (3.0 to 4.0), sample volume (680 to 720 µL), number of extraction cycles (5 to 7), volume of ACN for the desorption step (80 to 120 µL), and number of desorption cycles (2 to 4). The results were evaluated through the Lenth’s graphic shown in Figure 6. Simultaneous margins of error (SME) are reference lines and should be considered, taking into account that multiple effects were assessed [29,30]. According to Figure 6, no parameter exceeded this limit, so the method can be considered robust.
In addition, a comparison with other previously reported methods is shown in Table 4. As can be observed, in this work, the volume of organic solvent and mass of extraction phase are smaller in relation to the other methods, at only 100 µL and 20 mg of Si3Py+Cl, respectively. In previous studies, authors used 280 µL to 41 mL of organic solvent and 40 to 200 mg of extraction phase. These values can evidence the environmentally-friendly aspects of the methodology developed. Another important factor is the sample preparation time; in this study, only 6.5 min were required to accomplish all sample preparation steps, including pH and ionic strength adjustments. According to literature, 21 min to almost 2 h were required as sample preparation time in previous studies listed in Table 4. This high-throughput aspect is particularly important when multiple samples need to be analyzed. In relation to LOQs, this method exhibits comparable or lower values using the FLD detector (for the analytes NAP and LOS) than those obtained using DAD or UV detectors for the same compounds [31,32,33]. For EE2, the LOQ obtained in this work was comparable to the results obtained using a methodology with GC-MS [34]. Therefore, the LOQs obtained with the methodology proposed can be considered very satisfactory since the instrumentation used is relatively simple compared to some studies when mass spectrometry detectors have been employed.
Two samples, namely, A and B, were used to evaluate the method proposed in monitoring pharmaceutical compounds in hospital wastewater. LOS and FLU were identified as lower than LOQ in effluent B. No analyte was identified in effluent A. A comparison between the extractions of hospital wastewater (sample B) without spiking (pink line) and spiking the analytes (blue line) is shown in Figure 7A comparison using an FLD detector with a sample spiked with the analytes at 10 µg L−1 of 1-FLU, 2-LOS, 3-NAP, and 4-EE2 is shown in Figure 7A; and a comparison obtained with a DAD detector at 280 nm using a sample spiked with 100 µg L−1 of 5-CBZ and 6-DCL is shown in Figure 7B.

4. Conclusions

In this study, an environmentally-friendly method based on a DPX procedure using an alternative extraction phase was fully optimized and used for the determination of environmental pollutants in wastewater samples. The advantages of the method include the low volume of organic solvent employed (only 100 µL) and the high throughput since the extraction can be performed in 6.5 min. Three materials were evaluated, and the hybrid material Si3Py+Cl exhibited the best analytical performance. This material is easy to synthesize, and it presents a low cost, which makes this method accessible for application in other laboratories. The proposed method was fully optimized through univariate and multivariate approaches, and the analytical parameters of merit were very satisfactory, with acceptable LOQs that are comparable to previously reported methodologies. Moreover, the applicability of the Si3Py+Cl-DPX-based method was demonstrated in the analysis of hospital wastewater for monitoring different pharmaceutical classes using simple analytical instrumentation. This study has expanded the applicability of the hybrid material Si3Py+Cl to wastewater complex matrices to determine compounds from different pharmaceutical classes.

Author Contributions

V.M., G.C., H.A.M., J.M. and E.C. participated in the same proportion. All authors have read and agreed to the published version of the manuscript.

Funding

Conselho Nacional de Desenvolvimento Científico e Tecnológico (CNPq), process number 303892/2014-5. Coordenação de Aperfeiçoamento de Pessoal de Nível Superior-Brasil (CAPES)-Finance Code 001.

Informed Consent Statement

Not applicable.

Data Availability Statement

Not applicable.

Acknowledgments

The authors are grateful to the Brazilian governmental agency “Conselho Nacional de Desenvolvimento Científico e Tecnológico (CNPq) and Coordenação de Aperfeiçoamento de Pessoal de Nível Superior” for the financial support which made this research possible.

Conflicts of Interest

The authors declare no conflict of interest.

References

  1. Li, W.C. Occurrence, sources, and fate of pharmaceuticals in aquatic environment and soil. Environ. Pollut. 2014, 187, 193–201. [Google Scholar] [CrossRef]
  2. de Almeida, C.A.A.; Brenner, C.G.B.; Minetto, L.; Mallmann, C.A.; Martins, A.F. Determination of anti-anxiety and anti-epileptic drugs in hospital effluent and a preliminary risk assessment. Chemosphere 2013, 93, 2349–2355. [Google Scholar] [CrossRef]
  3. Gracia-Lor, E.; Sancho, J.V.; Serrano, R.; Hernandez, F. Occurrence and removal of pharmaceuticals in wastewater treatment plants at the Spanish Mediterranean area of Valencia. Chemosphere 2012, 87, 453–462. [Google Scholar] [CrossRef] [Green Version]
  4. Al Aukidy, M.; Verlicchi, P.; Voulvoulis, N. A framework for the assessment of the environmental risk posed by pharmaceuticals originating from hospital effluents. Sci. Total Environ. 2014, 493, 54–64. [Google Scholar] [CrossRef]
  5. Azuma, T.; Arima, N.; Tsukada, A.; Hirami, S.; Matsuoka, R.; Moriwake, R.; Ishiuchi, H.; Inoiama, T.; Teranishi, Y.; Yamaoka, M.; et al. Detection of pharmaceuticals and phytochemicals together with their metabolites in hospital effluents in Japan, and their contribution to sewage treatment plant influents. Sci. Total Environ. 2016, 548, 189–197. [Google Scholar] [CrossRef] [PubMed]
  6. Onesios, K.M.; Yu, J.T.; Bouwer, E.J. Biodegradation and removal of pharmaceuticals and personal care products in treatment systems: A review. Biodegradation 2019, 20, 441–466. [Google Scholar] [CrossRef] [PubMed]
  7. Xiang, J.J.; Wu, M.H.; Lei, J.Q.; Fu, C.; Gu, J.Z.; Xu, G. The fate and risk assessment of psychiatric pharmaceuticals from psychiatric hospital effluent. Ecotox. Environ. Saf. 2018, 150, 289–296. [Google Scholar] [CrossRef] [PubMed]
  8. Marta, Z.; Bobaly, B.; Fekete, J.; Magda, B.; Imre, T.; Szabo, P.T. Simultaneous determination of ten nonsteroidal anti-inflammatory drugs from drinking water, surface water and wastewater using micro UHPLC-MS/MS with on-line SPE system. J. Pharmaceut. Biomed. 2018, 160, 99–108. [Google Scholar] [CrossRef]
  9. Puckowski, A.; Mioduszewska, K.; Lukaszewicz, P.; Borecka, M.; Caban, M.; Maszkowska, J.; Stepnowski, P. Bioaccumulation and analytics of pharmaceutical residues in the environment: A review. J. Pharmaceut. Biomed. 2016, 127, 232–255. [Google Scholar] [CrossRef]
  10. Babarahimi, V.; Talebpour, Z.; Haghighi, F.; Adib, N.; Vahidi, F. Validated determination of losartan and valsartan in human plasma by stir bar sorptive extraction based on acrylate monolithic polymer, liquid chromatographic analysis and experimental design methodology. J. Pharmaceut. Biomed. 2018, 153, 204–213. [Google Scholar] [CrossRef]
  11. Lima, D.L.D.; Silva, C.P.; Otero, M.; Esteves, V.I. Low cost methodology for estrogens monitoring in water samples using dispersive liquid-liquid microextraction and HPLC with fluorescence detection. Talanta 2013, 115, 980–985. [Google Scholar] [CrossRef]
  12. Wang, R.; Li, W.Q.; Chen, Z.L. Solid phase microextraction with poly(deep eutectic solvent) monolithic column online coupled to HPLC for determination of non-steroidal anti-inflammatory drugs. Anal. Chim. Acta 2018, 1018, 111–118. [Google Scholar] [CrossRef]
  13. Carasek, E.; Merib, J. Membrane-based microextraction techniques in analytical chemistry: A review. Anal. Chim. Acta 2015, 880, 8–25. [Google Scholar] [CrossRef] [PubMed]
  14. Bordin, D.C.; Alves, M.N.; de Campos, E.G.; De Martinis, B.S. Disposable pipette tips extraction: Fundamentals, applications and state of the art. J. Sep. Sci. 2016, 39, 1168–1172. [Google Scholar] [CrossRef]
  15. Brewer, W.E. Disposable Pipette Extraction. U.S. Patent 6566145B2, 9 February 2000. [Google Scholar]
  16. Chaves, A.R.; Moura, B.H.F.; Caris, J.A.; Rabelo, D.; Queiroz, M.E.C. The development of a new disposable pipette extraction phase based on polyaniline composites for the determination of levels of antidepressants in plasma samples. J. Chromatogr. 2015, 1399, 1–7. [Google Scholar] [CrossRef] [PubMed]
  17. Corazza, G.; Merib, J.; Magosso, H.A.; Bittencourt, O.R.; Carasek, E. A hybrid material as a sorbent phase for the disposable pipette extraction technique enhances efficiency in the determination of phenolic endocrine-disrupting compounds. J. Chromatogr. A 2017, 1513, 42–50. [Google Scholar] [CrossRef]
  18. Mafra, G.; Spudeit, D.; Brognoli, R.; Merib, J.; Carasek, E. Expanding the applicability of cork as extraction phase for disposable pipette extraction in multiresidue analysis of pharmaceuticals in urine samples. J. Chromatogr. B 2018, 1102–1103, 159–166. [Google Scholar] [CrossRef]
  19. Mores, L.; da Silva, A.C.; Merib, J.; Dias, A.N.; Carasek, E. A natural and renewable biosorbent phase as a low-cost approach in disposable pipette extraction technique for the determination of emerging contaminants in lake water samples. J. Sep. Sci. 2019, 42, 1404–1411. [Google Scholar] [CrossRef] [PubMed] [Green Version]
  20. Turazzi, F.C.; Morés, L.; Carasek, E.; Merib, J.; de Oliveira Barra, G.M. A rapid and environmentally friendly analytical method based on conductive polymer as extraction phase for disposable pipette extraction for the determination of hormones and polycyclic aromatic hydrocarbons in river water samples using high-performance liquid chromatography/diode array detection. J. Environ. Chem. Eng. 2019, 7, 103–156. [Google Scholar]
  21. Mravcakova, M.; Boukerma, K.; Omastova, M.; Chehimi, M.M. Montmorillonite/polypyrrole nanocomposites. The effect of organic modification of clay on the chemical and electrical properties. Mat. Sci. Eng. C Mater. 2006, 26, 306–313. [Google Scholar] [CrossRef]
  22. Ramoa, S.; Barra, G.M.O.; Merlini, C.; Schreiner, W.H.; Livi, S.; Soares, B.G. Production of montmorillonite/polypyrrole nanocomposites through in situ oxidative polymerization of pyrrole: Effect of anionic and cationic surfactants on structure and properties. Appl. Clay Sci. 2015, 104, 160–167. [Google Scholar] [CrossRef]
  23. Dimpe, K.M.; Nomngongo, P.N. Current sample preparation methodologies for analysis of emerging pollutants in different environmental matrices. TrAC Trend. Anal. Chem. 2016, 82, 199–207. [Google Scholar] [CrossRef]
  24. Bletsou, A.A.; Jeon, J.; Hollender, J.; Archontaki, E.; Thomaidis, N.S. Targeted and non-targeted liquid chromatography-mass spectrometric workflows for identification of transformation products of emerging pollutants in the aquatic environment. TrAC Trend. Anal. Chem. 2015, 66, 32–44. [Google Scholar] [CrossRef] [Green Version]
  25. Pawlinsyn, J. Handbook of Solid Phase Microextraction; Chemical Industry Press: Beijing, China, 2009. [Google Scholar]
  26. Barwick, V.J. Preparation of Calibration Curves: A Guide to Best Practice. 2003. Available online: https://www.lgcgroup.com/media/1735/prepration-of-calibration-curves_a-guide-to-best-practice.pdf (accessed on 24 June 2021).
  27. AOAC. Official Methods of Analysis, Appendix F: Guidelines for Standard Method Performance Requirements. 2016. Available online: http://www.eoma.aoac.org/app_f.pdf (accessed on 29 November 2019).
  28. Mulholland, M.; Waterhouse, J. Investigation of the limitations of saturated fractional factorial experimental designs, with confounding effects for an HPLC ruggedness test. Chromatographia 1988, 25, 769–774. [Google Scholar] [CrossRef]
  29. Bokor, I.; Sdraulig, S.; Sanagou, M. Robustness testing of an in-situ caesium extraction unit. J. Environ. Radioact. 2017, 178–179, 426–429. [Google Scholar] [CrossRef]
  30. Hund, E.; Vander Heyden, Y.; Haustein, M.; Massart, D.L.; Smeyers-Verbeke, J. Comparison of several criteria to decide on the significance of effects in a robustness test with an asymmetrical factorial design. Anal. Chim. Acta 2000, 404, 257–271. [Google Scholar] [CrossRef]
  31. Ashfaq, M.; Noor, N.; Saif-Ur-Rehman, M.; Sun, Q.; Mustafa, G.; Nazar, M.F.; Yu, C.P. Determination of Commonly Used Pharmaceuticals in Hospital Waste of Pakistan and Evaluation of Their Ecological Risk Assessment. Clean-Soil Air Water 2017, 45, 1–10. [Google Scholar] [CrossRef]
  32. Pebdani, A.A.; Dadfarnia, S.; Shabani, A.M.H.; Khodadoust, S.; Haghgoo, S. Application of modified stir bar with nickel:zinc sulphide nanoparticles loaded on activated carbon as a sorbent for preconcentration of losartan and valsartan and their determination by high performance liquid chromatography. J. Chromatogr. A 2016, 1437, 15–24. [Google Scholar] [CrossRef]
  33. Rashvand, M.; Vosough, M. Graphene oxide-polyaniline nanocomposite as a potential sorbent for dispersive solid-phase extraction and determination of selected pharmaceutical and personal care products in wastewater samples using HPLC with a diode-array detector. Anal. Methods 2016, 8, 1898–1907. [Google Scholar] [CrossRef]
  34. Arismendi, D.; Becerra-Herrera, M.; Cerrato, I.; Richter, P. Simultaneous determination of multiresidue and multiclass emerging contaminants in waters by rotating-disk sorptive extraction-derivatization-gas chromatography/mass spectrometry. Talanta 2019, 201, 480–489. [Google Scholar] [CrossRef]
Figure 1. Univariate evaluation of extraction phases Si3Py+Cl, Ppy, and PPy.CTAB using the DPX procedure in the extraction of CBZ, DCL, NAP, FLU, LOS, and EE2. Extraction was performed with 20 mg of each material; 100 µg L−1 of each analyte; five extraction cycles with 800 μL of sample in each cycle, and 15 s of extraction time; and five desorption cycles with 100 μL of ACN: MeOH, 1:1 v/v (same aliquot), and 15 s of desorption time.
Separations 08 00109 g001
Figure 2. Triangular surface obtained for the evaluation of the desorption solvent. Extraction was performed with 20 mg of Si3Py+Cl; 100 µg L−1 of each analyte, five extraction cycles with 800 μL of sample in each cycle and 15 s of extraction time; and five desorption cycles with 100 μL of each solvent and/or mixture of solvents and 15 s of desorption time.
Separations 08 00109 g002
Figure 3. Response surfaces obtained from a central composite design. (A) evaluation of the number of extraction cycles versus the mass of extraction phase (mg) and (B) evaluation of the sample volume (µL) versus the number of extraction cycles. Extraction was performed with 100 µg L−1 of each analyte, 15 s of extraction and desorption time, and 5 desorption cycles with 100 μL of ACN.
Separations 08 00109 g003
Figure 4. Response surface obtained from a Doehlert design employing volume of ACN and number of desorption cycles. Extraction was performed with 20 mg of Si3Py+Cl; 100 µg L−1 of each analyte; six extraction cycles with 700 μL of sample in each cycle and 15 s of extraction time; and five desorption cycles with 100 μL of ACN and 15 s of desorption time.
Separations 08 00109 g004
Figure 5. Response surface obtained from Doehlert design for the evaluation of pH and NaCl content (%). Extraction was performed with 20 mg of Si3Py+Cl; 100 µg L−1 of each analyte; six extraction cycles with 700 μL of sample in each cycle and 15 s of extraction time; and three desorption cycles with 100 μL of ACN and 15 s of desorption time.
Separations 08 00109 g005
Figure 6. Lenth’s graphic to assess the robustness of the method developed based on previously optimized Si3Py+Cl-DPX procedure.
Separations 08 00109 g006
Figure 7. Comparison between the extractions performed in hospital wastewater B without spiking (pink line) and with spiking (blue line) with the analytes. (A) comparison using FLD detector with sample spiked with 10 µg L−1 of 1-FLU, 2-LOS, 3-NAP, and 4-EE2. (B) comparison using DAD detector at 280 nm with sample spiked with 100 µg L−1 of 5-CBZ and 6-DCL.
Separations 08 00109 g007
Table 1. Chemical structures and some physicochemical properties of the analytes (ChemAxon).
AnalyteChemical StructurepKalog Ko/w
CBZ Separations 08 00109 i00115.962.77
DCL Separations 08 00109 i0024.004.26
NAP Separations 08 00109 i0034.192.99
FLU Separations 08 00109 i0049.804.17
LOS Separations 08 00109 i0055.855.00
EE2 Separations 08 00109 i00610.333.90
Table 2. Linear equation, linear range, correlation coefficients, limits of detection, and quantification obtained for the pharmaceutical compounds in hospital wastewater using the fully optimized Si3Py+Cl-DPX-based procedure.
AnalyteLinear EquationLinear Range (µg L−1)Correlation Coefficient (r)LOD (µg L−1)LOQ (µg L−1)
CBZy = 645.03x − 731.965–1000.99961.5105.00
DCLy = 760.09x − 2089.95–1000.99901.5105.00
NAPy = 262281x − 218770.1–100.99960.0300.10
FLUy = 9805.6x + 34351–500.97100.3031.00
LOSy = 11535x − 5496.70.5–1000.99910.1510.50
EE2y = 101441x − 137060.5–250.99940.1510.50
Table 3. Relative recovery, and intra and inter-day precisions for the pharmaceutical compounds in hospital wastewater using the fully optimized Si3Py+Cl-DPX-based procedure.
AnalyteSpiked Concentration (µg L−1)Relative Recovery (%, n = 3)Precision (RSD, %)
Intra-Day (n = 3)Inter-Day (n = 9)
CBZ5118615
2512713
1009713
DCL586819
259419
100867
NAP0.1011019
111318
5117718
FLU1835
598410
251157
LOS0.501201
5108619
1008012
EE20.59713
51181217
2510915
Table 4. Comparison of Si3Py+Cl-DPX-based procedure with methods previously reported in literature.
MethodAnalyteExtraction PhaseMatrixLinear Range (µg L−1)LOQ (µg L−1)Time of Sample PreparationSolvent Volume
This work
DPX and HPLC-DAD/FLD
CBZ20 mg of Si3Py+ClHospital wastewater5–10056.5 min100 µL
DCL5–1005
NAP0.1–100.1
FLU1–501
LOS0.5–1000.5
EE20.5–250.5
LLE and HPLC-UV (Ashfaq et al. 2017)DIC
NAP
40 mL of chloroformHospital wastewater300–1000012
8
-42 mL
SBSE and HPLC-UV (Pebdani et al. 2016)LOS50 mg of Ni:ZnS-ACUrine0.4–500.38Approximately 32 min280 µL
RDSE and GC-MS (Arismendi et al. 2019)DIC
EE2
40 mg of Oasis® HLBDrinking water and natural waters (well and river)0.1–1000.12
0.21
Approximately
115 min
10 mL
SPE and HPLC-DAD (Ngubane et al. 2019)DCL
NAP
200 mg of Oasis® HLBEstuary and seawater100–50000.036
0.025
-16 mL
DSPE and HPLC-DAD (Rashvand and Vosough 2016)CBZ
DCL
NAP
43 mg of GO-PANIEffluent from sewage
Treatment
Plants (STPs)
1.12
0.36
0.15
Approximately 21 min3.5 mL
SPE and HPLC-MS (Matongo et al. 2015)CBZ60 mg of Oasis® HLBSurface water and wastewater0.297–1000.891Approximately 112 min21 mL
HLB: hydrophobic-lipophilic balance; DSPE: dispersive solid phase extraction; GO-PANI: graphene oxide-polyaniline nanocomposite; LLE: liquid–liquid extraction; SBSE: stir bar sorptive extraction; Ni: ZnS-AC: nicel:zins sulphide nanoparticles loaded on activated carbon; and RDSE: rotating-disk sorptive extraction.
Publisher’s Note: MDPI stays neutral with regard to jurisdictional claims in published maps and institutional affiliations.

