Article

Quantitative Capillary Electrophoresis for Analysis of Extracellular Vesicles (EVqCE)

1
Department of Chemistry and Biomolecular Sciences, University of Ottawa, 10 Marie Curie, Ottawa, ON K1N 6N5, Canada
2
Department of Biology, University of Ottawa, 30 Marie Curie, Ottawa, ON K1N 6N5, Canada
*
Author to whom correspondence should be addressed.
Y.D. and L.R. contribute equally.
Submission received: 24 June 2021 / Revised: 23 July 2021 / Accepted: 26 July 2021 / Published: 29 July 2021

Abstract

:
Extracellular Vesicles (EVs) gained significant interest within the last decade as a new source of biomarkers for the early detection of diseases and a promising tool for therapeutic applications. In this work, we present Extracellular Vesicles Quantitative Capillary Electrophoresis (EVqCE) to measure an average mass of RNA in EVs, determine EV concentrations and the degree of EV degradation after sample handling. We used EVqCE to analyze EVs isolated from conditioned media of three cancer cell lines. EVqCE employs capillary zone electrophoresis with laser-induced fluorescent detection to separate intact EVs from free nucleic acids. After lysis of EVs with a detergent, the encapsulated nucleic acids are released. Therefore, the initial concentration of intact EVs is calculated based on a nucleic acid peak gain. EVqCE works in a dynamic range of EV concentrations from 108 to 1010 particles/mL. The quantification process can be completed in less than one hour and requires minimum optimization. Furthermore, the average mass of RNA was found to be in the range of 200–400 ag per particle, noting that more aggressive cancer cells have less RNA in EVs (200 ag per particle) than non-aggressive cancer cells (350 ag per particle). EVqCE works well for the degradation analysis of EVs. Sonication for 10 min at 40 kHz caused 85% degradation of EVs, 10 freeze-thaw cycles (from −80 °C to 22 °C) produced 40%, 14-day storage at 4 °C made 32%, and vortexing for 5 min caused 5% degradation. Presently, EVqCE cannot separate and distinguish individual EV populations (exosomes, microvesicles, apoptotic bodies) from each other. Still, it is tolerant to the presence of non-EV particles, protein-lipid complexes, and protein aggregates.

Graphical Abstract

1. Introduction

Extracellular Vesicles (EVs) are biological particles released from various cells and found in large numbers in the body fluid, including blood, saliva, amniotic fluid, and urine. Most EVs consist of different molecules like proteins and nucleic acids (mRNA, miRNA, DNA), delimited by a phospholipid bilayer. EVs have a diameter range from 50–1000 nm, which can be distinguished as three broad classes, including exosomes (50–150 nm, originating from the endosomal pathway) and microvesicles (100–1000 nm, released from the plasma membrane) and apoptotic bodies (>1000 nm, budded during cell death) [1,2,3,4]. In practice, it is difficult to isolate different sub-categories of EVs since the collected samples contain heterogeneous EV populations. The significant overlap in size, similarities in composition, and lack of specific surface biomarkers have made their classification an extremely challenging experimental task [5].
EVs are increasingly recognized as important diagnostic and therapeutic entities. The understanding of EVs is correlated with the analysis of their physicochemical properties and concentrations. Therefore, accurate quantitative analysis of EVs and their contents is considered an essential and challenging topic [6,7,8,9,10,11]. EV quantification has proven technically challenging due to their small size and heterogeneity in size and composition. Generally, the current quantification of EVs can be classified into two categories. First, some methods quantify total biomolecular content (proteins, RNAs, lipids) [6,12] or counting the number of vesicles carrying particular EV biomarkers such as surface proteins or internal miRNAs [13,14]. In the second category, there are methods based on counting particles by their physical properties, e.g., size [15,16].
EV concentration is usually determined by measuring total protein concentration in EV-enriched samples using Bradford, Lowry, and bicinchoninic acid assays due to their convenience and sensitivity [17,18]. The quantification of a specific subset of EVs based on a membrane marker using immuno-recognition approaches is carried out by enzyme-linked immunosorbent assay (ELISA), surface plasmon resonance (SPR), and flow cytometry [19,20,21]. The determination of other biomolecular content such as RNAs or lipids is not typical for the quantification of EVs.
Another type of EV detection is based on direct particle counting. Nanoparticle tracking analysis (NTA) is the most commonly used technique to determine the size distribution and the concentration of EVs in solution [22,23,24,25,26]. Nevertheless, difficulties arise from NTA being a label-free technique whereby vesicles present in complex biological suspensions may be diverse and hard to distinguish from other types of particles like protein aggregates [26,27]. Also, considering the small size of EVs typically below the diffraction limit of visible light, small EVs cannot be resolved by standard optical microscopy. Like NTA, dynamic light scattering (DLS) determines the sizes and measures the concentration of EVs.
Recently, CE methods were developed for the detection and quantification of EVs. Takanori et al. conducted the determination by a microcapillary electrophoresis chip and a laser dark-field microscope with a camera [28]. This system enabled the sensitive imaging of individual EVs by light scattering. The concentration of EVs was found by counting bright spots. Marco et al. introduced a CE separation method with laser-induced fluorescent detection (CE-LIF) to quantify EVs [29]. The proteins were labeled by carboxyfluorescein diacetate succinimidyl ester (CFDA-SE) inside EVs, and the total fluorescent signal from EVs was measured to determine the concentration of EVs. Several EV subpopulations were separated using their different electrophoretic mobilities. Similarly, Yumeki et al. described an indirect CE-LIF method for semi-quantitation of EVs based on the immunological reaction between membrane protein and fluorescent antibody [30]. None of the methods could discriminate EVs from non-EV particles, protein-lipid complexes, protein aggregates and measure a degradation level of EVs.
In this work, we extended our previously developed method, viral quantitative capillary electrophoresis (Viral qCE), [31,32] for separation of intact EVs from impurities, for measuring RNA amount per EV, concentrations of EVs, and their degradation levels after isolations from cancer cells.

2. Materials and Methods

2.1. Chemicals and Materials

Sodium borate decahydrate (catalog no. SX0355-1, EMD Chemicals, Kankakee, IL, USA); YOYO-1 Iodide (catalog no. N7565, Invitrogen, Rockford, IL, USA); yeast RNA (catalog no. 55714, Calbiochem, San Diego, CA, USA); sodium dodecyl sulfate (catalog no. BP166-500, Fisher Scientific, Shanghai, China); RNase A (catalog no. 21210, Affymetrix, USA); FM 5-95 (N-(3-Trimethylammoniumpropyl)-4-(6-(Diethylamino)phenyl) hexatrienyl) Pyridinium Dibromide), (catalog no. T23360); fluorescent latex beads (cat.no. 1493, ApogeeMix, Hemel Hempstead, UK), bare silica capillary with O.D. 362.0 μm and I.D. 75.3 μm (catalog. no. TSP075375, Phoenix, AZ, USA). All buffers and samples were prepared from nuclease-free de-ionized water using a Synergy UV system supplied with a 13 kDa cut-off, BioPak Point-of-Use ultrafilter (Millipore, MA, USA).
Anti-Human CD9 PE (catalog no. 353008) and anti-Human CD63 APC (catalog no. 0S32703) characterized EVs in flow cytometry. The cancer cell lines, breast cancer (MDA-MB-231), lung adenocarcinoma cell line (NCI-H1975), and T lymphoblast cell lines (CCL-119) were purchased from ATCC (USA). Dulbecco’s phosphate-buffered saline (catalog no. D8537, Sigma, Gillingham, UK), Dulbecco’s modified eagle’s medium-high glucose (catalog no. D5796, Sigma Gillingham, UK), RPMI-1640 medium (catalog no. R8758, Sigma, Gillingham, UK), fetal bovine serum (FBS, catalog no. 17D192, Sigma, Gillingham, UK), penicillin and streptomycin (10,000 U/mL, catalog no. 15140-122, Gibco, Grand Island, NY, USA) were used in cell culturing.
To prepare EV-depleted FBS, 50 mL of FBS was ultracentrifuge at 100,000× g for 17 h in the SW28 swinging bucket rotor (Beckman Coulter, Brea, CA, USA). After centrifugation, the supernatants were collected slowly into a separate tube and stored at 4 °C for further use.

2.2. Isolation of EVs

MDA-MB-231 cells were grown in DMEM medium, while both NCIH-1975 cells and CCL-119 cells were cultured in RPMI-1640 medium, at 37 °C in 5% CO2/air. Above mentioned media were supplemented with 10% EV-depleted FBS and 1% of penicillin and streptomycin antibiotics. MDA-MB-231, NCIH1975, and CCL-119 cells were cultured individually from 48 h to 72 h or up to 70–80% confluency before the harvesting of EVs.
The method of EV collection from cancer cell-conditioned media involved a series of centrifugations, which sequentially increased the speed and time and thus pelleted the smaller particles. To harvest the EVs from cancer cells, a conditioned medium harvested from the cultured cells was centrifuged at 300× g for 10 min to remove cell debris and large protein complexes. The pellet was discarded, then the supernatant was collected. Subsequent ultracentrifugation with 2000× g for 30 min was performed to remove large EVs and apoptotic bodies. The pellet was discarded, and the supernatant was further subjected to ultracentrifugation at 100,000× g for 3 h at 4 °C using the SW28 Ti rotor (Beckman Coulter, Brea, CA, USA). The pellet was collected and resuspended with 1 mL of PBS and stored at 4 °C until further use. The schematic of EVs isolation and enrichment procedure is presented in Figure S1.

2.3. Nanoparticle Tracking Analysis (NTA)

The ZetaView nanoparticle tracking system PMX-110 (Particle Metrix, Meerbusch, Germany) was used to characterize the harvested EVs. The particle concentration and the size distribution confirmed the presence of EVs isolated from the cell culture-conditioned media. Polystyrene beads of 102 nm in size (Microtrac 900383) were used as an external control before each experiment. The EVs were diluted in 1× PBS to achieve a concentration within the 105–107 particles/mL range for optimal analysis.

2.4. Flow Cytometry

Beckman Coulter MoFlo Astrios EQ was used for EV detection. The buffers were filtered by 3 kDa (Amicon® Ultra-15 Centrifugal Filter Units) to reduce backgrounds.
For characterization and quantification in Table 1, EVs were subsequently incubated in the dark for 20 min with two antibodies, i.e., anti-human CD9 PE and anti-human CD63 APC. The control samples included the unstained EVs and pure buffer samples. For quantification in CE experiments, EVs were subsequently incubated in the dark for 20 min with two dyes: YOYO-1 and FM 5–95 (1 µM). Control samples included unstained EVs samples and pure buffer samples. All the data obtained from flow cytometry were analyzed using the Kaluza analysis software.
To find the flow rate in flow cytometry, control nanobeads of 110 nm were co-injected with EVs. The average flow rate (μL/s) was determined for a total of 71555 particles under 0.3 psi within 120 seconds and was found to be equal to 4.125 × 10⁻³ μL/s. This value is regarded as the average flow rate of EV samples during injection.

2.5. EV Staining and Lysis

EVs were stained with YOYO-1 dye to perform further quantification experiments. For staining, EVs were incubated with 2 µM of YOYO-1 for 30 min at RT according to the manufacturer’s protocol. Yeast RNAs were stained with 2 µM of YOYO-1 for 30 min at RT and used as standard RNA for the calibration curve. Chemical lysis of EVs was performed using 0.1% SDS. Ribonuclease A (RNAse A) 378 μg/mL was used to eliminate the free form RNA from EVs. The optimization of detergents was described in supplementary materials.

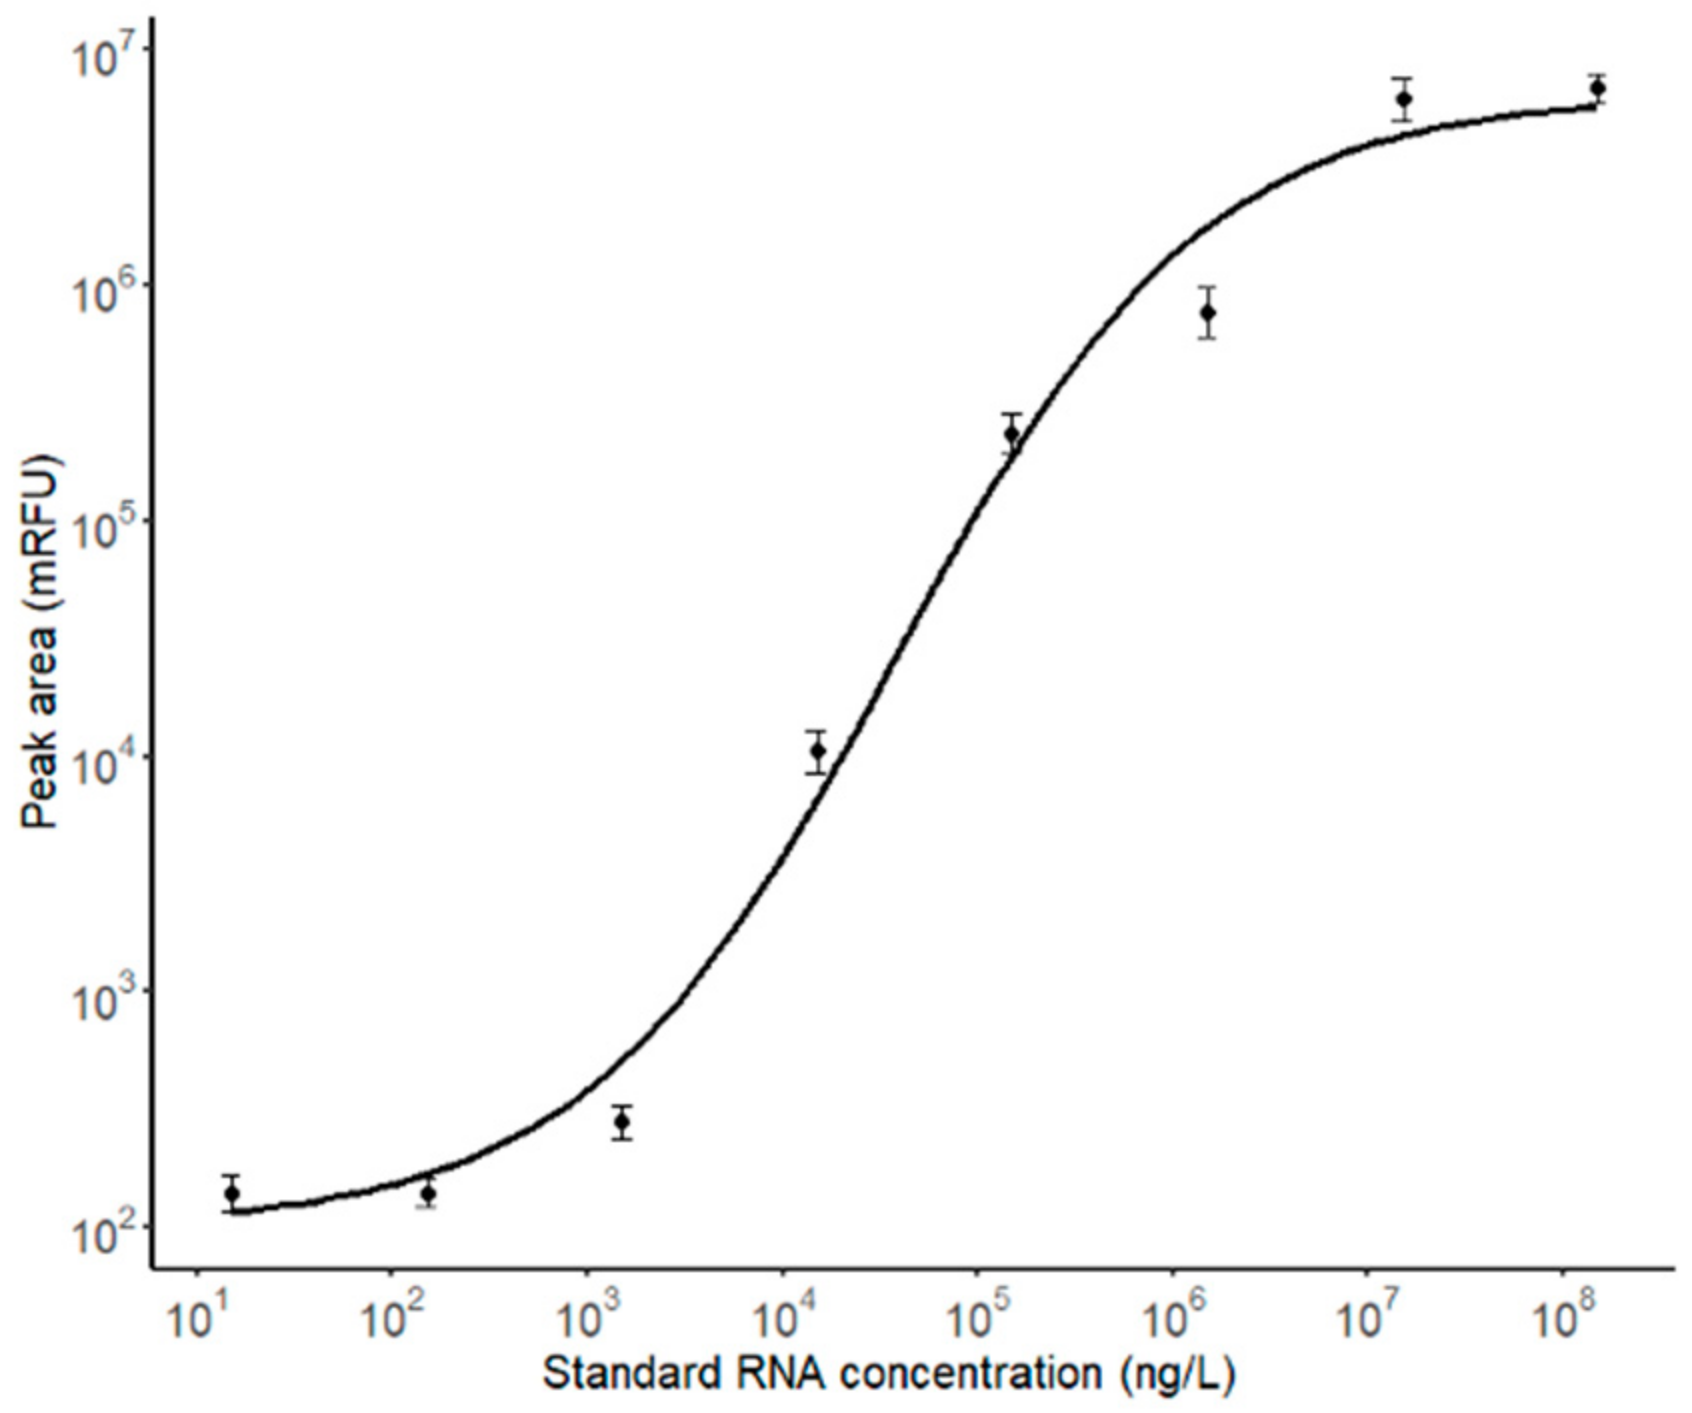
2.6. Calibration Curve

A calibration curve of standard RNA was built to determine the RNA amount in EVs. The standard RNA was diluted into a concentration between 1.5 × 10⁻² to 1.0 × 10⁵ ng/mL. A solution of 2 μM of YOYO-1 was used for RNA staining. Three technical replicates from each concentration were tested and described in supplementary materials.

2.7. Capillary Electrophoresis

A ProteomeLab PA 800 system (Beckman Coulter, CA, USA) was used to perform all CE-LIF. Fluorophores were excited using a 488 nm solid-state laser (Beckman Coulter, CA, USA), in which fluorescence was detected using a 520 ± 10 nm filter. The data were acquired and analyzed using 32 Karat Software version 8.0 (Beckman Coulter, CA, USA). The electrophoresis was performed using a fused silica capillary with a total length of 59.1 cm and an effective length of 49.0 cm from the injection point to the detection window. For electrokinetic separation experiments, a plug of 50 nL sample was injected into the capillary by applying a pressure pulse of 1.0 psi for 5 seconds. The analytes in the sample were separated by applying 25.1 kV voltage along the capillary resulting in an electric field of 424 V/cm. To determine the total fluorescence of samples, a continuous plug was pushed through the capillary by applying 1.5 psi pressure for 10 minutes. The capillary was maintained at a temperature of 15 °C at all times. The background electrolyte (BGE) for all separation experiments was 25 mM Borax buffer. Before each run, the capillary was rinsed by applying 20.0 psi of 0.1 M HCl, 0.1 M NaOH, and dH2O for 2 min each and 25 mM Borax buffer for 4 min. The buffer and rinsing solutions were passed through a 0.2 µm filter before use.

2.8. EV Degradation Conditions

EVs were exposed to the following conditions to determine the amount of degradation. Vortexing: 50 µL of EVs were continuously vortexed for 5 minutes at 2000 rpm using an analog vortex mixer (VWR, Bohemia, NY, USA). Sonication: 50 µL of EVs were placed in a Branson Ultrasonic Cleaner (Model 3510, Branson Ultrasonics Corporation, USA) for 10 min at room temperature. Freeze-thaw cycles: 50 µL of EVs were exposed to 10 freeze-thaw cycles. This was performed by freezing the samples at −80 °C for 30 seconds and then allowing them to thaw at room temperature for 2.5 min completely. Three technical replicates from each concentration were tested and described in supplementary materials. The optimization of degradation conditions was described in supplementary materials.

3. Result and Discussion

3.1. Characterization of EVs by NTA and Flow Cytometry

To confirm the presence of EVs in cancer cell-conditioned media, NTA and flow cytometry were used. NTA provides counts and sizes of particles by measuring their Brownian motion in solution. The EV samples isolated from MDA-MB-231, NCI-H1975, CCL-119 cells showed different size distribution with maximums at 105.8 nm, 174.3 nm, and 136.2 nm, respectively (Figure S2). The corresponding concentrations of EVs were equal to 2.3 × 10⁹, 2.6 × 10⁹, 4.4 × 10⁹, particle/mL, respectively.
In the flow cytometry analysis, anti-CD63 APC antibody and anti-CD9 PE antibody were used to mark the positive subpopulation of EVs. CD63 and CD9 are enriched in certain EV types and populations [33]. We found that from 20 to 45% of all detected particles in the cancer cell-conditioned media were stained with both antibodies (Figure S3).

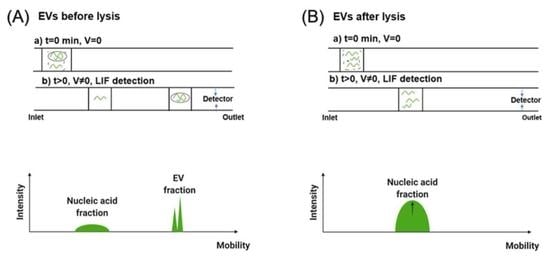
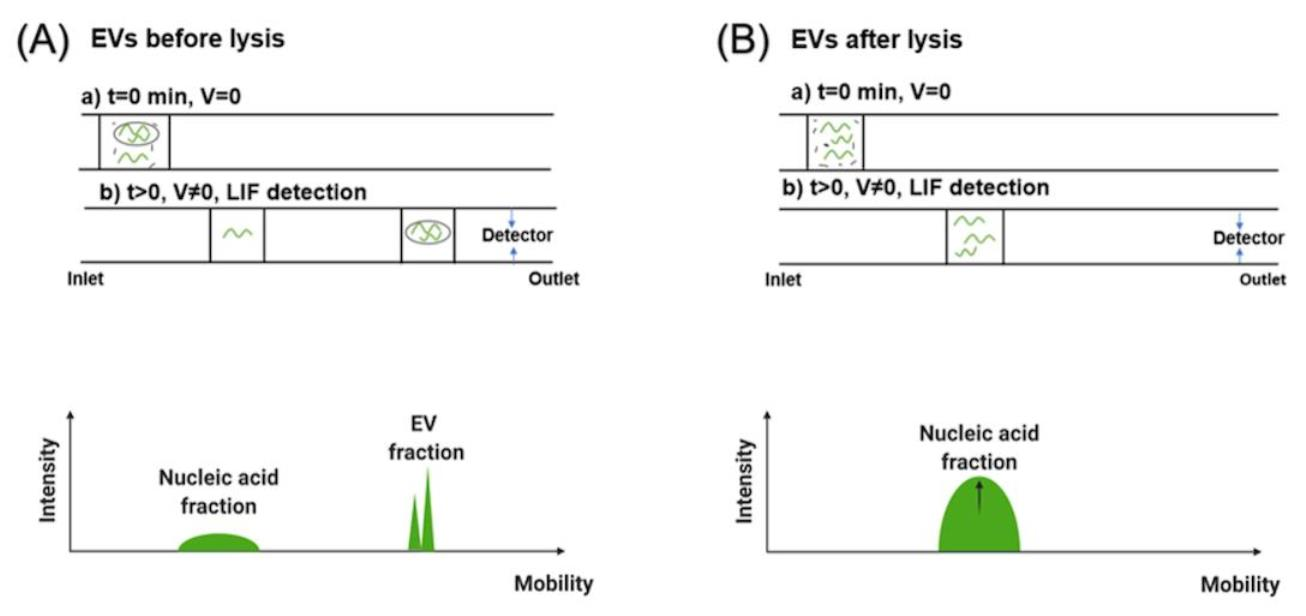
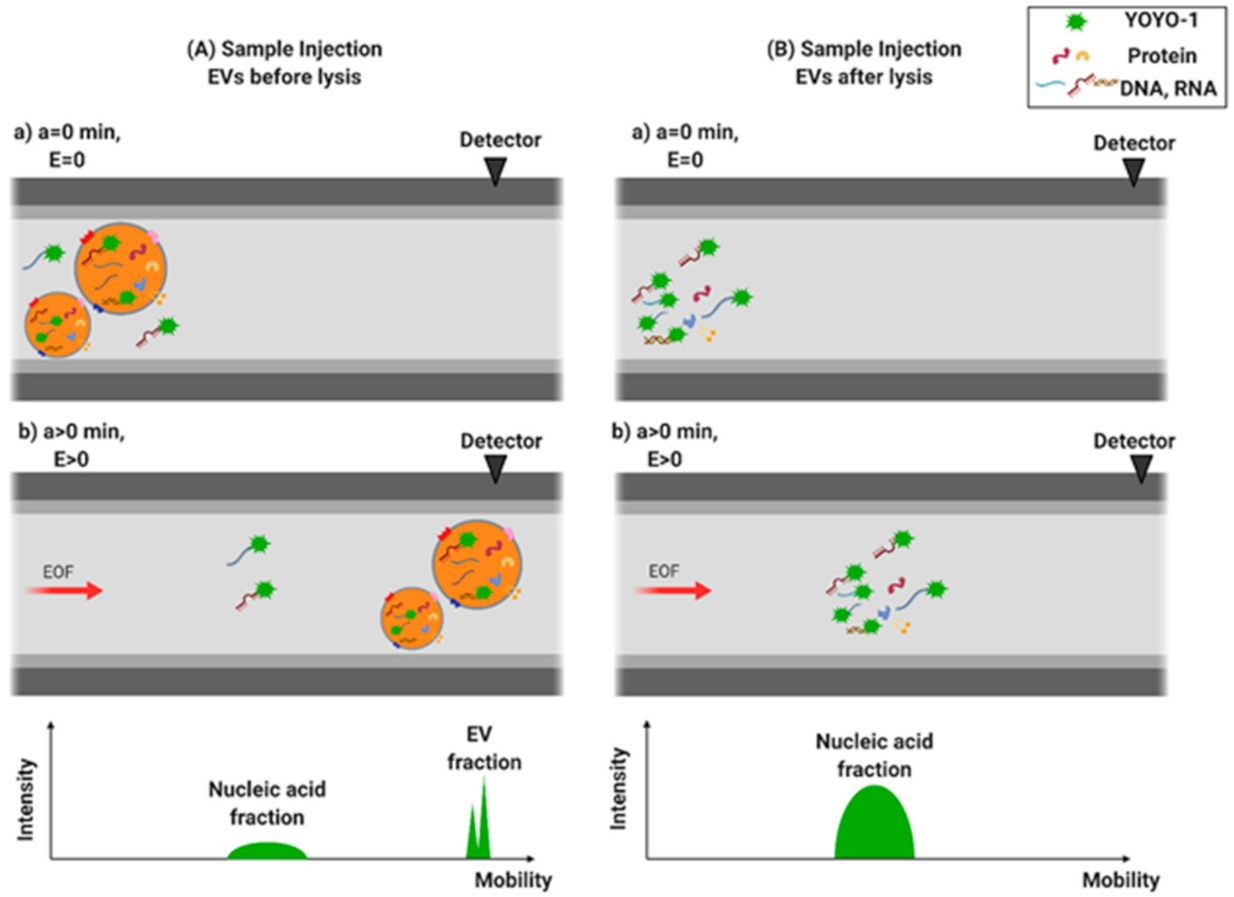
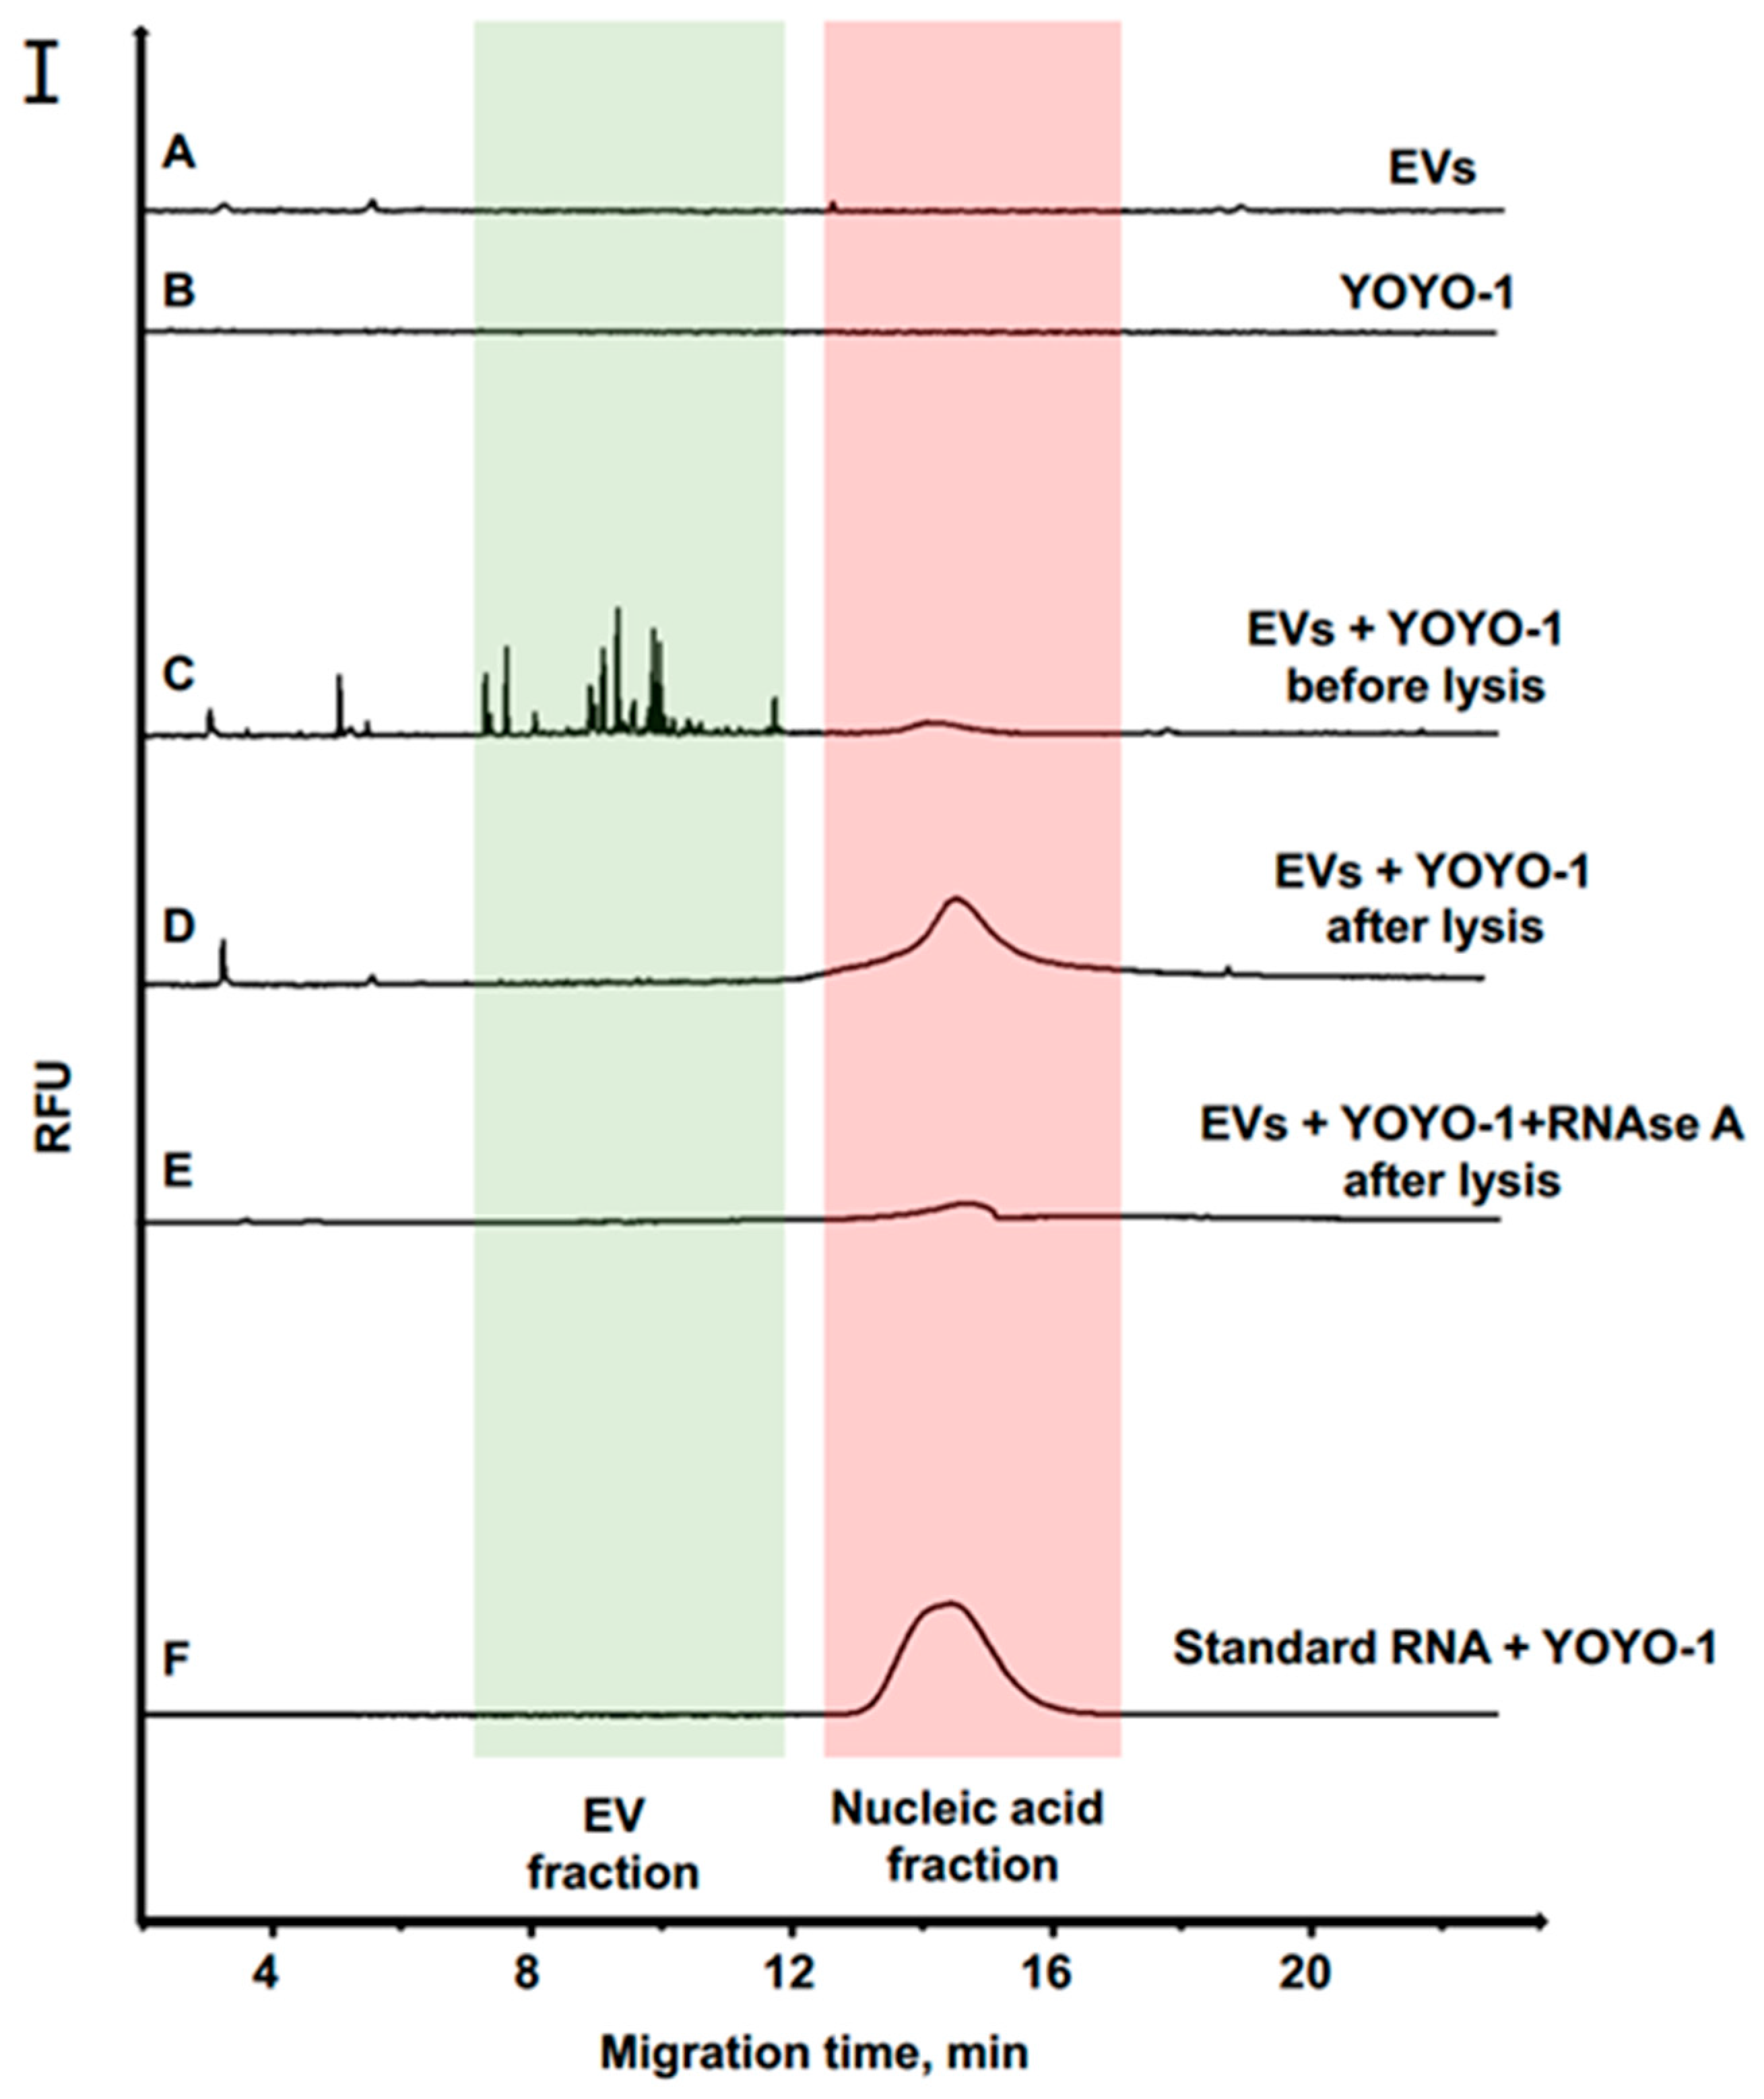
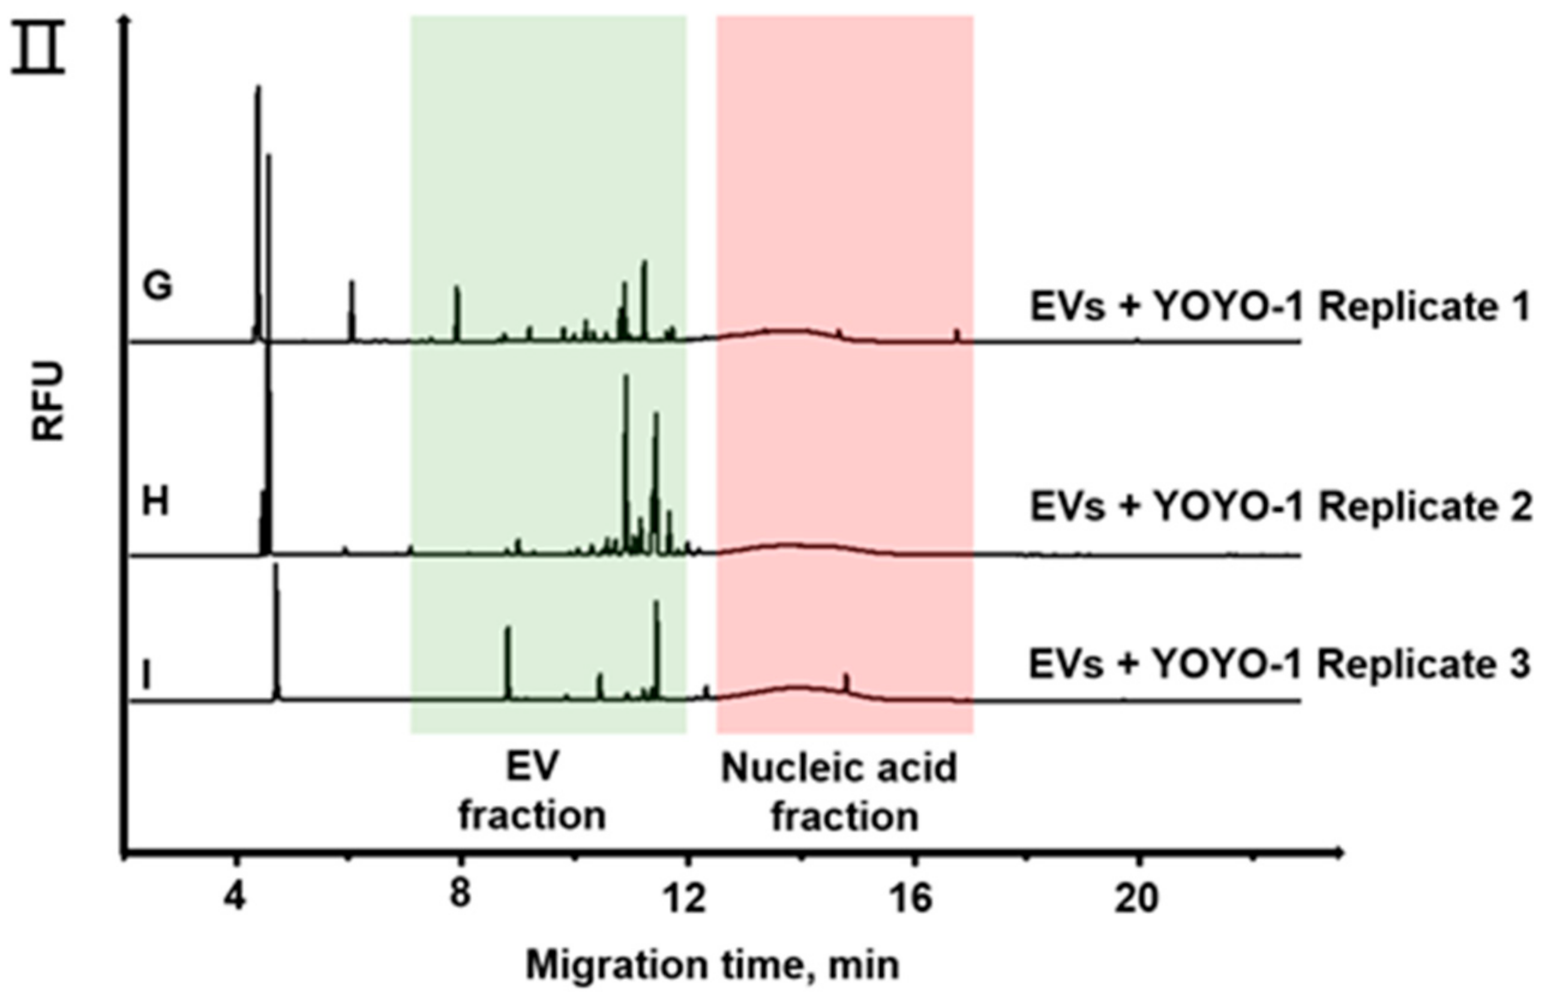
3.2. Separation of EVs by CE

EVqCE relies on different mobilities of negatively charged free nucleic acids (NAs) and intact EV particles in a gel-free background electrolyte. The general scheme of the method is depicted in Figure 1 and can be summarized as follows.
After the ultracentrifugation, an EV-enriched sample is collected and stained with YOYO-1 fluorescent dye and subjected to capillary zone electrophoresis. YOYO-1 is a fluorogenic molecular probe binding to DNA and RNA. Once bound, it emits a bright green fluorescence. It shows a high affinity to NAs with little or no interaction with proteins and NA-free organelles. Here, we used YOYO-1 to stains both RNA and DNA, the one encapsulated in the EVs and the free NAs, which may be released during the EVs isolation process. The EVs and free NAs were subject to electrophoresis and separated into two distinct zones. EVs traveled faster to the cathode than the NAs due to their smaller charge and bigger size and migrated slightly slower than an electroosmotic flow of BGE, while free NAs moved slower than EV vesicles (Figure 1A). After lysis by SDS, the peak representing the EV fraction disappeared, and the free NA peak increased. This increment corresponds to the total amount of encapsulated NAs in intact EVs released into solution (Figure 1B). The RSD of free NA peak from EVs was ~15% and ~9% for standard RNA (n = 3).

3.3. RNA Quantification of EVs from Cancer Cells

The control experiments were performed with individual CE analysis of EVs and YOYO-1 (Figure 2A,B). No significant peaks were observed because YOYO-1 and EVs alone did not fluoresce at 520 nm when excited at 488 nm. The EVs were mixed with YOYO-1 and subjected to CE separation. After the separation, two main florescent zones were observed corresponding to EVs stained with YOYO-1 and free NAs stained with the dye, respectively (Figure 2C). The free NAs showed a wide peak, while the EVs showed multiple peaks. The EV peaks are narrow because the EV particles have low diffusion coefficients. It was difficult to quantify EVs directly because they produced multiple sharp peaks or spikes on an electropherogram resulting in an irreproducible pattern. Moreover, NA-protein aggregates may contribute to those spikes as well. All electropherograms of EVs in this study showed the same pattern of EVs (6–12 min) separated from NAs (12–16 min). Three representative EVqCE electropherograms of EVs from MDA-MB-231 cell line before lysis are shown (Figure 2G–I).
After that, we lysed the EVs by SDS and observed the increase of the NA peak (Figure 2D). The lysis of EVs was confirmed by the disappearance of most spiked peaks corresponding to the intact EVs. The main contributor to the gain of the NA peak was RNA because, after the following RNAse treatment, the gain disappeared completely (Figure 2E). The electropherograms for EVs isolated from NCI-H1975 and CCL-119 cell lines were very similar to Figure 2. The CE separations for EVs from NCI-H1975 and CCL-119 are shown in Figure S4.
The concentration of EVs was calculated in six steps, as shown in Figure S5. First, the EVs sample stained with YOYO-1 was separated in CE. The observed NA fraction contains free RNA and DNA from degraded EVs and cells. Second, the EV sample was lysed with SDS, stained with YOYO-1, and separated again. After lysis, the resulted NA fraction contains mainly RNA and a small amount of DNA from impurities and lysed EVs. Third, the peak area of released RNA from EVs, Δ A R N A , was measured. It is calculated by determining the area of the NA peak before (A) and after SDS treatment with RNase A as in Equation (1).
Δ A R N A = ( A C A D ) A A A B
A A , A B , A C and A D are respectively the peak areas of NA fractions without SDS and RNAse, without SDS and with RNAse, with SDS and without RNAse, with SDS and RNAse treatments (Figure S6).
The fourth step is the quantification of [ Δ A R N A ] in mg/mL. A calibration curve was built by plotting fluorescent intensities of RNA standards stained by YOYO-1 as a function of their concentrations (Figure 3). The fluorescent intensities of the standards were measured by the LIF detector and CE instrument. The concentration of the released RNA in an EV sample after lysis could be acquired by measuring the peak area in the form of a relative fluorescence unit (RFU) from an RNA fraction corresponding to a certain concentration in the curve. The relationship between RFU and the concentration of standard RNA on the calibration curve in Figure 3 can be modeled by Origin 9.0 software. The concentration of unknown RNA can be found from the calibration curve and calculated using Equation (2). Values of x and y need to be converted to logarithmic with an exponent of 10.
y = 4.8078 1 + e 4.5693 x 0.7941 + 2
In the fifth step, the concentration of intact EVs was found by flow cytometry. FM dyes are lipophilic styryl compounds used for various labeling purposes, including the plasma membrane and vesiculation [34]. To label intact EVs before testing, FM 5–95 were used to mark the lipid membrane of EVs, while YOYO-1 stained capsulated NAs. The treatment of SDS caused the partial elimination of YOYO-1 and FM 5–95 positive events. Positive events are EVs showing signals from both YOYO-1 and FM 5–95 dyes in flow cytometry. Particles stained by FM 5–95 and YOYO-1 were counted as intact EVs (Figure S7). After the treatment of 0.1% SDS, the FM 5-95 and YOYO-1 positive events decreased significantly because of EV lysis. The number of events can be transformed into EV concentration if the average flow rate, v ¯ is known in flow cytometry. The concentration of EVs in a sample, Δ E V , 1/μL, was calculated from Equations (3) and (4):
Δ E V = E V 1 E V 0
E V = N c v ¯ t
E V 1   and   E V 0 are the concentration of EVs before and after lysis. Nc is the number of EV particles that pass the detector in time t.
In the sixth step, the average mass of RNA per EV ( m ¯ R N A , g/particle) can be calculated from Equation (5):
m ¯ R N A = Δ R N A 10 9 Δ E V
Δ E V is the concentration (1/μL) of intact EVs in the sample determined by flow cytometry. Δ R N A is the increase of concentration of RNA (ng/μL) in the same EV sample after lysis determined by the calibration curve in Figure 3. The final value of m ¯ R N A for EVs from MDA-MB-231, NCl-H1975, CCL-119 are (196 ± 3) × 10−18, (375 ± 4) × 10−18, (333 ± 2) × 10−18 g/particle, respectively. For example, a typical mammalian cell contains in the range of 1–2 × 10⁻¹¹ g of total RNA, which is ∼100–200 times more than a bacterial cell (∼0.1 × 10⁻¹² g) [35].
The concentration of intact EVs in an unknown EV sample [EVs]* can be calculated from Equation (6):
E V * = Δ R N A * 10 9 m ¯ R N A
To confirm the feasibility of EVqCE, EV samples were tested by different quantification methods. The results from EVqCE analysis, nanoparticle tracking (NTA), and flow cytometry are summarized in Table 1. Three biological replicates from each concentration were tested and described in supplementary materials. The concentrations from EVqCE were calculated using Equation (6), while the concentrations of EVs from flow cytometry were calculated using Equation (4). The EV concentrations from NTA were acquired directly from NTA reports. The majority of NTA results showed higher concentrations of EVs due to additional counting of non-EV particles. Flow cytometry showed lower concentrations due to the missing of the EV population smaller than 100 nm. The flow cytometry scattering detector could not recognize very small particles. LODs for EVqCE analyses were equal to 5.1 × 10⁶, 2.7 × 10⁶, 3.0 × 10⁶ particle/mL for MDA-MB-231, NCl-H1975, CCL-119, respectively.

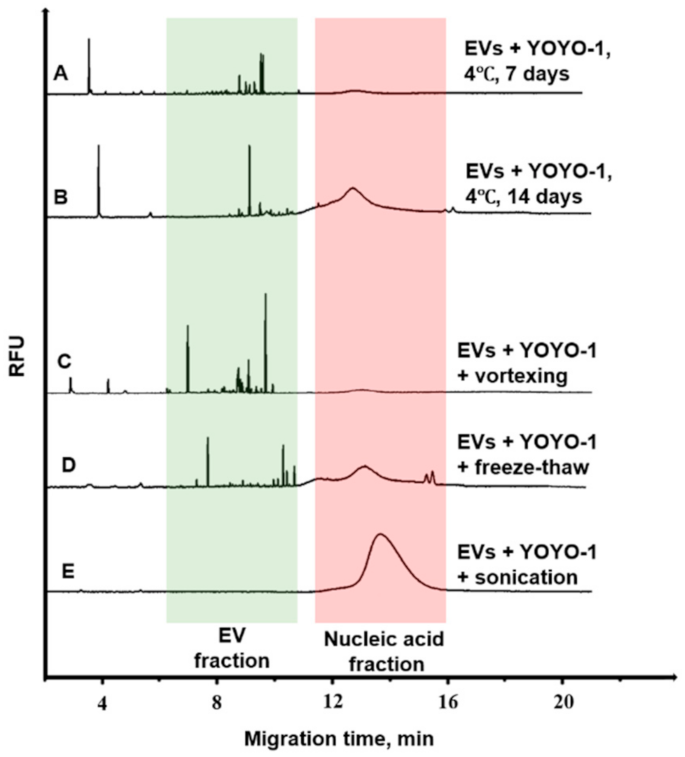
3.4. Degradation Analysis of EVs

This study is based on the release of RNA from degraded EVs. In Equation (7), EV degradation percentage (EVD) can be used to measure the level of EVs degradation by calculating the percentage of EV lysis, which means their RNA lost protection by intact EVs during processes commonly encountered during EVs storage or use.
E V D = C A C B C C B · 100 %
C A is the concentration of the RNA from EVs sample after the degradation process, while C B is the concentration of RNA from EV samples before the degradation process. C is the concentration of the RNA from the original sample after the treatment of 0.1% SDS. All the above values are quantified from Equations (1)–(3). The E V D was measured for a batch of EVs isolated from cancer cells after different treatments. Figure 4 illustrates the electropherograms of EV degradation after various treatments and storage conditions.
Storage: To test the stability of EVs in storage, two samples were stored at 4 ℃ for 7 and 14 days. A degradation level of 32.4 ± 6.5% of EVs was observed after 14 days of storage, higher than 7 days (3.1% ± 0.9) (Figure 4A,B).
Vortexing: It is commonly used for transferring an EV pellet after centrifugation to solution. The mild vortexing of EV samples for 5 min at 2000 rpm degraded them by 4.7 ± 1.8% (Figure 4C).
Freeze-thaw cycles: Storage of biological samples at very low temperatures poses a risk associated with loss of activity or degradation attributed to cycles of freezing and thawing. After 10 cycles, a 40.3 ± 7.0% degradation of EVs was observed (Figure 4D).
Ultrasonic treatment: A long-time sonication or ultrasonic treatment is often used as a technique for producing lipid vesicles. In contrast, short and strong sonication or ultrasonic treatment would cause a breakdown of EVs. Therefore, we analyzed the effects of ultrasonic treatment on EVs using an ultrasonic bath with 40 kHz power. The EV sample was degraded by 85.7 ± 25.8% after 10 minutes of treatment. It is worth mentioning that EVs treated with sonication showed a higher fluorescent signal than the ones with 0.1% SDS sometimes. This is because sonication allowed the permeability in the lipid bilayer membrane of EVs; hence the YOYO-1 dye can enter inside and bind to NAs (Figure 4E).
The study demonstrated that the mechanical processes of vortexing and sonication seem to promote RNA release much more than freezing and thawing of EV samples—prolonged storage at 4 ℃ results in EV particles disintegration. Vortexing causes minor damages to EVs. Freeze-thaw cycles produce moderate damages to EVs. Sonication destroys EVs, leaving free RNA.
EVqCE also provides a facile way to investigate the level of EV degradation without quantifying the total amount of EV present in each sample due to the separation of intact EV particles from free NAs. Thus, the gain in the area under the NA peak after a given degradative process can be used to measure the degradation level. This is a promising study that can provide the guideline suggestion to EV-based drug carrier design.

4. Conclusions

In this study, EVs from three cancer cell lines including MDA-MB-231, NCl-H1975, CCL-119, were isolated by ultracentrifugation. The EVs were characterized using NTA and flow cytometry. EVs showed the membrane-based structure, a size between 30–200 nm, and staining with anti-CD9 and anti-CD63 antibodies. Then EVs were stained by YOYO-1 and separated from free NAs. EVqCE allows a fast (~20 min) quantification of EVs from an unknown sample. Further, this study determined the average mass of RNA (200–400 ag) per EV. More aggressive cancer cells have less RNA than non-aggressive cancer cells, 200 ag vs. 350 ag. More recent studies showed RNAs specifically enriched in EVs from cultured prostate cancer lines PCA3, VCaP, LNCaP, and DU145 relative to exosomes from normal cells [36]. EVqCE separates intact EV particles and measures the level of EV degradation by releasing free RNA. A CE instrument can handle small volume samples (5–50 μL) because it injects less than 1 μL of the sample.
However, EVqCE has several limitations. It cannot distinguish and separate EV populations (exosomes, microvesicles, apoptotic bodies) from each other. The quantification of EVs requires an additional test by flow cytometry at the beginning to find the average mass of RNA for EVs from a sample type.
Overall, EVqCE provides a method for the analysis of EVs based on their total RNA content. The future work may focus on EVqCE analysis of different subpopulations of EVs, raw samples of blood, immune cells, and tumors.

Supplementary Materials

The following are available online at https://0-www-mdpi-com.brum.beds.ac.uk/article/10.3390/separations8080110/s1, Figure S1. Schematic representations of EV isolation from cancer cells. Figure S2. Nanoparticle tracking analysis (NTA) of EVs. The size distribution of EVs derived from cancer cell lines, MDA-MB231, NCl-H1975, CCL-119. The maximum peak of the respective EVs is shown with the dotted line. Figure S3. Flow cytometry analysis of EV isolates from cancer cell lines, MDA-MB231, NCl-H1975, CCL-119. Figure S4. Experimental EVqCE electropherograms of EVs from NCI-H1975 and CCL-119 cell lines. (A) A sample of enriched EVs from NCI-H1975 cell line. (B) Sample A after lysis by 0.1% SDS (C) A sample of enriched EVs from CCL-119 cell line. (D) Sample B after lysis by 0.1% SDS. Figure S5. Six steps required for measuring EV concentration. Figure S6. Schematic illustration of RNA quantifications by EVqCE. EVs were stained with YOYO-1 (A) EVs without any treatment. (B) RNAse A treated EVs showing the degradation of RNA. (C) SDS treated EVs showing the degradation of intact EVs and the increase in the intensity of the peak for nucleic acid. (D) SDS and RNase A treated EVs showing the degradation of RNA. Figure S7. Flow cytometry analysis of EVs before and after the SDS treatment. EVs were stained and gated by anti-CD63 APC and anti-CD9 PE antibodies. The lysis process was performed by 0.1% SDS. The number of double positive (YOYO-1 and FM 5-95) events is shown at the top-right corner. Method Optimization. Data on Biological and Technical Replicates.

Author Contributions

Y.D., L.R., M.V.B. designed the study and wrote the manuscript. Y.D. and L.R. conducted CE experiments, prepared all figures, analyzed the data. P.K.K. and E.A.Z. helped in preparing EV samples, analyzing results, and editing the manuscript. M.V.B. supervised the project and acquired funding. All authors reviewed the manuscript. All authors have read and agreed to the published version of the manuscript.

Funding

This research and APC was funded by the Natural Sciences and Engineering Research Council of Canada, grant number RGPIN-2020-05775.

Informed Consent Statement

Not applicable.

Acknowledgments

The authors thank D. Gibbing for providing the NanoSight instrument and S. Ghobadloo from the Cellular Imaging and Cytometry Facility at the University of Ottawa for performing flow cytometry experiments.

Conflicts of Interest

The authors declare no conflict of interest.

References

  1. Akers, J.C.; Ramakrishnan, V.; Nolan, J.P.; Duggan, E.; Fu, C.-C.; Hochberg, F.H.; Chen, C.C.; Carter, B.S. Comparative analysis of technologies for quantifying extracellular vesicles (EVs) in clinical cerebrospinal fluids (CSF). PLoS ONE 2016, 11, e0149866. [Google Scholar] [CrossRef]
  2. Choi, D.S. Urinary extracellular vesicles for biomarker source to monitor polycystic kidney disease. Proteom. Clin. Appl. 2015, 9, 447–448. [Google Scholar] [CrossRef]
  3. György, B.; Szabó, T.G.; Pásztói, M.; Pál, Z.; Misják, P.; Aradi, B.; László, V.; Pállinger, E.; Pap, E.; Kittel, A. Membrane vesicles, current state-of-the-art: Emerging role of extracellular vesicles. Cell. Mol. Life Sci. 2011, 68, 2667–2688. [Google Scholar] [CrossRef] [PubMed] [Green Version]
  4. Oosthuyzen, W.; Sime, N.E.; Ivy, J.R.; Turtle, E.J.; Street, J.M.; Pound, J.; Bath, L.E.; Webb, D.J.; Gregory, C.D.; Bailey, M.A. Quantification of human urinary exosomes by nanoparticle tracking analysis. J. Physiol. 2013, 591, 5833–5842. [Google Scholar] [CrossRef]
  5. Rupert, D.L.; Claudio, V.; Lässer, C.; Bally, M. Methods for the physical characterization and quantification of extracellular vesicles in biological samples. Biochim. Biophys. Acta (BBA) Gen. Subj. 2017, 1861, 3164–3179. [Google Scholar] [CrossRef] [PubMed]
  6. Webber, J.; Clayton, A. How pure are your vesicles? J. Extracell. Vesicles 2013, 2, 19861. [Google Scholar] [CrossRef]
  7. Witwer, K.W.; Buzás, E.I.; Bemis, L.T.; Bora, A.; Lässer, C.; Lötvall, J.; Nolte-‘t Hoen, E.N.; Piper, M.G.; Sivaraman, S.; Skog, J. Standardization of sample collection, isolation and analysis methods in extracellular vesicle research. J. Extracell. Vesicles 2013, 2, 20360. [Google Scholar] [CrossRef] [PubMed]
  8. Hartjes, T.A.; Mytnyk, S.; Jenster, G.W.; van Steijn, V.; van Royen, M.E. Extracellular vesicle quantification and characterization: Common methods and emerging approaches. Bioengineering 2019, 6, 7. [Google Scholar] [CrossRef] [Green Version]
  9. Serrano-Pertierra, E.; Oliveira-Rodríguez, M.; Matos, M.; Gutiérrez, G.; Moyano, A.; Salvador, M.; Rivas, M.; Blanco-López, M.C. Extracellular vesicles: Current analytical techniques for detection and quantification. Biomolecules 2020, 10, 824. [Google Scholar] [CrossRef]
  10. Chia, B.S.; Low, Y.P.; Wang, Q.; Li, P.; Gao, Z. Advances in exosome quantification techniques. TrAC Trends Anal. Chem. 2017, 86, 93–106. [Google Scholar] [CrossRef]
  11. Mehdiani, A.; Maier, A.; Pinto, A.; Barth, M.; Akhyari, P.; Lichtenberg, A. An innovative method for exosome quantification and size measurement. JoVE (J. Vis. Exp.) 2015, 95, e50974. [Google Scholar] [CrossRef] [Green Version]
  12. Lane, R.E.; Korbie, D.; Anderson, W.; Vaidyanathan, R.; Trau, M. Analysis of exosome purification methods using a model liposome system and tunable-resistive pulse sensing. Sci. Rep. 2015, 5, 7639. [Google Scholar] [CrossRef] [Green Version]
  13. Im, H.; Shao, H.; Park, Y.I.; Peterson, V.M.; Castro, C.M.; Weissleder, R.; Lee, H. Label-free detection and molecular profiling of exosomes with a nano-plasmonic sensor. Nat. Biotechnol. 2014, 32, 490–495. [Google Scholar] [CrossRef] [PubMed] [Green Version]
  14. Zhu, L.; Wang, K.; Cui, J.; Liu, H.; Bu, X.; Ma, H.; Wang, W.; Gong, H.; Lausted, C.; Hood, L. Label-free quantitative detection of tumor-derived exosomes through surface plasmon resonance imaging. Anal. Chem. 2014, 86, 8857–8864. [Google Scholar] [CrossRef] [Green Version]
  15. Heider, S.; Metzner, C. Quantitative real-time single particle analysis of virions. Virology 2014, 462, 199–206. [Google Scholar] [CrossRef] [Green Version]
  16. Shang, J.; Gao, X. Nanoparticle counting: Towards accurate determination of the molar concentration. Chem. Soc. Rev. 2014, 43, 7267–7278. [Google Scholar] [CrossRef] [PubMed] [Green Version]
  17. Sedmak, J.J.; Grossberg, S.E. A rapid, sensitive, and versatile assay for protein using Coomassie brilliant blue G250. Anal. Biochem. 1977, 79, 544–552. [Google Scholar] [CrossRef]
  18. Smith, P.E.; Krohn, R.I.; Hermanson, G.T.; Mallia, A.K.; Gartner, F.H.; Provenzano, M.; Fujimoto, E.K.; Goeke, N.M.; Olson, B.J.; Klenk, D. Measurement of protein using bicinchoninic acid. Anal. Biochem. 1985, 150, 76–85. [Google Scholar] [CrossRef]
  19. Moon, P.-G.; Lee, J.-E.; Cho, Y.-E.; Lee, S.J.; Chae, Y.S.; Jung, J.H.; Kim, I.-S.; Park, H.Y.; Baek, M.-C. Fibronectin on circulating extracellular vesicles as a liquid biopsy to detect breast cancer. Oncotarget 2016, 7, 40189. [Google Scholar] [CrossRef] [Green Version]
  20. Nolan, J.P.; Duggan, E. Analysis of individual extracellular vesicles by flow cytometry. In Flow Cytometry Protocols; Springer: Berlin/Heidelberg, Germany, 2018; pp. 79–92. [Google Scholar]
  21. Rupert, D.b.L.; Lässer, C.; Eldh, M.; Block, S.; Zhdanov, V.P.; Lotvall, J.O.; Bally, M.; Hook, F. Determination of exosome concentration in solution using surface plasmon resonance spectroscopy. Anal. Chem. 2014, 86, 5929–5936. [Google Scholar] [CrossRef]
  22. Alvarez-Erviti, L.; Seow, Y.; Schapira, A.H.; Gardiner, C.; Sargent, I.L.; Wood, M.J.; Cooper, J.M. Lysosomal dysfunction increases exosome-mediated alpha-synuclein release and transmission. Neurobiol. Dis. 2011, 42, 360–367. [Google Scholar] [CrossRef] [Green Version]
  23. Dragovic, R.A.; Gardiner, C.; Brooks, A.S.; Tannetta, D.S.; Ferguson, D.J.; Hole, P.; Carr, B.; Redman, C.W.; Harris, A.L.; Dobson, P.J. Sizing and phenotyping of cellular vesicles using Nanoparticle Tracking Analysis. Nanomed. Nanotechnol. Biol. Med. 2011, 7, 780–788. [Google Scholar] [CrossRef] [Green Version]
  24. Gardiner, C.; Ferreira, Y.J.; Dragovic, R.A.; Redman, C.W.; Sargent, I.L. Extracellular vesicle sizing and enumeration by nanoparticle tracking analysis. J. Extracell. Vesicles 2013, 2, 19671. [Google Scholar] [CrossRef] [PubMed]
  25. Tomlinson, P.R.; Zheng, Y.; Fischer, R.; Heidasch, R.; Gardiner, C.; Evetts, S.; Hu, M.; Wade-Martins, R.; Turner, M.R.; Morris, J. Identification of distinct circulating exosomes in Parkinson’s disease. Ann. Clin. Transl. Neurol. 2015, 2, 353–361. [Google Scholar] [CrossRef] [PubMed]
  26. Van Der Pol, E.; Hoekstra, A.; Sturk, A.; Otto, C.; Van Leeuwen, T.; Nieuwland, R. Optical and non-optical methods for detection and characterization of microparticles and exosomes. J. Thromb. Haemost. 2010, 8, 2596–2607. [Google Scholar] [CrossRef]
  27. Varga, Z.; Yuana, Y.; Grootemaat, A.E.; Van der Pol, E.; Gollwitzer, C.; Krumrey, M.; Nieuwland, R. Towards traceable size determination of extracellular vesicles. J. Extracell. Vesicles 2014, 3, 23298. [Google Scholar] [CrossRef]
  28. Akagi, T.; Ichiki, T. Microcapillary chip-based extracellular vesicle profiling system. In Extracellular Vesicles; Springer: Berlin/Heidelberg, Germany, 2017; pp. 209–217. [Google Scholar]
  29. Morani, M.; Mai, T.D.; Krupova, Z.; Defrenaix, P.; Multia, E.; Riekkola, M.-L.; Taverna, M. Electrokinetic characterization of extracellular vesicles with capillary electrophoresis: A new tool for their identification and quantification. Anal. Chim. Acta 2020, 1128, 42–51. [Google Scholar] [CrossRef]
  30. Tani, Y.; Kaneta, T. Indirect capillary electrophoresis immunoassay of membrane protein in extracellular vesicles. J. Chromatogr. A 2020, 1629, 461513. [Google Scholar] [CrossRef]
  31. Azizi, A.; Mironov, G.G.; Muharemagic, D.; Wehbe, M.; Bell, J.C.; Berezovski, M.V. Viral quantitative capillary electrophoresis for counting and quality control of RNA viruses. Anal. Chem. 2012, 84, 9585–9591. [Google Scholar] [CrossRef]
  32. Mironov, G.G.; Chechik, A.V.; Ozer, R.; Bell, J.C.; Berezovski, M.V. Viral quantitative capillary electrophoresis for counting intact viruses. Anal. Chem. 2011, 83, 5431–5435. [Google Scholar] [CrossRef] [PubMed]
  33. Kowal, J.; Arras, G.; Colombo, M.; Jouve, M.; Morath, J.P.; Primdal-Bengtson, B.; Dingli, F.; Loew, D.; Tkach, M.; Thery, C. Proteomic comparison defines novel markers to characterize heterogeneous populations of extracellular vesicle subtypes. Proc. Natl. Acad. Sci. USA 2016, 113, E968–E977. [Google Scholar] [CrossRef] [Green Version]
  34. Hoshino, A.; Costa-Silva, B.; Shen, T.-L.; Rodrigues, G.; Hashimoto, A.; Mark, M.T.; Molina, H.; Kohsaka, S.; Di Giannatale, A.; Ceder, S. Tumour exosome integrins determine organotropic metastasis. Nature 2015, 527, 329–335. [Google Scholar] [CrossRef] [PubMed] [Green Version]
  35. Westermann, A.J.; Gorski, S.A.; Vogel, J. Dual RNA-seq of pathogen and host. Nat. Rev. Microbiol. 2012, 10, 618–630. [Google Scholar] [CrossRef] [PubMed]
  36. Kim, K.M.; Abdelmohsen, K.; Mustapic, M.; Kapogiannis, D.; Gorospe, M. RNA in extracellular vesicles. Wiley Interdiscip. Rev. RNA 2017, 8, e1413. [Google Scholar] [CrossRef] [PubMed]
Figure 1. Schematic representation of EVqCE analysis. (A) A mixture of intact EVs with encapsulated nucleic acid and the free nucleic acid is stained with YOYO-1 (green stars) and injected into the capillary as a short plug. The electric field was applied (E > 0 V/cm), EVs, and the free nucleic acid are separated into two fractions depending upon their mobility. (B) After lysis by SDS, the peak representing the EV fraction disappeared, and the free nucleic acid peak increase.
Separations 08 00110 g001
Figure 2. Experimental EVqCE electropherograms of EVs from cancer cells. (A) EVs without YOYO-1; (B) 2μM YOYO-1 only; (C) A sample of enriched EVs from MDA-MB-231 cells with YOYO-1; (D) EVs with YOYO-1 after lysis by 0.1% SDS, the EV fraction decreases, and the NA peak increases; (E) After RNase treatment, RNA is hydrolyzed, leaving DNA only; (F) 150 ng/mL yeast RNA with YOYO-1 as a control for free NAs. DNA and RNA are stained with YOYO-1 and detected by LIF; (G–I) 3 replicates of EVs isolated from MDA-MB-231 cells stained with YOYO-1.
Separations 08 00110 g002aSeparations 08 00110 g002b
Figure 3. Calibration curve of standard RNA. A solution of 2μM of YOYO-1 was used for RNA staining. Error bars are shown for three technical repeats.
Separations 08 00110 g003
Figure 4. Experimental EVqCE electropherograms of degradation analysis of EVs isolated from cancer cell lines. (A) Effect of storage temperature on EVs at 4 °C for 7 days; (B) Effect of storage temperature on EVs at 4 °C for 14 days; (C) EVs stained with YOYO-1 treated with 10 min vortexing; (D) EVs with YOYO-1 treated with 10 freeze-thaw cycles; (E) EVs with YOYO-1 treated with 10 min sonication. All experiments were made in triplicate.
Separations 08 00110 g004
Table 1. Quantification of EVs performed by EVqCE, NTA, and flow cytometry.
Quantification Method (Particles/mL)MBA-MB-231NCl-H1975CCL-119
EVqCE (5.1 ± 0.2) × 109(1.4 ± 0.1) × 109(1.3 ± 0.4) × 109
NTA(4.9 ± 0.1) × 109(2.3 ± 0.2) × 109(2.6 ± 0.3)× 109
Flow cytometry(1.7 ± 0.3) × 109(3.6 ± 0.7) × 108(6.0 ± 0.8)× 108
Publisher’s Note: MDPI stays neutral with regard to jurisdictional claims in published maps and institutional affiliations.

