Wavelength-Dependent Features of Photoelectron Spectra from Nanotip Photoemission


1
State Key Laboratory for Artificial Microstructure and Mesoscopic Physics, School of Physics, Peking University, Beijing 100871, China
2
Physics Program, Guangdong Technion–Israel Institute of Technology, Shantou 515063, China
3
Technion–Israel Institute of Technology, Haifa 32000, Israel
4
Institute of Physics of the ASCR, ELI Beamlines Project, Na Slovance 2, 18221 Prague, Czech Republic
5
Collaborative Innovation Center of Extreme Optics, Shanxi University, Taiyuan 030006, China
*
Author to whom correspondence should be addressed.
Photonics 2020, 7(4), 129; https://0-doi-org.brum.beds.ac.uk/10.3390/photonics7040129
Submission received: 12 November 2020
/
Revised: 8 December 2020
/
Accepted: 9 December 2020
/
Published: 11 December 2020
(This article belongs to the Special Issue Strong Light Fields Coupled with Plasmonic Nano-Structures)
Abstract
:If a metal nanotip is irradiated with the light of a wavelength much larger than the nanotip’s radius of curvature, optical near-fields become excited. These fields are responsible for distinct strong-field electron dynamics, due to both the field enhancement and spatial localization. By classical trajectory, Monte Carlo (CTMC) simulation, and the integration of the time-dependent Schrödinger equation (TDSE), we find that the photoelectron spectra for nanotip strong-field photoemission, irradiated by mid-infrared laser pulses, present distinctive wavelength-dependent features, especially in the mid- to high-electron energy regions, which are different from the well known ones. By extracting the electron trajectories from the CTMC simulation, we investigate these particular wavelength-dependent features. Our theoretical results contribute to understanding the photoemission and electron dynamics at nanostructures, and pave new pathways for designing high-energy nanometer-sized ultrafast electron sources.

1. Introduction
Strong-field physics refers to an extreme light-matter interaction [1,2], which takes place when the force exerted by a light electric field is comparable to the binding force acting on electrons. Usually, in order to access the strong-field regime, high-intensity lasers are required. The original scope of strong-field physics is focused on gas-phase atomic and molecular systems, where the most notable phenomena, such as high-order harmonic generation (HHG) [2,3,4], above-threshold ionization (ATI) [5,6,7] and non-sequential double ionization (NDSI) [8,9], have been extensively investigated, both theoretically and experimentally. In recent years, the field of strong-field physics has been expanded into the realm of surfaces [10,11] and nanostructures [12,13,14,15,16,17,18]. In particular, sharp nanometer-size metallic tips configure the fundamental blocks for investigating various strong-field phenomena at a much lower laser intensity [19,20,21].
At the end of the 19th century, several scientific researchers demonstrated that electrons can be emitted from a pointy wire if a static voltage is applied to it [22]. Under the lightning rod effect, the moderate applied voltage translates into an enhanced electric field right at the tip’s apex. Similarly, if a metal nanotip is irradiated with the light of a wavelength much larger than the nanotip’s radius of curvature, optical near-fields are excited [23,24,25,26,27]. In nature, the so-called near fields are strongly enhanced in the vicinity of a tip and, moreover, they are strongly localized near its apex. Involving nanotips is novel for several reasons. First, a field enhancement takes place because of its sharpness, which greatly reduces the laser intensities needed to reach the strong-field regime. Second, because of the localized nature of the field enhancement, the photoelectrons will feel strong gradients of the acceleration field, resulting in a particular electron dynamics. Finally, due to the asymmetry of photoemission at the nanotip and the localization of the near-field, a half-cycle photoelectron cutoff [28,29,30,31] appears as a distinctive feature.
From the above, the near-field excited at nanotips is responsible for strong-field photoemission [12,14,32] and electron dynamics [13,33,34]. On the other hand, these phenomena substantially differ from those in atomic and molecular systems. Specifically, both the final kinetic energy of photoelectrons and the energy spectra will be affected, resulting in noticeable differences with the atomic and molecular systems. For interactions between atomic or molecular systems and lasers, it is well known that a plateau in the photoelectron spectra arises, i.e., over a rather broad energy range, the electron count rate stays roughly constant (up to a maximal energy of [35], where is the ponderomotive energy). According to the three-step model [2], this plateau originates from the electrons that return to the parent ion and are elastically scattered [35,36]. However, for photoelectrons emitted from nanotips induced by mid-infrared laser pulses [18], such a plateau regime no longer exists. Thus, it is worthwhile to explore the underlying physics of this peculiar case.
In the present work, by numerical simulations, we investigate the interaction between a nanotip and the plasmonic-enhanced spatially inhomogeneous near-field at wavelengths ranging from to . Under both focal and carrier envelope phase (CEP) averaging, the photoelectron spectra show consistent features as those presented in the seminal paper [18]. Compared with a series of simulation results at different wavelengths, we find distinctive wavelength-dependent features in the photoelectron spectra, especially in the mid- to high-electron energy region, which are different from the well known rescattered plateau. By extracting the electron trajectories from classical trajectory Monte Carlo (CTMC) simulations, we investigate this singular regime of the photoelectron spectra.
The numerical tools in the present paper include a numerical solution of the time-dependent Schrödinger equation (TDSE) and a classical trajectory Monte Carlo (CTMC) simulation, both of which consider a spatially inhomogeneous near-field. Compared to the previous TDSE and CTMC methods for nanotip photoemission [21], necessary modifications in these two numerical methods have been made, in order to consider the spatial inhomogeneous nature of the nanotip near-field.
The rest of the paper is organized as follows. In Section 2, we present our two theoretical methods, namely the TDSE and the CTMC, to simulate the interaction between a strong laser pulse and a nanotip. In Section 3.1, we present the distinctive wavelength-dependent features of the photoelectron spectra simulated by both the TDSE and the CTMC. In Section 3.2, we investigate this singular regime by extracting the electron trajectories from the CTMC simulation. A short conclusion is drawn in Section 4 Atomic units are employed throughout the paper, unless otherwise stated.
2. Theoretical Methods
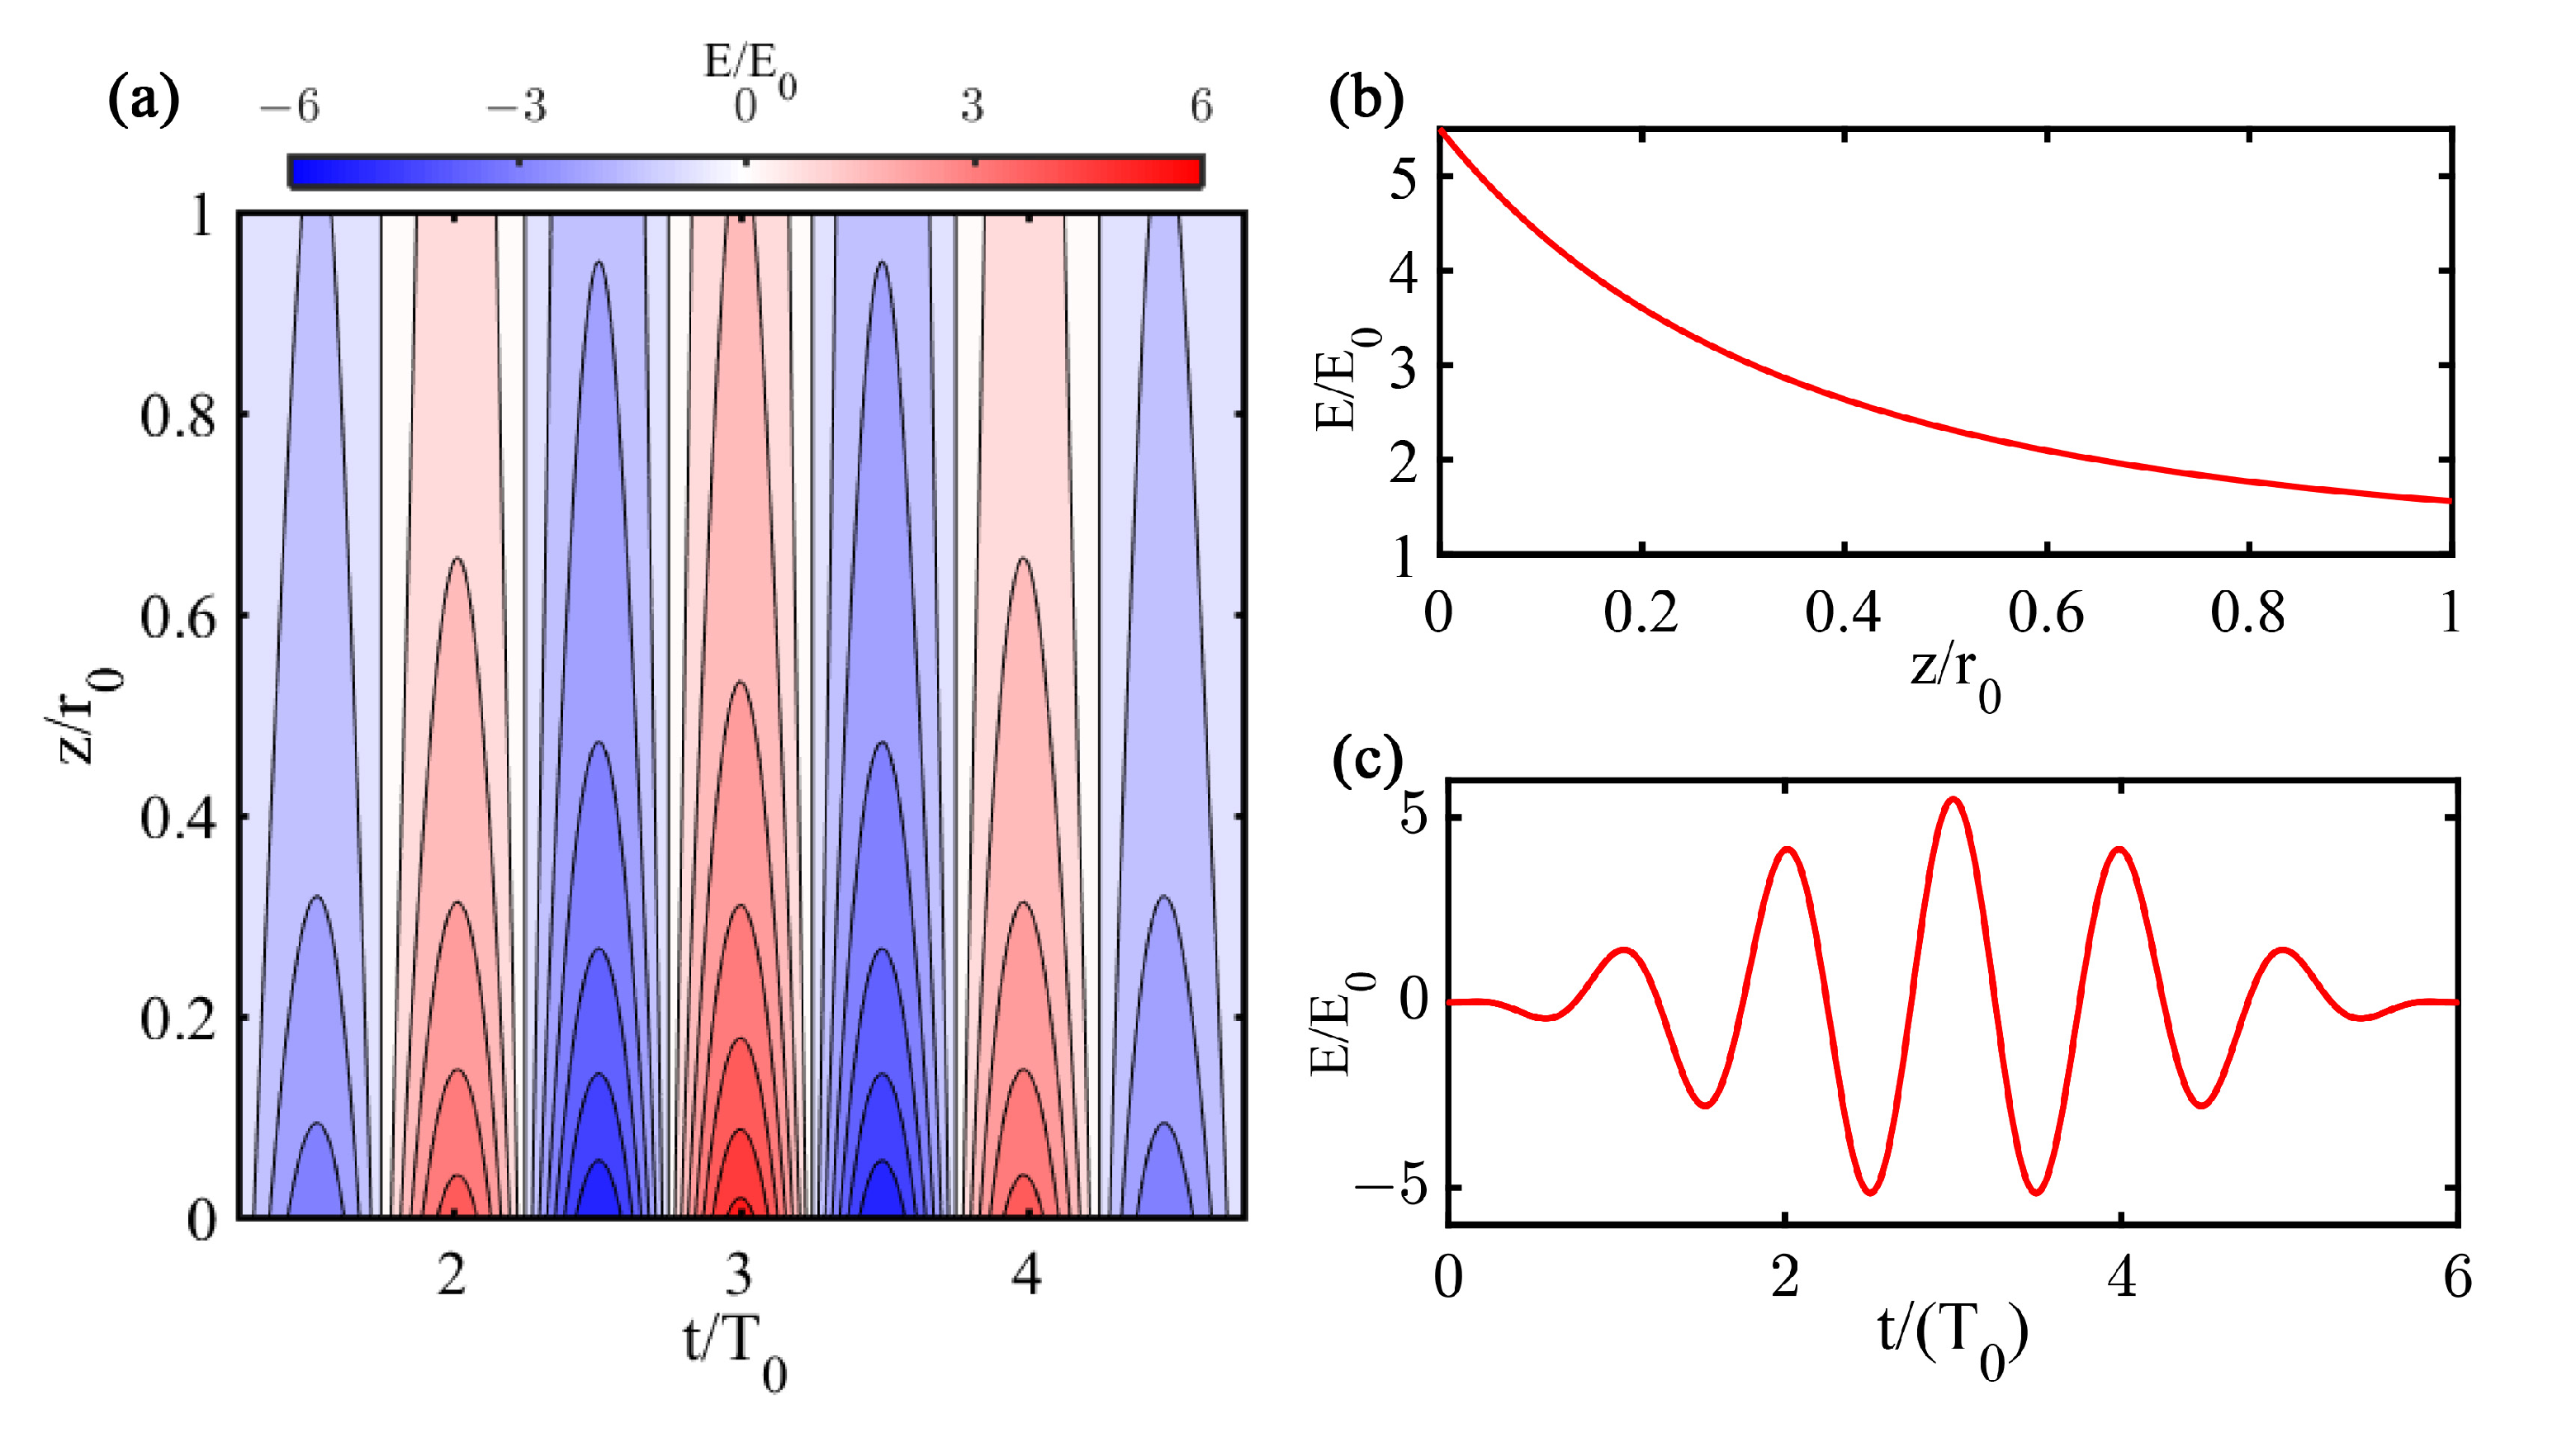
Optical near-fields are strongly enhanced in the vicinity of a metal tip and decay rapidly as the distance from its surface increases. Although the near-field is delayed in time with respect to the incident field [34], for nanotips with a curvature radius , much smaller than the incident wavelength , the quasi-static approximation provides a simple approach to estimate the resulting enhanced near-field [37]. A simplified expression is adopted for the temporal and spatial variation of the near-field . As shown in Figure 1a, for ,
where z is the distance from the surface, the laser beam waist and the field enhancement factor. Usually, in a typical experiment , so is adopted in our simulation. Finally, is the temporal shape of the incident field,
where is the peak strength of the incident laser electric field, the carrier frequency, the number of cycles and the CEP.
Inside the nanotip (), the field is approximately zero. Furthermore, the peak strength and the decay length of the localized near-field are and , respectively.
From Equation (1), one can find that the near-field is spatial-dependent at all times (e.g., the Figure 1b for ). Meanwhile, the near-field is time-dependent for every point in space (e.g., the Figure 1c for ). In the following, we present two theoretical methods for the simulation of the interaction between a nanotip and a plasmonic-enhanced spatially inhomogeneous near-field. The first method is of quantum mechanical nature based on the numerical solution of the TDSE with a model potential and the second one is the CTMC approach. Both approaches are based on the single active electron (SAE) approximation and, as a consequence, any space charge effect [38,39] is neglected. For further simplification, the electron motion is restricted to the z-axis only, i.e., the laser polarization direction.
2.1. Time-Dependent Schrödinger Equation Method
To describe the laser-nanotip interaction from a quantum mechanical point of view, one can numerically integrate the following single electron TDSE,
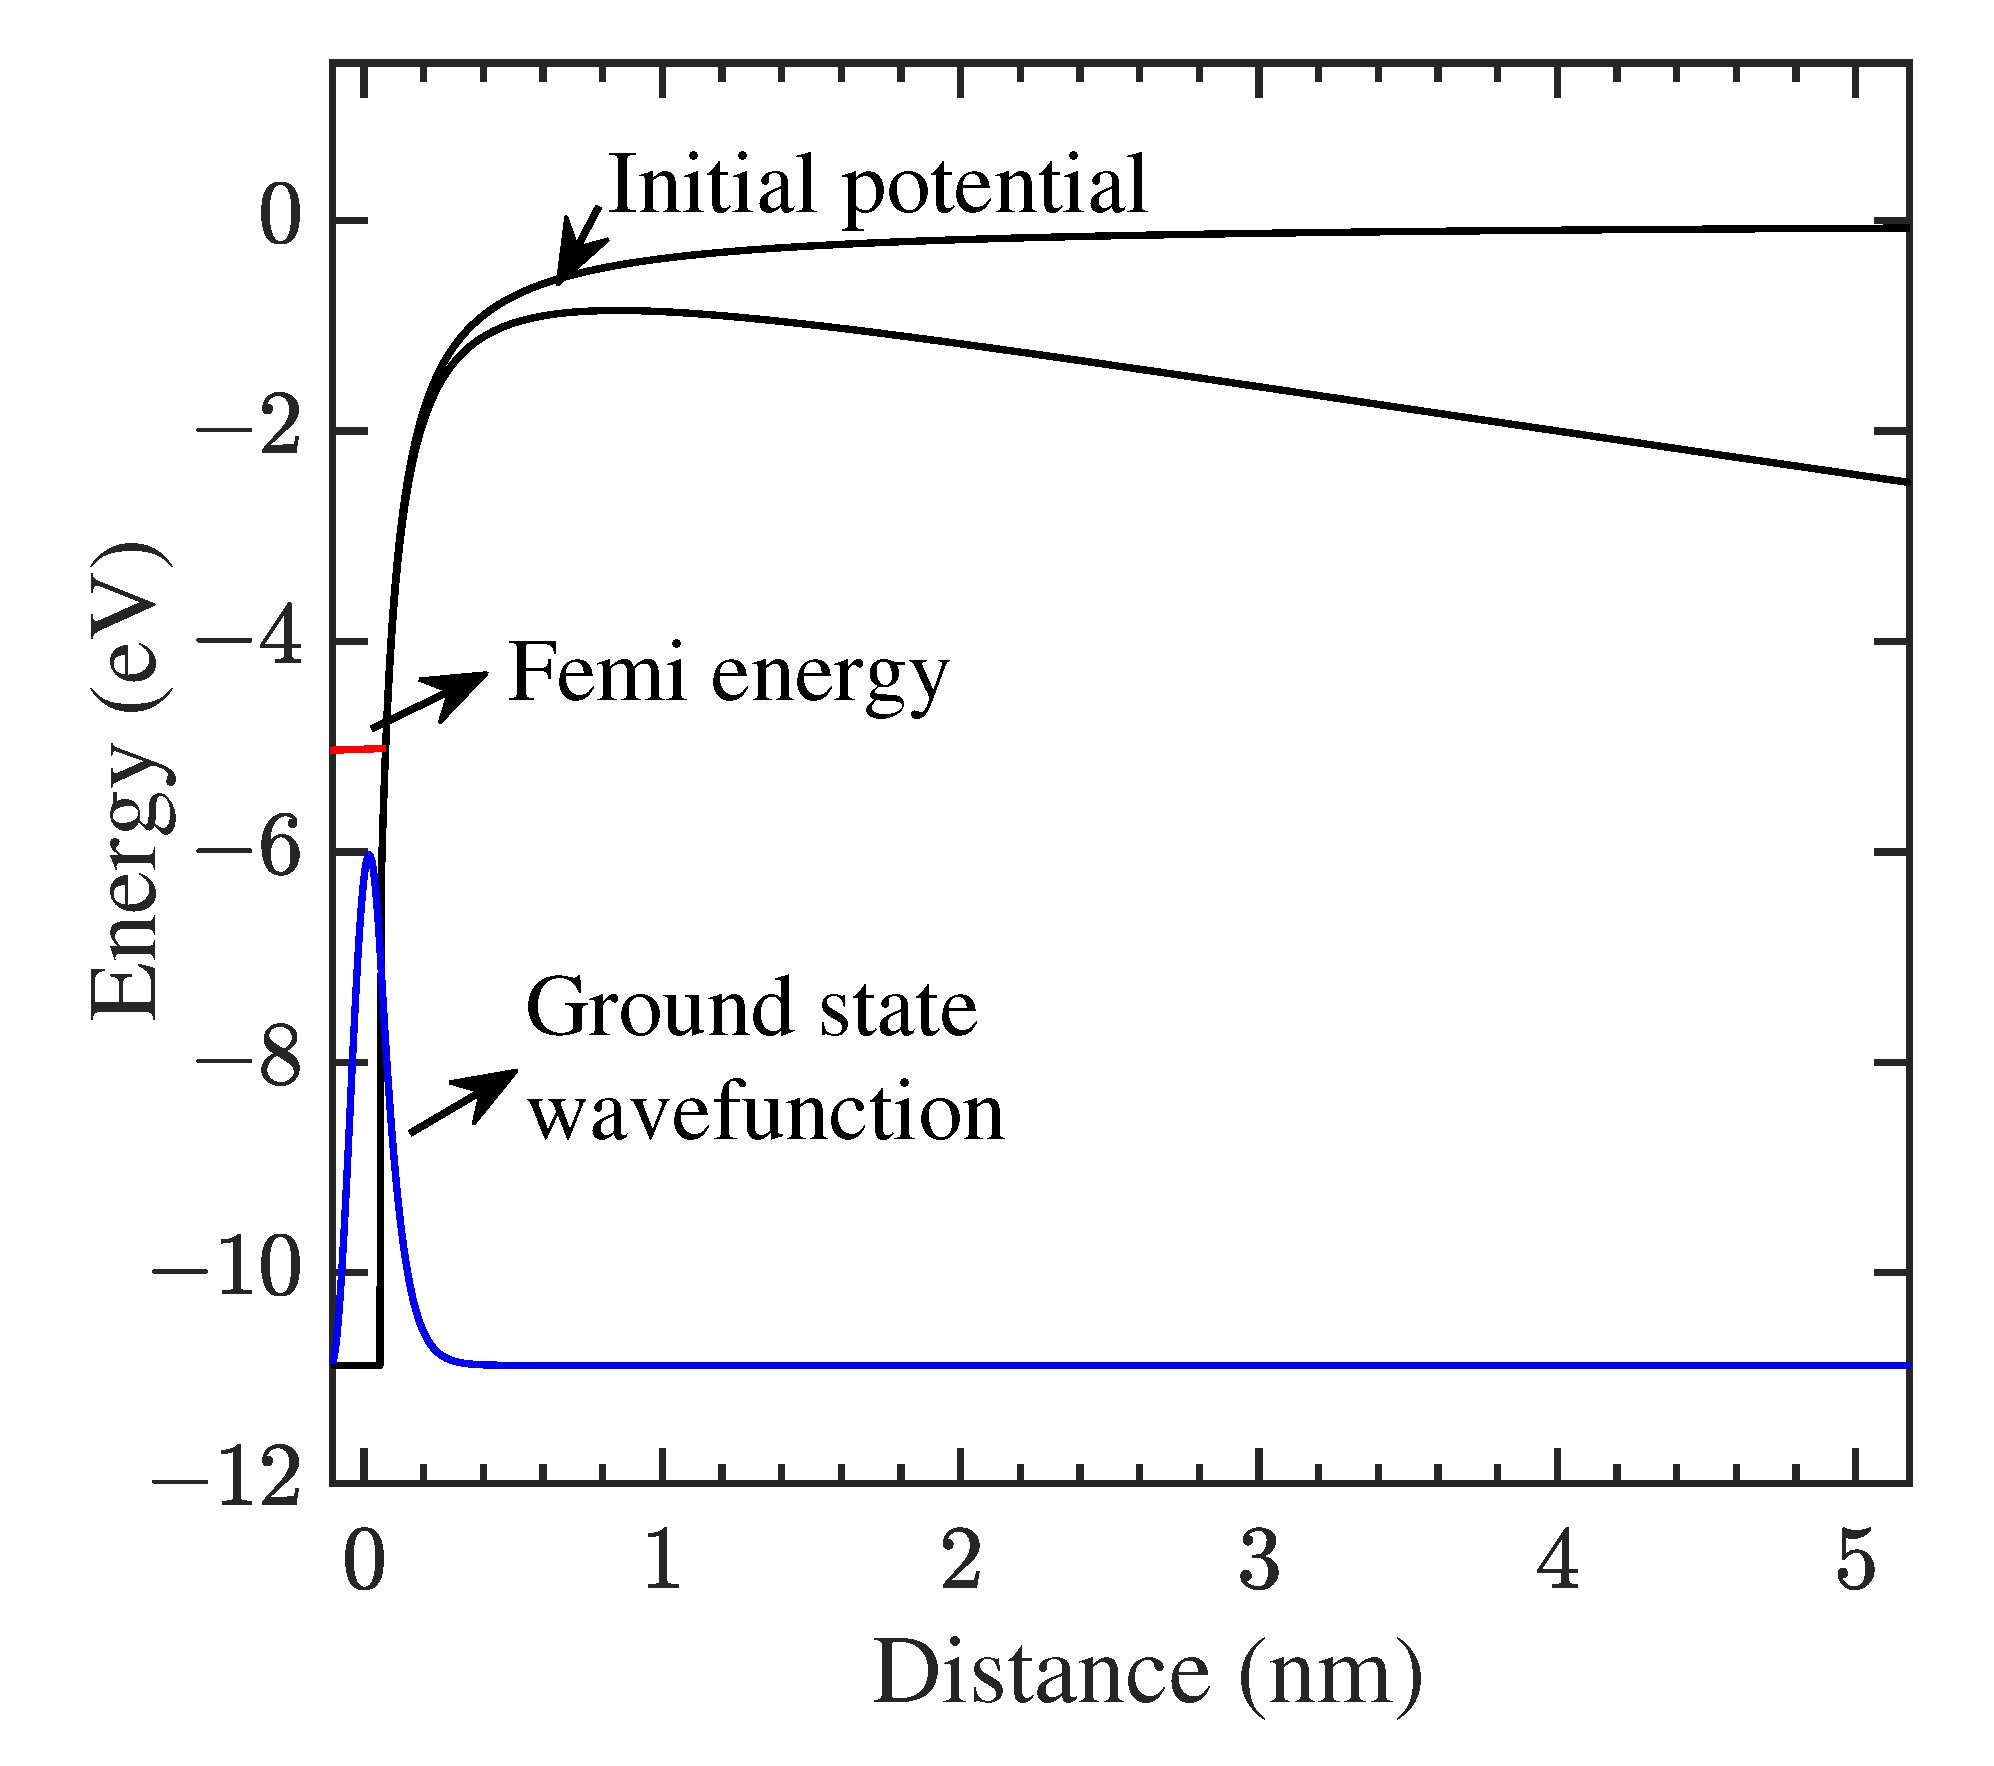
in which is the laser-electron interaction potential and represents the static model potential [20,40], as shown in Figure 2,
in which is the left starting point of the rigid wall, W and are the work function and the Fermi energy of the material, respectively. The width of the potential well is chosen in such a way that the ground state has a binding energy corresponding to the work function W of the material. Thus, this ground state represents the electron initial state in the metal. The assumption of the rigid wall on the left side may overestimate the rescattering process, however, it does not play an important role in the laser-nanotip interaction, as will be seen later. Finally, the term models the surface image potential [41] for the ionized electron.
The ground state electron wavefunction is determined by an imaginary time propagation and the evolution of the wavefunction in real time is accomplished with the Crank–Nicolson algorithm [42],
where the Hamiltonian H contains the second order spatial derivative (see Equation (3)). In our numerical implementation, the second order spatial derivative is discretized by using the finite difference scheme. The numerical spatial and time grids are spaced by and , respectively, and the box size is
where is the ponderomotive energy and the final propagation time. After numerical discretization, the Equation (5) is converted to a system of tridiagonal linear equations which can be solved using a parallel solver [43]. The above spatial and temporal grids spacing, as well as the box size, are enough to assure convergence and the propagation of the electron wavefunction corresponding to the maximal final electron energy. Meanwhile, to avoid numerical reflection at the box boundary, a complex absorbing potential [43], with a cap height , is added at the box boundary.
Finally, due to the very weak interaction of the ionized electron with the nanotip, one can retrieve the photoelectron spectra by projecting the final electron wavefunction onto outgoing plane waves,
where denotes a 1D plane wave with energy .
2.2. Classical Trajectory Monte Carlo Method
Classical trajectory simulations can always provide an intuitive and deeper understanding than the TDSE, since one can trace back each electron trajectory. The simple man’s model, also known as the three-step model, used to explain several strong field atomic and molecular phenomena [2,44,45], can be modified to simulate photoelectron dynamics at nanotips.
Our CTMC approach for modelling the laser-nanotip interaction includes three steps as well: electrons tunnel through the barrier of the combined surface (see Figure 2) and laser potentials, near the maxima of the electric field (step 1). The liberated electrons then propagate into free space and undergo a ponderomotive acceleration. Depending on the phase of the near-field at the moment of appearance at the tunneling exit and initial velocity, electrons will be either directly emitted (direct electrons) or driven back towards the surface (step 2). A fraction of these direct electrons eventually rescatters (rescattered electrons) at the nanotip surface and reach the detector after another acceleration stage (step 3).
The tunneling process (step 1) is quantum mechanical, which renders the CTMC model semi-classical. Since the present simulations involve low laser frequencies and strong fields, the widely used Ammosov–Delone–Krainov (ADK) [46] tunneling formula for atomic and molecular systems based on a 3D spherically symmetric potential is not applicable here. So, we use the Fowler–Nordheim equation [47,48], derived within the adiabatic approximation, to describe the tunneling rate
where is a Heaviside function, which assures that, unlike for atoms, electron emission takes place only during laser half-cycles with negative electric field, and is the time-dependent localized electric field at the tip surface. Within the tunneling process, the spatially inhomogeneous character of the electric field is not considered.
In steps 2 and 3, the photoemitted electron is treated as a classical point-like particle that propagates on a classical trajectory under the influence of the near-field. This trajectory is numerically extracted by solving the Newton’s equation of motion,
In our simulations, Equation (9) is solved by a 4-th order Runge–Kutta solver, with the initial conditions: and , where is the tunneling time for the electron sample i. The time step for solving the Equation (9) is , which is enough to assure the numerical convergence of our 4-th order Runge–Kutta solver. A set of single-particle trajectories are, then, available.
To produce the energy-resolved photoelectron spectrum, all contributions to a given final energy should be summed over. Namely, the probability to detect an electron at energy is given by
where the summation is over all electrons with final energy , falling within an energy window , centered around the energy .
3. Results and Discussion
In this paper, we consider a gold nanotip with a radius of curvature , work function and Fermi energy . Additionally, we use a linearly polarized, in the z-axis, -shaped laser pulse with at wavelengths spanning the range between to . Although the field enhancement is generally wavelength-dependent, the mid-infrared pulses used in the present work are away from the resonant wavelength region. According to the permittivity data of gold [49], one can estimate that the field enhancement is approximately constant over the wavelength region of our interest. To be closer to the experimental situation [18], we use in our simulations. The peak intensity of the incident laser is set to be . Meanwhile, the enhanced localized laser field has a maximum of . The ponderomotive energy is defined by the enhanced intensity following . The Keldysh parameter [1], , is then in a range from to , which means that we are well into the deep tunneling regime. In this way, the validity of the CTMC approach is guaranteed.
3.1. The Wavelength-Dependent Photoelectron Spectra
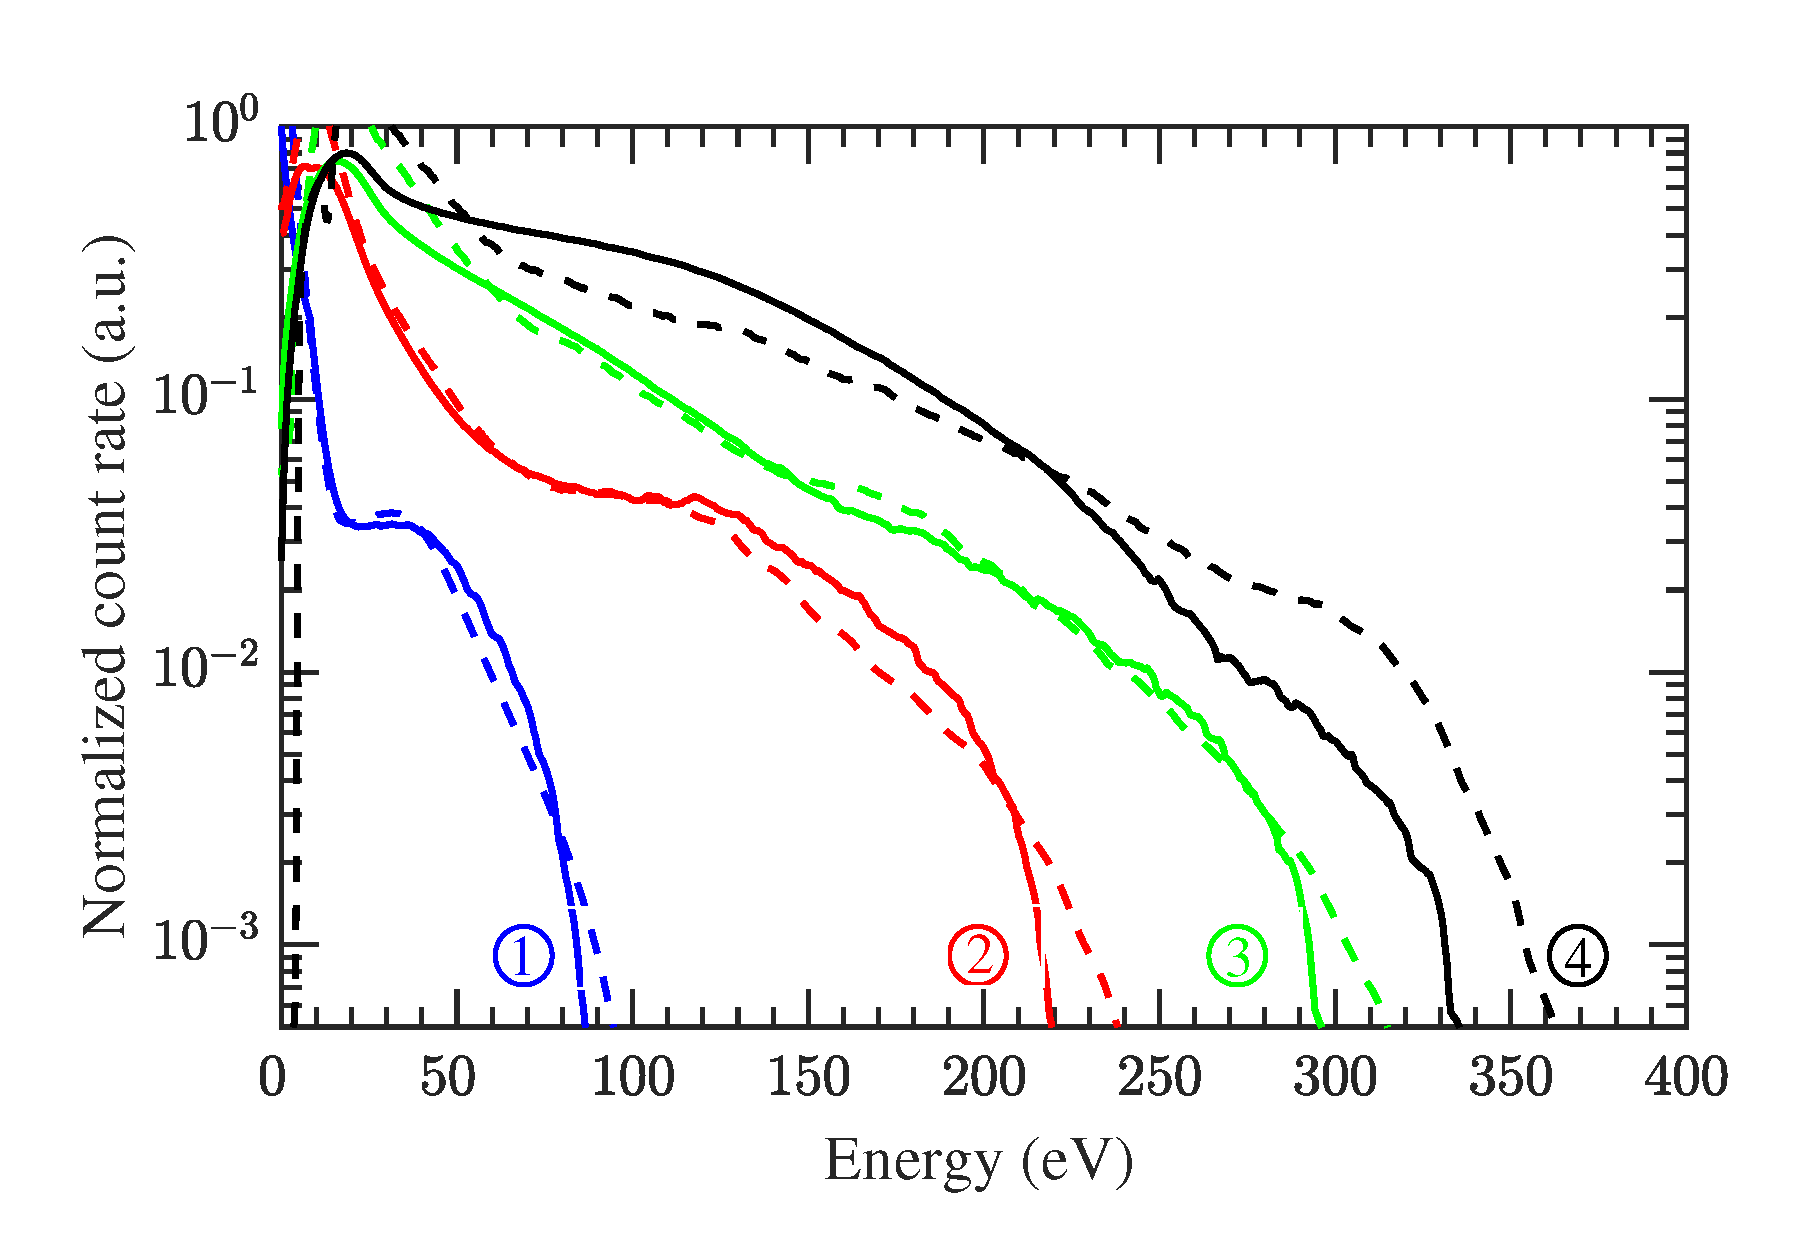
Firstly, we study the main features of photoelectron spectra in the near-field of the nanotip. In Figure 3, we present a set of energy-resolved photoelectron spectra, simulated by both the CTMC and TDSE approaches, at laser wavelengths ranging from to . In actual experimental situations [13,18], the nanotip apex is overlapped with the laser focal spot. Therefore, a focal volumetric averaging, based on a space-dependent volume scaling [50,51], is included in our simulations. As shown in Figure 3, both the CTMC and TDSE methods generate approximately identical photoelectron spectral structures. Slight differences at low electron energies can be seen between the two models. Nevertheless, as we are interested in the mid- to high-electron energy region, this contrast does not affect our conclusions. Having said this, we note that there is a not so good agreement between the result of the TDSE and the one of CTMC at 3200 nm wavelength. This disagreement is related to the ground state depletion. As shown in Figure 2, for the TDSE simulation we use a narrow well containing only a single ground state at the Fermi energy and this is a crude approximation. In clear contrast to realistic metals, where electrons are delocalized, we consider a strongly localized state here. In this way, the ground state in our model has the characteristics of a surface state and its depletion starts to play a significant role for long wavelengths. The structures observed in the spectra for all the cases are, however, similar to the experimental ones presented in Ref. [18]. Prospectively, our TDSE method may be considered as a theoretical complement to that related experimental work.
Qualitatively, in Figure 3, it is easy to find out that the shapes of the photoelectron spectra from nanotip photoemission vary with the laser wavelength. Furthermore, it seems that one can obtain relatively high-energy and high-yield electrons for long wavelengths. On the contrary, as we all know, the photoelectron spectra shape from gas-phase atomic and molecular systems is wavelength-independent. For gas-phase atomic and molecular targets, according to the three-step model [2], and over a rather broad energy range, the electron count rate stays roughly constant (up to a maximal energy of , where is the ponderomotive energy).
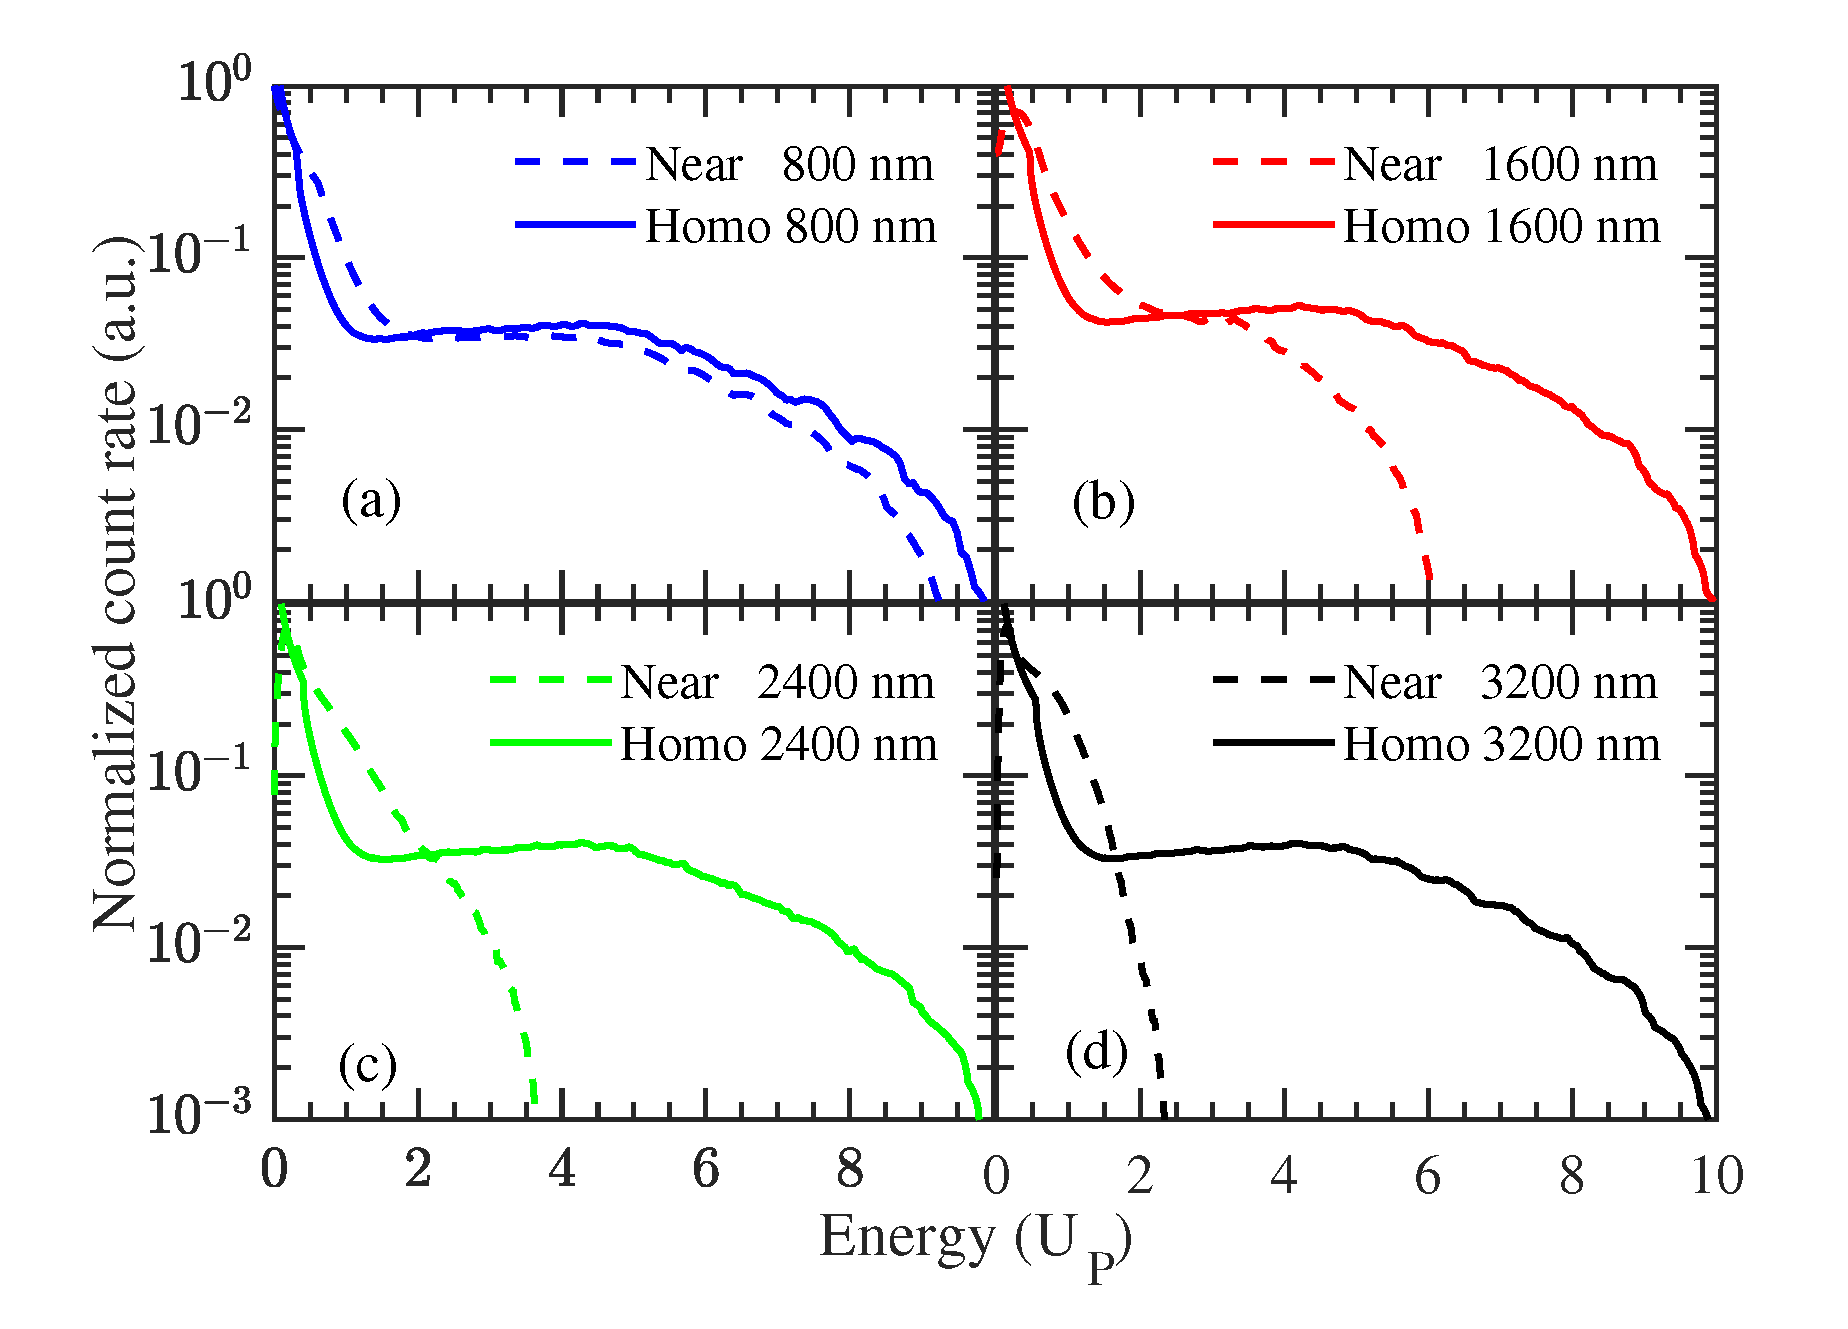
Considering the spatial inhomogeneity character of the optical near-field excited at nanotip, in Figure 4, we show the normalized energy-resolved photoelectron spectra for the near-field and the homogeneous field cases, among various wavelengths using the CTMC method. The spatially homogeneous field refers to the case which only contains the field enhancement but not field spatial decay, namely,
At the same time, for convenience, the electron energy is set in terms of the corresponding in Figure 4. From this figure, we find out that, for the near-field case, the conventional rescattered plateau (ranging from to ) disappears and the photoelectron yield seems to accumulate at a low energy region (about from 0 to ). On the other hand, for the homogeneous field case, the photoelectron spectra shape remains unchanged.
3.2. Regimes of Photoelectron Spectra from Nanotip Photoemission
The distinctive wavelength-dependent features of the photoelectron spectra presented above may give a way to generate high-energy electrons and further to design high-energy nanometer-sized ultrafast electron sources using nanotips. So, it is crucial and necessary to explore these particular wavelength-dependent features.
As proposed in [21], the excited optical near-field at nanotip contains two main properties, namely (i) the field enhancement and (ii) the field decay. The field enhancement opens up the atomic and molecular strong-field area to solid-state systems and its physical meaning is obvious. On the other hand, the field decay plays a key role in the photoelectron dynamics. In the seminal paper (see e.g., [18]), the authors introduce a spatial adiabaticity parameter to characterize the nanotip photoemission, namely,
where is the quiver amplitude and the decay length. For , the electron experiences an approximately constant laser field during one laser cycle. On the contrary, for , the electron feels a strong acceleration field gradient. According to this parameter, a large wavelength means that the photoelectron dynamics are dominated by the spatial changes of the near-field. From this point, extracting the classical electron trajectories from CTMC may help us to understand the distinctive wavelength-dependent features of the photoelectron spectra shown in the previous section.
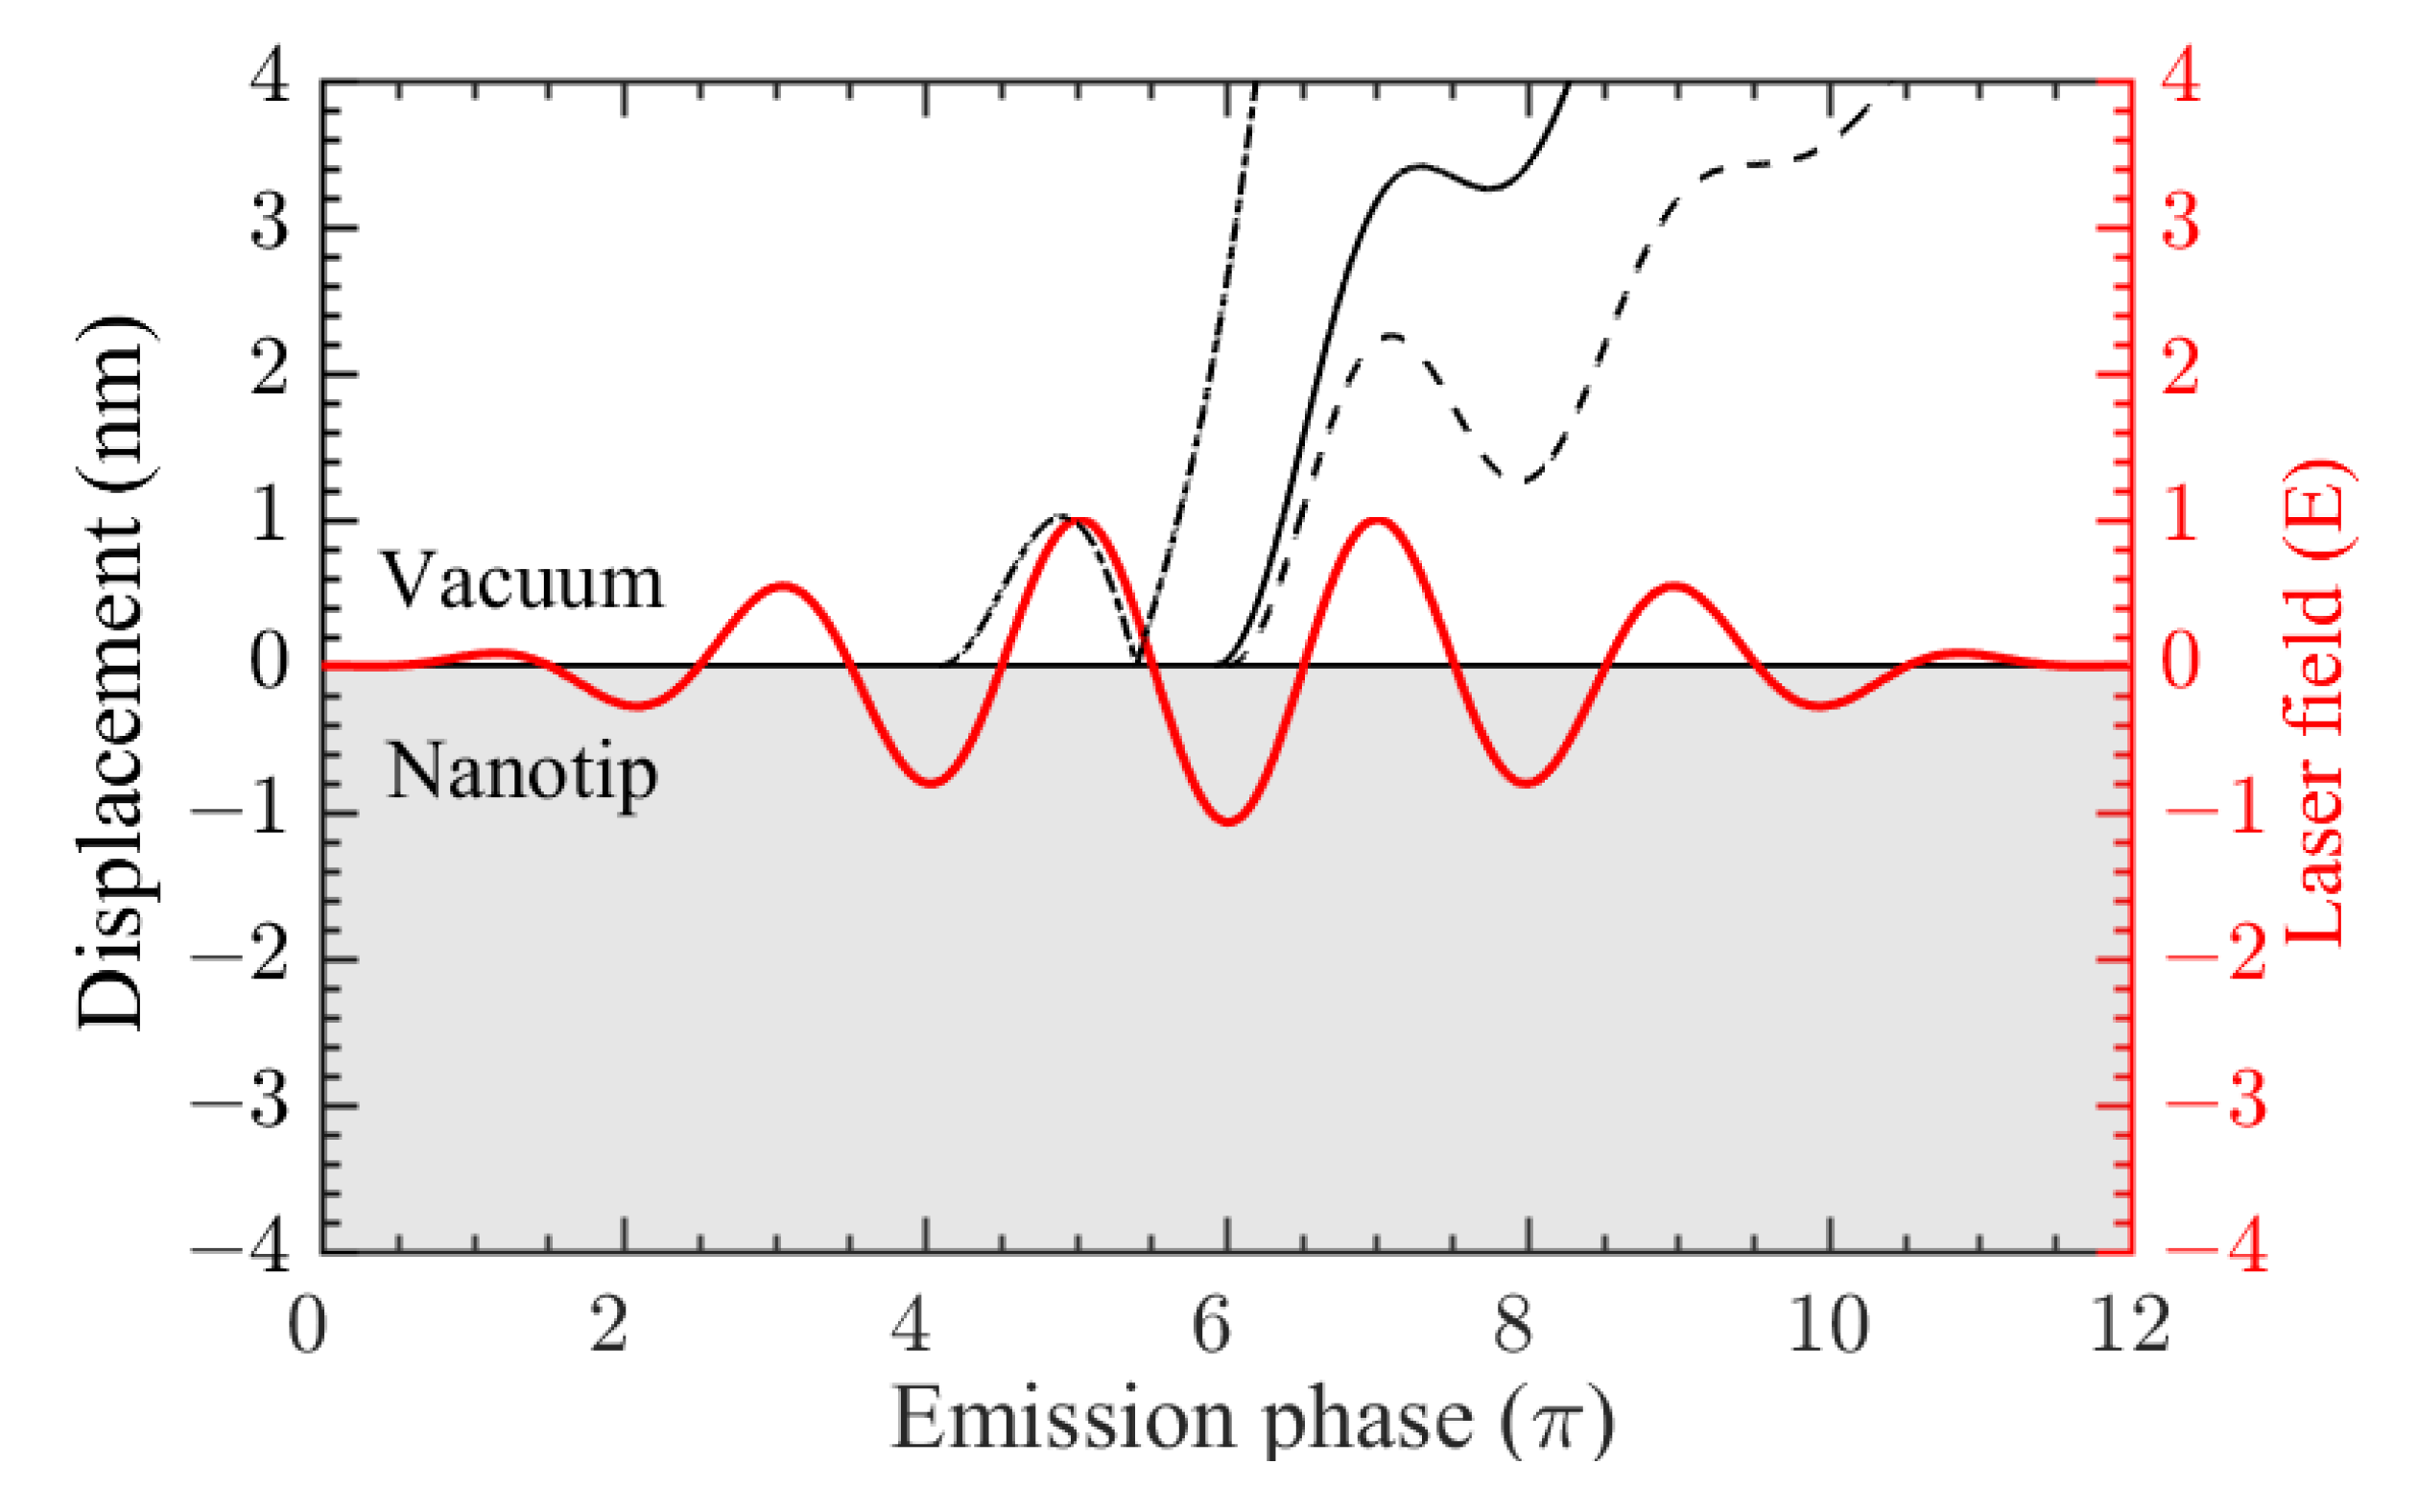
In order to perform a detailed study, taking advantage of the CTMC method, we extract the classical electron trajectories. As shown in Figure 5 (for the case), for nanotip photoemission, the conventional quiver-motion is suppressed and photoelectrons experience a suppressed quiver-motion or sub-cycle acceleration (see the black lines in Figure 5). To some extent, we may name the suppressed quiver-motion as near-field quiver-motion.
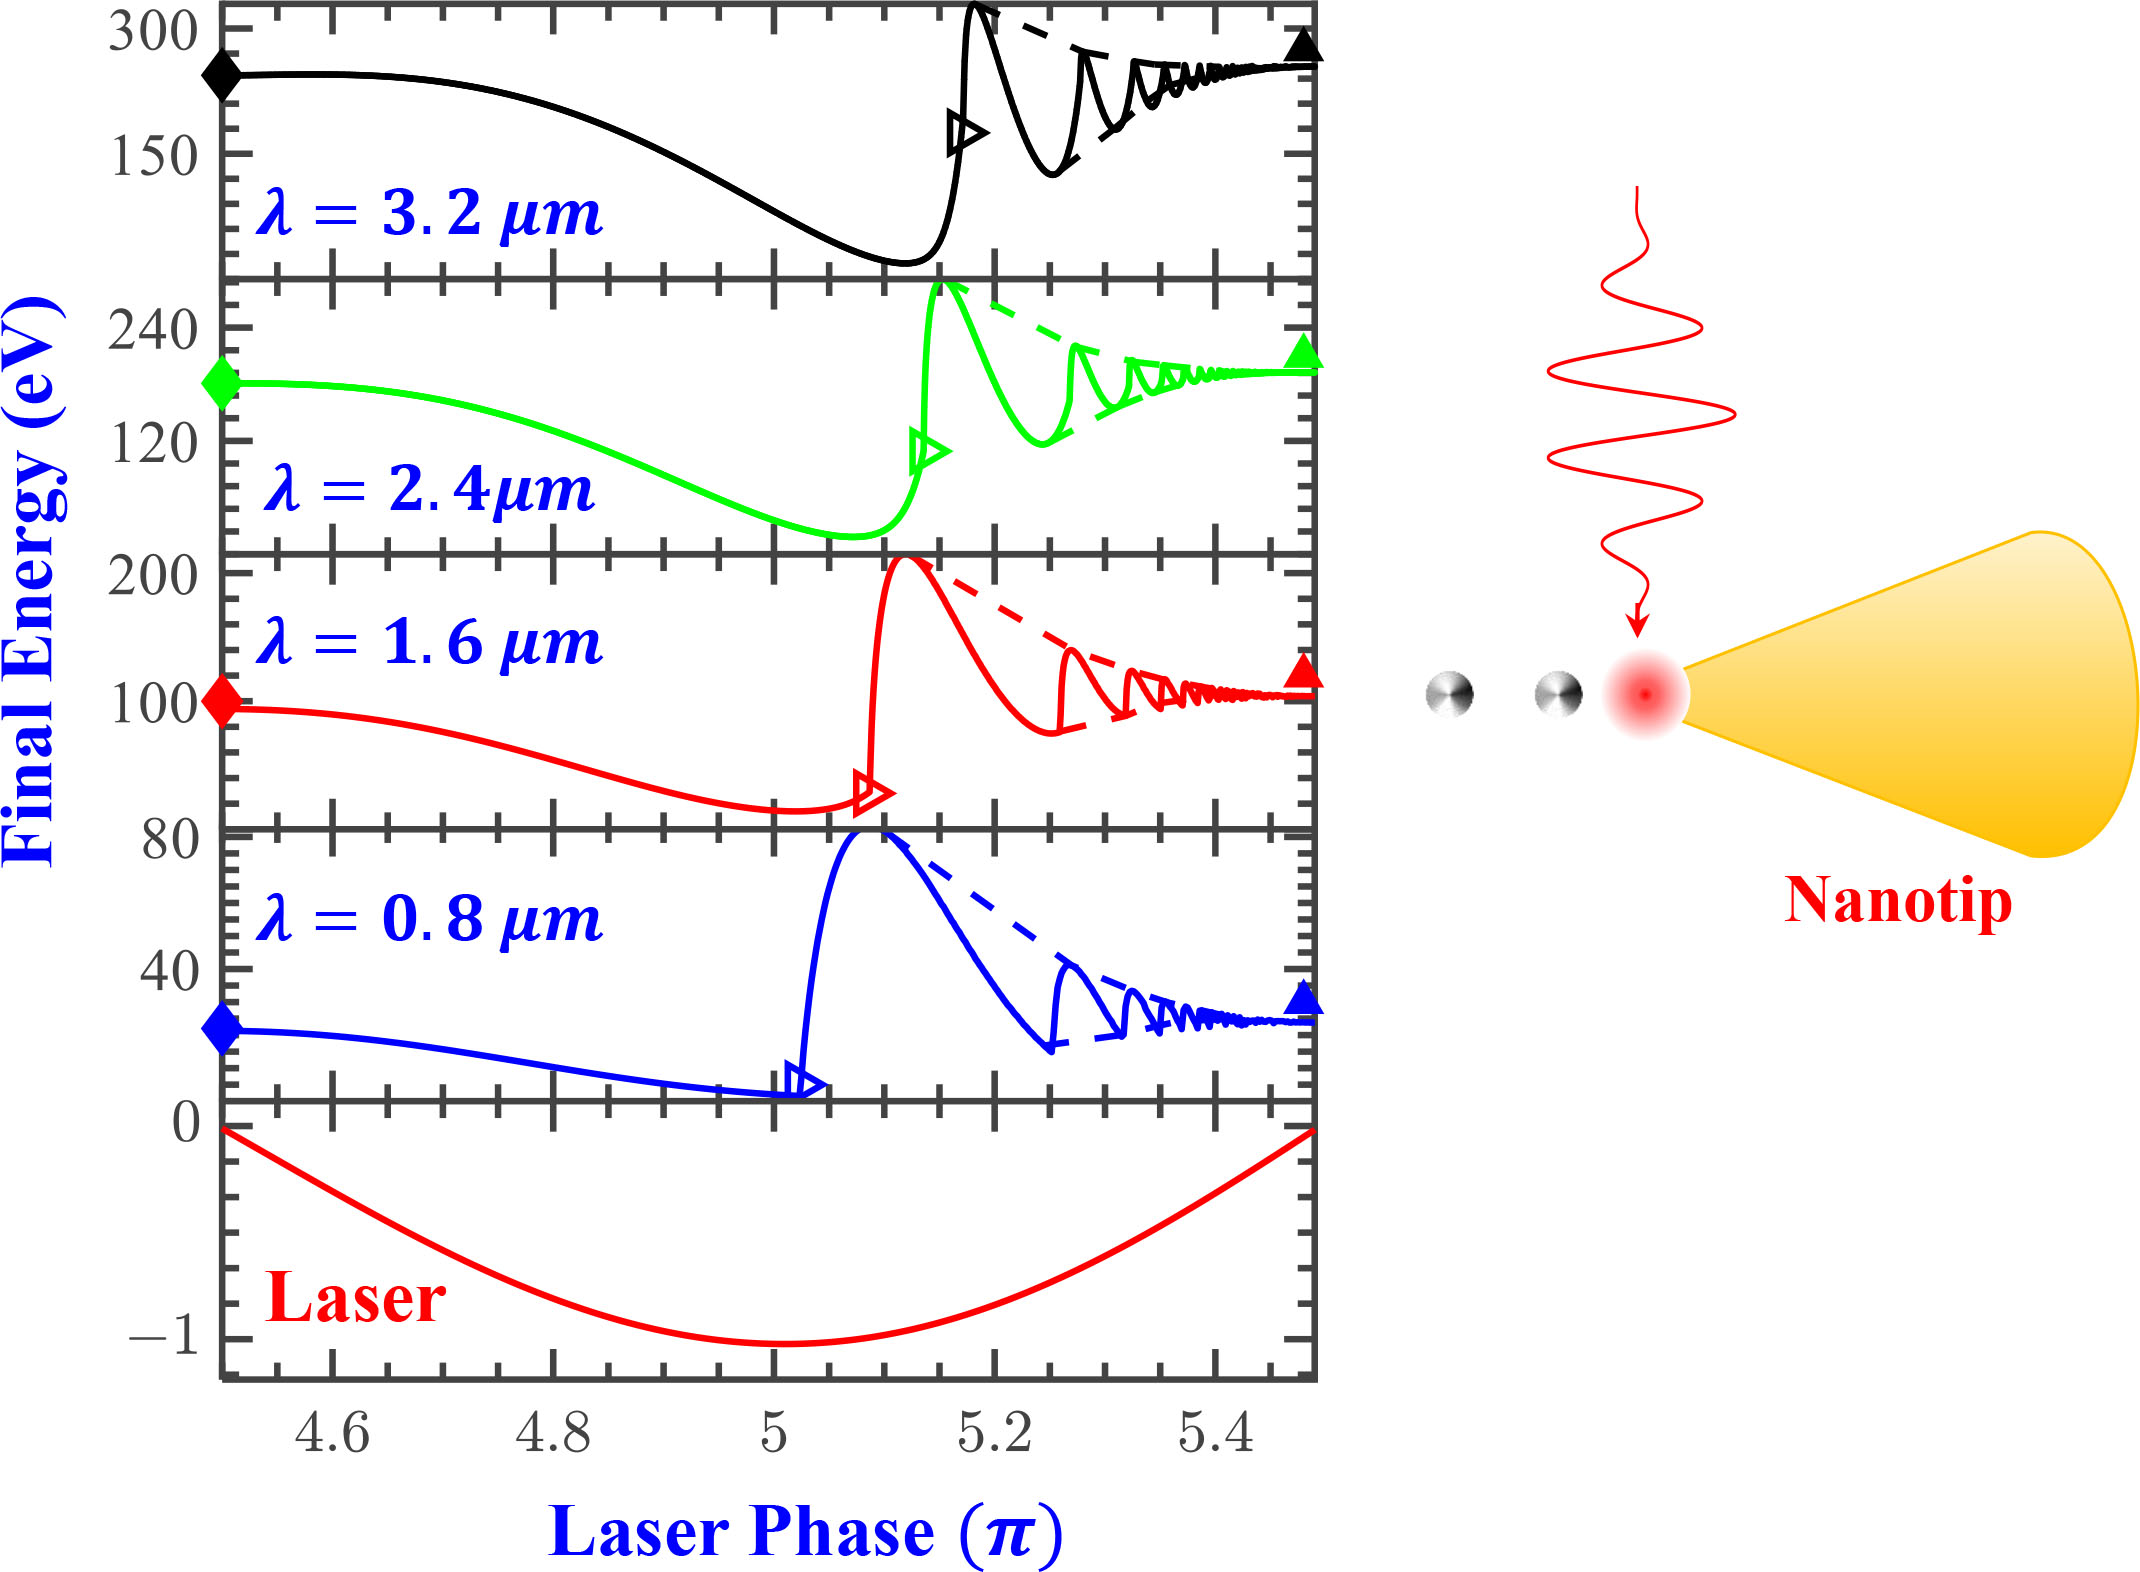
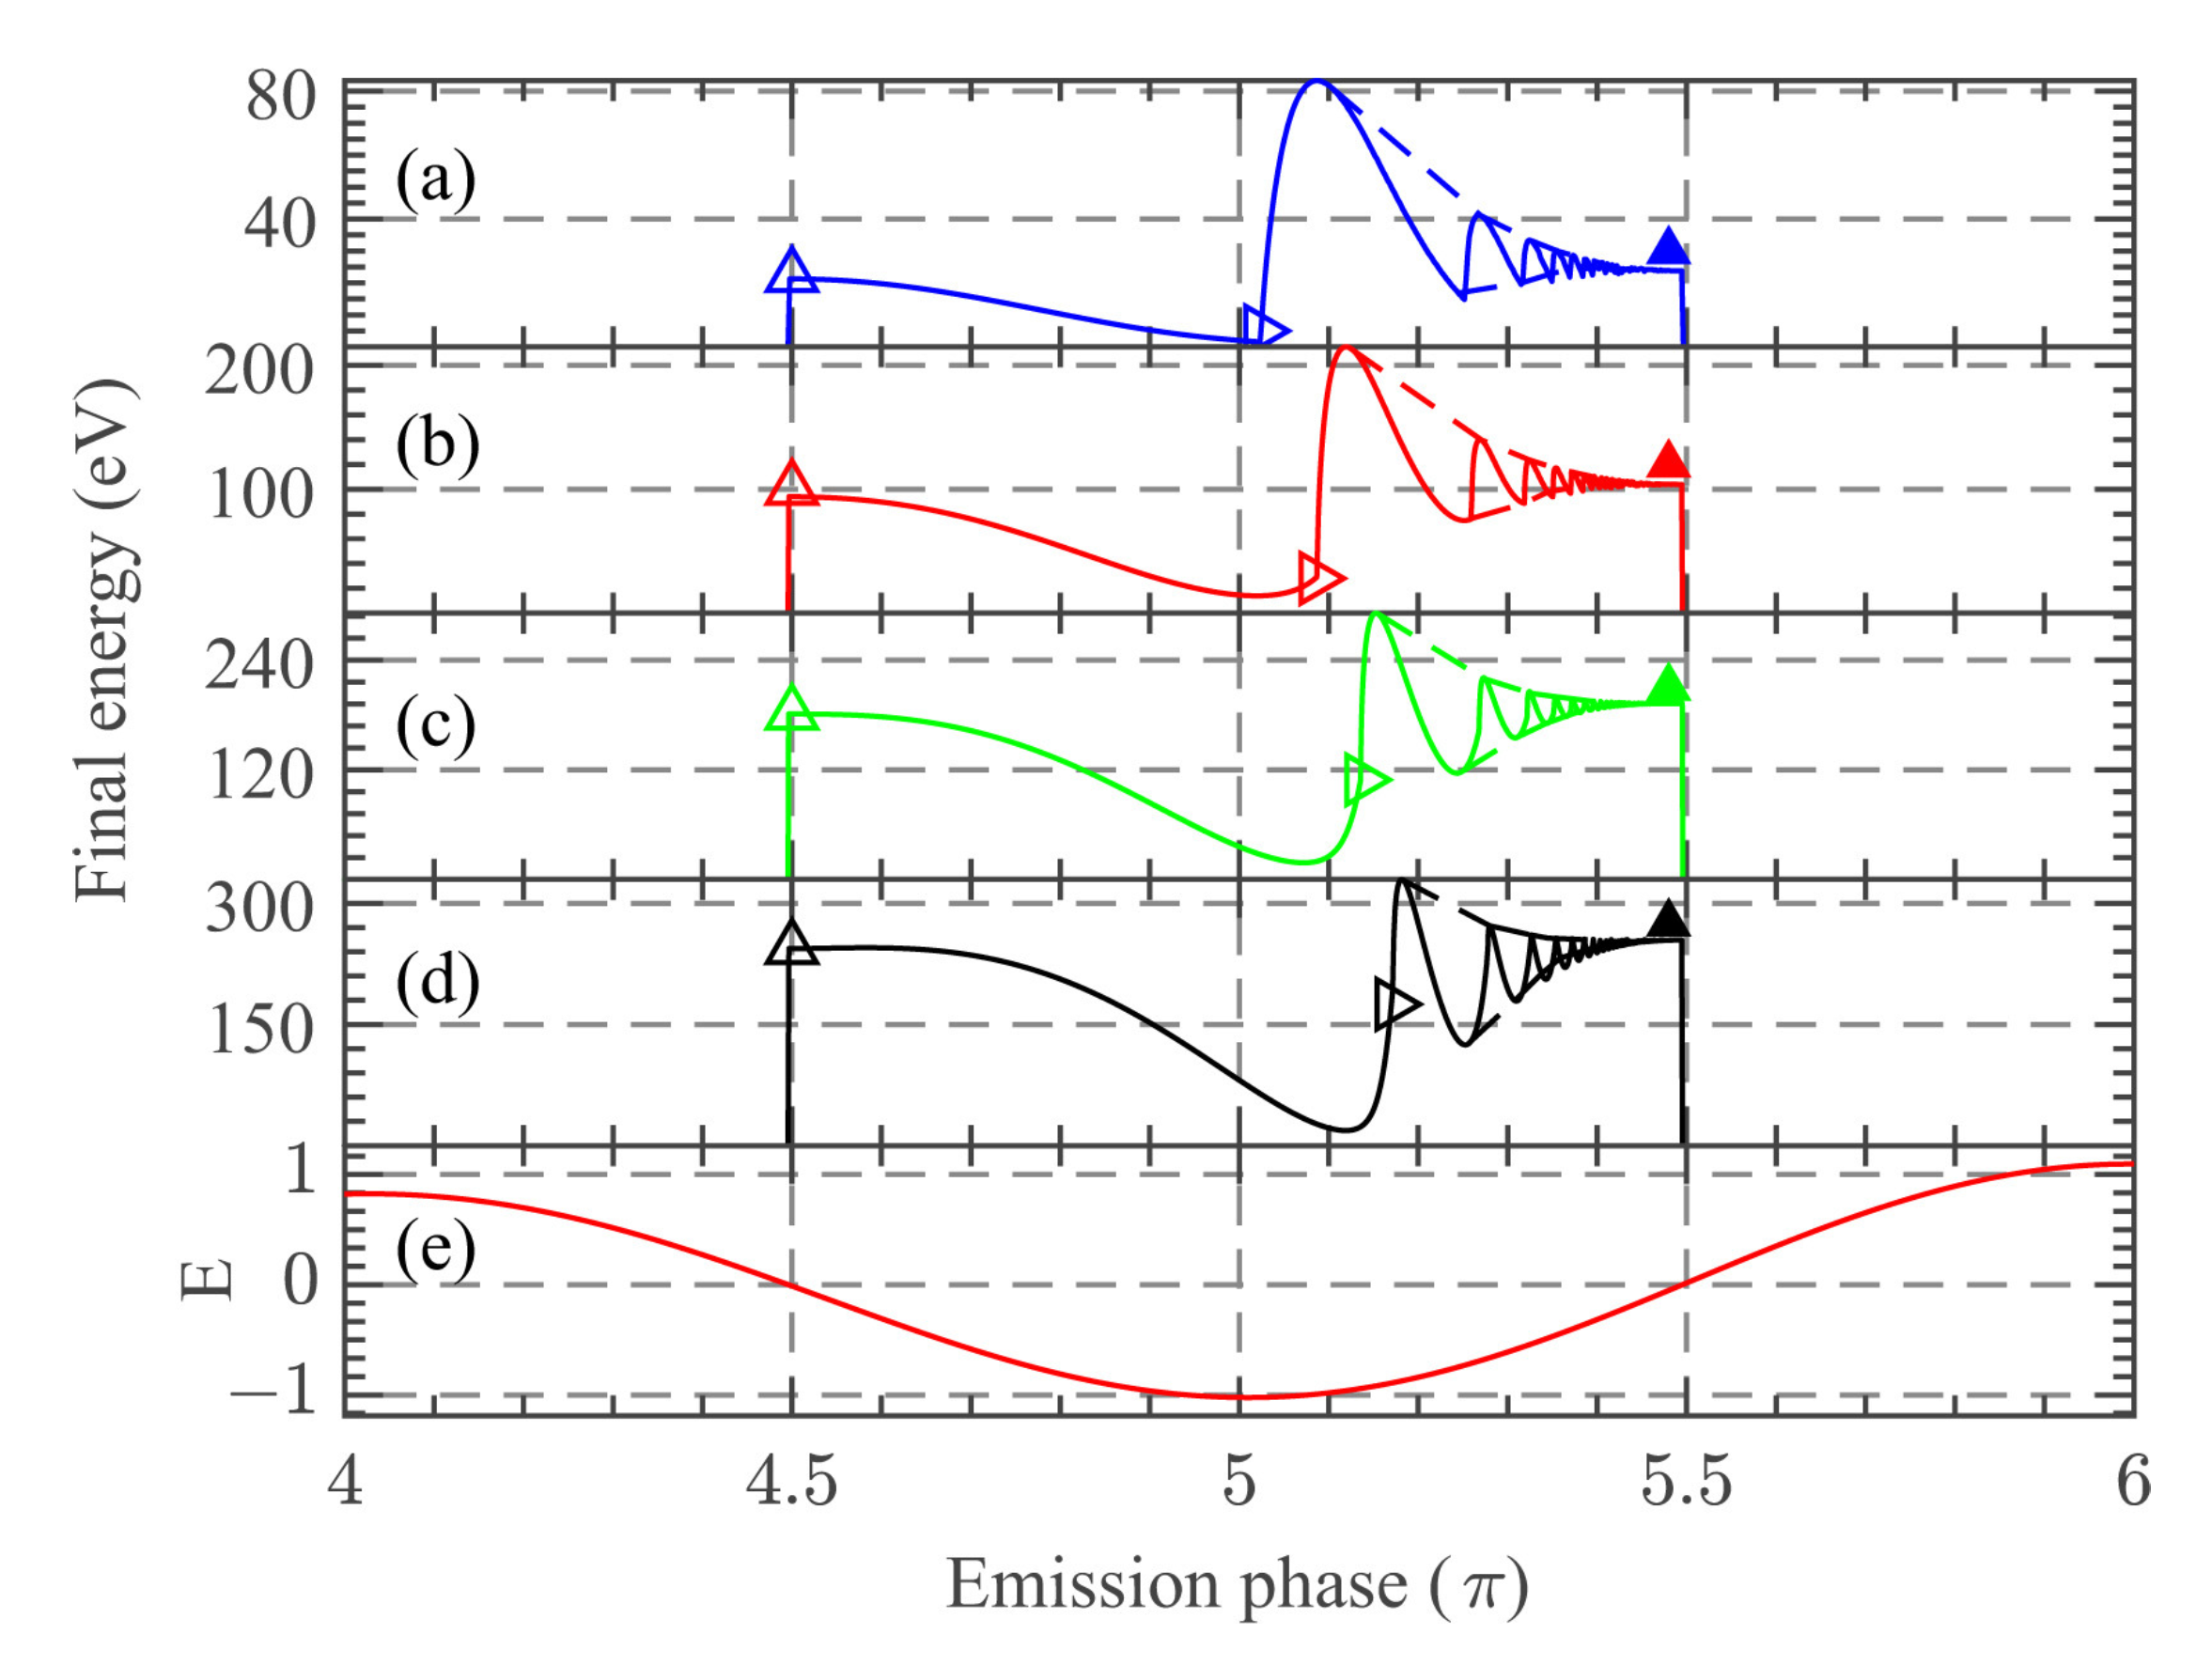
In Figure 6, we present the dependence of the photoelectron final energy on the emission phase (tunneling time), at different wavelengths, namely, Figure 6a , Figure 6b , Figure 6c and Figure 6d , keeping the rest of laser parameters as those in Figure 3. Finally, Figure 6e shows the laser electric field as a function of the emission phase. Considering the tunneling probability is a strong non-linear function of the laser electric field, Figure 6 only shows the results from the cycle which contains the laser peak intensity. At the same time, to intuitively analyse the results among the different wavelengths, the sizes of Figure 6a–d are the same and the limit of the four vertical axes are the cut off energy, i.e., they correspond to the maximum final electron energy.
The hollow right-pointing triangles in Figure 6 represent the points that divide between direct electrons (on the left) and rescattered electrons (on the right). These points can be directly obtained from our CTMC results. From Figure 6a–d, we can find out that these special points gradually move upwards and to the right, as the wavelength increases. This phenomenon indicates that direct electrons are promoted and the rescattered electrons are suppressed, as the wavelength increases. Meanwhile, the hollow up-pointing triangles in Figure 6a–d, which represent the maximal final energy of direct electrons, gradually move upwards as the wavelength grows. In this way, we may conclude that the direct electrons’ contribution to the energy-resolved photoelectron spectra starts to dominate as the wavelength increases.
In the next section, we come to an interesting point in the present paper. As mentioned above, the spatial inhomogeneity of the near-field excited at the nanotip leads to the near-field quiver-motion (see the black lines in Figure 5). The Figure 6 can also indirectly reflect this near-field quiver-motion. Additionally, the dashed lines in Figure 6a–d outline the final energy variation over the emission phase. From these dashed lines, one can see that, normalized to the cutoff, the amplitude of the final energy variation over the emission phase actually gets smaller as the wavelength increases. Meanwhile, as shown by the solid triangles in Figure 6, the converged energy of this variation gradually moves upwards. In this way, the near-field quiver-motion leads to a high-energy tail. According to the CEP-dependent energy-resolved photoelectron spectra from both CTMC and TDSE, as shown in Figure 7, this high-energy tail of the photoelectron spectra has also a relatively high-yield.
To sum up, by extracting the classical electron trajectories from the CTMC approach, we elucidate the different nanotip photoemission regimes and give an explanation of the distinctive wavelength-dependent features of the photoelectron spectra. We find that both the promoted direct electrons and the near-field quiver-motion electrons are responsible of these particular characteristics.
4. Conclusions
In conclusion, by numerical simulations, we study the interaction between a nanotip and the plasmonic-enhanced spatially inhomogeneous near-field, with wavelengths ranging from to . Comparing a series of simulation results at different wavelengths, we find distinctive wavelength-dependent features in the photoelectron spectra, particularly in the mid to high electron energy region. These characteristics are different, particularly from the well known rescattered atomic and molecular plateau. We explore this particular regime by extracting the electron trajectories from the CTMC approach. Both the enhanced probability of direct electron emission and the near-field quiver-motion lead to these distinctive wavelength-dependent features.
The results obtained from both the classical trajectory Monte Carlo (CTMC) simulation and the numerical integration of the time-dependent Schrödinger equation (TDSE) schemes, agree very well with each other. They represent powerful tools for studying the laser-nanotip interaction. CTMC can provide some deep understanding over the TDSE results, since one can trace back each single electron trajectory. Our theoretical results and analysis contribute to the understanding of the underlying physics of the nanostructure-electron photoemission and pave new pathways for designing high-energy nanometer-sized ultrafast electron sources.
However, there is a long way to go to further confirm our theoretical predictions. Firstly, in real experimental circumstances, one has to consider the excessive heat deposition and thermal damage. As we know, nanotips may be broken after only an experiment. Secondly, the simulations described in this paper consider only the photoelectron emission from the tip apex in the forward direction. Even when most of the electrons would be generated in such a position for linearly polarized fields, we ignore the actual nanotip geometry and surface structure. Consequently, the spatial emission pattern is not considered. Thirdly, we have neglected the thermal field emission as well as the coupling between the thermal and optical fields.
Author Contributions
Conceptualization, X.-Y.W. and H.L.; methodology, X.-Y.W. and H.L.; validation, M.F.C. and L.-Y.P.; writing—original draft preparation, X.-Y.W.; writing—review and editing, X.-Y.W. and M.F.C.; supervision, L.-Y.P.; funding acquisition, L.-Y.P. All authors have read and agreed to the published version of the manuscript.
Funding
This work is partially supported by the National Natural Science Foundation of China (NSFC) under Grants No. 11725416 and No. 11574010, and by the National Key R&D Program of China (Grant No. 2018YFA0306302) M.F.C. acknowledges support by the Czech Science Foundation (project No. 20-24805J).
Acknowledgments
We would like to thank the reviewers and editors for the careful reviewing and insightful comments.
Conflicts of Interest
The authors declare no conflict of interest.
References
- Keldysh, L. Ionization in the field of a strong electromagnetic wave. Sov. Phys. JETP 1965, 20, 1307–1314. [Google Scholar]
- Corkum, P.B. Plasma perspective on strong field multiphoton ionization. Phys. Rev. Lett. 1993, 71, 1994–1997. [Google Scholar] [CrossRef] [Green Version]
- Paulus, G.; Grasbon, F.; Walther, H.; Villoresi, P.; Nisoli, M.; Stagira, S.; Priori, E.; De Silvestri, S. Absolute-phase phenomena in photoionization with few-cycle laser pulses. Nature 2001, 414, 182. [Google Scholar] [CrossRef]
- Krause, J.L.; Schafer, K.J.; Kulander, K.C. High-order harmonic generation from atoms and ions in the high intensity regime. Phys. Rev. Lett. 1992, 68, 3535–3538. [Google Scholar] [CrossRef] [PubMed] [Green Version]
- Agostini, P.; Fabre, F.; Mainfray, G.; Petite, G.; Rahman, N.K. Free-Free Transitions Following Six-Photon Ionization of Xenon Atoms. Phys. Rev. Lett. 1979, 42, 1127–1130. [Google Scholar] [CrossRef]
- Eberly, J.H.; Javanainen, J.; Rzazewski, K. Above-threshold ionization. Phys. Rep. 1991, 204, 331–383. [Google Scholar] [CrossRef]
- Milošević, D.; Paulus, G.; Bauer, D.; Becker, W. Above-threshold ionization by few-cycle pulses. J. Phys. B 2006, 39, R203. [Google Scholar] [CrossRef]
- Walker, B.; Sheehy, B.; DiMauro, L.F.; Agostini, P.; Schafer, K.J.; Kulander, K.C. Precision Measurement of Strong Field Double Ionization of Helium. Phys. Rev. Lett. 1994, 73, 1227–1230. [Google Scholar] [CrossRef]
- Bergues, B.; Kübel, M.; Kling, N.G.; Burger, C.; Kling, M.F. Single-cycle non-sequential double ionization. IEEE J. Sel. Top. Quantum Electron. 2015, 21, 1–9. [Google Scholar] [CrossRef]
- Irvine, S.; Dechant, A.; Elezzabi, A. Generation of 0.4-keV femtosecond electron pulses using impulsively excited surface plasmons. Phys. Rev. Lett. 2004, 93, 184801. [Google Scholar] [CrossRef]
- Rácz, P.; Irvine, S.; Lenner, M.; Mitrofanov, A.; Baltuška, A.; Elezzabi, A.; Dombi, P. Strong-field plasmonic electron acceleration with few-cycle, phase-stabilized laser pulses. Appl. Phys. Lett. 2011, 98, 111116. [Google Scholar] [CrossRef]
- Bormann, R.; Gulde, M.; Weismann, A.; Yalunin, S.; Ropers, C. Tip-enhanced strong-field photoemission. Phys. Rev. Lett. 2010, 105, 147601. [Google Scholar] [CrossRef] [PubMed]
- Krüger, M.; Schenk, M.; Hommelhoff, P. Attosecond control of electrons emitted from a nanoscale metal tip. Nature 2011, 475, 78. [Google Scholar] [CrossRef] [PubMed] [Green Version]
- Schenk, M.; Krüger, M.; Hommelhoff, P. Strong-field above-threshold photoemission from sharp metal tips. Phys. Rev. Lett. 2010, 105, 257601. [Google Scholar] [CrossRef] [PubMed]
- Zherebtsov, S.; Fennel, T.; Plenge, J.; Antonsson, E.; Znakovskaya, I.; Wirth, A.; Herrwerth, O.; Süßmann, F.; Peltz, C.; Ahmad, I.; et al. Controlled near-field enhanced electron acceleration from dielectric nanospheres with intense few-cycle laser fields. Nat. Phys. 2011, 7, 656. [Google Scholar] [CrossRef]
- Kim, S.; Jin, J.; Kim, Y.J.; Park, I.Y.; Kim, Y.; Kim, S.W. High-harmonic generation by resonant plasmon field enhancement. Nature 2008, 453, 757. [Google Scholar] [CrossRef]
- Sivis, M.; Duwe, M.; Abel, B.; Ropers, C. Nanostructure-enhanced atomic line emission. Nature 2012, 485, E1. [Google Scholar] [CrossRef]
- Herink, G.; Solli, D.R.; Gulde, M.; Ropers, C. Field-driven photoemission from nanostructures quenches the quiver motion. Nature 2012, 483, 190–193. [Google Scholar] [CrossRef]
- Ciappina, M.F.; Pérez-Hernández, J.A.; Landsman, A.S.; Okell, W.A.; Zherebtsov, S.; Förg, B.; Schötz, J.; Seiffert, L.; Fennel, T.; Shaaran, T.; et al. Attosecond physics at the nanoscale. Rep. Prog. Phys. 2017, 80, 054401. [Google Scholar] [CrossRef]
- Krüger, M.; Schenk, M.; Förster, M.; Hommelhoff, P. Attosecond physics in photoemission from a metal nanotip. J. Phys. B 2012, 45, 074006. [Google Scholar] [CrossRef]
- Krüger, M.; Lemell, C.; Wachter, G.; Burgdörfer, J.; Hommelhoff, P. Attosecond physics phenomena at nanometric tips. J. Phys. B 2018, 51, 172001. [Google Scholar] [CrossRef]
- Wood, R.W. A new form of cathode discharge and the production of X-rays, together with some notes on diffraction. Preliminary communication. Phys. Rev. 1897, 5, 1. [Google Scholar] [CrossRef] [Green Version]
- Novotny, L.; Hecht, B. Principles of Nano-Optics; Cambridge University Press: Cambridge, UK, 2012. [Google Scholar]
- Novotny, L.; Van Hulst, N. Antennas for light. Nat. Photonics 2011, 5, 83. [Google Scholar] [CrossRef]
- Martin, Y.C.; Hamann, H.F.; Wickramasinghe, H.K. Strength of the electric field in apertureless near-field optical microscopy. J. Appl. Phys. 2001, 89, 5774–5778. [Google Scholar] [CrossRef]
- Thomas, S.; Krüger, M.; Förster, M.; Schenk, M.; Hommelhoff, P. Probing of optical near-fields by electron rescattering on the 1 nm scale. Nano Lett. 2013, 13, 4790–4794. [Google Scholar] [CrossRef] [PubMed] [Green Version]
- Sarid, D.; Challener, W.A. Modern Introduction to Surface Plasmons: Theory, Mathematica Modeling, and Applications; Cambridge University Press: Cambridge, UK, 2010. [Google Scholar]
- Paulus, G.G.; Lindner, F.; Walther, H.; Baltuška, A.; Goulielmakis, E.; Lezius, M.; Krausz, F. Measurement of the phase of few-cycle laser pulses. Phys. Rev. Lett. 2003, 91, 253004. [Google Scholar] [CrossRef] [PubMed]
- Haworth, C.; Chipperfield, L.; Robinson, J.; Knight, P.; Marangos, J.; Tisch, J. Half-cycle cutoffs in harmonic spectra and robust carrier-envelope phase retrieval. Nat. Phys. 2007, 3, 52. [Google Scholar] [CrossRef]
- Ishii, N.; Kaneshima, K.; Kitano, K.; Kanai, T.; Watanabe, S.; Itatani, J. Carrier-envelope phase-dependent high harmonic generation in the water window using few-cycle infrared pulses. Nat. Commun. 2014, 5, 3331. [Google Scholar] [CrossRef] [Green Version]
- Xiong, W.H.; Geng, J.W.; Gong, Q.; Peng, L.Y. Half-cycle cutoff in near-threshold harmonic generation. New J. Phys. 2015, 17, 123020. [Google Scholar] [CrossRef]
- Piglosiewicz, B.; Schmidt, S.; Park, D.J.; Vogelsang, J.; Groß, P.; Manzoni, C.; Farinello, P.; Cerullo, G.; Lienau, C. Carrier-envelope phase effects on the strong-field photoemission of electrons from metallic nanostructures. Nat. Photonics 2014, 8, 37. [Google Scholar] [CrossRef] [Green Version]
- Echternkamp, K.; Herink, G.; Yalunin, S.V.; Rademann, K.; Schäfer, S.; Ropers, C. Strong-field photoemission in nanotip near-fields: From quiver to sub-cycle electron dynamics. Appl. Phys. B 2016, 122, 80. [Google Scholar] [CrossRef]
- Wachter, G.; Lemell, C.; Burgdörfer, J.; Schenk, M.; Krüger, M.; Hommelhoff, P. Electron rescattering at metal nanotips induced by ultrashort laser pulses. Phys. Rev. B 2012, 86, 035402. [Google Scholar] [CrossRef] [Green Version]
- Paulus, G.G.; Becker, W.; Nicklich, W.; Walther, H. Rescattering effects in above-threshold ionization: A classical model. J. Phys. B At. Mol. Opt. Phys. 1994, 27, L703. [Google Scholar] [CrossRef]
- Krausz, F.; Ivanov, M. Attosecond physics. Rev. Mod. Phys. 2009, 81, 163. [Google Scholar] [CrossRef] [Green Version]
- Jackson, J.D. Classical Electrodynamics; John Wiley & Sons Inc.: New York, NY, USA, 1999; Volume 13. [Google Scholar]
- Süßmann, F.; Seiffert, L.; Zherebtsov, S.; Mondes, V.; Stierle, J.; Arbeiter, M.; Plenge, J.; Rupp, P.; Peltz, C.; Kessel, A.; et al. Field propagation-induced directionality of carrier-envelope phase-controlled photoemission from nanospheres. Nat. Commun. 2015, 6, 1–9. [Google Scholar] [CrossRef] [Green Version]
- Yanagisawa, H.; Schnepp, S.; Hafner, C.; Hengsberger, M.; Kim, D.E.; Kling, M.F.; Landsman, A.; Gallmann, L.; Osterwalder, J. Delayed electron emission in strong-field driven tunnelling from a metallic nanotip in the multi-electron regime. Sci. Rep. 2016, 6, 35877. [Google Scholar] [CrossRef] [Green Version]
- Hommelhoff, P.; Kealhofer, C.; Kasevich, M.A. Ultrafast electron pulses from a tungsten tip triggered by low-power femtosecond laser pulses. Phys. Rev. Lett. 2006, 97, 247402. [Google Scholar] [CrossRef] [Green Version]
- Lang, N.D.; Kohn, W. Theory of Metal Surfaces: Induced Surface Charge and Image Potential. Phys. Rev. B 1973, 7, 3541–3550. [Google Scholar] [CrossRef]
- Kang, D.; Won, E. Precise numerical solutions of potential problems using the Crank–Nicolson method. J. Comput. Phys. 2008, 227, 2970–2976. [Google Scholar] [CrossRef] [Green Version]
- Bauer, D.; Koval, P. Qprop: A Schrödinger-solver for intense laser–atom interaction. Comput. Phys. Commun. 2006, 174, 396–421. [Google Scholar] [CrossRef] [Green Version]
- Kuchiev, M.Y. Atomic antenna. JETP Lett. 1987, 45, 404–406. [Google Scholar]
- Gallagher, T.F. Above-Threshold Ionization in Low-Frequency Limit. Phys. Rev. Lett. 1988, 61, 2304–2307. [Google Scholar] [CrossRef] [PubMed]
- Ammosov, M.; Delone, N.; Krainov, V.; Perelomov, A.; Popov, V.; Terent’ev, M.; Yudin, G.L.; Ivanov, M.Y. Tunnel ionization of complex atoms and of atomic ions in an alternating electric field. Sov. Phys. JETP 1986, 64, 26. [Google Scholar]
- Fowler, R.H.; Nordheim, L. Electron emission in intense electric fields. Proc. R. Soc. Lond. A 1928, 119, 173–181. [Google Scholar]
- Forbes, R.G. Simple good approximations for the special elliptic functions in standard Fowler-Nordheim tunneling theory for a Schottky-Nordheim barrier. Appl. Phys. Lett. 2006, 89, 113122. [Google Scholar] [CrossRef] [Green Version]
- Babar, S.; Weaver, J. Optical constants of Cu, Ag, and Au revisited. Appl. Opt. 2015, 54, 477–481. [Google Scholar] [CrossRef]
- Gibson, G.; Freeman, R.; McIlrath, T.; Muller, H. Excitation and ionization dynamics in short-pulse multiphoton ionization. Phys. Rev. A 1994, 49, 3870. [Google Scholar] [CrossRef]
- Hansch, P.; Walker, M.; Van Woerkom, L. Spatially dependent multiphoton multiple ionization. Phys. Rev. A 1996, 54, R2559. [Google Scholar] [CrossRef]
Figure 1.
(color online) (a) Contour plot of the near-field as a function of the emission time and the distance from the nanotip surface. Zero distance () represents the nanotip surface, is the radius of nanotip, the optical period of the laser electric field and the peak strength of the incident laser electric field. (b) The spatial distribution of the near field at . (c) The time profile of the near-field at the nanotip surface ().

Figure 2.
(color online) Model potentials used for both the classical trajectory Monte Carlo (CTMC) and the time-dependent Schrödinger equation (TDSE) simulations. The potential of the electron feels is approximated by a narrow potential well (dashed black curve) with an infinitely high potential wall on the left and a potential step on the right. For the TDSE simulations, the narrow potential contains the ground state electron wavefunction (blue curve) at the Fermi level. Additionally, an image potential is taken into account (see the text for details). The solid black curve represents the suppressed potential when an additional static electric DC field is applied.

Figure 3.
(color online) Simulated energy-resolved photoelectron spectra in the near-field of a nanotip for different wavelengths, keeping the other laser parameters fixed (see text for more details). The spectra from the same wavelength are scaled along the y-axis to match the mid energy region with each other. All the spectra are averaged, both over different CEPs and the focal spot. The numbers 1–4 correspond to the wavelengths , , and , respectively. Solid lines: CTMC simulations, dashed lines: TDSE results.

Figure 4.
(color online) Normalized energy-resolved photoelectron spectra comparison between the near-field (dot curve) and the homogeneous field (solid curve) cases, for various wavelengths using the CTMC method. For convenience, the electron energy is set in terms of . The homogeneous field refers to the one that only contains the field enhancement, but not the field decay. All the spectra are averaged over different CEPs and the focal spot. (a) simulated spectra for a laser wavelength , (b) , (c) and (d) . The rest of the laser parameters are the same as those in Figure 3.

Figure 5.
(color online) Extracted classical electron trajectories from nanotip photoemission (black lines). The red solid curve is the time profile of laser electric field. The laser parameters are the same as those of in Figure 3.
Figure 5.
(color online) Extracted classical electron trajectories from nanotip photoemission (black lines). The red solid curve is the time profile of laser electric field. The laser parameters are the same as those of in Figure 3.

Figure 6.
(color online) Dependence of the photoelectron final energy on the emission phase (tunneling time) for different laser wavelengths. (a) extracted final electron energies at a laser wavelength , (b) , (c) and (d) . The rest of the laser parameters are the same as those used in Figure 3. Considering that the tunneling probability is strongly dependent of the laser electric field, only the results from the cycle which contain the laser peak intensity are shown. The figure sizes of (a–d) are the same and the limit of the four vertical axes corresponds to the maximum final energy. In (e), we plot the normalized laser electric field as a function of the emission phase.

Figure 7.
(color online) CEP-dependent energy-resolved photoelectron spectra (log scale) at a laser wavelength of , keeping the other laser parameters the same as those in Figure 3. (a) results using the CTMC method, (b) the same as (a), but using the TDSE approach. In this figure, only the region of high electron energies is shown.

Publisher’s Note: MDPI stays neutral with regard to jurisdictional claims in published maps and institutional affiliations. |
© 2020 by the authors. Licensee MDPI, Basel, Switzerland. This article is an open access article distributed under the terms and conditions of the Creative Commons Attribution (CC BY) license (http://creativecommons.org/licenses/by/4.0/).
Share and Cite
MDPI and ACS Style
Wu, X.-Y.; Liang, H.; Ciappina, M.F.; Peng, L.-Y. Wavelength-Dependent Features of Photoelectron Spectra from Nanotip Photoemission. Photonics 2020, 7, 129. https://0-doi-org.brum.beds.ac.uk/10.3390/photonics7040129
AMA Style
Wu X-Y, Liang H, Ciappina MF, Peng L-Y. Wavelength-Dependent Features of Photoelectron Spectra from Nanotip Photoemission. Photonics. 2020; 7(4):129. https://0-doi-org.brum.beds.ac.uk/10.3390/photonics7040129
Chicago/Turabian StyleWu, Xiao-Yuan, Hao Liang, Marcelo F. Ciappina, and Liang-You Peng. 2020. "Wavelength-Dependent Features of Photoelectron Spectra from Nanotip Photoemission" Photonics 7, no. 4: 129. https://0-doi-org.brum.beds.ac.uk/10.3390/photonics7040129
Note that from the first issue of 2016, this journal uses article numbers instead of page numbers. See further details here.