Simultaneous Dual-Modal Multispectral Photoacoustic and Ultrasound Macroscopy for Three-Dimensional Whole-Body Imaging of Small Animals

 and
and 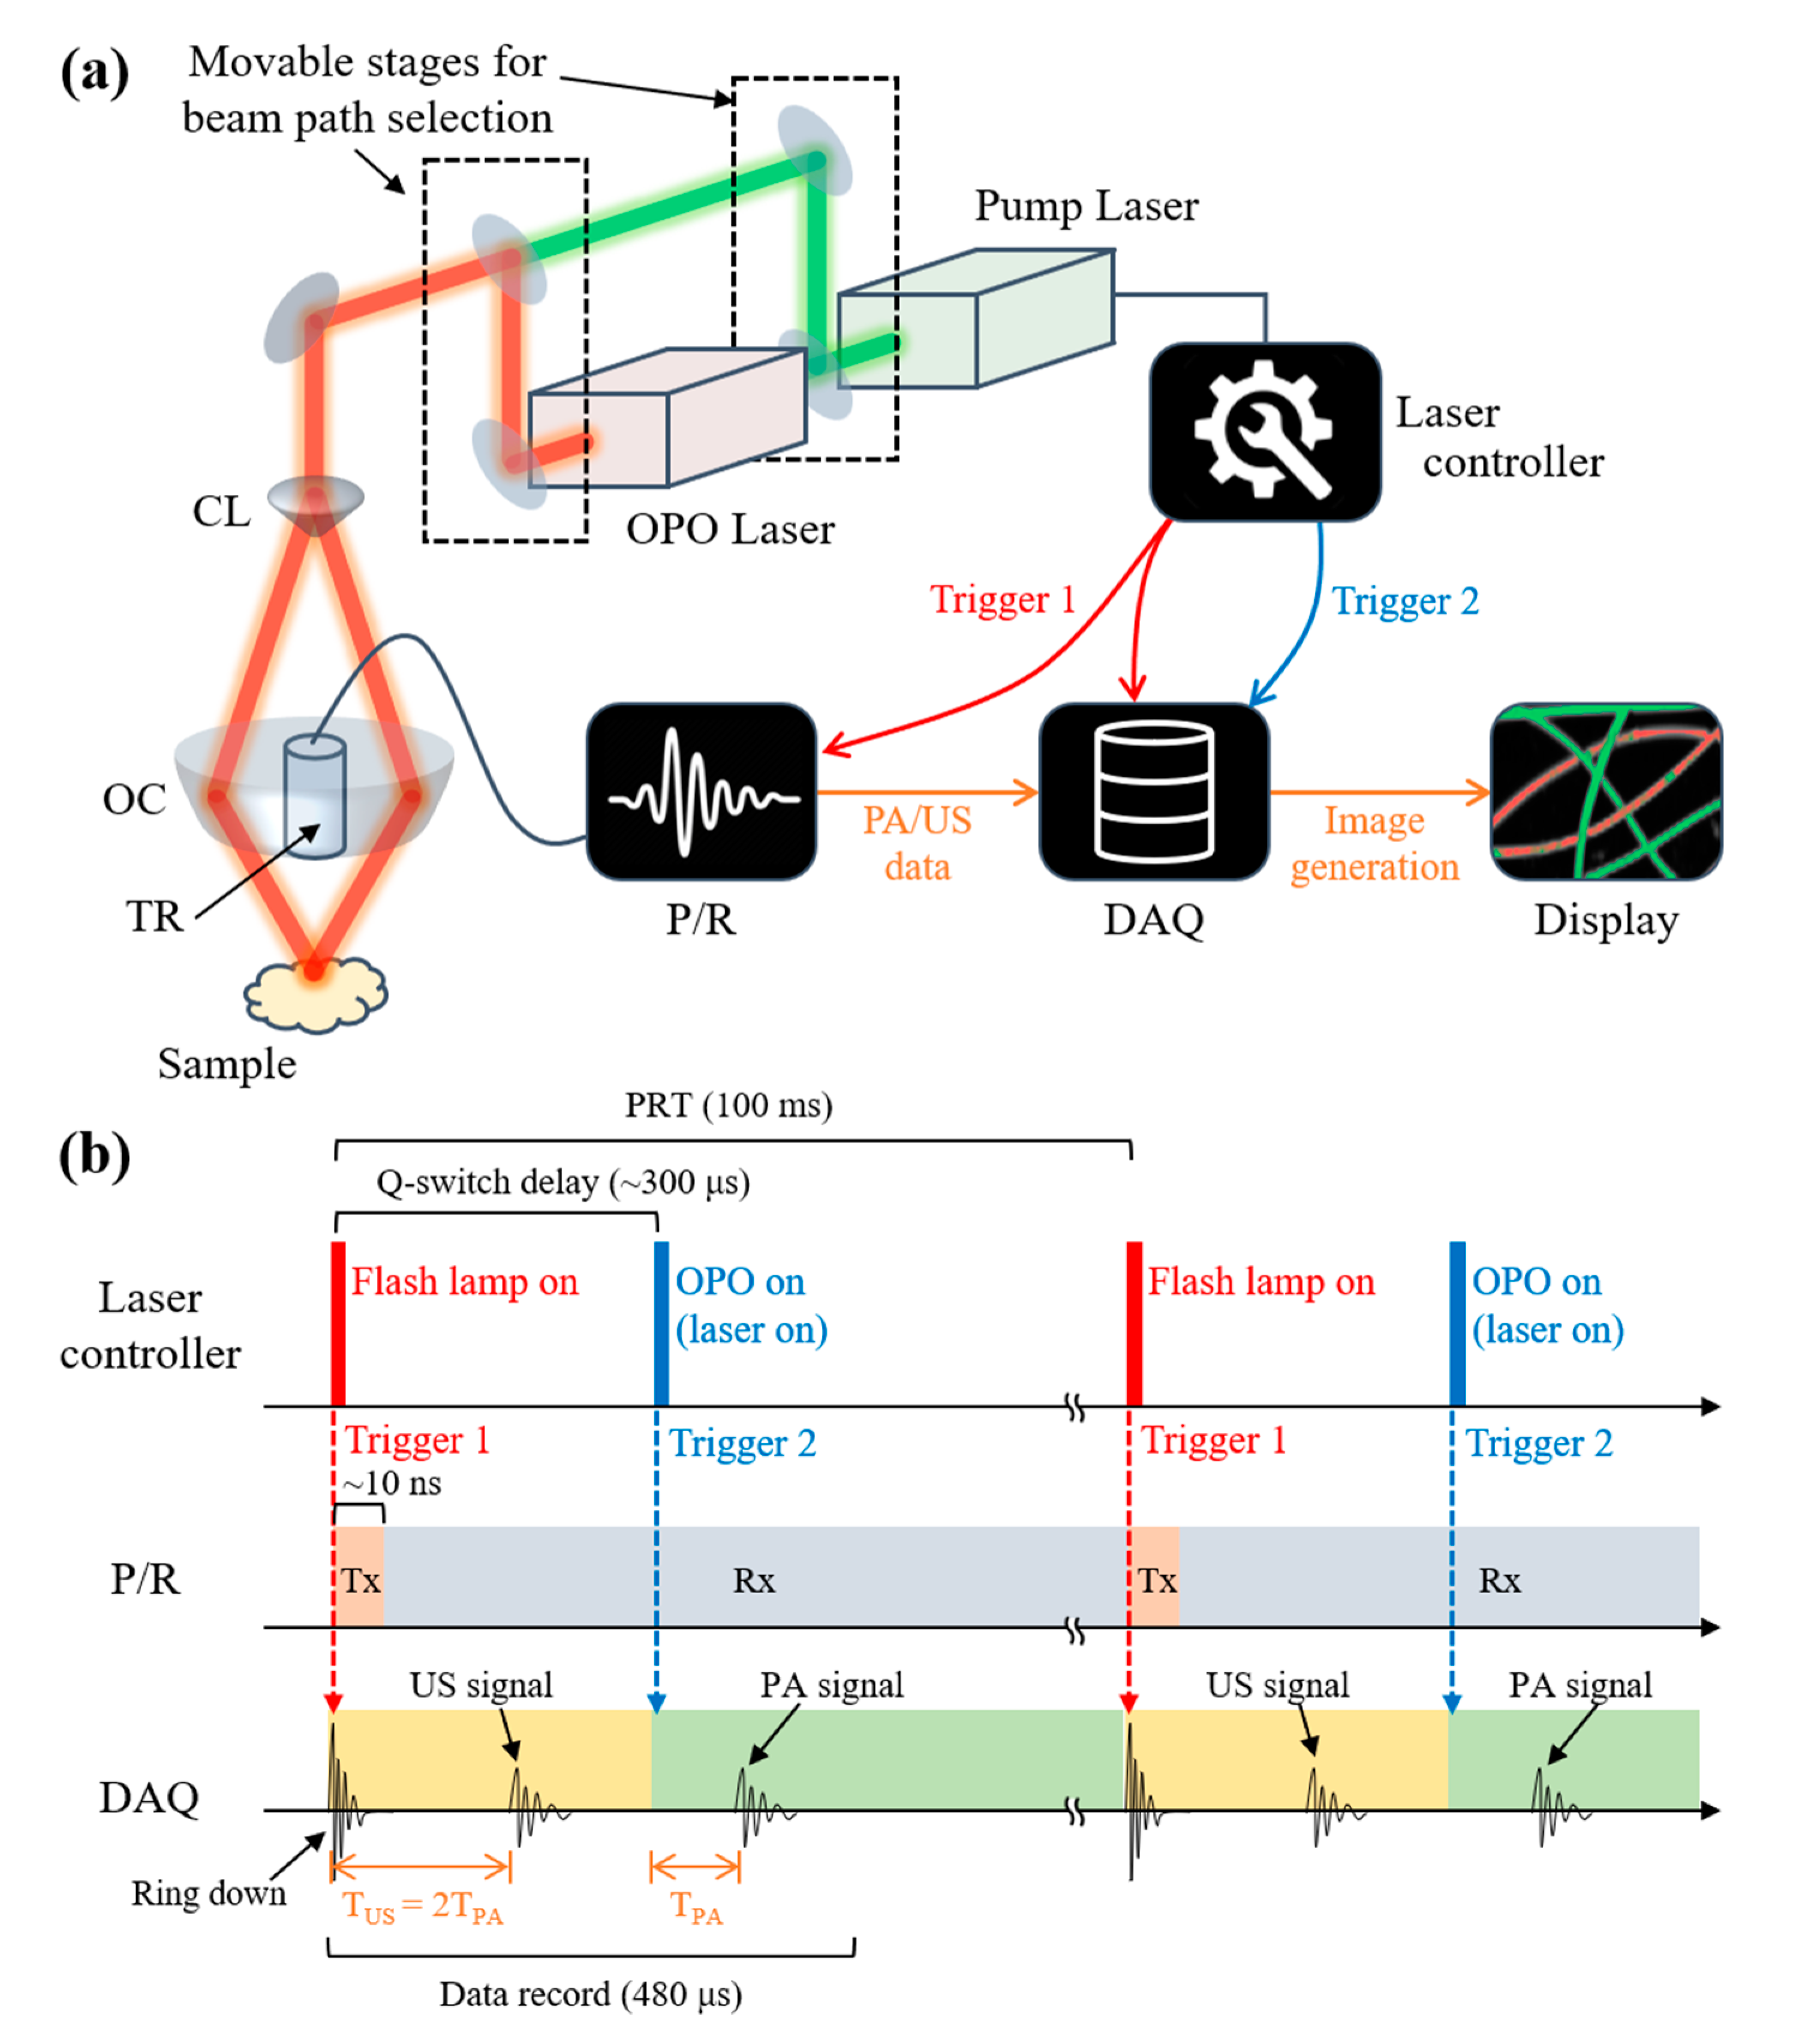
Abstract
:1. Introduction
2. Materials and Methods
2.1. Dual-Modal Photoacoustic and Ultrasound Imaging System
2.2. Resolution Test
2.3. Blood Vessel Mimicking Phantom
2.4. Animal Imaging Protocol
3. Results and Discussion
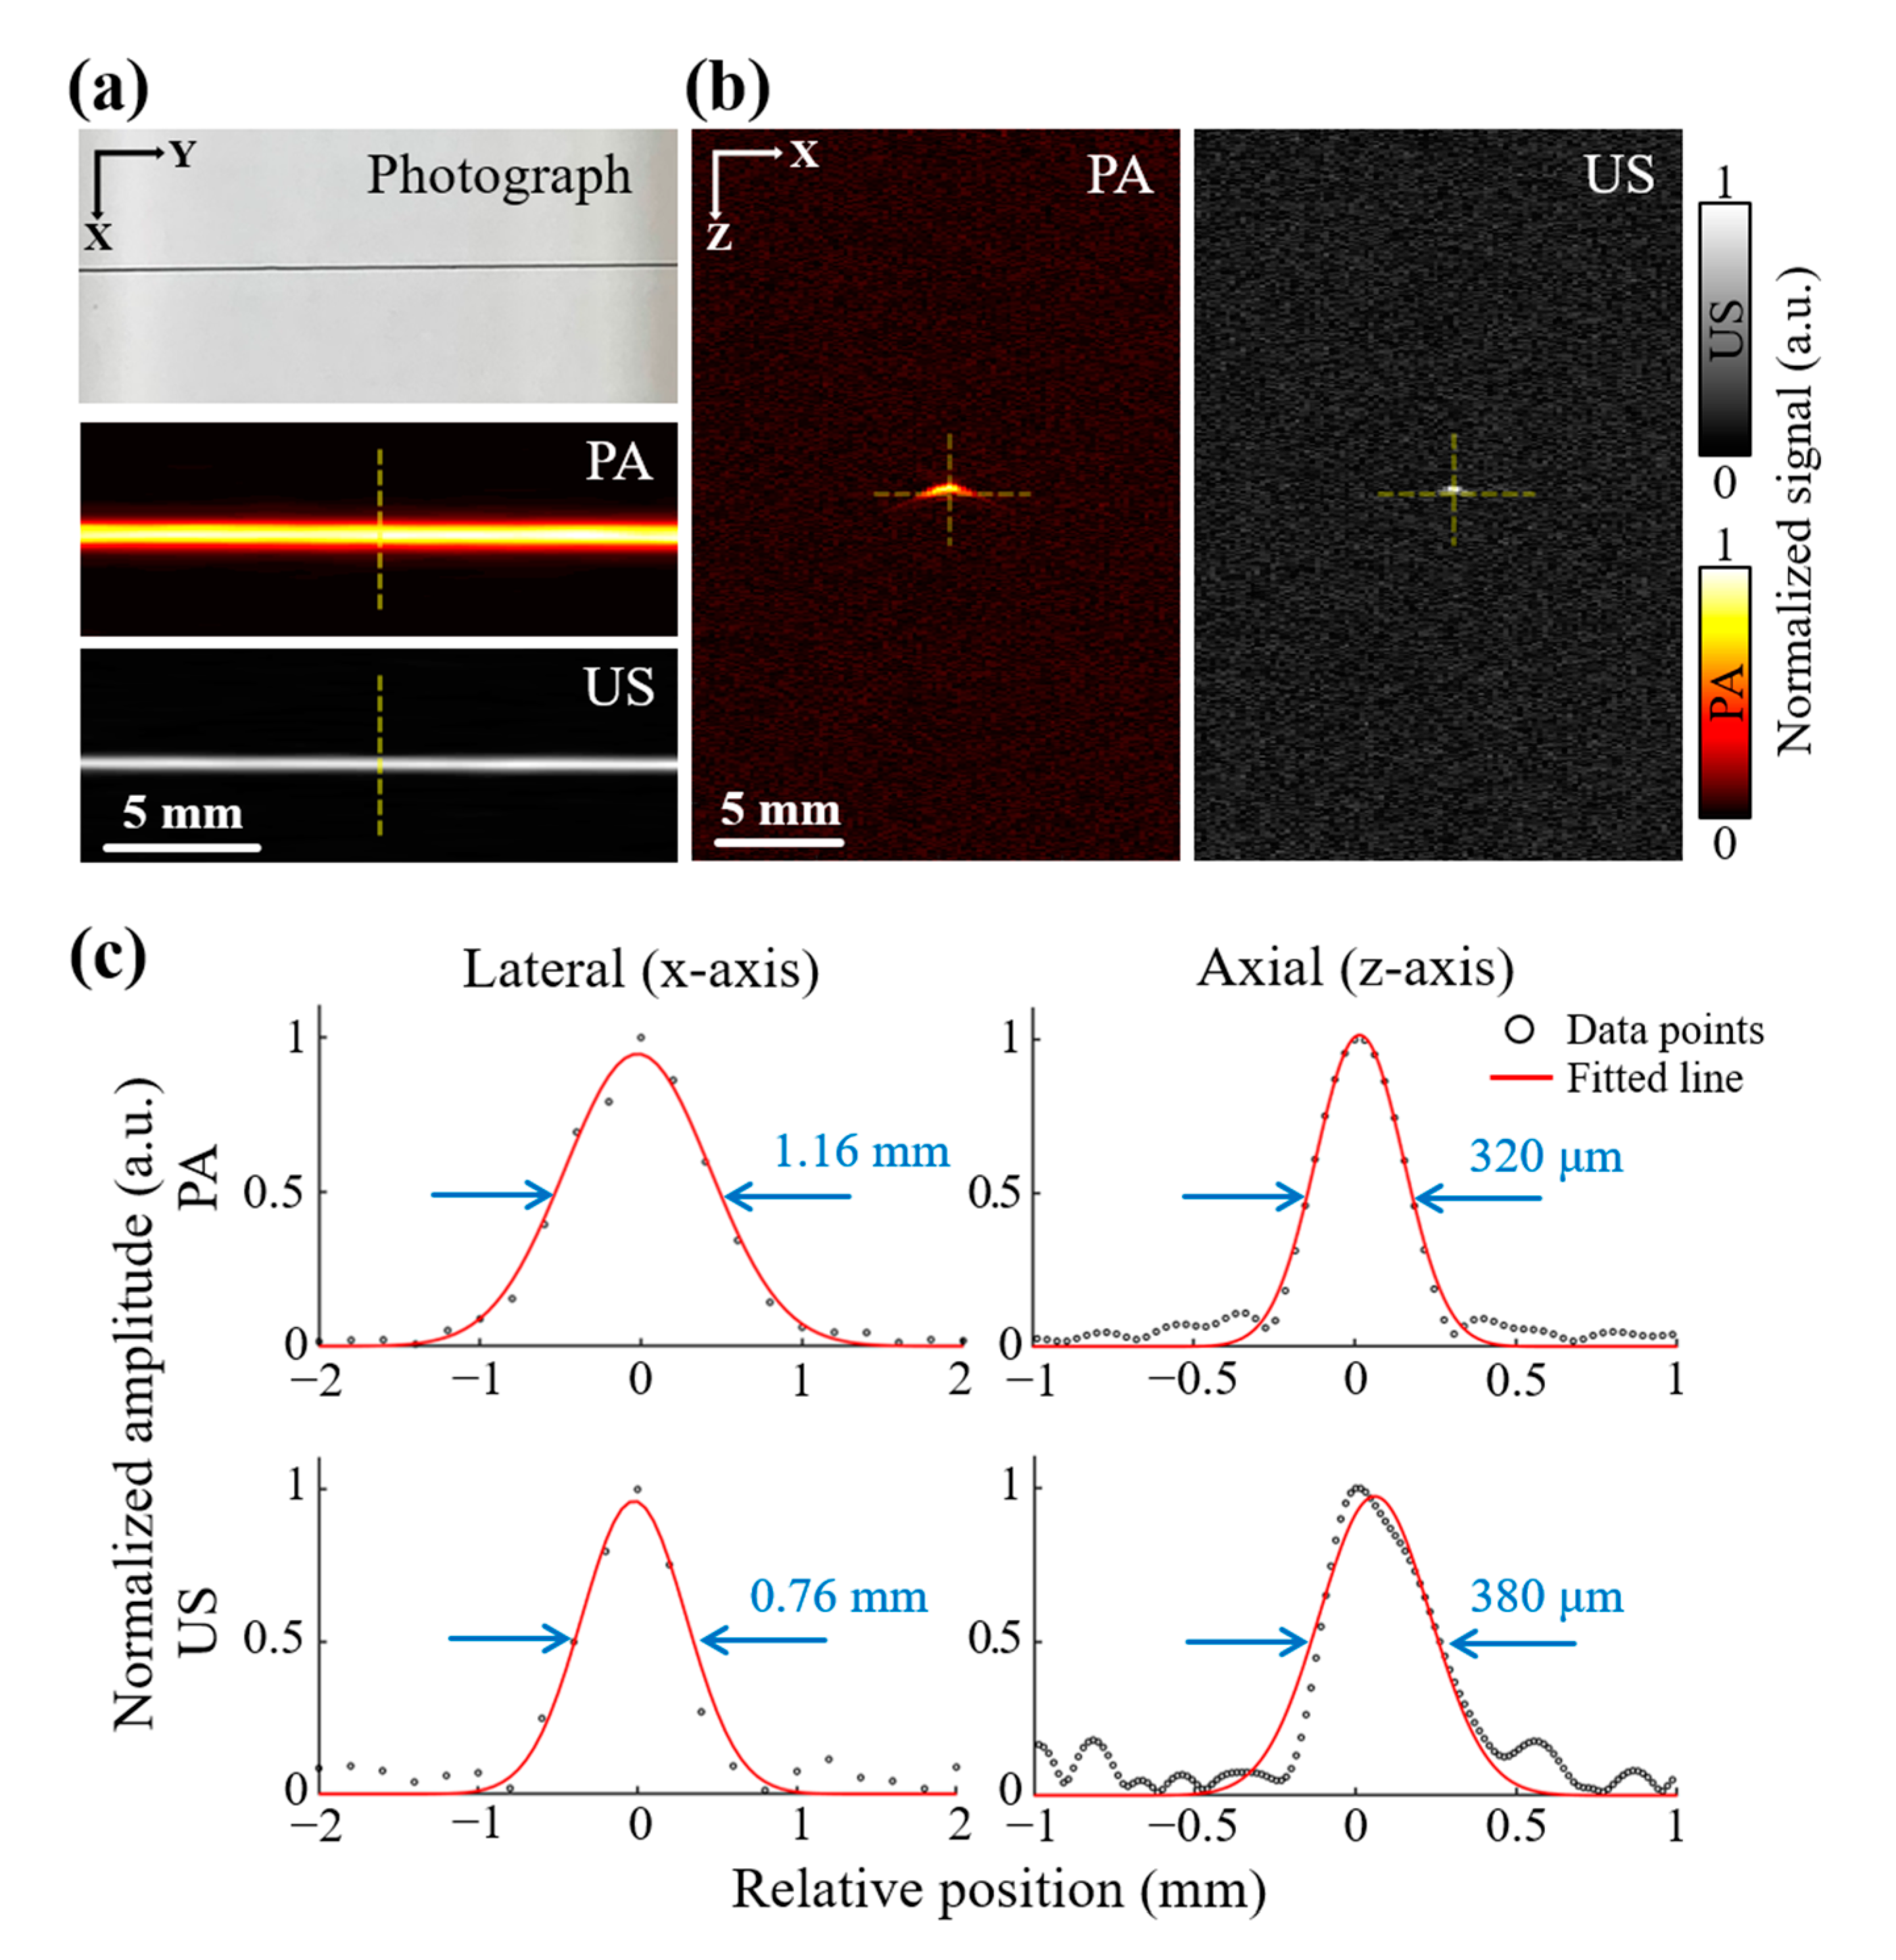
3.1. Spatial Resolution
3.2. Photoacoustic and Ultrasound Images of Blood Vessel Mimicking Phantom
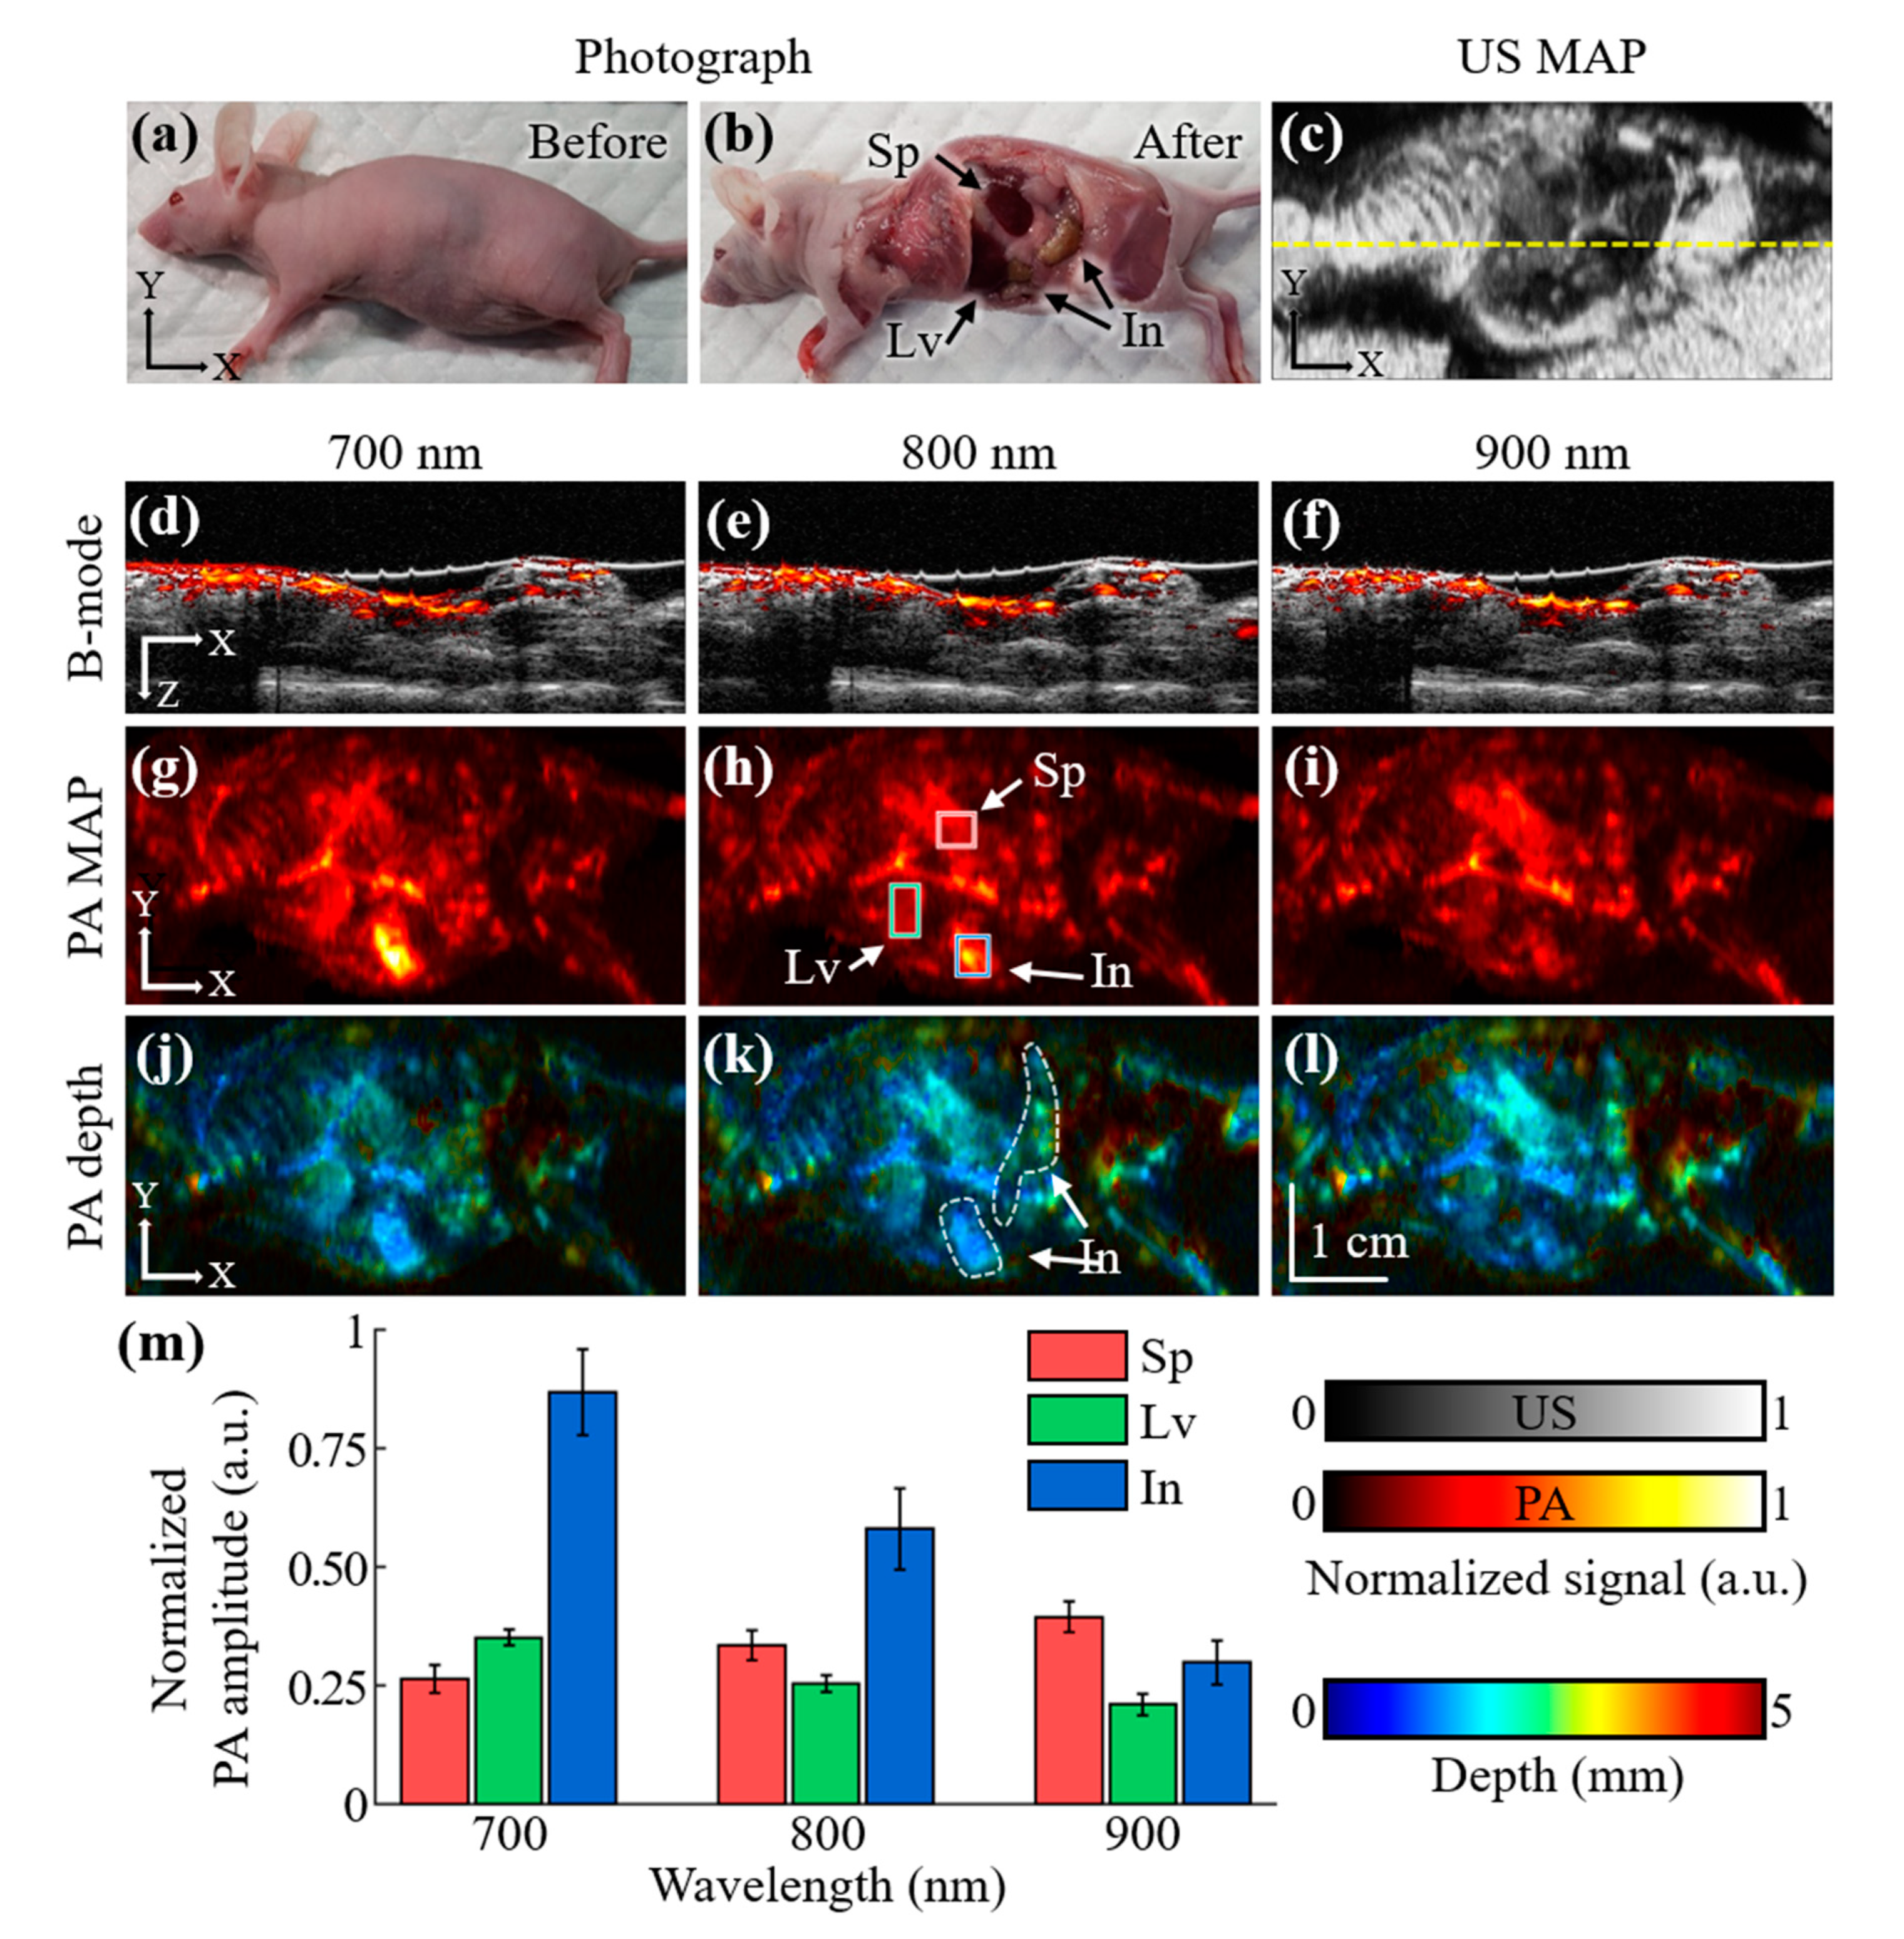
3.3. Whole-Body Photoacoustic and Ultrasound Images of Small Animals In Vivo
4. Conclusions
Supplementary Materials
Author Contributions
Funding
Institutional Review Board Statement
Informed Consent Statement
Data Availability Statement
Acknowledgments
Conflicts of Interest
References
- Bell, A.G. The photophone. Science 1880, 1, 130–131. [Google Scholar] [CrossRef] [PubMed]
- Kim, C.; Favazza, C.; Wang, L.V. In Vivo Photoacoustic Tomography of Chemicals: High-Resolution Functional and Molecular Optical Imaging at New Depths. Chem. Rev. 2010, 110, 2756–2782. [Google Scholar] [CrossRef] [PubMed] [Green Version]
- Chitgupi, U.; Nyayapathi, N.; Kim, J.; Wang, D.; Sun, B.; Li, C.; Carter, K.; Huang, W.C.; Kim, C.; Xia, J. Surfactant-Stripped Micelles for NIR-II Photoacoustic Imaging through 12 cm of Breast Tissue and Whole Human Breasts. Adv. Mater. 2019, 31, 1902279. [Google Scholar] [CrossRef] [PubMed]
- Kim, J.; Park, S.; Lee, C.; Kim, J.Y.; Kim, C. Organic Nanostructures for Photoacoustic Imaging. ChemNanoMat 2015, 2, 156–166. [Google Scholar] [CrossRef]
- Lee, C.; Kim, J.; Zhang, Y.; Jeon, M.; Liu, C.; Song, L.; Lovell, J.F.; Kim, C. Dual-color photoacoustic lymph node imaging using nanoformulated naphthalocyanines. Biomaterials 2015, 73, 142–148. [Google Scholar] [CrossRef]
- Jung, H.; Park, S.; Gunassekaran, G.R.; Jeon, M.; Cho, Y.-E.; Baek, M.-C.; Park, J.Y.; Shim, G.; Oh, Y.-K.; Kim, I.-S.; et al. A Peptide Probe Enables Pphotoacoustic-Guided Imaging and Drug Delivery to Lung Tumors in K-rasLA2 Mutant Mice. Cancer Res. 2019, 79, 4271–4282. [Google Scholar] [CrossRef] [Green Version]
- Zhang, Y.; Jeon, M.; Rich, L.J.; Hong, H.; Geng, J.; Zhang, Y.; Shi, S.; Barnhart, T.E.; Alexandridis, P.; Huizinga, J.D. Non-Invasive Multimodal Functional Imaging of the Intestine with Frozen Micellar Naphthalocyanines. Nat. Nanotechnol. 2014, 9, 631–638. [Google Scholar] [CrossRef]
- Jeon, S.; Kim, J.; Lee, D.; Woo, B.J.; Kim, C. Review on practical photoacoustic microscopy. Photoacoustics 2019, 15, 100141. [Google Scholar] [CrossRef]
- Kim, J.; Kim, J.Y.; Jeon, S.; Baik, J.W.; Cho, S.H.; Kim, C. Super-resolution localization photoacoustic microscopy using intrinsic red blood cells as contrast absorbers. Light Sci. Appl. 2019, 8, 1–11. [Google Scholar] [CrossRef]
- Jeon, S.; Song, H.B.; Kim, J.; Lee, B.J.; Managuli, R.; Kim, J.H.; Kim, J.H.; Kim, C. In vivo photoacoustic imaging of anterior ocular vasculature: A random sample consensus approach. Sci. Rep. 2017, 7, 1–9. [Google Scholar]
- Park, E.-Y.; Lee, D.; Lee, C.; Kim, C. Non-Ionizing Label-Free Photoacoustic Imaging of Bones. IEEE Access 2020, 8, 160915–160920. [Google Scholar] [CrossRef]
- Upputuri, P.K.; Pramanik, M. Performance characterization of low-cost, high-speed, portable pulsed laser diode photoacoustic tomography (PLD-PAT) system. Biomed. Opt. Express 2015, 6, 4118–4129. [Google Scholar] [CrossRef] [PubMed] [Green Version]
- Upputuri, P.K.; Pramanik, M. Dynamic in vivo imaging of small animal brain using pulsed laser diode-based photoacoustic tomography system. J. Biomed. Opt. 2017, 22, 090501. [Google Scholar] [CrossRef] [PubMed]
- Kim, J.; Park, S.; Jung, Y.; Chang, S.; Park, J.; Zhang, Y.; Lovell, J.F.; Kim, C. Programmable Real-time Clinical Photoacoustic and Ultrasound Imaging System. Sci. Rep. 2016, 6, 35137. [Google Scholar] [CrossRef] [PubMed] [Green Version]
- Kim, J.; Park, E.-Y.; Park, B.; Choi, W.; Lee, K.J.; Kim, C. Towards Clinical Photoacoustic and Ultrasound Imaging: Probe Improvement and Real-Time Graphical User Interface. Exp. Biol. Med. 2020, 245, 321–329. [Google Scholar] [CrossRef] [PubMed]
- Steinberg, I.; Huland, D.M.; Vermesh, O.; Frostig, H.E.; Tummers, W.S.; Gambhir, S.S. Photoacoustic Clinical Imaging. Photoacoustics 2019, 14, 77–98. [Google Scholar] [CrossRef]
- Choi, W.; Park, E.-Y.; Jeon, S.; Kim, C. Clinical photoacoustic imaging platforms. Biomed. Eng. Lett. 2018, 8, 139–155. [Google Scholar] [CrossRef]
- Jeon, S.; Park, E.-Y.; Choi, W.; Managuli, R.; Jong Lee, K.; Kim, C. Real-time delay-multiply-and-sum beamforming with coherence factor for in vivo clinical photoacoustic imaging of humans. Photoacoustics 2019, 15, 100136. [Google Scholar] [CrossRef]
- Merčep, E.; Deán-Ben, X.L.; Razansky, D. Combined pulse-echo ultrasound and multispectral optoacoustic tomography with a multi-segment detector array. IEEE Trans. Med Imaging 2017, 36, 2129–2137. [Google Scholar] [CrossRef]
- Kothapalli, S.-R.; Sonn, G.A.; Choe, J.W.; Nikoozadeh, A.; Bhuyan, A.; Park, K.K.; Cristman, P.; Fan, R.; Moini, A.; Lee, B.C.; et al. Simultaneous transrectal ultrasound and photoacoustic human prostate imaging. Sci. Transl. Med. 2019, 11, eaav2169. [Google Scholar] [CrossRef]
- Kim, J.; Kim, Y.H.; Park, B.; Seo, H.M.; Bang, C.H.; Park, G.S.; Park, Y.M.; Rhie, J.W.; Lee, J.H.; Kim, C. Multispectral Ex Vivo Photoacoustic Imaging of Cutaneous Melanoma for Better Selection of the Excision Margin. Br. J. Dermatol. 2018, 179, 780–782. [Google Scholar] [CrossRef] [PubMed]
- Park, B.; Bang, C.H.; Lee, C.; Han, J.H.; Choi, W.; Kim, J.; Park, G.S.; Rhie, J.W.; Lee, J.H.; Kim, C. 3D Wide-field Multispectral Photoacoustic Imaging of Human Melanomas In Vivo: A Pilot Study. J. Eur. Acad. Dermatol. Venereol. 2020. [Google Scholar] [CrossRef] [PubMed]
- Choi, W.; Oh, D.; Kim, C. Practical photoacoustic tomography: Realistic limitations and technical solutions. J. Appl. Phys. 2020, 127, 230903. [Google Scholar] [CrossRef]
- Lee, C.; Choi, W.; Kim, J.; Kim, C. Three-dimensional clinical handheld photoacoustic/ultrasound scanner. Photoacoustics 2020, 18, 100173. [Google Scholar] [CrossRef] [PubMed]
- Singh, M.K.A.; Sato, N.; Ichihashi, F.; Sankai, Y. Real-time improvement of LED-based photoacoustic image quality using intermittent pulse echo acquisitions. Proc. SPIE 2020. [Google Scholar] [CrossRef]
- Kim, C.; Qin, R.; Xu, J.S.; Wang, L.V.; Xu, R. Multifunctional microbubbles and nanobubbles for photoacoustic and ultrasound imaging. J. Biomed. Opt. 2010, 15, 010510–010513. [Google Scholar] [CrossRef]
- Park, B.; Lee, K.M.; Park, S.; Yun, M.; Choi, H.-J.; Kim, J.; Lee, C.; Kim, H.; Kim, C. Deep tissue photoacoustic imaging of nickel (II) dithiolene-containing polymeric nanoparticles in the second near-infrared window. Theranostics 2020, 10, 2509. [Google Scholar] [CrossRef]
- Park, S.; Park, G.; Kim, J.; Choi, W.; Jeong, U.; Kim, C. Bi2Se3 nanoplates for contrast-enhanced photoacoustic imaging at 1064 nm. Nanoscale 2018, 10, 20548–20558. [Google Scholar] [CrossRef]
- Francis, K.J.; Booijink, R.; Bansal, R.; Steenbergen, W. Tomographic Ultrasound and LED-Based Photoacoustic System for Preclinical Imaging. Sensors 2020, 20, 2793. [Google Scholar] [CrossRef]
- Singh, M.K.A. LED-Based Photoacoustic Imaging: From Bench to Bedside; Springer Nature: Berlin/Heidelberg, Germany, 2020. [Google Scholar]
- Needles, A.; Heinmiller, A.; Sun, J.; Theodoropoulos, C.; Bates, D.; Hirson, D.; Yin, M.; Foster, F.S. Development and initial application of a fully integrated photoacoustic micro-ultrasound system. IEEE Trans. Ultrason. Ferroelectr. Freq. Control 2013, 60, 888–897. [Google Scholar] [CrossRef]
- Forbrich, A.; Heinmiller, A.; Zemp, R.J. Photoacoustic imaging of lymphatic pumping. J. Biomed. Opt. 2017, 22, 106003. [Google Scholar] [CrossRef] [PubMed]
- Lakshman, M.; Needles, A. Screening and quantification of the tumor microenvironment with micro-ultrasound and photoacoustic imaging. Nat. Methods 2015, 12, III–V. [Google Scholar] [CrossRef]
- Paproski, R.J.; Forbrich, A.; Huynh, E.; Chen, J.; Lewis, J.D.; Zheng, G.; Zemp, R.J. Porphyrin nanodroplets: Sub-micrometer ultrasound and photoacoustic contrast imaging agents. Small 2016, 12, 371–380. [Google Scholar] [CrossRef] [PubMed]
- Langhout, G.C.; Grootendorst, D.J.; Nieweg, O.E.; Wouters, M.W.J.M.; van der Hage, J.A.; Jose, J.; van Boven, H.; Steenbergen, W.; Manohar, S.; Ruers, T.J.M. Detection of melanoma metastases in resected human lymph nodes by noninvasive multispectral photoacoustic imaging. Int. J. Biomed. Imaging 2014, 2014. [Google Scholar] [CrossRef]
- Harrison, T.; Ranasinghesagara, J.C.; Lu, H.; Mathewson, K.; Walsh, A.; Zemp, R.J. Combined photoacoustic and ultrasound biomicroscopy. Opt. Express 2009, 17, 22041–22046. [Google Scholar] [CrossRef]
- Wang, Y.; Xu, D.; Yang, S.; Xing, D. Toward in vivo biopsy of melanoma based on photoacoustic and ultrasound dual imaging with an integrated detector. Biomed. Opt. Express 2016, 7, 279–286. [Google Scholar] [CrossRef] [Green Version]
- Jeon, M.; Kim, J.; Kim, C. Multiplane spectroscopic whole-body photoacoustic imaging of small animals in vivo. Med. Biol. Eng. Comput. 2014, 54, 283–294. [Google Scholar] [CrossRef]
- Cho, S.; Baik, J.; Managuli, R.; Kim, C. 3D PHOVIS: 3D photoacoustic visualization studio. Photoacoustics 2020, 18, 100168. [Google Scholar] [CrossRef]


Publisher’s Note: MDPI stays neutral with regard to jurisdictional claims in published maps and institutional affiliations. |
© 2021 by the authors. Licensee MDPI, Basel, Switzerland. This article is an open access article distributed under the terms and conditions of the Creative Commons Attribution (CC BY) license (http://creativecommons.org/licenses/by/4.0/).
Share and Cite
Park, E.-Y.; Park, S.; Lee, H.; Kang, M.; Kim, C.; Kim, J. Simultaneous Dual-Modal Multispectral Photoacoustic and Ultrasound Macroscopy for Three-Dimensional Whole-Body Imaging of Small Animals. Photonics 2021, 8, 13. https://0-doi-org.brum.beds.ac.uk/10.3390/photonics8010013
Park E-Y, Park S, Lee H, Kang M, Kim C, Kim J. Simultaneous Dual-Modal Multispectral Photoacoustic and Ultrasound Macroscopy for Three-Dimensional Whole-Body Imaging of Small Animals. Photonics. 2021; 8(1):13. https://0-doi-org.brum.beds.ac.uk/10.3390/photonics8010013
Chicago/Turabian StylePark, Eun-Yeong, Sinyoung Park, Haeni Lee, Munsik Kang, Chulhong Kim, and Jeesu Kim. 2021. "Simultaneous Dual-Modal Multispectral Photoacoustic and Ultrasound Macroscopy for Three-Dimensional Whole-Body Imaging of Small Animals" Photonics 8, no. 1: 13. https://0-doi-org.brum.beds.ac.uk/10.3390/photonics8010013