Article

Three-Dimensional Mapping of Retrograde Multi-Labeled Motor Neuron Columns in the Spinal Cord

1
Britton Chance Center for Biomedical Photonics, Wuhan National Laboratory for Optoelectronics, Huazhong University of Science and Technology, Wuhan 430074, China
2
MoE Key Laboratory for Biomedical Photonics, School of Engineering Sciences, Huazhong University of Science and Technology, Wuhan 430074, China
3
Department of Trauma and Orthopaedics, Peking University People’s Hospital, Beijing 100044, China
*
Authors to whom correspondence should be addressed.
These authors contributed equally to this work.
Submission received: 17 March 2021 / Revised: 17 April 2021 / Accepted: 25 April 2021 / Published: 28 April 2021
(This article belongs to the Special Issue Tissue Optics)

Abstract

:
The quantification and distribution characteristics of spinal motor neurons play important roles in the study of spinal cord and peripheral nerve injury and repair. In most research, the sole retrograde labeling of each nerve or muscle could not simultaneously obtain the distributions of different motor neuron subpopulations. Therefore, it did not allow mapping of spatial relationships of different motor neuron columns for disclosing the functional relationship of different nerve branches. Here, we combined the multiple retrograde labeling, optical clearing, and imaging for three-dimensional (3D) visualization of motor neurons of multiple brachial plexus branches. After screening fluorescent tracers by the labeling feasibility of motor neurons and fluorescence compatibility with optical clearing, we performed mapping and quantification of the motor neurons of ulnar, median, and radial nerves in the spinal cord, then disclosed the relative spatial distribution among different neuronal subpopulations. This work will provide valuable mapping data for the understanding of the functional relationships among brachial plexus branches, hopefully facilitating the study of regeneration of axons and remodeling of motor neurons in peripheral nerve repair.

1. Introduction

Spinal cord and peripheral nerve injuries are common and intractable clinical diseases, leading to severe sensory or motor dysfunction [1,2,3]. Despite some advanced microsurgical techniques involving nerve suture and grafting being developed and many efforts for promoting nerve regeneration [4,5], the functional outcomes of the therapeutic interventions are often unsatisfactory. While the survival and growth potential of neurons are large prerequisites for nerve repair and regeneration, the quantitation of spinal motor neurons regenerating across the injury site is an essential parameter for assessing regeneration in the study of spinal cord [6,7] and peripheral nerve injury and repair [8,9,10].
Retrograde tracing techniques were commonly used to obtain motor neurons’ distribution and demonstrated the connective relationship between the spinal cord and innervating targets [11,12,13,14,15,16,17]. So far, most previous studies revealed the topographical organization between innervated targets and motor neuron columns based on the sole labeling of each nerve or muscle [18,19,20,21,22,23,24,25]. However, nerve injury is often a complex and multifaceted condition involving multiple nerve branches or muscles [26]. Clinically, the source of proximal donor nerve is limited for severe peripheral nerve, and thus a nearby tiny nerve is often used to repair a big one or several distal damaged nerves at the same time. A very famous example is transferring contralateral C7 nerve root to repair the total brachial plexus on the injured side [27,28]. In this situation, the distribution of individual motor neuron columns obtained based on the sole labeling cannot simultaneously reflect the changes between different motor neuron columns. Hence, the mapping of the spatial relationship of different motor neuron subpopulations will help disclose the functional relationship (e.g., synergism and antagonism) of different nerve branches. It is necessary to study the distributions and spatial relationships of the motor neurons innervating different nerves.
Traditional histological methods involving sectioning, imaging, and subsequent image analysis were commonly used to observe the labeled spinal motor neurons. However, this approach is time-consuming and labor-intensive [23,25], making it difficult to obtain the complete and accurate spatial distribution of motor neurons due to the tissue slices’ loss or deformation. In recent years, various tissue optical clearing techniques have been developed for 3D imaging of intact tissues with optical sectioning [29,30], such as 3DISCO [31,32], uDISCO [33], ScaleS [34], CUBIC [35], CLARITY [36], PEGASOS [37], vDISCO [38], and MACS [39]. Thereinto, 3DISCO is a typical clearing method that enables rapid and high-performance clearing of mouse spinal cord [29,40,41] and has been applied for visualization of neural structures in various tissues [42,43,44]. Žygelytė E et al. described an optical clearing method based on the 3DISCO method, RetroDISCO, which allowed clearing of intact mouse spinal cord for imaging of retrograde labeled cells via confocal microscopy. It provided an alternative for analyzing the distribution characteristics of motor neurons and avoided labor-intensive cryosectioning and potential double-counting of motor neurons [45]. However, they only labeled the sciatic nerve with Fluoro-Ruby and did not conduct mapping studies using multiple labels to simultaneously obtain the spatial distribution of different motor neuron columns.
In this study, we combined multiple retrograde labeling, optical clearing, and optical imaging to simultaneously obtain the 3D distribution of motor neurons innervating different brachial plexus branches of the forelimb, mapping the spatial relationships between the motor neurons innervating different nerves. First, we screened the fluorescent tracers for retrograde labeling of neurons by labeling feasibility and fluorescence compatibility with the 3DISCO clearing method. Then, we performed the multi-labeling and 3D imaging of motor neurons of ulnar, median, and radial nerves, analyzed their distribution characteristics in different spinal cord segments, and disclosed the relative spatial distribution among different neuronal subpopulations.

2. Materials and Methods

2.1. Animals

Thirty-seven adult female C57BL/6J mice (8–10 weeks old) weighing 20 ± 2 g were obtained from Beijing Vital River Laboratory Animal Technology Co., Ltd., and raised in Experimental Animals Center of Peking University, People’s Hospital. Animals were kept on a cycle of 12 h (light)/12 h (dark) and allowed free access to food and water. Efforts were made to minimize the animals’ pain and discomfort.

2.2. Fluorescent Tracers

All fluorescent tracers used here were prepared in their optimum concentrations: 4% Fluor-Gold (FG) (Fluorochrome, Denver, CO, USA), 10% Fluoro-Emerald (FE) (D1820, Invitrogen, Carlsbad, CA, USA) in saline, 10% Fluoro-Ruby (FR) (D1817, Invitrogen, Carlsbad, CA, USA) in saline, 1% Cholera Toxin Subunit B conjugated with Alexa Fluor 488 (CTB-A488) (C22841, Invitrogen, Carlsbad, CA, USA) in 0.01 M PBS, 1% Cholera Toxin Subunit B conjugated with Alexa Fluor 647 (CTB-A647) (C34778, Invitrogen, Carlsbad, CA, USA) in 0.01 M PBS, Green retrobeads (GB) (LumaFluor Inc, Naples, FL, USA) used directly, Red retrobeads (RB) (LumaFluor Inc, Naples, FL, USA) used directly.

2.3. Retrograde Tracing

Surgical operations were performed under specific pathogen-free (SPF) laboratory conditions. Mice were anesthetized and maintained with isoflurane. The left forelimb was shaved and sterilized. The brachial plexus was exposed above the chelidon level, and the individual ulnar, radial, and median nerves were transected at this level. To evaluate the labeling efficiency and fluorescence compatibility of the tracers with optical clearing (Figure 1A), the median nerve was labeled with the retrograde tracers (FE, FR, FG, CTB-A488, CTB-A647, GB, and RB), respectively. For the multi-labeling of the nerves in the brachial plexus, FE, FR, and CTB-647 were randomly used. The proximal nerve stump was immersed into a polyethylene tube filled with 1.5–2.0 μL retrograde tracers. The top of the tube was sealed with Vaseline. After two hours, the tube was removed, and the labeled nerve stump was washed with saline sufficiently. The wound was closed using a 4-0 nylon suture routinely. During the whole procedure, the sterile saline solution was used to keep the mouse eyes hydrated, and a homeothermic pad was used to keep the mice warm. The forepaw on the surgical side was spread with picric acid. Animals were then placed back into mice cages to recover. One cup of analgesic jelly (Ready Jelly®, ReadyDietech Co., Ltd., Shenzhen, China) containing Carprofen was given by oral administration 48 h before the surgery to acclimate mice with the flavor, and one additional cup was given and continued for the 7 postoperative days.

2.4. Tissue Harvesting

One week after retrograde tracing, mice were deeply anesthetized with 2% chloral hydrate (C104202, Aladdin, Shanghai, China) and 10% urethane (30191228, Sinopharm Chemical Reagent Co., Ltd., Shanghai, China). They were perfused with saline, followed by 4% paraformaldehyde (PFA) (158127, Sigma-Aldrich, St. Louis, MO, USA). Following perfusion, cervical spinal cords segments were dissected separately. The surrounding connective tissues were removed carefully under a binocular stereoscope. The samples were post-fixed in 4% PFA overnight at 4 °C and then rinsed with 0.01 M PBS twice. For screening of fluorescent dyes, the spinal cords were embedded with agarose and then sliced into 150-μm-thick coronal sections with a vibratome (Leica VT1000, Wentzler, Germany).

2.5. Clearing Procedure

3DISCO was performed according to the literature [32]. The samples were incubated in 50%, 70%, 80%, 100%, 100% tetrahydrofuran (THF) (80124418, Sinopharm Chemical Reagent Co., Ltd., Shanghai, China) in sequence for dehydration (20 min/step for spinal cord sections (Figure 1A) and 1 h/step for unsliced spinal cord). The dehydrated samples were further incubated in dibenzyl ether (DBE) (D107584, Aladdin, Shanghai, China) until the samples become transparent. During the clearing procedure, the samples were kept away from light. Then, before the clearing process, THF and DBE were preprocessed by column absorption chromatography with basic activated aluminum oxide (20001861, Sinopharm Chemical Reagent Co., Ltd., Shanghai, China) to remove the peroxides [31].

2.6. Confocal Fluorescence Microscopy

The samples were mounted on a cover glass and imaged by an inverted confocal microscope (LSM 710, Zeiss, Oberkochen, Germany) with 405 nm diode laser exciting FG, Argon-laser exciting FE, GB and CTB-A488, 561 nm DPSS-laser exciting FR and RB, 633 nm HeNe-laser exciting CTB-A647. Plan-Apochromat 20×/0.8 objective (dry, working distance 0.55 mm) was used to imaging spinal cord sections before and after clearing for screening fluorescent dyes. Fluar 10×/0.5 objective (dry, working distance 2.0 mm) was used for the 3D imaging of unsliced cleared spinal cord.

2.7. Image Processing and Analysis

The images were processed and analyzed by ImageJ (National Institutes of Health, Bethesda, MD, USA) and Imaris software (Bitplane, Zurich, Switzerland). The 3D-rendered images and movies were visualized and captured with Imaris. The location and count of cells in the spinal cord were determined by the “Spots” function of Imaris.

2.8. Statistical Analysis

The SPSS (IBM Corp., Armonk, NY, USA) was used for statistical analysis in this work. One-way ANOVA was used to compare the differences of cell numbers corresponding to three nerve branches and the differences in cell distribution in different spinal segments. If ANOVA results were significant, the Bonferroni test for multiple comparisons was conducted. Due to the large differences of motoneuron numbers corresponding to different nerves in some spinal segments, resulting in the heterogeneity of variances and non-normal distribution, the Kruskal–Wallis test of non-parametric test was performed.

3. Results

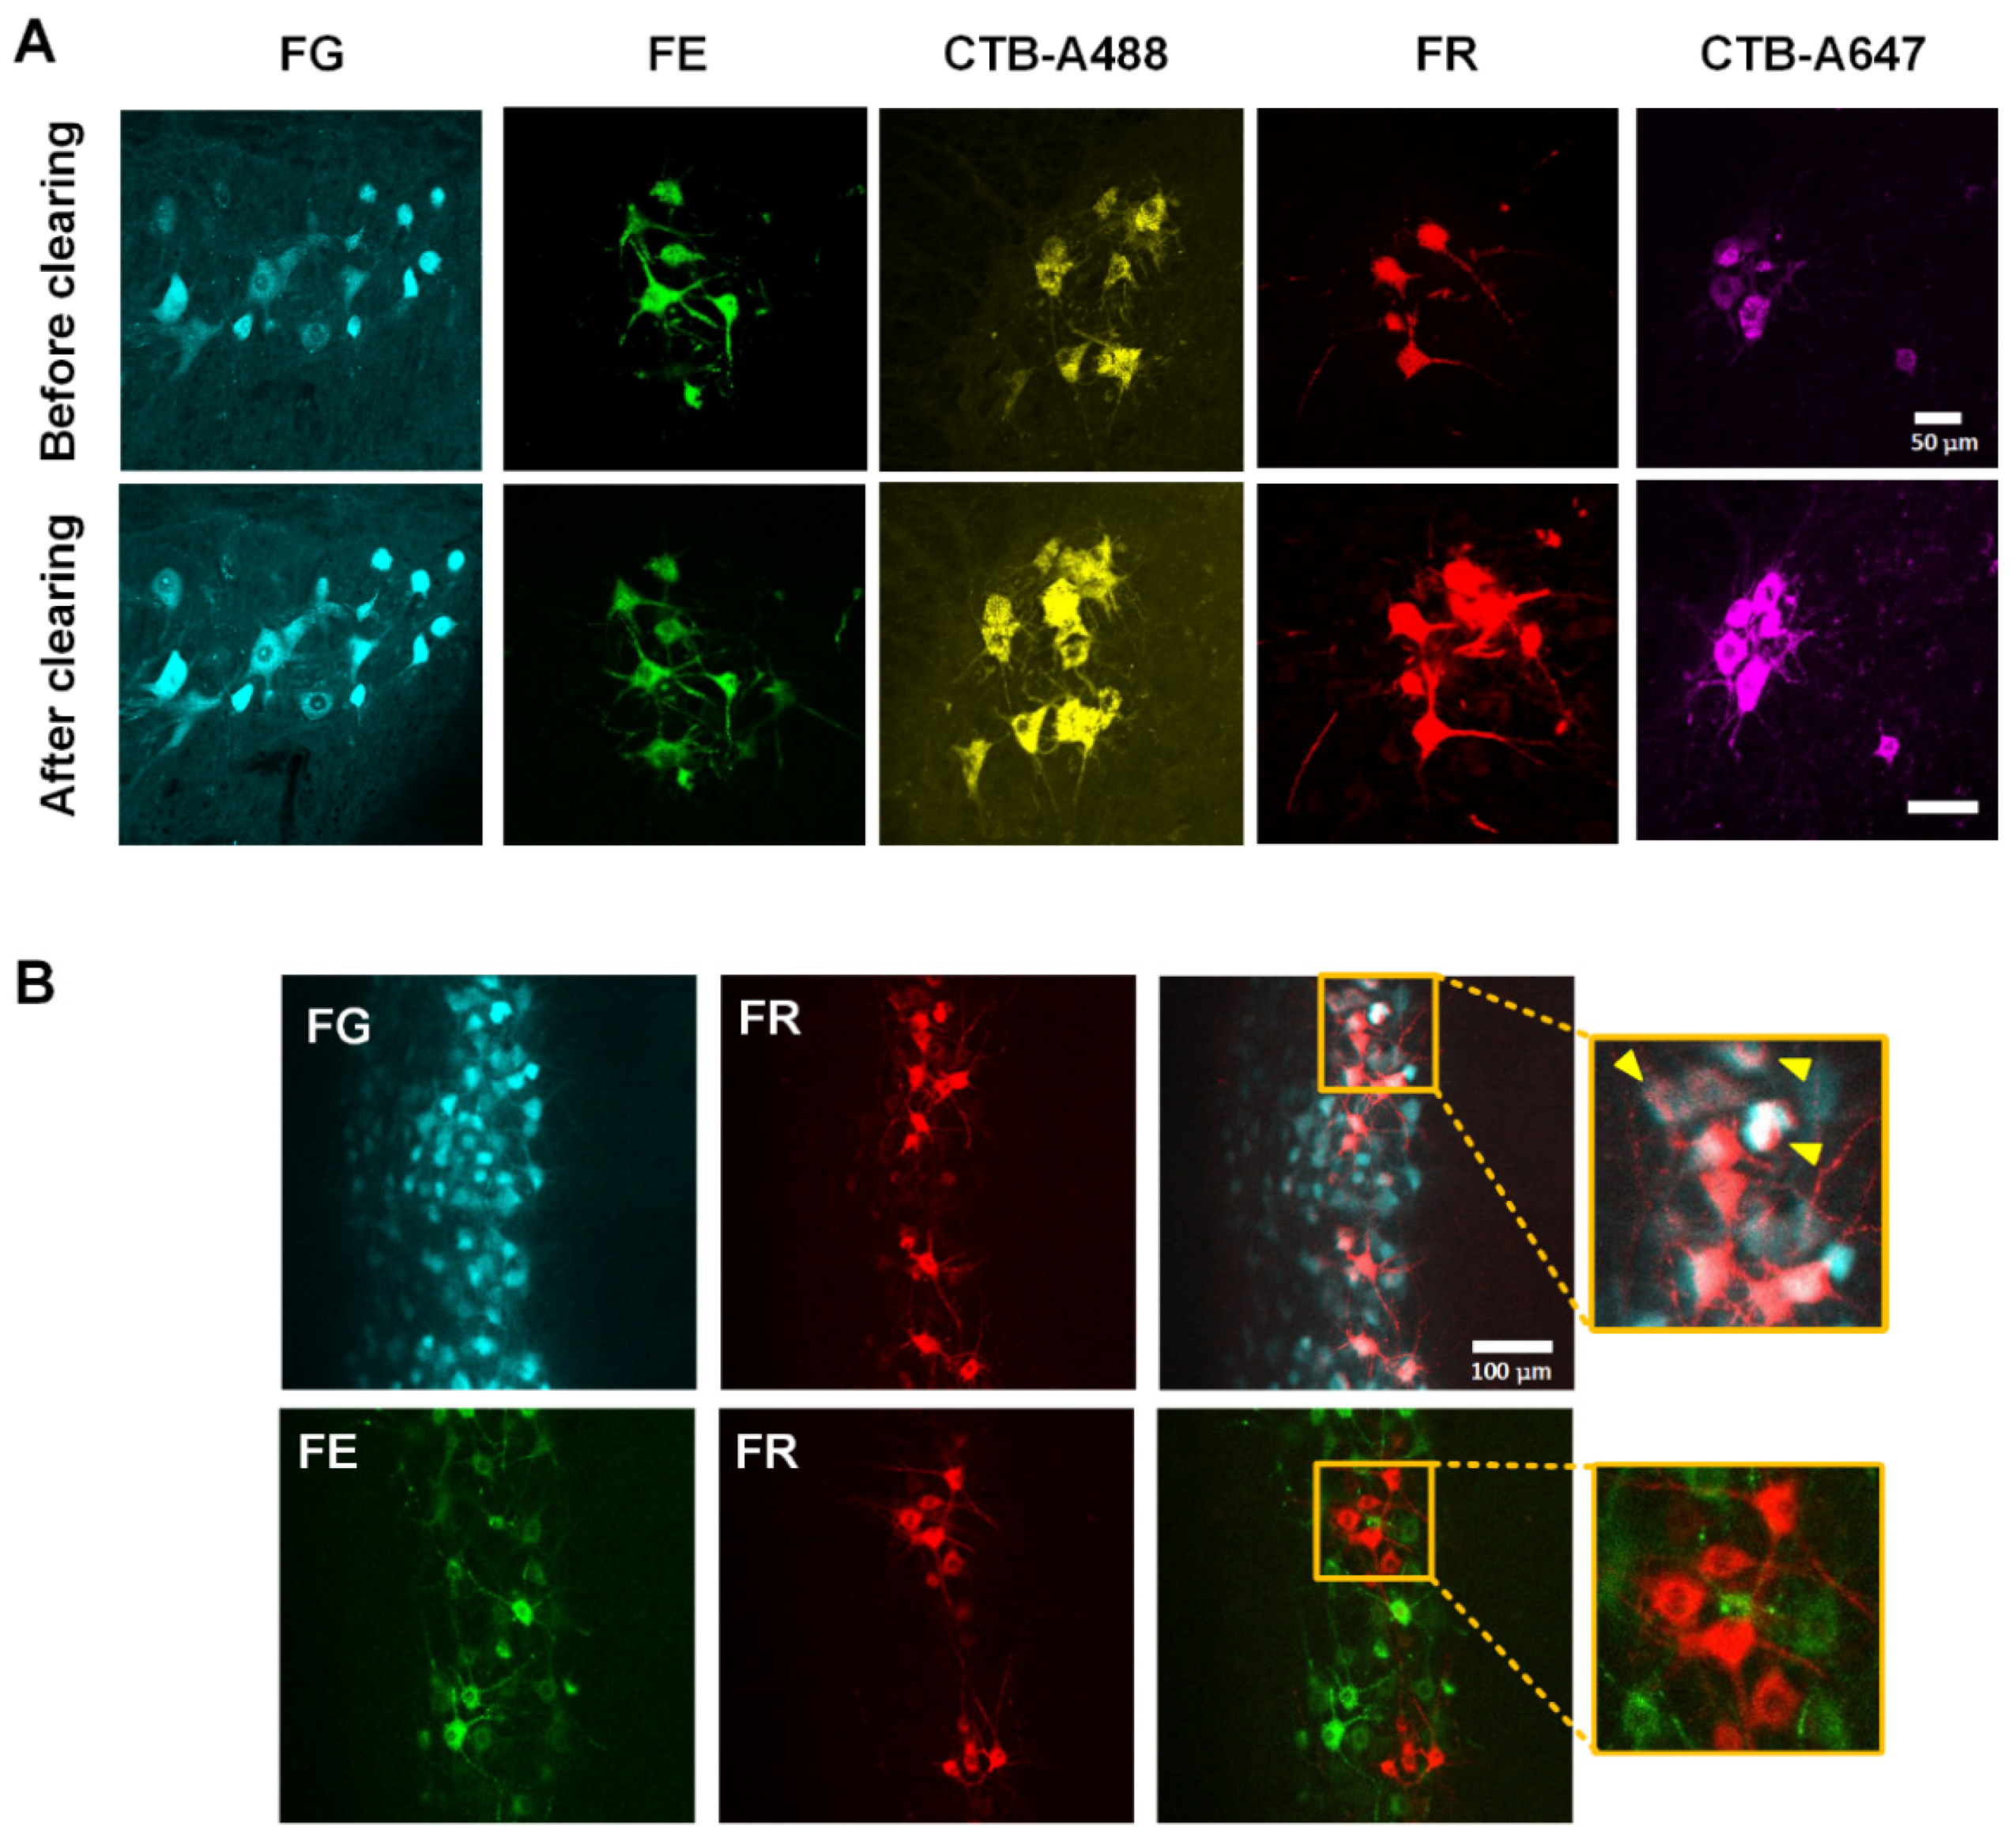
3.1. Screening of Fluorescent Dyes for Multi-Labeling of Motor Neurons

Combining with optical clearing methods and optical microscopy techniques, multi-labeling can contribute to accurately detecting relative spatial distributions among different subpopulations of motor neurons, which will help understand the functional relationship among motor neuron columns.
Here, seven commonly used retrograde dyes (FE, FR, FG, CTB-A488, CTB-A647, GB, and RB) with different excitation and emission wavelengths were selected to test the labeling effectiveness and compatibility with the optical clearing method (Table 1).
We labeled median nerves’ fractures by seven retrograde dyes (n = 3 for FG, CTB-A488, FE, FR, and CTB-A647, n = 6 for GB and RB), respectively, cleared with 3DISCO and imaged by confocal microscopy. The imaging results in the spinal cord sections showed that FG, CTB-A488, FE, FR, and CTB-A647 could label the motor neurons effectively (Figure 1A). And no specific fluorescent signals in the spinal cord sections labeled with GB and RB were observed.
For the 3D imaging of labeled neurons, we investigated the compatibility of fluorescent dyes with 3DISCO clearing. By recording fluorescence images of the labeled neurons in the spinal cord sections before and after clearing, we found that FG, FE, CTB-A488, FR, and CTB-A647 were compatible with the 3DISCO method (Figure 1A). To avoid the interference between the excitation and emission wavelengths of selected tracers, we chose the FG, FE, FR, and CTB-A647 to retrograde label the multiple motor neuron groups. In practical application, there were no co-labeled neurons with FR and FE, while there were co-labeled neurons with FR and FG (n = 4) (Figure 1B), which indicated that FG could label extra neurons corresponding to non-target nerves due to strong diffusion ability. Thus, FG was not selected in practical application.

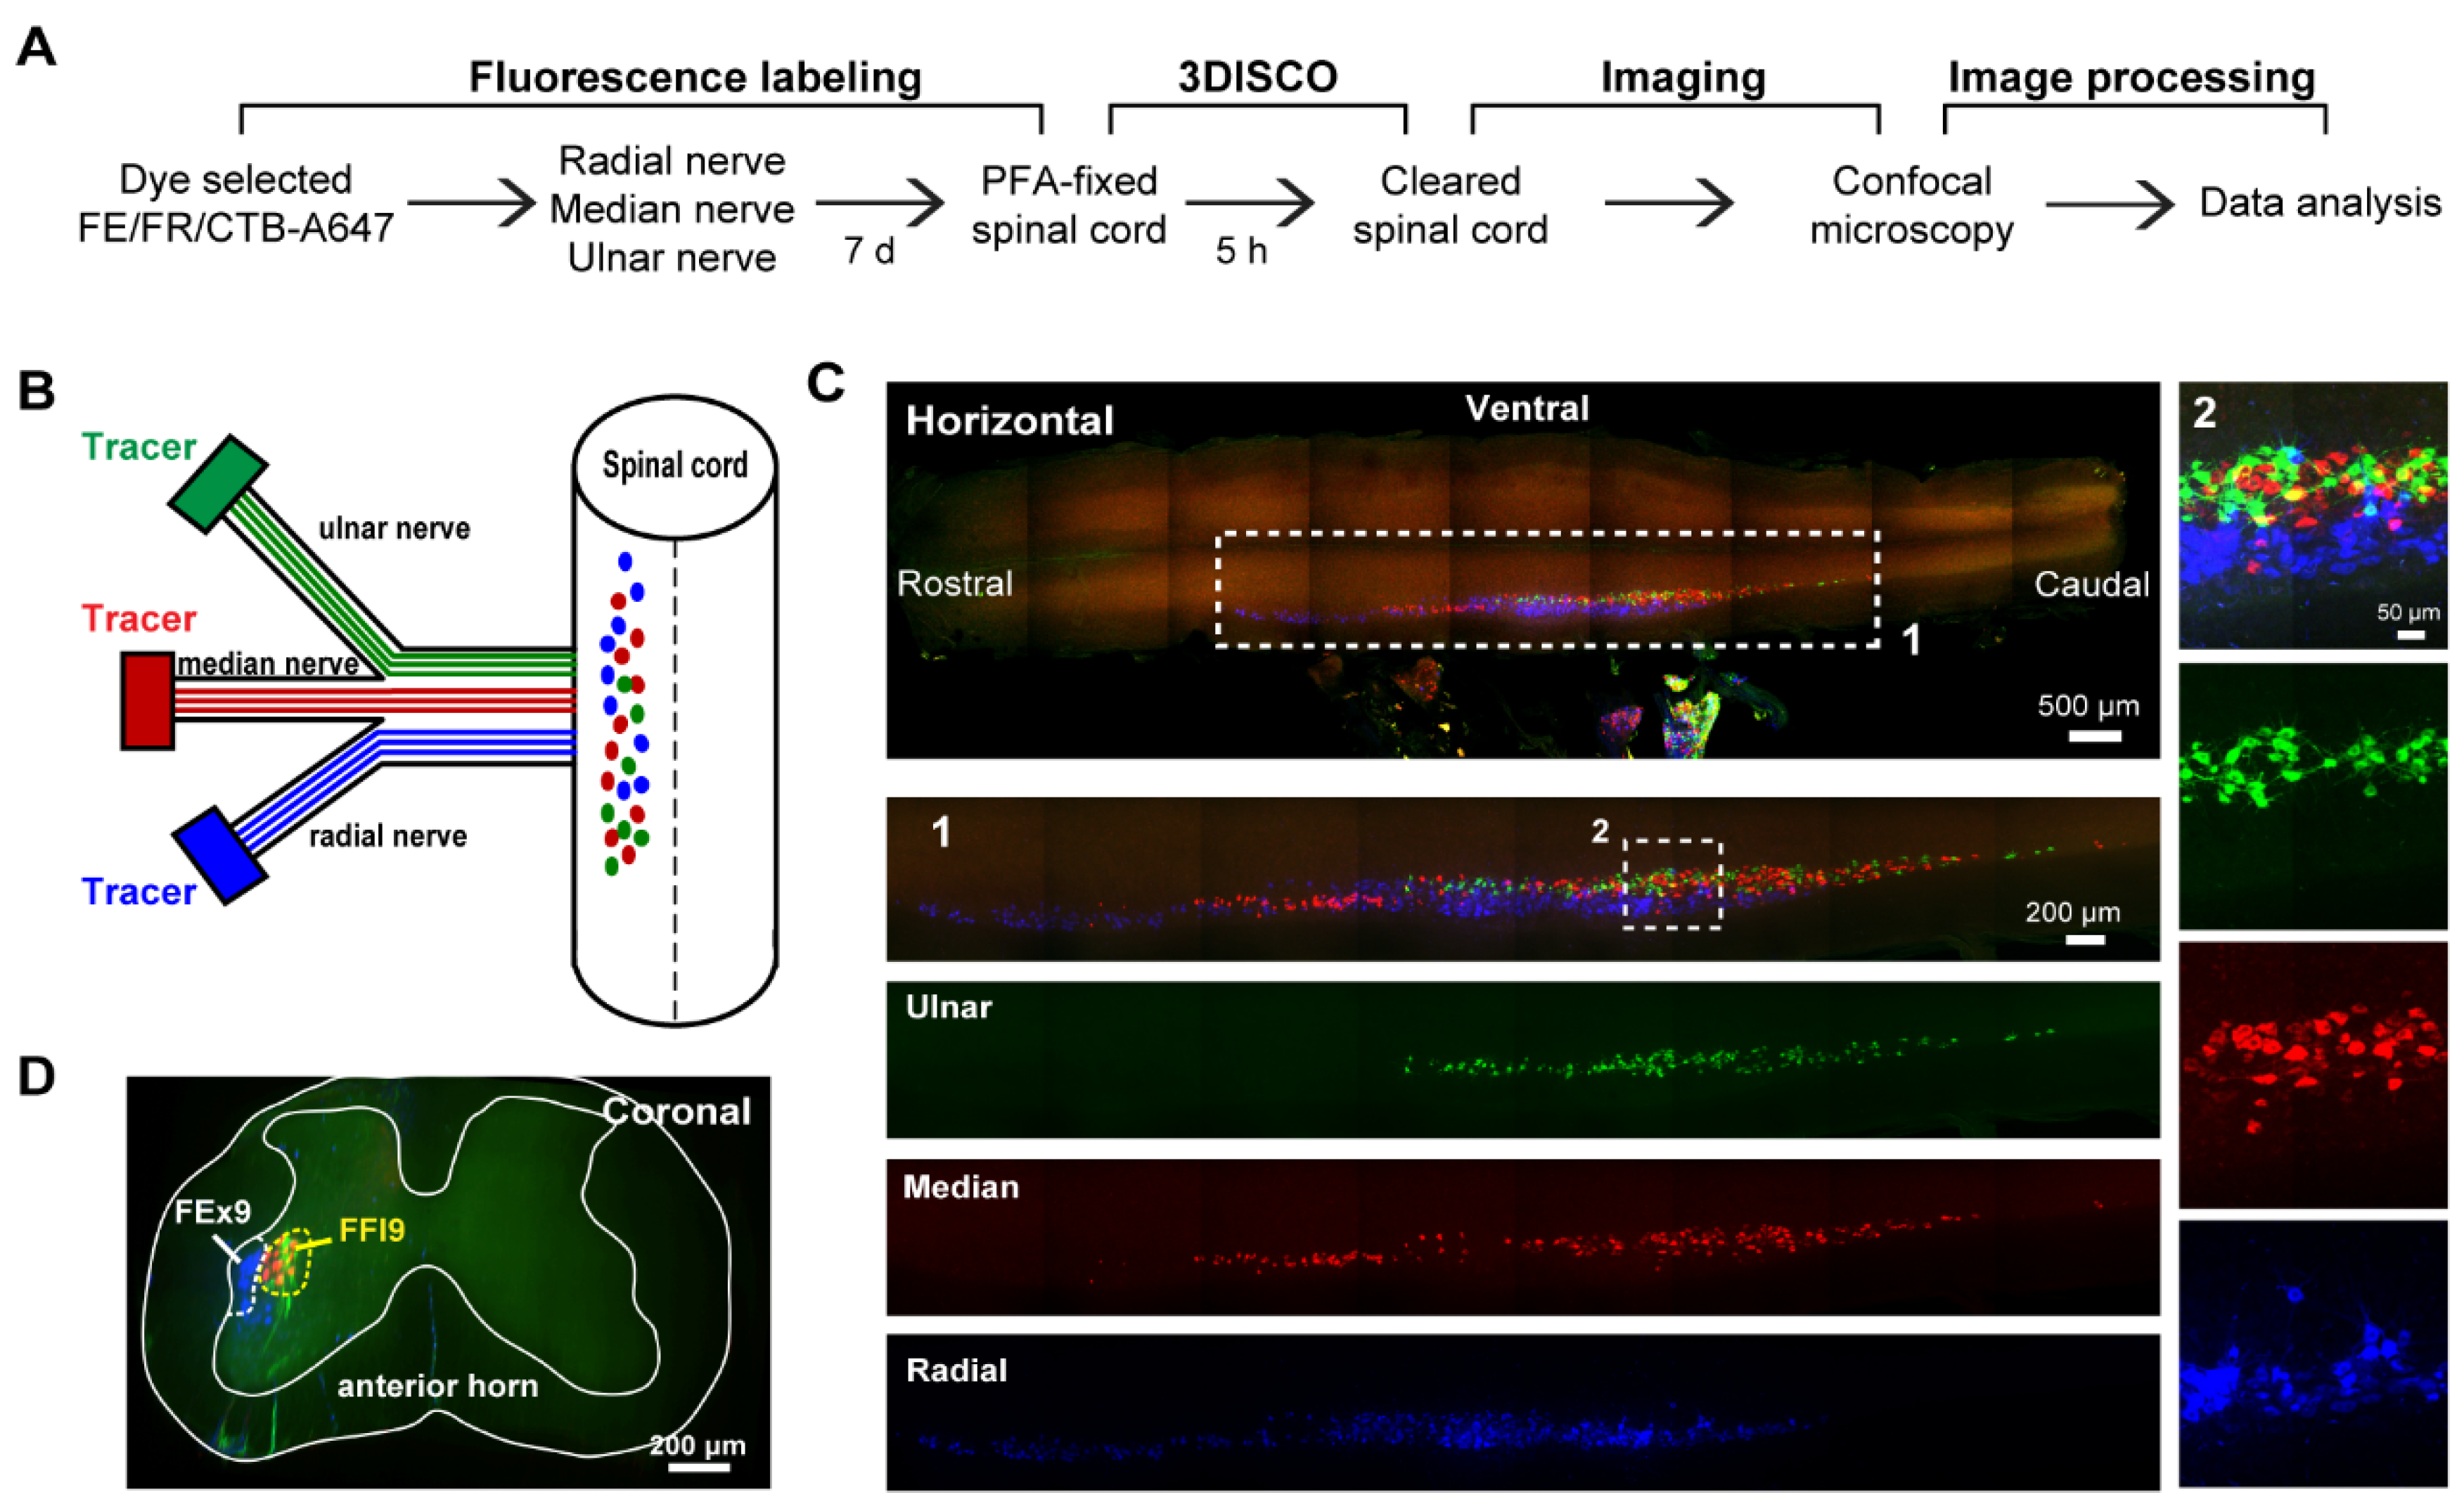
3.2. The Motor Neurons of Brachial Plexus in the Spinal Cord

We obtained the distribution of motor neurons of three nerves in the brachial plexus in the spinal cord by the combination of retrograde tracing, optical clearing, and imaging. The entire experimental process is shown in Figure 2A. After screening, FE, FR, and CTB-647 were used randomly to simultaneously label the ulnar, median, and radial nerves in the brachial plexus (Figure 2B). After 3DISCO clearing, we imaged the motor neurons in the spinal cord (Figure 2C). The motor neurons were concentrated in a single, longitudinal pool in the spinal cord anterior horn. The neurons of radial nerve (n = 3) were mainly located in forearm extensor motor neurons of lamina 9 (FEx9), and the neurons of ulnar and median nerves (n = 3) were mainly located in forearm flexor motor neurons of lamina 9 (FFl9) region (Figure 2D). There was no overlay of the different fluorescent signals on neurons, which indicated that a single neuron innervates only one peripheral nerve.
Based on the above results of 3D imaging for motor neurons in Figure 2C, the quantitative analysis of distribution characteristics was followed. The total numbers of motor neurons are significantly different among radial, median, and ulnar nerves (n = 6) with the value of 416 ± 61, 261 ± 50, and 127 ± 14, respectively (Figure 3A). Figure 3B shows the counted cell numbers from spinal cervical to thoracic segments. For each nerve, the percentages of neuron numbers in different spinal segments are shown in Figure 3C. These results indicated that for each motor pool, there is one segment containing the maximal number and density of motoneurons. For the radial nerve, the maximal number of motoneurons was at C7~C8 segment with the value of 139 ± 25. Additionally, for the median and ulnar nerve, the maximal numbers of motoneurons were both at C8~T1 segment with the value of 108 ± 33 and 56 ± 9, respectively. Moreover, this tapers towards reduced cell numbers and densities in the rostral and caudal direction. The radial nerve’s motor neurons are mainly distributed between the rostral to the C4 nerve root and the T1 nerve root. The median nerve’s motor neurons were distributed primarily on the spinal cord segments between the C5 nerve root and the caudal of the T2 nerve root. The motor neurons of the ulnar nerve were mainly distributed between the C6 nerve root and the caudal to the T2 nerve root.

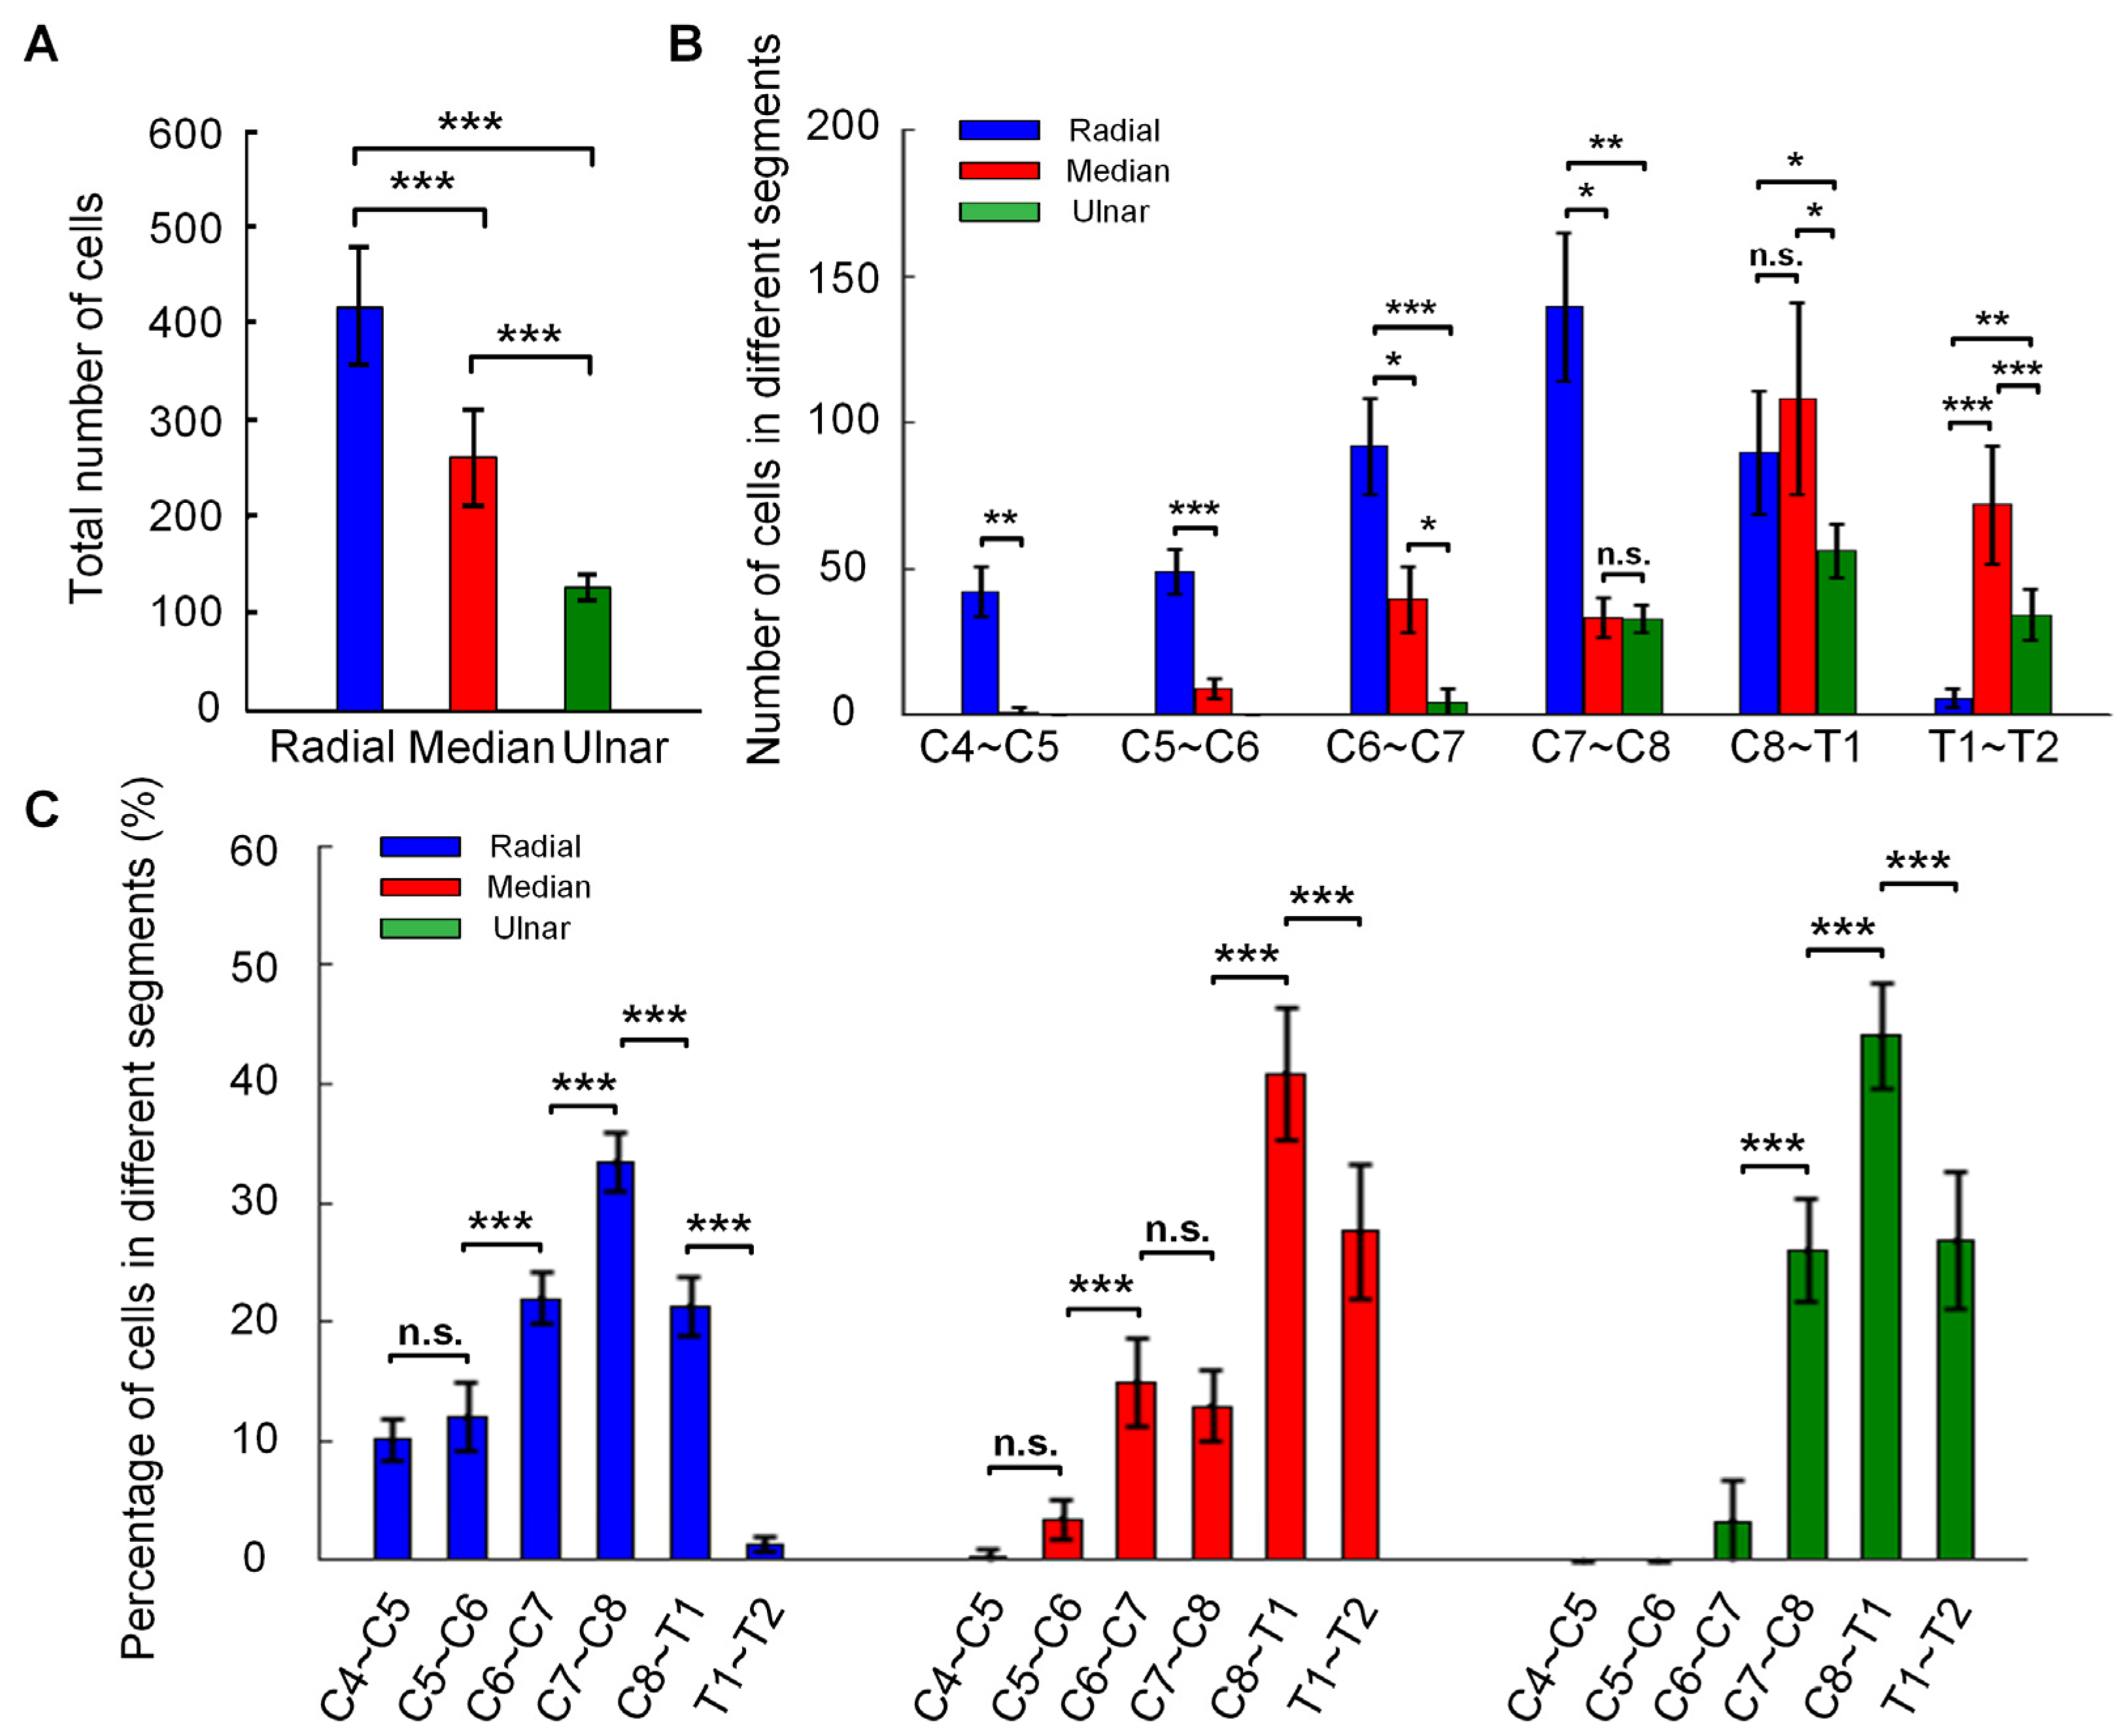
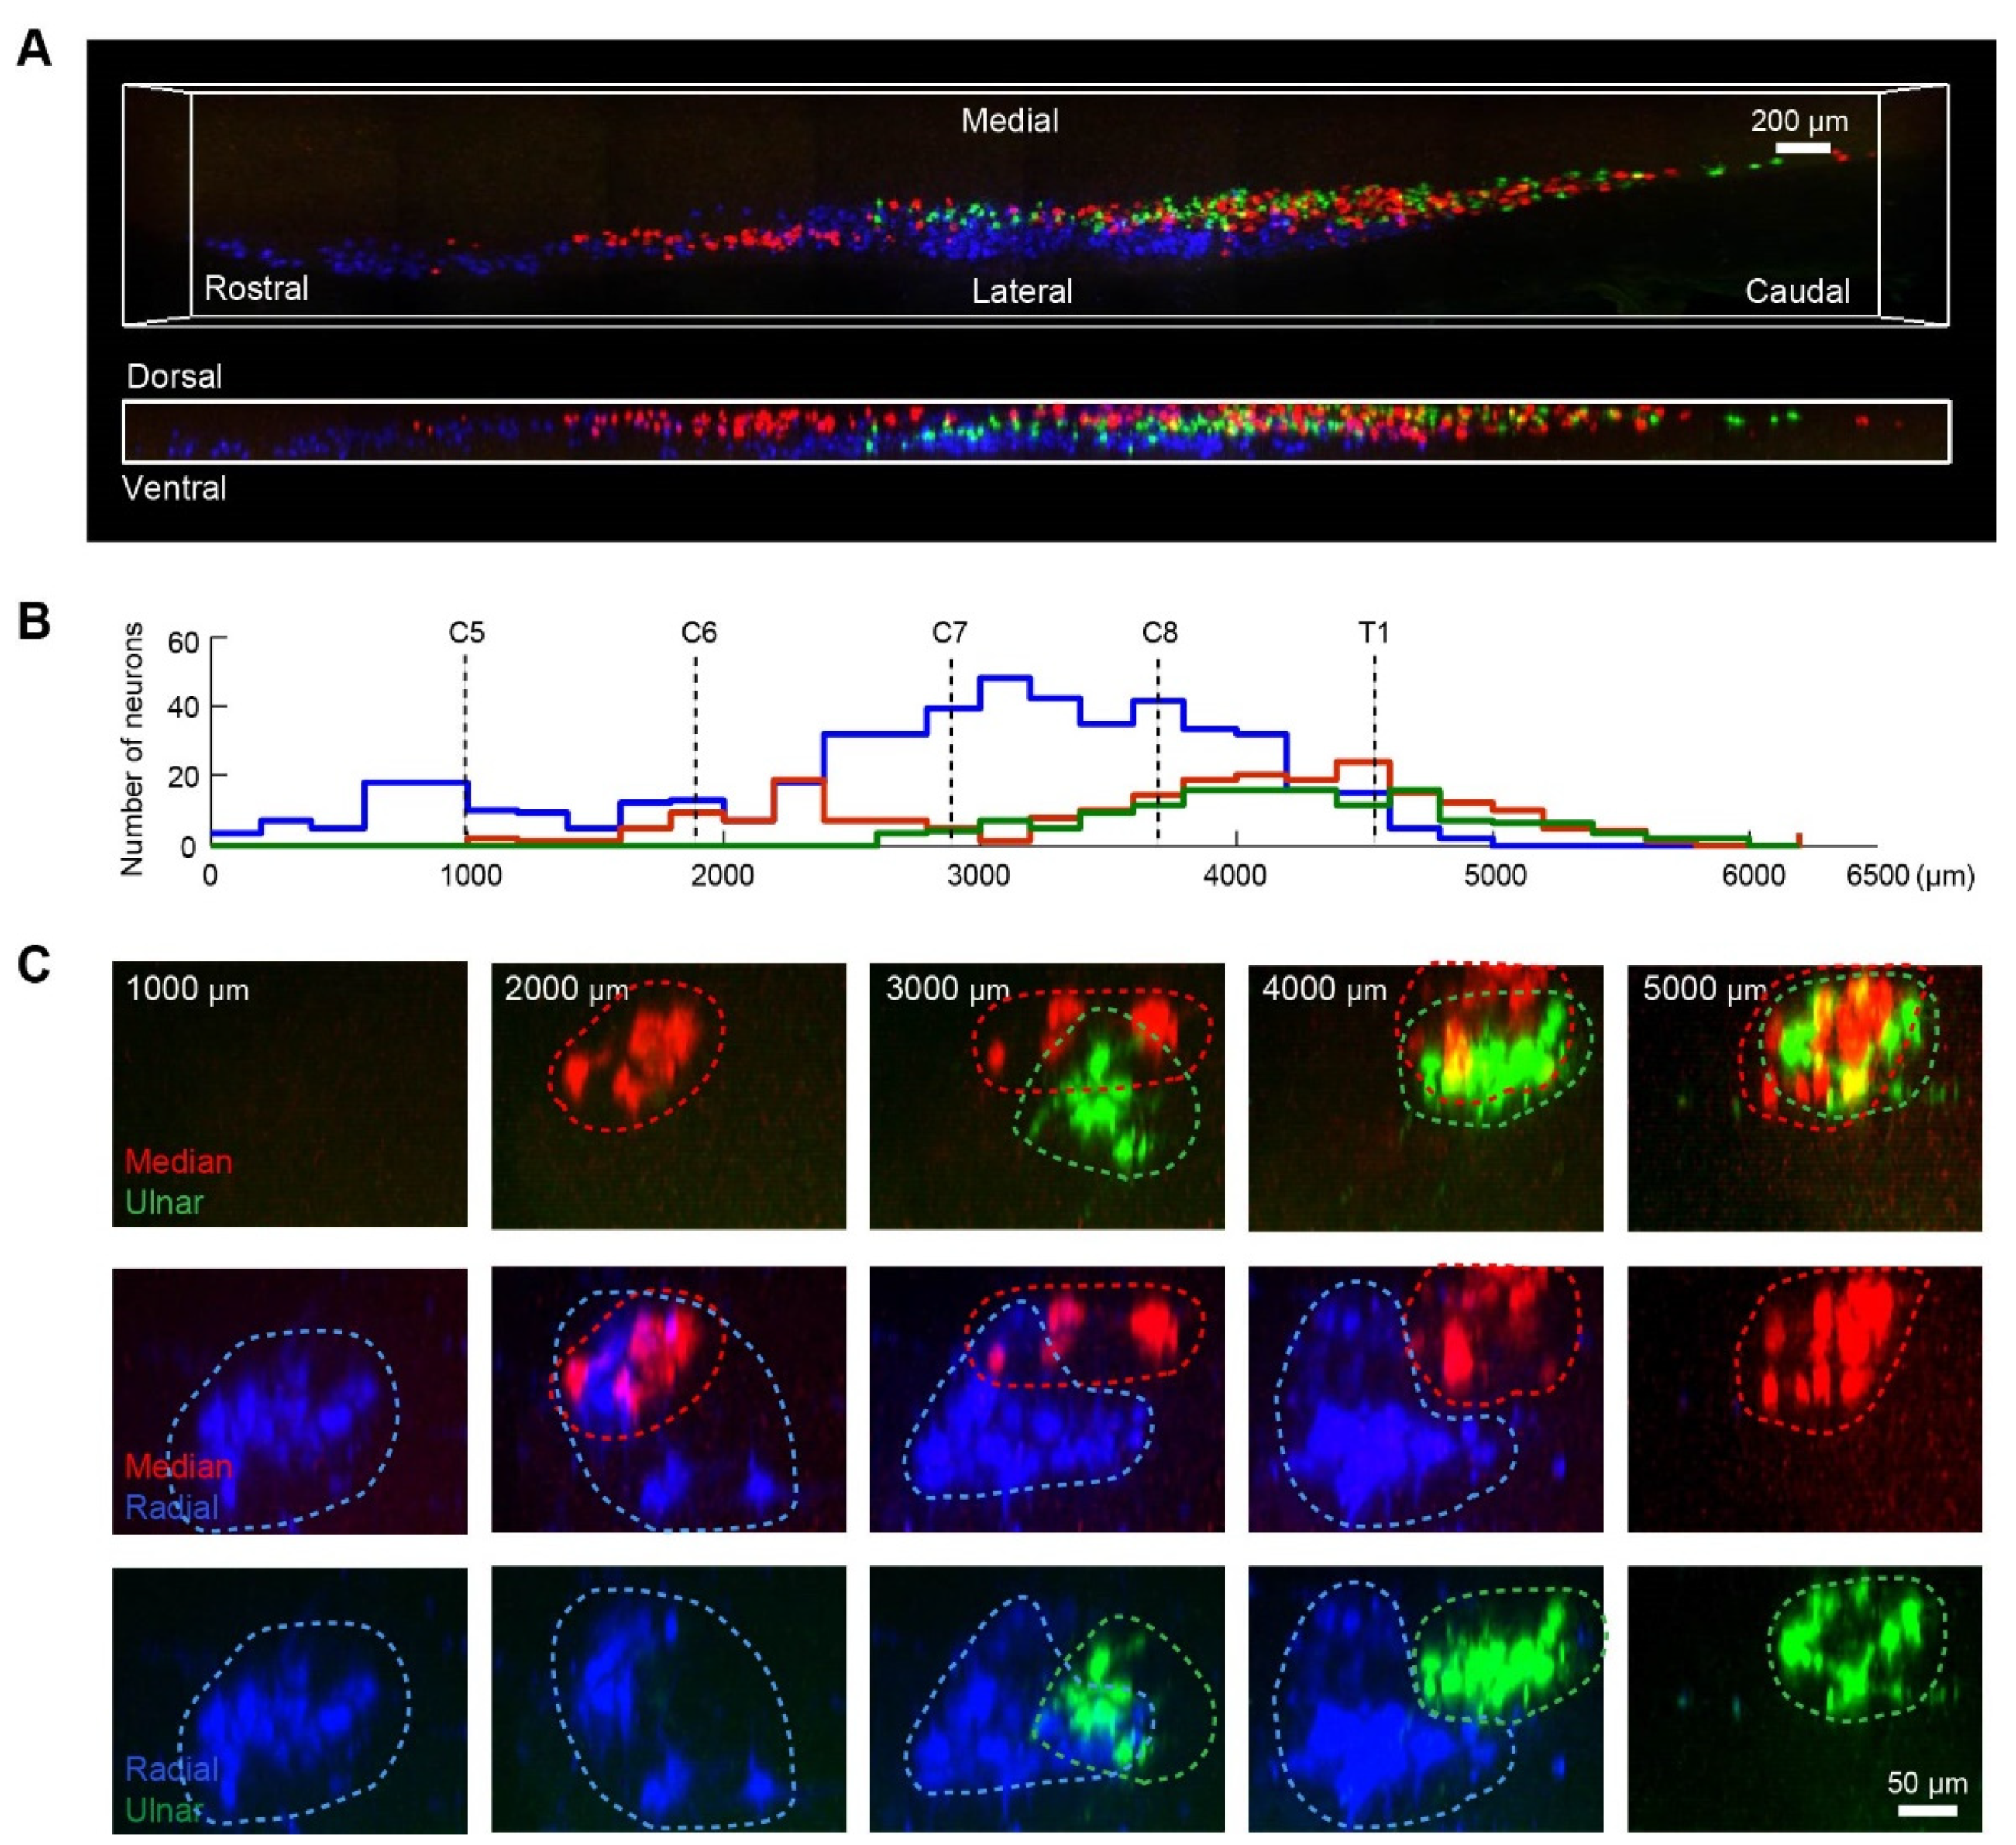
3.3. The Distribution Characteristics of Motor Neurons of Ulnar, Median, and Radial Nerves

We reconstructed the motor neurons’ distribution in three dimensions (Figure 4A and Video S1) and further analyzed the number distribution and location characteristics of motor neurons in the spinal cord (Figure 4B,C). From Figure 4A, we could see that the motor neurons of radial nerve distributed in the ventral-lateral part of anterior horn, while the motor neurons of ulnar and median nerves distributed in the ventral-medial part of the anterior horn. Then, we divided the spinal segments where the labeling neurons were distributed and counted the cell number at an interval of 200 μm-length. Figure 4B shows the detailed number distribution of motor neurons innervating different nerves from the rostral to the caudal part of the spinal cord.
For the further analysis of location characteristics of the motor neurons, the reconstructed data were resampled in the cross-section. The relative positions between the motor neuron columns of the ulnar, median, and radial nerves at different depths are shown in Figure 4C. It indicated that, at the depth of 4000 and 5000 μm, where the motor neurons of the median and ulnar nerve are mainly distributed, the majority of the neurons of the median nerve and synergistic ulnar nerve have mixed distributions. Further, for the radial nerve, the majority of the motor neurons at the depth of 3000 and 4000 μm have little and no overlapping with those of the median and ulnar nerves that are essentially antagonistic to the radial nerve.

4. Discussion

In this work, we combined multiple retrograde tracing, tissue clearing, and optical imaging to investigate the distribution of motor neurons of brachial plexuses in the unsliced mouse spinal cord. By soaking the proximal nerve stumps in the retrograde tracing dyes, the motor neurons of ulnar, median, and radial nerves were labeled by FE, CTB-A647, and FR, which are compatible with 3DISCO clearing. We reconstructed the 3D distribution of motor neurons and counted the cells in different spinal cord segments. Besides, we disclose the relative relationship between different neuronal subpopulations by multiple tracing.
The neural retrograde tracing technique is often used to demonstrate anatomical pathways in the peripheral nervous system [12,46]. There are several retrograde tracing techniques, such as applying the tracer on the transected nerve stump and injecting the tracer into the nerve trunk or the target muscle directly. However, the latter method based on injection of the tracer is highly dependent upon the injecting site and at the risk of the tracer’s leakage, which often leads to more labeling variability and less labeling specificity [22,47]. Thus, the former method was chosen in this study, and a two-hour incubation time was adopted for sufficient absorption of the tracer. Moreover, the choice of suitable survival time is an important factor in ensuring the sufficient retrograde transport of tracers and high-efficiency labeling for motoneurons. Several published papers indicated that 1 week survival time was enough to provide adequate cell labeling [11,48,49]. In addition, whether some motoneurons would be dead or lost that result from axonal injury after nerve transection during survival time should also be considered. Pollin et al. [50] and Novikova et al. [11,51] demonstrated that for adult mice, nerve transection had no effect on motor neuron survival, although it induced cell atrophy, synaptic shedding, and degeneration of dendrites. In addition, Scarisbrick et al. thought that naturally occurring motoneurons’ death and the difference in tracer uptake efficiency at different ages might be the reason for the decrease of labeling motoneurons in adult mice [52]. Therefore, the animal survival time of 1 week was chosen here to allow sufficient retrograde transport of the tracers.
Many fluorescent retrograde tracers have been used to investigate peripheral nerve injury and repair on different animal models, with varying efficacy [11,14,47,48,53]. Recently, Han et al. used FG, FR, and CTB to label spinal motoneurons corresponding to hindlimb muscles by intramuscular injection [17]. This method enables the labeling of up to four muscles simultaneously and is suitable for studying the structural relationships of motor neurons corresponding to multiple muscles innervated by a single nerve or a nerve branch. However, a single nerve usually innervates multiple muscles; for example, the median nerve innervates about 13 muscles in the forearm [54]. Moreover, one muscle can be controlled by two nerves; for example, the lateral and medial halves of the flexor digitorum profundus are innervated by the median and ulnar nerves, respectively [55]. It is hard to study the interrelationship among multiple nerves and their corresponding motor neuron columns in the spinal cord with such a method. Besides, the exposure of superficial and deep muscles is complicated and causes great suffering to animals. Retrograde tracing via cutting small branches of nerves and immersing the transected nerves in tracers can locate the nerve more precisely, with small operation and less surgical trauma. It can overcome the technical limitations of retrograde tracing by intramuscular injection. Different tracers have different transport characteristics and labeling efficacy; hence, each tracer has specific applicability. For example, FG was more suitable for cut nerve exposure than intramuscular injection due to the risk of leakage among muscles [47]. Thus, to achieve multi-labeling, it is necessary to screen the available tracers for cut nerve exposure from various common retrograde tracers. In addition, the introduction of the optical clearing technique makes it necessary to test the compatibility of tracers with the 3DISCO method. Although Han et al. has reported the compatibility of tracers (i.e., FG, FR, and CTB) with 3DISCO, they only showed the spatial distribution of motoneurons labeled by FG, FR, and CTB after 3DISCO clearing, it is still unclear whether the treatment of 3DISCO will make negative effects on the tracers themselves or the fluorescent intensity [17]. In our work, we compared the motoneurons at large magnification labeled with retrograde tracers by cut nerve exposure before and after 3DISCO clearing, and showed clearly the effects of the 3DISCO method on the tracers.
In this study, we screened three fluorescent dyes from FE, FR, FG, CTB-A488, CTB-A647, GB, and RB for the labeling of motor neurons. FE and FR are both dextran conjugates, which are hydrophilic, non-toxic, relatively inert [48]. These two dextran conjugates could be efficiently taken up by injured axons and transported rapidly to the cell bodies to reveal the dendritic and axonal structures [56,57]. We also found that FR and FE labeled nerve fibers clearly, which prompted that these two tracers could be used together to map the mixed distribution of nerve fibers from different nerve branches, such as in the research of selective regeneration [58,59]. The motor neurons of the peripheral nerve could be retrograde labeled by FG, which is compatible with 3DISCO clearing. But the neurons of non-target nerves or muscles are labeled by FG due to its excessive diffusion ability that has been widely reported in earlier researches. Novikova et al. indicated that the time-related decrease in the number of neurons labeled by FG was not due to the toxic but the possibility of leakage for FG [11]. Richmond et al. found that FG by intramuscular injection produced widespread cell labeling adjacent to the ipsilateral segment and contralateral spinal cord [47]. In a recent study, Han et al. avoided the leakage of FG from the muscle as much as possible by protecting fascia [17]. However, FG leakage occurs not only among the muscles but also from the labeled neurons. Schofield mentioned that FG could label glial cells or spurious neurons surrounding neurons because of the possibility of ‘leakage’ of the tracer from retrograde labeled cells [60]. Our results (Figure 1B) and those of Yao et al. both showed the appearance of some non-specific labeled cells surrounding neurons labeled with FG [61], which may be the primary reason for the co-labeling phenomenon. Moreover, due to its broad emission spectrum, FG is less ideal in combination with other tracers [62]. Thus, we did not choose FG in the practical experiment.
GB and RB were commonly used to retrograde label neurons in peripheral sensory and central pathways by tracer injection [63,64,65]. The results showed that GB and RB could not retrograde label motor neurons when applied on the nerve stump. In addition, other researchers also reported similar negative labeling results [47], which were probably associated with the inability of transected axons to absorb and transport the microspheres.
The optical clearing methods, such as 3DISCO we used, can make the spinal cord transparent for 3D imaging by optical microscopy [41,66,67,68], allowing 3D visualization of the spatial organizations of labeled cells in cleared tissues. Although the 3DISCO method induced a substantial volumetric reduction during the clearing procedure due to the tissue dehydration with tetrahydrofuran, the cleared spinal cord shrunk isotropically by about 20% in each dimension and about 50% in 3D volume [31,69], and the spatial organizations of the motor neurons could be preserved after clearing [41,42,45]. Compared with the traditional histological methods, the 3DISCO clearing achieved simple and rapid imaging of the whole spinal cord without losing information. By image-processing with Imaris software, we reconstructed the 3D distribution of the motor neurons in the spinal cord. Further, the automatic counting of labeled neurons was easily and quickly performed in the unsectioned spinal cord, which avoids the common problem of double counting by tissue sectioning [45].
The motor neurons in the spinal cord are arranged in the manner of the column that has been found for a long time. Many studies showed a rostral-caudal and ventral-dorsal topography in the distribution of the motor neurons dominating muscles [20,22,25]. However, for the brachial plexus, there was still no relevant report about the distribution of the corresponding motor neurons. In addition, most studies were based on the single labeling of each nerve or muscle, which could only reflect the distribution of a single subpopulation of motor neurons. Thus, the relative locations of different subpopulations of motor neurons must only be speculated indirectly. Our results also showed a rostral-caudal and ventral-dorsal topography in the distribution of motor neurons of the brachial plexus.
Further analysis of the overlapping regions’ distribution revealed different spinal segments’ characteristics, such as single distribution, independent partition, or mixed distribution. Tosolini et al. observed the motor neurons dominating the upper extremity muscles by intramuscular injection of retrograde tracers and found that motor neurons innervating the flexors and extensors had partial overlapping regions at some spinal segments [20,22]. This phenomenon suggests that the regulation of a single limb’s motor function (e.g., synergistic or antagonistic movement) may be partially determined based on the overlapping distribution of motor neurons that function in a synergistic or antagonistic way.

5. Conclusions

In this study, we achieved the 3D imaging of spinal motor neurons of multiple brachial plexuses based on the combination of retrograde tracing, optical clearing, and microscopy imaging. We screened out three fluorescent dyes (FE, FR, and CTB-A647), which successfully labeled motor neurons and were compatible with 3DISCO clearing. We quantified the number and distribution of motor neurons of ulnar, median, and radial nerves in different spinal cord segments. The number and distribution of motor neurons innervating the radial nerve are the largest, while those of motor neurons innervating the ulnar nerve are the least. Moreover, the motor neuron columns of the three nerves had partially overlapping regions in the spinal cord. The majority of motor neurons of the median nerve and ulnar nerve, showing synergistic effects, have mixed distributions in the spinal cord. The majority of the motor neurons of the radial nerve have relatively independent partitions from that of the median nerve and ulnar nerve, which are essentially antagonistic to the radial nerve. This study will help better understand the functional relationships among brachial plexus branches. It is expected to facilitate the study of regeneration of axons and remodeling of motor neurons in peripheral nerve repair.

Supplementary Materials

The following are available online at https://0-www-mdpi-com.brum.beds.ac.uk/article/10.3390/photonics8050145/s1, Video S1: Three-dimensional reconstruction of motor neurons’ distribution in the spinal cord.

Author Contributions

T.Y. and X.Y. conceived and designed the study. J.X., Y.Q., and B.C. performed tissue optical clearing and imaging. B.C. performed retrograde tracing. Y.L., P.W., and Y.Y. participated in sample preparation. J.X. performed image processing and analysis. J.X., B.C., T.Y., and X.Y. wrote the paper. D.Z. gave valuable comments during this study and revision suggestions for the manuscript. B.J. supervised the project. All of the authors discussed the results and commented on the manuscript text. All authors have read and agreed to the published version of the manuscript.

Funding

This study was funded by the National Natural Science Foundation of China, grant numbers 61860206009, 81701354, 81870934, 81971177; the National Key Research and Development Program of China, grant number 2017YFA0700501; Natural Science Foundation of Beijing, China, grant number 7192215, and the Innovation Fund of WNLO.

Institutional Review Board Statement

The study was conducted according to recommendations in the Institutional Animal Care Guidelines and approved by the Administration Committee of Experimental Animals of Peking University People’s Hospital (protocol code: 2015PHE689; date of approval: 23 December 2015).

Data Availability Statement

All raw data generated in the production of this manuscript is available on request.

Acknowledgments

The authors thank the Optical Bioimaging Core Facility of WNLO-HUST for support with data acquisition.

Conflicts of Interest

The authors declare no conflict of interest.

References

  1. Taylor, C.A.; Braza, D.; Rice, J.B.; Dillingham, T. The Incidence of Peripheral Nerve Injury in Extremity Trauma. Am. J. Phys. Med. Rehabil. 2008, 87, 381–385. [Google Scholar] [CrossRef]
  2. Li, R.; Liu, Z.; Pan, Y.; Chen, L.; Zhang, Z.; Lu, L. Peripheral Nerve Injuries Treatment: A Systematic Review. Cell Biochem. Biophys. 2014, 68, 449. [Google Scholar] [CrossRef]
  3. Yang, X.X.; Huang, Z.Q.; Li, Z.H.; Ren, D.F.; Tang, J.G. Risk factors and the surgery affection of respiratory complication and its mortality after acute traumatic cervical spinal cord injury. Medicine 2017, 96, e7887. [Google Scholar] [CrossRef]
  4. Lykissas, M.G. Current concepts in end-to-side neurorrhaphy. World J. Orthop. 2011, 2, 102–106. [Google Scholar] [CrossRef]
  5. Aboutaleb Kadkhodaeian, H. Comparison of nerve repair with end to end, end to side with window and end to side without window methods in lower extremity of rat. Med. J. Islamic Repub. Iran 2011, 25, 40–46. [Google Scholar]
  6. Nicaise, C.; Frank, D.M.; Hala, T.J.; Authelet, M.; Pochet, R.; Adriaens, D.; Brion, J.P.; Wright, M.C.; Lepore, A.C. Early Phrenic Motor Neuron Loss and Transient Respiratory Abnormalities after Unilateral Cervical Spinal Cord Contusion. J. Neurotraum. 2013, 30, 1092–1099. [Google Scholar] [CrossRef] [PubMed] [Green Version]
  7. Yingtao, Y.; Jianyi, X.; Tingting, Y.; Zhilong, C.; Zhiyong, X.; Jiedong, W.; Yiqiang, H.; Yongchao, W.; Dan, Z. Flufenamic acid inhibits secondary hemorrhage and BSCB disruption after spinal cord injury. Theranostics 2018, 8, 4181–4198. [Google Scholar] [CrossRef]
  8. Re, D.B.; Le, V.V.; Yu, C.; Amoroso, M.W.; Politi, K.A.; Phani, S.; Ikiz, B.; Hoffmann, L.; Koolen, M.; Nagata, T. Necroptosis Drives Motor Neuron Death in Models of Both Sporadic and Familial ALS. Neuron 2014, 81, 1001–1008. [Google Scholar] [CrossRef] [Green Version]
  9. Frakes, A.E.; Ferraiuolo, L.; Haidet-Phillips, A.M.; Schmelzer, L.; Braun, L.; Miranda, C.J.; Ladner, K.J.; Bevan, A.K.; Foust, K.D.; Godbout, J.P. Microglia Induce Motor Neuron Death via the Classical NF-κB Pathway in Amyotrophic Lateral Sclerosis. Neuron 2014, 81, 1009–1023. [Google Scholar] [CrossRef] [Green Version]
  10. Santos, D.; Giudetti, G.; Micera, S.; Navarro, X.; del Valle, J. Focal release of neurotrophic factors by biodegradable microspheres enhance motor and sensory axonal regeneration in vitro and in vivo. Brain Res. 2016, 1636, 93–106. [Google Scholar] [CrossRef] [Green Version]
  11. Novikova, L.; Novikov, L.; Kellerth, J.O. Persistent neuronal labeling by retrograde fluorescent tracers: A comparison between Fast Blue, Fluoro-Gold and various dextran conjugates. J. Neurosci. Methods 1997, 74, 9–15. [Google Scholar] [CrossRef]
  12. Kobbert, C.; Apps, R.; Bechmann, I.; Lanciego, J.L.; Mey, J.; Thanos, S. Current concepts in neuroanatomical tracing. Prog. Neurobiol. 2000, 62, 327–351. [Google Scholar] [CrossRef] [Green Version]
  13. Hayashi, A.; Moradzadeh, A.; Hunter, D.A.; Kawamura, D.H.; Puppala, V.K.; Tung, T.H.; Mackinnon, S.E.; Myckatyn, T.M. Retrograde Labeling in Peripheral Nerve Research: It Is Not All Black and White. J. Reconstr. Microsurg. 2007, 23, 381–389. [Google Scholar] [CrossRef] [PubMed]
  14. Zele, T.; Sketelj, J.; Bajrovic, F.F. Efficacy of fluorescent tracers in retrograde labeling of cutaneous afferent neurons in the rat. J. Neurosci. Methods 2010, 191, 208–214. [Google Scholar] [CrossRef]
  15. Lai, B.Q.; Qiu, X.C.; Ke, Z.; Zhang, R.Y.; Hui, J.; Ge, L.; Shen, H.Y.; Wu, J.L.; Ling, E.A.; Zeng, Y.S. Cholera Toxin B Subunit Shows Transneuronal Tracing after Injection in an Injured Sciatic Nerve. PLoS ONE 2015, 10, e0144030. [Google Scholar] [CrossRef]
  16. Vandeweerd, J.; Hontoir, F.; De Knoop, A.; De Swert, K.; Nicaise, C. Retrograde Neuroanatomical Tracing of Phrenic Motor Neurons in Mice. J. Vis. Exp. 2018, e56758. [Google Scholar] [CrossRef]
  17. Han, S.; Li, D.D.; Kou, Y.H.; Fu, Z.G.; Yin, X.F. Multiple retrograde tracing methods compatible with 3DISCO clearing. Artif. Cells Nanomed. Biotechnol. 2019, 47, 4240–4247. [Google Scholar] [CrossRef] [PubMed] [Green Version]
  18. Nicolopoulos-Stournaras, S.; Iles, J.F. Motor neuron columns in the lumbar spinal cord of the rat. J. Comp. Neurol. 1983, 217, 75–85. [Google Scholar] [CrossRef]
  19. Oka, Y.; Ohtani, R.; Satou, M.; Ueda, K. Location of forelimb motoneurons in the Japanese toad (Bufo japonicus): A horseradish peroxidase study. J. Comp. Neurol. 1989, 286, 376–383. [Google Scholar] [CrossRef]
  20. Tosolini, A.P.; Morris, R. Spatial characterization of the motor neuron columns supplying the rat forelimb. Neuroscience 2012, 200, 19–30. [Google Scholar] [CrossRef]
  21. Bacskai, T.; Fu, Y.; Sengul, G.; Rusznak, Z.; Paxinos, G.; Watson, C. Musculotopic organization of the motor neurons supplying forelimb and shoulder girdle muscles in the mouse. Brain Struct. Funct. 2013, 218, 221–238. [Google Scholar] [CrossRef] [PubMed]
  22. Tosolini, A.P.; Mohan, R.; Morris, R. Targeting the Full Length of the Motor End Plate Regions in the Mouse Forelimb Increases the Uptake of Fluoro-Gold into Corresponding Spinal Cord Motor Neurons. Front. Neurol. 2013, 4, 58. [Google Scholar] [CrossRef] [PubMed] [Green Version]
  23. Bacskai, T.; Rusznak, Z.; Paxinos, G.; Watson, C. Musculotopic organization of the motor neurons supplying the mouse hindlimb muscles: A quantitative study using Fluoro-Gold retrograde tracing. Brain Struct. Funct. 2014, 219, 303–321. [Google Scholar] [CrossRef] [PubMed] [Green Version]
  24. Mohan, R.; Tosolini, A.P.; Morris, R. Targeting the motor end plates in the mouse hindlimb gives access to a greater number of spinal cord motor neurons: An approach to maximize retrograde transport. Neuroscience 2014, 274, 318–330. [Google Scholar] [CrossRef] [PubMed]
  25. Mohan, R.; Tosolini, A.P.; Morris, R. Segmental distribution of the motor neuron columns that supply the rat hindlimb: A muscle/motor neuron tract-tracing analysis targeting the motor end plates. Neuroscience 2015, 307, 98–108. [Google Scholar] [CrossRef] [PubMed]
  26. Pfister, B.J.; Gordon, T.; Loverde, J.R.; Kochar, A.S.; Mackinnon, S.E.; Cullen, D.K. Biomedical engineering strategies for peripheral nerve repair: Surgical applications, state of the art, and future challenges. Crit. Rev. Biomed. Eng. 2011, 39, 81–124. [Google Scholar] [CrossRef] [PubMed]
  27. Xu, L.; Gu, Y.; Xu, J.; Lin, S.; Chen, L.; Lu, J. Contralateral C7 transfer via the prespinal and retropharyngeal route to repair brachial plexus root avulsion: A preliminary report. Neurosurgery 2008, 63, 553–558. [Google Scholar] [CrossRef]
  28. Jiang, Y.; Wang, L.; Lao, J.; Zhang, X. Total brachial plexus injury: Contralateral C7 root transfer to the lower trunk versus the median nerve. Neural Regen. Res. 2018, 13, 1968–1973. [Google Scholar] [CrossRef]
  29. Richardson, D.S.; Lichtman, J.W. Clarifying Tissue Clearing. Cell 2015, 162, 246–257. [Google Scholar] [CrossRef] [Green Version]
  30. Zhu, D.; Larin, K.V.; Luo, Q.; Tuchin, V.V. Recent progress in tissue optical clearing. Laser Photonics Rev. 2013, 7, 732–757. [Google Scholar] [CrossRef] [Green Version]
  31. Becker, K.; Jährling, N.; Saghafi, S.; Weiler, R.; Dodt, H.-U. Chemical clearing and dehydration of GFP expressing mouse brains. PLoS ONE 2012, 7, e33916. [Google Scholar] [CrossRef]
  32. Ertürk, A.; Becker, K.; Jährling, N.; Mauch, C.; Hojer, C.; Egen, J.; Hellal, F.; Bradke, F.; Sheng, M.; Dodt, H.-U. Three-dimensional imaging of solvent-cleared organs using 3DISCO. Nat. Protoc. 2012, 7, 1983–1995. [Google Scholar] [CrossRef]
  33. Pan, C.; Cai, R.; Quacquarelli, F.P.; Ghasemigharagoz, A.; Lourbopoulos, A.; Matryba, P.; Plesnila, N.; Dichgans, M.; Hellal, F.; Ertürk, A. Shrinkage-mediated imaging of entire organs and organisms using uDISCO. Nat. Methods 2016, 13, 859–867. [Google Scholar] [CrossRef]
  34. Hama, H.; Hioki, H.; Namiki, K.; Hoshida, T.; Kurokawa, H.; Ishidate, F.; Kaneko, T.; Akagi, T.; Saito, T.; Saido, T. ScaleS: An optical clearing palette for biological imaging. Nat. Neurosci. 2015, 18, 1518–1529. [Google Scholar] [CrossRef] [PubMed]
  35. Susaki, E.A.; Tainaka, K.; Perrin, D.; Kishino, F.; Tawara, T.; Watanabe, T.M.; Yokoyama, C.; Onoe, H.; Eguchi, M.; Yamaguchi, S.; et al. Whole-brain imaging with single-cell resolution using chemical cocktails and computational analysis. Cell 2014, 157, 726–739. [Google Scholar] [CrossRef] [PubMed] [Green Version]
  36. Chung, K.; Wallace, J.; Kim, S.Y.; Kalyanasundaram, S.; Andalman, A.S.; Davidson, T.J.; Mirzabekov, J.J.; Zalocusky, K.A.; Mattis, J.; Denisin, A.K.; et al. Structural and molecular interrogation of intact biological systems. Nature 2013, 497, 332–337. [Google Scholar] [CrossRef]
  37. Jing, D.; Zhang, S.W.; Luo, W.J.; Gao, X.F.; Men, Y.; Ma, C.; Liu, X.H.; Yi, Y.T.; Bugde, A.; Zhou, B.O.; et al. Tissue clearing of both hard and soft tissue organs with the PEGASOS method (vol 28, pg 803, 2018). Cell Res. 2019, 29, 506. [Google Scholar] [CrossRef] [PubMed]
  38. Cai, R.; Pan, C.; Ghasemigharagoz, A.; Todorov, M.I.; Forstera, B.; Zhao, S.; Bhatia, H.S.; Parradamas, A.; Mrowka, L.; Theodorou, D. Panoptic Imaging of Transparent Mice Reveals Whole-Body Neuronal Projections and Skull-Meninges Connections. Nat. Neurosci. 2019, 22, 317–327. [Google Scholar] [CrossRef]
  39. Zhu, J.T.; Yu, T.T.; Li, Y.S.; Xu, J.Y.; Qi, Y.S.; Yao, Y.T.; Ma, Y.L.; Wan, P.; Chen, Z.L.; Li, X.N.; et al. MACS: Rapid Aqueous Clearing System for 3D Mapping of Intact Organs. Adv. Sci. 2020, 7, 1903185. [Google Scholar] [CrossRef] [Green Version]
  40. Wan, P.; Zhu, J.; Xu, J.; Li, Y.; Yu, T.; Zhu, D. Evaluation of seven optical clearing methods in mouse brain. Neurophotonics 2018, 5, 035007. [Google Scholar] [CrossRef] [Green Version]
  41. Ertürk, A.; Mauch, C.P.; Hellal, F.; Förstner, F.; Keck, T.; Becker, K.; Jährling, N.; Steffens, H.; Richter, M.; Hübener, M.; et al. Three-dimensional imaging of the unsectioned adult spinal cord to assess axon regeneration and glial responses after injury. Nat. Med. 2012, 18, 166–171. [Google Scholar] [CrossRef]
  42. Launay, P.-S.; Godefroy, D.; Khabou, H.; Rostene, W.; Sahel, J.-A.; Baudouin, C.; Melik Parsadaniantz, S.; Reaux-Le Goazigo, A. Combined 3DISCO clearing method, retrograde tracer and ultramicroscopy to map corneal neurons in a whole adult mouse trigeminal ganglion. Exp. Eye Res. 2015, 139, 136–143. [Google Scholar] [CrossRef] [Green Version]
  43. Belle, M.; Godefroy, D.; Dominici, C.; Heitz-Marchaland, C.; Zelina, P.; Hellal, F.; Bradke, F.; Chédotal, A. A Simple Method for 3D Analysis of Immunolabeled Axonal Tracts in a Transparent Nervous System. Cell Rep. 2014, 9, 1191–1201. [Google Scholar] [CrossRef]
  44. Casoni, F.; Malone, S.A.; Belle, M.; Luzzati, F.; Collier, F.; Allet, C.; Hrabovszky, E.; Rasika, S.; Prevot, V.; Chédotal, A.; et al. Development of the neurons controlling fertility in humans: New insights from 3D imaging and transparent fetal brains. Development 2016, 143, 3969–3981. [Google Scholar] [CrossRef] [Green Version]
  45. Žygelytė, E.; Bernard, M.E.; Tomlinson, J.E.; Martin, M.J.; Terhorst, A.; Bradford, H.E.; Lundquist, S.A.; Sledziona, M.; Cheetham, J. RetroDISCO: Clearing technique to improve quantification of retrograde labeled motor neurons of intact mouse spinal cords. J. Neurosci. Methods 2016, 271, 34–42. [Google Scholar] [CrossRef] [Green Version]
  46. Robinson, G.A.; Madison, R.D. Preferential motor reinnervation in the mouse: Comparison of femoral nerve repair using a fibrin sealant or suture. Muscle Nerve 2003, 28, 227–231. [Google Scholar] [CrossRef]
  47. Richmond, F.J.R.; Gladdy, R.; Creasy, J.L.; Kitamura, S.; Smits, E.; Thomson, D.B. Efficacy of seven retrograde tracers, compared in multiple-labelling studies of feline motoneurones. J. Neurosci. Methods 1994, 53, 35–46. [Google Scholar] [CrossRef]
  48. Choi, D.; Li, D.; Raisman, G. Fluorescent retrograde neuronal tracers that label the rat facial nucleus: A comparison of Fast Blue, Fluoro-ruby, Fluoro-emerald, Fluoro-Gold and DiI. J. Neurosci. Methods 2002, 117, 167–172. [Google Scholar] [CrossRef]
  49. Hirakawa, M.; Mccabe, J.T.; Kawata, M. Time-related changes in the labeling pattern of motor and sensory neurons innervating the gastrocnemius muscle, as revealed by the retrograde transport of the cholera toxin B subunit. Cell Tissue Res. 1992, 267, 419–427. [Google Scholar] [CrossRef]
  50. Pollin, M.M.; McHanwell, S.; Slater, C.R. The effect of age on motor neurone death following axotomy in the mouse. Development 1991, 112, 83–89. [Google Scholar] [CrossRef]
  51. Welin, D.; Novikova, L.N.; Wiberg, M.; Kellerth, J.O.; Novikov, L.N. Survival and regeneration of cutaneous and muscular afferent neurons after peripheral nerve injury in adult rats. Exp. Brain Res. 2008, 186, 315–323. [Google Scholar] [CrossRef]
  52. Scarisbrick, I.A.; Haase, P.; Hrycyshyn, A.W. The arrangement of forearm motoneurons in young and adult rats and the possibility of naturally occurring motoneuron death. J. Anat. 1990, 171, 57–67. [Google Scholar] [CrossRef]
  53. Byers, C.T.; Fan, R.; Messina, A.; Morrison, W.A.; Galea, M.P. Comparing the efficacy of two fluorescent retrograde tracers in labeling the motor and sensory neuron populations of the rat sciatic nerve. J. Neurosci. Methods 2002, 114, 159–164. [Google Scholar] [CrossRef]
  54. Preston, D.C.; Shapiro, B.E. Median Neuropathy at the Wrist. In Electromyography and Neuromuss, 3rd ed.; Preston, D.C., Shapiro, B.E., Eds.; W.B. Saunders: London, UK, 2013; pp. 267–288. [Google Scholar] [CrossRef]
  55. Oh, C.-S.; Won, H.-S.; Lee, K.-S.; Chung, I.-H.; Kim, S.M. Anatomic variation of the innervation of the flexor digitorum profundus muscle and its clinical implications. Muscle Nerve 2009, 39, 498–502. [Google Scholar] [CrossRef]
  56. Glover, J.C.; Petursdottir, G.; Jansen, J. Fluorescent dextran-amines used as axonal tracers in the nervous system of the chicken embryo. J. Neurosci. Methods 1986, 18, 243–254. [Google Scholar] [CrossRef]
  57. Dubový, P.; Raška, O.; Klusáková, I.; Stejskal, L.; Čelakovský, P.; Haninec, P. Ciliary neurotrophic factor promotes motor reinnervation of the musculocutaneous nerve in an experimental model of end-to-side neurorrhaphy. BMC Neurosci. 2011, 12, 58. [Google Scholar] [CrossRef] [Green Version]
  58. Brushart, T.M. Motor axons preferentially reinnervate motor pathways. J. Neurosci. 1993, 13, 2730–2738. [Google Scholar] [CrossRef]
  59. Brushart, T.M. Preferential reinnervation of motor nerves by regenerating motor axons. J. Neurosci. 1988, 8, 1026–1031. [Google Scholar] [CrossRef] [PubMed]
  60. Schofield, B.R. Retrograde axonal tracing with fluorescent markers. Curr. Protoc. Neurosci. 2008, 43, 1–17. [Google Scholar] [CrossRef]
  61. Yao, F.; Zhang, E.; Gao, Z.; Ji, H.; Marmouri, M.; Xia, X. Did you choose appropriate tracer for retrograde tracing of retinal ganglion cells? The differences between cholera toxin subunit B and Fluorogold. PLoS ONE 2018, 13, e0205133. [Google Scholar] [CrossRef] [Green Version]
  62. Schmued, L.C.; Fallon, J.H. Fluoro-gold: A new fluorescent retrograde axonal tracer with numerous unique properties. Brain Res. 1986, 377, 147–154. [Google Scholar] [CrossRef]
  63. Colin, W.; Donoff, R.B.; Foote, W.E. Fluorescent latex microspheres as a retrograde tracer in the peripheral nervous system. Brain Res. 1989, 486, 334–339. [Google Scholar] [CrossRef]
  64. Katz, L.C.; Iarovici, D.M. Green fluorescent latex microspheres: A new retrograde tracer. Neuroscience 1990, 34, 511–520. [Google Scholar] [CrossRef]
  65. Hoover, J.E.; Durkovic, R.G. Retrograde Labeling of Lumbosacral Interneurons Following Injections of Red and Green Fluorescent Microspheres into Hindlimb Motor Nuclei of the Cat. Somatosens. Mot. Res. 1992, 9, 211–226. [Google Scholar] [CrossRef] [PubMed]
  66. Tainaka, K.; Kuno, A.; Kubota, S.I.; Murakami, T.; Ueda, H.R. Chemical Principles in Tissue Clearing and Staining Protocols for Whole-Body Cell Profiling. Annu. Rev. Cell Dev. Biol. 2016, 32, 713–741. [Google Scholar] [CrossRef] [Green Version]
  67. Yu, T.; Qi, Y.; Gong, H.; Luo, Q.; Zhu, D. Optical clearing for multiscale biological tissues. J. Biophotonics 2018, 11, e201700187. [Google Scholar] [CrossRef]
  68. Ertürk, A.; Bradke, F. High-resolution imaging of entire organs by 3-dimensional imaging of solvent cleared organs (3DISCO). Exp. Neurol. 2013, 242, 57–64. [Google Scholar] [CrossRef]
  69. Ertürk, A.; Lafkas, D.; Chalouni, C. Imaging Cleared Intact Biological Systems at a Cellular Level by 3DISCO. JOVE J. Vis. Exp. 2014, e51382. [Google Scholar] [CrossRef] [PubMed] [Green Version]
Figure 1. Screening of fluorescent dyes. (A) The median nerve was labeled with FE, FR, FG, CTB-A488, CTB-A647, GB, and RB, respectively. Confocal images of spinal cord sections show that FG, FE, CTB-488, FR, and CTB-647 can successfully label motor neurons, and they are compatible with 3DISCO method. (B) Multi-labeling of motor neurons corresponding to the median (FG or FE) and ulnar nerves (FR). The presence of co-labeled neurons was associated with FG’s extensive diffusivity, which made FG be excluded from practical application. Arrowheads: co-labeled neurons.
Photonics 08 00145 g001
Figure 2. The 3D imaging of motor neurons of brachial plexus in the spinal cord. (A) The entire experimental process. (B) The screened tracers (FE, FR, and CTB-647) were used randomly to simultaneously label the ulnar, median, and radial nerves in the brachial plexus. (C) Maximum intensity z-projection of the image stacks of labeled motor neuron columns in the spinal cord. The enlarged images (10×/0.5 objective) indicated by white dotted box 1 show the distribution of three motor neuron columns corresponding to ulnar, median, and radial, respectively. The more enlarged images (20×/0.8 objective) indicated by white dotted box 2 show the motor neurons’ detailed morphology. (D) The distribution of three different motor neuron columns in the anterior horn of the spinal cord.
Photonics 08 00145 g002
Figure 3. Quantification of motor neurons of ulnar, median, and radial nerves. (A) The total number of neurons of each nerve (n = 6, one-way ANOVA, *** p < 0.001). (B) The number of neurons of each nerve in different spinal segments (n = 6, one-way ANOVA and non-parametric test, n.s. represents no significance, * p < 0.05, ** p < 0.01, *** p < 0.001). (C) The percentage of neurons in different spinal segments of each nerve (n = 6, one-way ANOVA, n.s. represents no significance, *** p < 0.001). The C4, C5, C6, C7, C8, T1, T2 represent the corresponding spinal nerve root. Data are presented as mean ± SD.
Photonics 08 00145 g003
Figure 4. Distribution characteristics of motor neurons of ulnar, median, and radial nerves. (A) 3D reconstruction of labeled motor neurons in the spinal cord. The motor neurons of the ulnar, median, and radial nerves were labeled by FE (green), CTB-A647 (red), and FR (blue), respectively. (B) The number distribution of motor neurons from the rostral to the caudal part of the spinal cord. The number of neurons was counted at an interval of 200 μm-length. (C) The relative positions of the motor neuron columns of the ulnar, median, and radial nerves at different depths. The cross-sectional images are maximum projections of z stacks (thickness = 200 μm) at different depths. The distribution ranges of motor neurons are highlighted with dotted lines.
Photonics 08 00145 g004
Table 1. Selection of fluorescent dyes.
Fluorescent DyesFG *GBCTB-A488FERBFRCTB-A647
Excitation (nm)
Emission (nm)
361460490494530555650
536505520521590580668
Labeling effectiveness+++++
Compatibility with 3DISCO+/++/++
*: FG has an extensive diffusivity that may lead to non-specific labeling. /: Not tested.
Publisher’s Note: MDPI stays neutral with regard to jurisdictional claims in published maps and institutional affiliations.

