Review

Spatial-Frequency Domain Imaging: An Emerging Depth-Varying and Wide-Field Technique for Optical Property Measurement of Biological Tissues

1
College of Information Engineering, Zhejiang A&F University, Hangzhou 310000, China
2
School of Engineering, Zhejiang A&F University, Hangzhou 310000, China
3
College of Biosystems Engineering and Food Science, Zhejiang University, Hangzhou 310000, China
*
Author to whom correspondence should be addressed.
Submission received: 24 March 2021 / Revised: 27 April 2021 / Accepted: 9 May 2021 / Published: 12 May 2021
(This article belongs to the Special Issue Tissue Optics)

Abstract

:
Measurement of optical properties is critical for understanding light-tissue interaction, properly interpreting measurement data, and gaining better knowledge of tissue physicochemical properties. However, conventional optical measuring techniques are limited in point measurement, which partly hinders the applications on characterizing spatial distribution and inhomogeneity of optical properties of biological tissues. Spatial-frequency domain imaging (SFDI), as an emerging non-contact, depth-varying and wide-field optical imaging technique, is capable of measuring the optical properties in a wide field-of-view on a pixel-by-pixel basis. This review first describes the typical SFDI system and the principle for estimating optical properties using the SFDI technique. Then, the applications of SFDI in the fields of biomedicine, as well as food and agriculture, are reviewed, including burn assessment, skin tissue evaluation, tumor tissue detection, brain tissue monitoring, and quality evaluation of agro-products. Finally, a discussion on the challenges and future perspectives of SFDI for optical property estimation is presented.

1. Introduction

Biological tissues are complex systems composed of different components with different structural, chemical, and optical characteristics which are commonly treated as turbid media in tissue optics. Diffraction, reflection, transmission, and other physically optical phenomena often occur in light-tissue interaction as light travels through the tissues [1,2]. Radiative transfer equation (RTE) can best describe light propagation in biological tissues. Great efforts have been made to solve the integro-differential form of the RTE analytically [3,4,5]. For example, Liemert et al. proposed an accurate and efficient solution of the RTE for modeling the propagation of photons in the three-dimensional anisotropically scattering half-space medium [6]. Recently, the same research team derived explicit analytical solutions for single-scattered radiance in a half-space medium under consideration of a reflecting boundary. They considered both a unidirectional beam source as well as an isotropic point source [7]. Diffusion approximation equation (DAE) is a simplified form of RTE and has been widely used for modeling the behavior of light transport in tissues [8]. The particle characteristic is taken into account, while the light fluctuation property and polarization effects are not considered in modeling light propagation through tissues. There are, hence, absorption and multiple scattering events between the incident photon packet and tissue particles. The propagation behavior through tissues can be characterized by the optical properties, such as absorption coefficient ( μ a ) and reduced scattering coefficient ( μ s ), which quantitatively describe the optical effects of absorption and scattering events in light transport. Optical properties of biological tissues can provide valuable information for clinical inspection and disease monitoring in biomedical optics, thus guiding the doctors to have more accurate diagnoses. For example, tumor tissues can be detected based on the differences of optical properties between the healthy and diseased tissues; so is the monitoring for skin blood flow. The measured optical properties can also be used for assessing quality and safety (e.g., firmness, soluble solids content, pesticide residue, etc.) of agro-products (e.g., apple, tomato, blueberry, etc.) [9,10,11]. Therefore, accurate measurement of tissue optical properties is of great significance in the field of biomedicine, as well as food and agricultural engineering.
Currently, existing optical methods for measuring optical properties of biological tissues can be divided into direct and indirect measurement methods [12,13,14,15]. The direct method is advantageous on independent mathematical model (e.g., Beer–Lambert Law) and simple data processing algorithm. However, this kind of method is limited in specific samples with strict conditions (e.g., thin thickness), and needs to be careful with the influence of stray light outside and reflection from the experimental device, such as the cuvette. In contrast, indirect methods can be performed on intact samples nondestructively, but need sophisticated instrumentation and complex mathematical models derived from the DAE. Recent studies have been mainly focused on indirect methods for estimating optical properties, because they are applicable to a wide range of biological materials without the need for sample preparations. Table 1 briefly summarizes the commonly used optical methods for measuring tissue optical properties, including collimated transmittance, integrating sphere (IS), time-domain (TR), frequency-domain (FD), spatially resolved (SR), and spatial-frequency domain imaging (SFDI). Reflectance and/or transmittance were first measured by these techniques, and then the optical properties (i.e., μ a , and μ s ) were estimated by using the inverse parameter estimation algorithms based on light transfer model. During the past years, these optical techniques have been widely used for measuring optical properties of different biological materials, such as human skin, brain, and tumor tissues [16,17,18]. However, most of these techniques (i.e., IS, TR, FD, and SR) employ a point light source for illuminating the target samples, which only enables one estimation of optical properties through single measurement. The estimated optical properties are treated as the average values in most cases, but cannot be used to describe the spatial distribution of tissue optical properties for the non-homogeneous turbid materials.
SFDI, as an emerging optical imaging technique, is capable of measuring the tissue optical properties in a wide-field area on a pixel-by-pixel basis [19]. Compared to other methods listed in Table 1 (i.e., IS, TR, FD, and SR), SFDI employs spatially modulated area lighting, instead of point lighting, for illuminating the turbid materials, and thus 2-D and even 3-D optical property mappings can be achieved through single measurement. In the SFDI technique, special patterns of 2-D illumination, usually sinusoidal patterns, with different spatial frequencies are projected onto the surface of a target sample, and the remitted diffuse reflectance is captured by using an imaging device (e.g., high-performance camera). Demodulation algorithms, such as three-phase demodulation [20], Gram–Schmidt orthonormalization [21], and spiral phase transform [22], are then applied to obtain the direct component (DC) image and alternating component (AC) image. Tissue optical properties can be finally determined by fitting the AC image based on inverse parameter estimations. Biological tissue acts as a low-pass filter, thus low-frequency lighting is more sensitive to absorption, while high-frequency component performs more effects on scattering [23]. Therefore, the SFDI technique provides potential for decoupling the absorption property from scattering property of biological tissues.
Owing to the capabilities of wide-field imaging, depth- and resolution-varying characterizing for biological tissues, SFDI has witnessed great progress in measuring optical properties [20]. The estimated optical property values and/or mappings provide valuable information for disease diagnosis, evaluation, and monitoring in biomedical domain, as well as quality assessment in the food and agricultural engineering domain. This paper first provides an overview of the principle of SFDI technique for estimating optical properties of biological tissues. Then applications, based on published literature, for burn assessment, skin tissue evaluation, tumor tissue detection, brain tissue monitoring, and quality assessment of agro-products, are reviewed. Finally, challenges and future perspectives of SFDI for measuring optical properties are discussed.

2. Principles and Methods

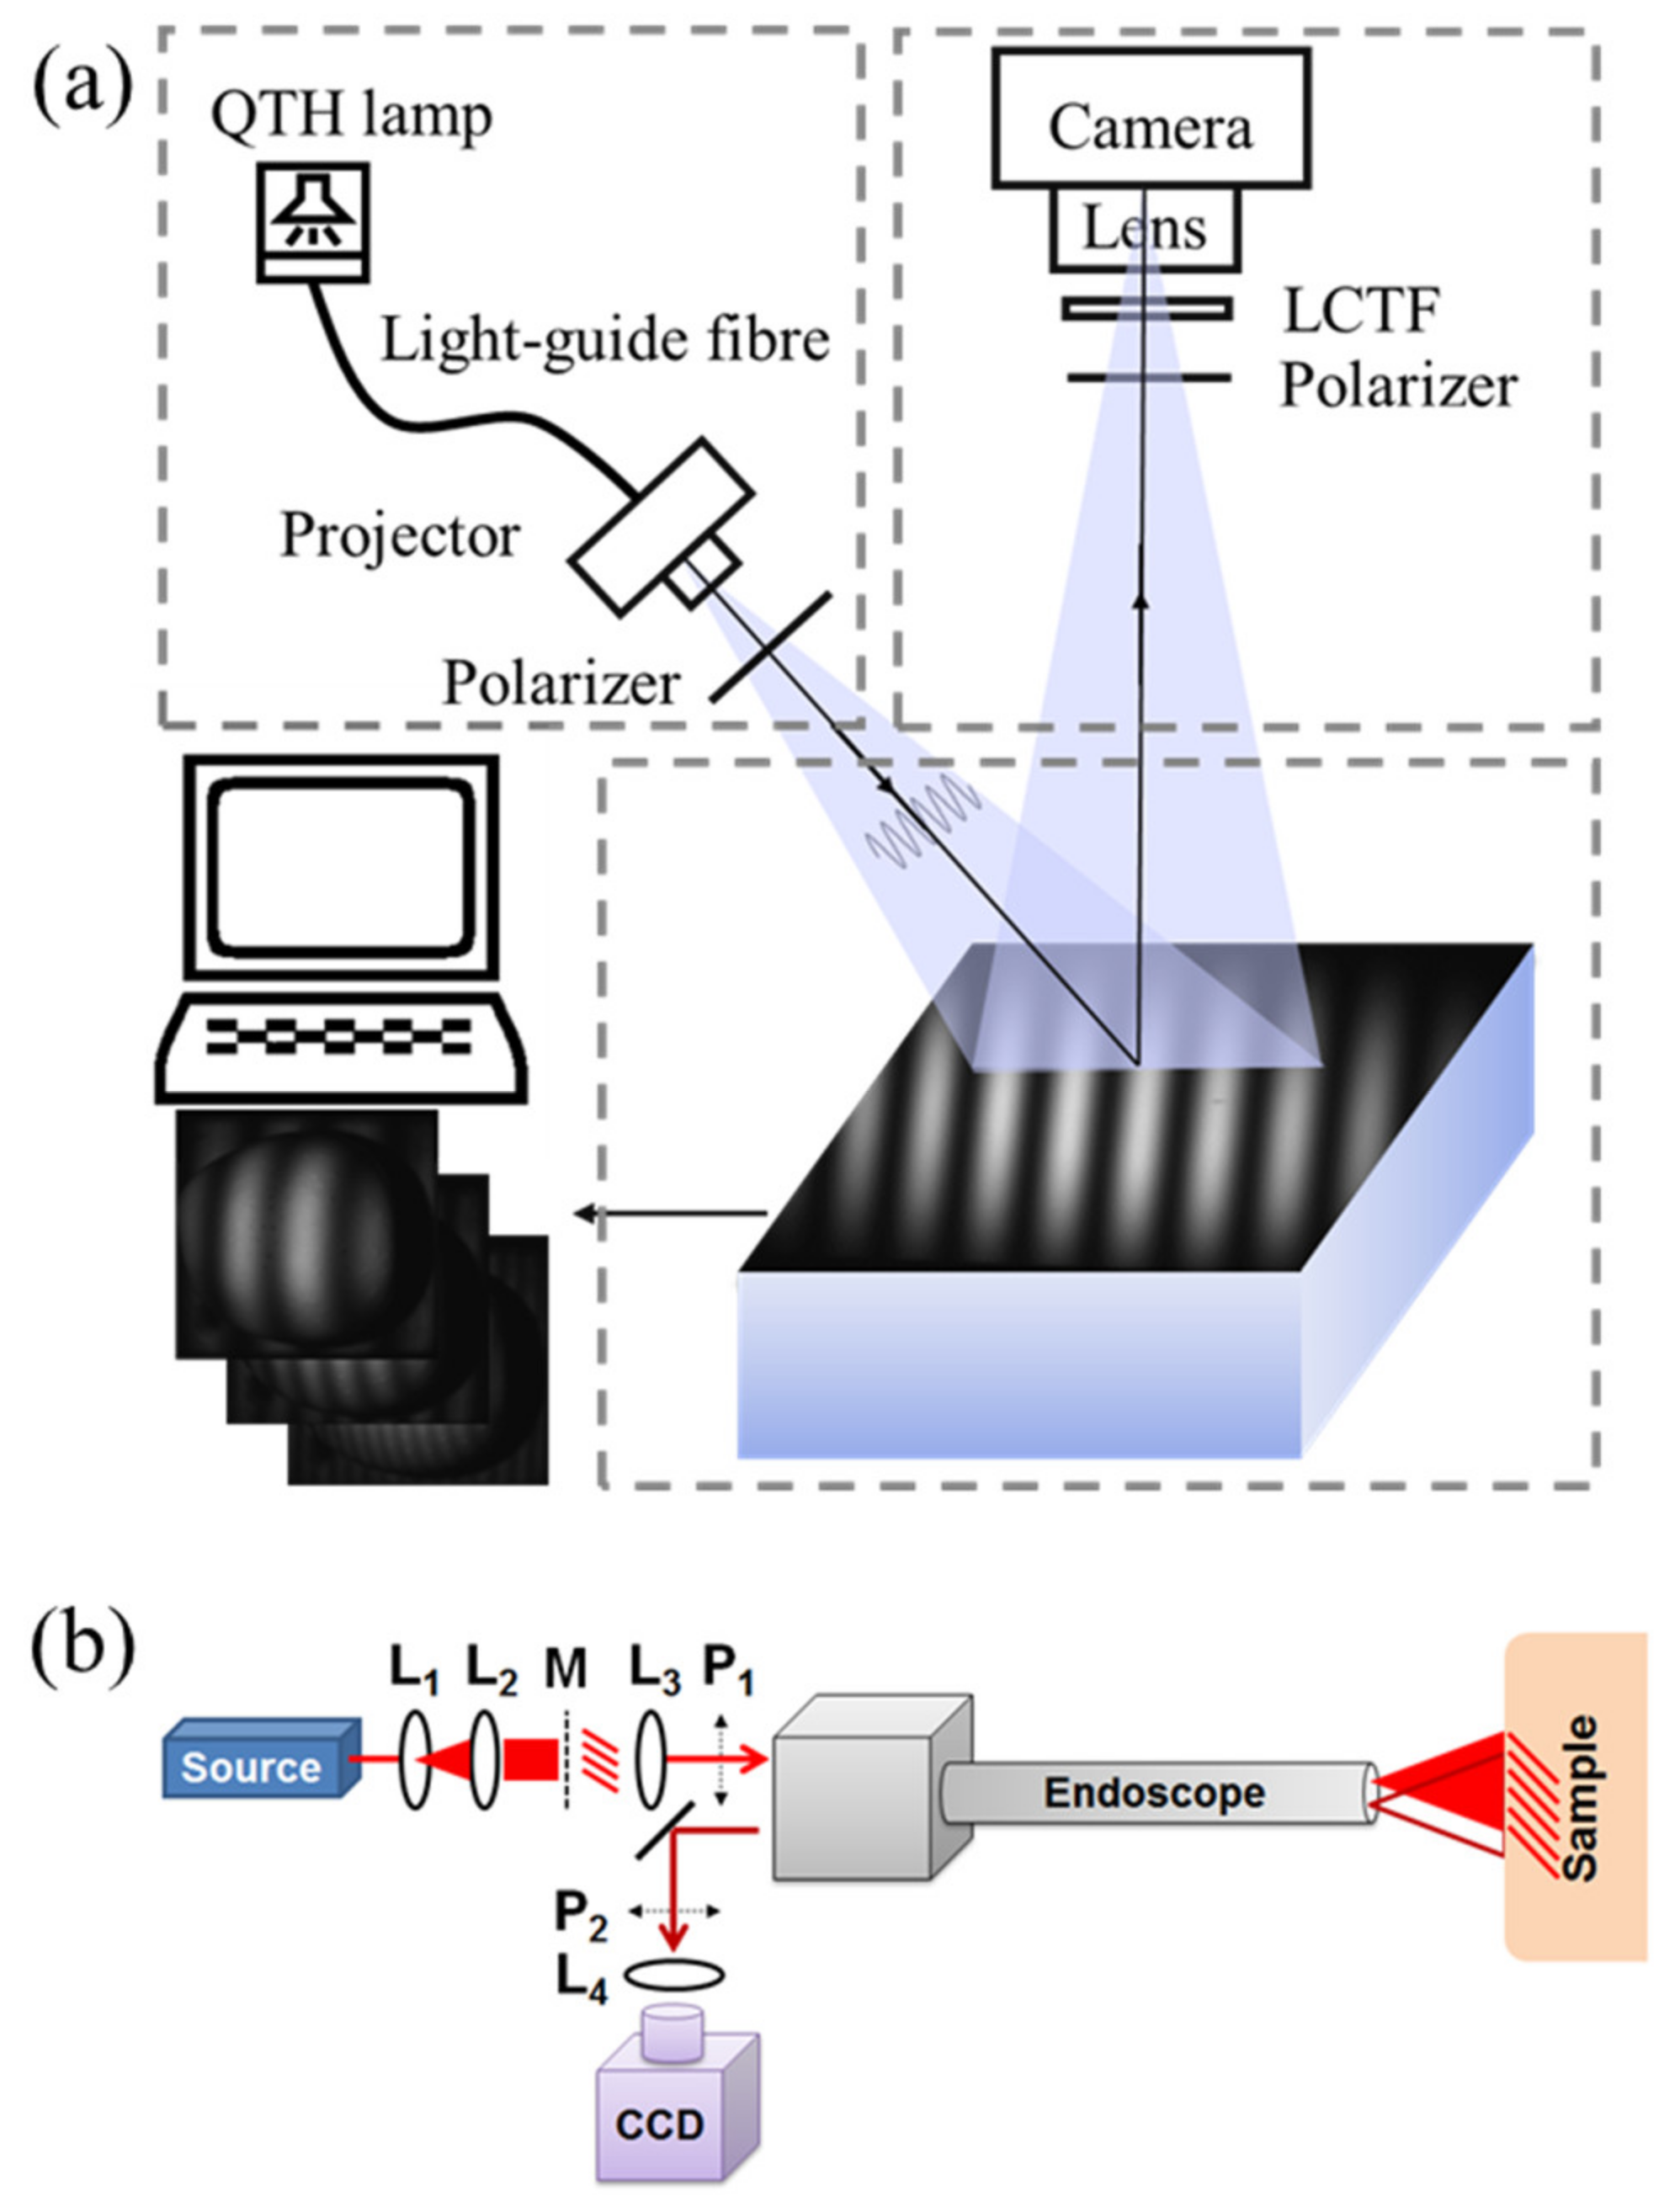
2.1. Typical SFDI System

As shown in Figure 1a, a typical SFDI system mainly consists of three parts: projection, imaging, and sampling [31,32,33], which are specifically selected based on experimental or practical requirements. An ordinary commercial projector is commonly used in the projection part due to the low cost and easy-to-use property. The light engine produced by Digital Light Innovations in Austin, TX, USA (e.g., model DLi CEL5500) is a better choice for projecting patterns and has been widely used in the SFDI system, since it can obtain high brightness, high definition, and real color images. When selecting the projecting part, the performance, like frame rate, bit depth, and resolution, should be carefully considered because the specific requirements for experimental research and engineering application are different. Considering varying tissue properties at different wavelengths (e.g., 470, 525, 590, 625, 658, 690, 730, 850, and 970 nm), a wavelength dispersion device, such as liquid crystal tunable filter (LCTF) and band-pass filter, is used for selecting required wavelengths in the case of broadband quartz halogen tungsten lamp. Discrete light source (e.g., LED with single wavelength) is another choice to have the predetermined wavelength based on preliminary experiments. An imaging device (e.g., high-performance camera), coupled with a prime lens, is used to acquire the remitted light intensity images under structured illuminations with different frequencies and phases. Performance of the imaging device needs to be higher than that of the projector. For example, if the frame rate of the projector is 30 fps, the frame rate of the imaging device is better at 60 fps, so that the change of the projection can be collected. It was reported that it took about 10 min to acquire three-phase-images for 30 frequencies at four different wavelengths (a total of 360 images), with a field-of-view about 5 × 5 cm [34]. A computer is connected with the projector and imaging device to control output of the lighting patterns (i.e., frequency and phase), and acquire and preserve the remitted images at different wavelengths. It should be noted that the pattern projection and image acquisition should be triggered simultaneously. A pair of linear polarizers is put in the projection and imaging parts to reduce and even eliminate specular reflection from the sample surface. Target samples are placed on the sampling stage, which has an adjustable height, allowing a consistent distance between the sample surface and imaging device. It is desirable to have the sampling part move along the horizontal axis, so that the SFDI system can be applied to the real-time applications. Note that most of the SFDI systems used in the published literature are constructed by the researchers, and the SFDI device manufactured and produced by the Modulim Incorporation for research purposes, called Clarifi® (https://modulim.com/, accessed on 23 March 2021), has also been used in some studies [35,36,37,38].
Figure 1b depicts the optical design of an endoscopic imaging system [39]. The fundamentals of imaging in the spatial-frequency domain are preserved, starting with a light source. Given a source with a fiber output, lenses L1 and L2 are used to expand and collimate the beam onto a mask M of a sinusoidal pattern. The image of the illuminated pattern is then collimated by L3 and polarized by linear polarizer P1 as it is sent through the projection channel of the endoscope and onto the sample. The reflected light is imaged through the collection channel of the endoscope. The collimated output is cross-polarized with respect to P1 by linear polarizer P2 and then imaged by objective lens L4 onto the CCD. This design combines the endoscope with SFDI, which makes it possible to measure optical properties of endoscope in real-time with a large field-of-view.

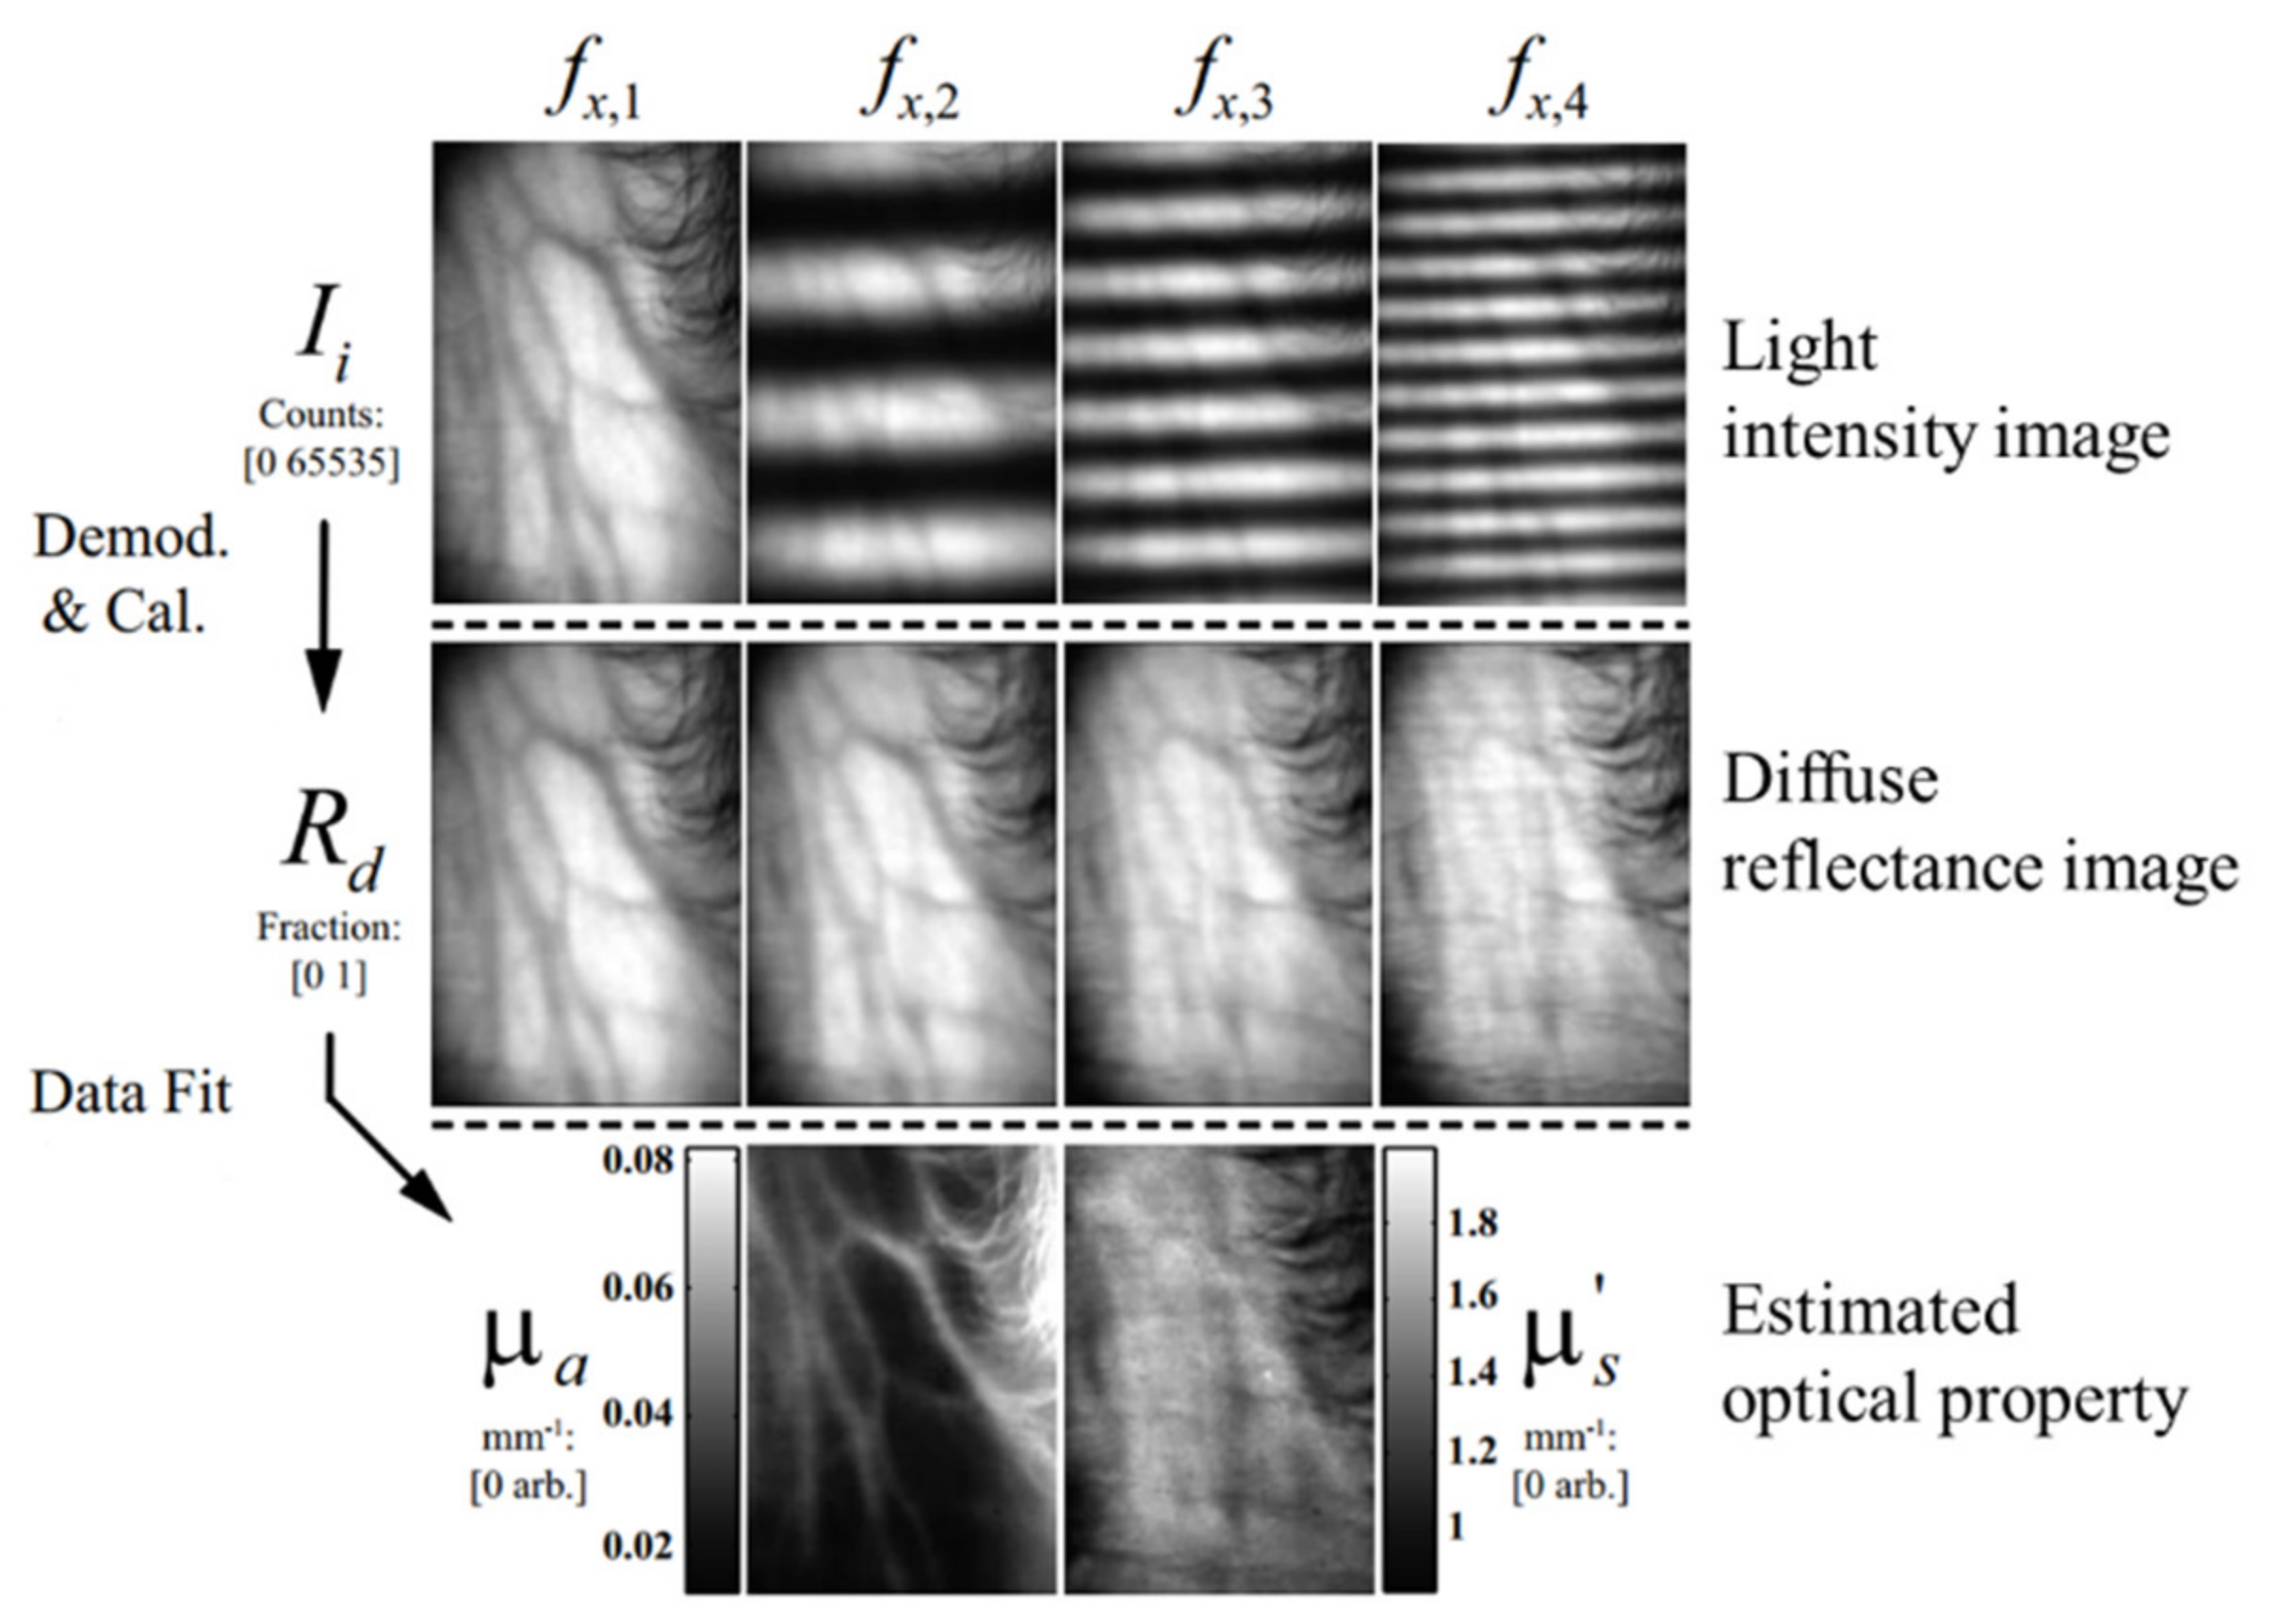
2.2. Principle of SFDI for Estimating Optical Properties

The process of optical property estimation of biological tissues using SFDI can be roughly divided into three steps: measurement of light intensity image remitted from the target sample, acquisition of diffuse reflectance image through demodulation algorithm, and inverse parameter estimation of optical properties from the demodulated image (Figure 2). Reflected light intensity images under the incidence of multiple spatially modulated patterns with different spatial frequencies (the number of black and white stripes per unit length) and phases are first captured [40,41,42,43,44]. Then, demodulated diffuse reflectance images at every frequency are obtained by using appropriate image demodulation algorithm, such as three-phase demodulation, Gram–Schmidt orthonormalization, and spiral phase transform. Finally, based on appropriate light transfer models, such as DAE and Monte Carlo [45,46,47,48], optical absorption and reduced scattering coefficients of biological tissue can be estimated by using inverse parameter estimation algorithms, like nonlinear fitting algorithm [49] and look-up table [50,51,52].
Assuming that light intensity function of the incident structured illumination on sample surface is [20]:
S = S 0 2 1 + M 0 cos 2 π f x x + α
where S 0 , M 0 , f x , x and α denote the illumination intensity, spatial modulation depth, spatial frequency, spatial coordinate, and spatial phase of the light source, respectively.
Light intensity image is obtained by capturing the remitted light from the sample surface. The intensity of illumination I x , f x can be decomposed into DC part I D C x and AC part I A C x , f x .
I x , f x = I D C x + I A C x , f x
I D C x is constant for different spatial frequencies, while I A C x , f x is a function of spatial location and frequency, which can be expressed:
I A C = M A C x , f x · cos 2 π f x x + α
where M A C is the amplitude envelope of reflected photon density, which is related to tissue optical properties. Generally, the three-phase demodulation method is used to get the value of M A C . In this method, three sinusoidal waves with specific spatial-frequency f x at three initial phases (0,   2 π 3 and 4 π 3 ) are used to illuminate the sample, then the M A C can be expressed as:
M A C x , f x = 2 3 I A C 1 x , f x I A C 2 x , f x 2 + I A C 2 x , f x I A C 3 x , f x 2 + I A C 3 x , f x I A C 1 x , f x 2 1 2
M A C is related to modulation transfer function M T F s y s t e m , diffuse reflectance R d , and light source intensity I 0 , as shown in Equation (5).
M A C = I 0 · M T F s y s t e m x , f x · R d x , f x
Hence, a reference sample with known optical properties, such as optical object or a white plate with calibrated reflectance, is often taken as the reference to calibrate the SFDI system for optical property estimation. The diffuse reflectance R d of target samples can be thus calibrated and expressed as:
R d x , f x = M A C x , f x M A C , r e f x , f x · R d , r e f x , f x
where R d , r e f x , f x is diffuse reflectance of the reference sample, and M A C , r e f can be obtained using Equation (4). By applying appropriate boundary conditions, the reflectance, spatial frequency, absorption coefficient ( μ a ), and reduced scattering coefficient ( μ s ) have the following relationship, which was derived from the DAE by Cuccia [20]:
R d f x = 3 A   μ s / μ t r μ e f f / μ t r + 1 μ e f f / μ t r + 3 A
where μ t r = μ a + μ s is the transport coefficient, A = 1 R e f f 2 1 + R e f f , R e f f = 0.0636 n + 0.668 + 0.71 n 1.44 n 2 is the effective reflection coefficient, and n is the refractive index. The μ e f f can be expressed as:
μ e f f = 3 μ a μ t r + K 2 1 2
where K = 2 π f x .
Hence, μ a and μ s of the sample can be deduced by using appropriate inverse parameter estimation algorithm by fitting the solution of DAE (Equation (7)). Though the DAE has been widely used as the light transfer model for optical property measurement in SFDI, the accuracy and versatility are partly hindered by its approximation nature with two constraining conditions (i.e., scattering-dominant tissue, and relatively small illumination-frequency). Thus, there are inaccurate measurements of optical properties for highly absorbed tissues when using the DAE, such as strong absorption tissue caused by water in the near-infrared wavelength. High frequency for the spatially varying illumination would lead to sub-diffusive reflection, which is also not suitable to be solved using Equation (7). Moreover, the scattering phase function, which describes the scattering angle probability of photons in biological tissues, should also be considered when estimating optical properties based on the DAE [4,5]. MC, as a numerical method for modelling light propagation within tissues, launches and tracks a large number of photon packets in the simulation process, and diffuse reflectance can be calculated based on the theory of probability and mathematical statistics. MC is simple in operation and easy to be implemented with any desired accuracy, if the time cost is affordable. Based on MC simulation, another optical property measurement method in SFDI, called look-up table, has been emerging recently, which can perform rapid calculation of optical properties, generated from diffusion model forward predictions [20,52].
As mentioned above, the three-phase demodulation method is usually used for image demodulation, which is the key step in SFDI. This method can provide relatively high accuracy in optical property measurement, at the expense of being time-consuming, which hinders the real-time application of SFDI. To overcome this shortcoming, a novel image demodulation and inverse estimation method was proposed and developed, which allowed researchers to determine the optical properties using a single phase-image, called single snapshot of optical properties (SSOP). Reliant on Fourier transform and data processing in the frequency space, SSOP at least requires two images with one phase-image for each of the two spatial frequencies [53,54,55]. SSOP reduces the number of phase-images from three to one, which improves the efficiency of both image acquisition and data processing by about three times. Compared to the conventional three-phase demodulation and inverse estimation, SSOP loses some image information since it only has one phase-image, resulting in lower accuracy for optical property measurement.

3. Applications

Dognitz et al. [56] first investigated the potential of spatially modulated area lighting by employing a xenon lamp with a band-pass filter to illuminate a patterned glass plate and generate a circular modulation pattern. A CCD camera was used for capturing the reflected image of the sample at three different modulated frequencies (i.e., 0.10, 0.16, and 0.50 mm−1). The results indicated that SFDI was capable of measuring the absorption and reduced scattering coefficients noninvasively. However, the value of their work was not recognized by the scientific community at that time. Thanks to the rapid advances in digital technology and computing technology, great progress has been made in the development of spatially resolved and time-domain techniques for measuring optical properties of biological tissues, which, in turn, can be routinely used for chemical composition prediction and functional analysis [57]. Therefore, the researchers began to renew their interest in spatial-frequency domain imaging after the arrival of the twenty-first century. In 2005, Cuccia et al. applied the SFDI technique for the measurement and analysis of wide-field mapping of tissue optical properties [30]. They used a modulation pattern with the frequency of 0–0.6 mm−1 at 640 nm, demonstrating that SFDI was a fast and inexpensive method for tomographic imaging and quantitative optical property mapping in a wide field-of-view. The conceptual framework, hardware composition, and software algorithm proposed in their study have been widely used for optical property estimation by other researchers. The estimated optical properties can be used in the field of biomedical optics for inspecting breast tumors and non-melanoma tumor lesions, as well as in the food and agricultural domain for apple internal browning and early bruise detection. The following sections present more details regarding the practical applications of SFDI.

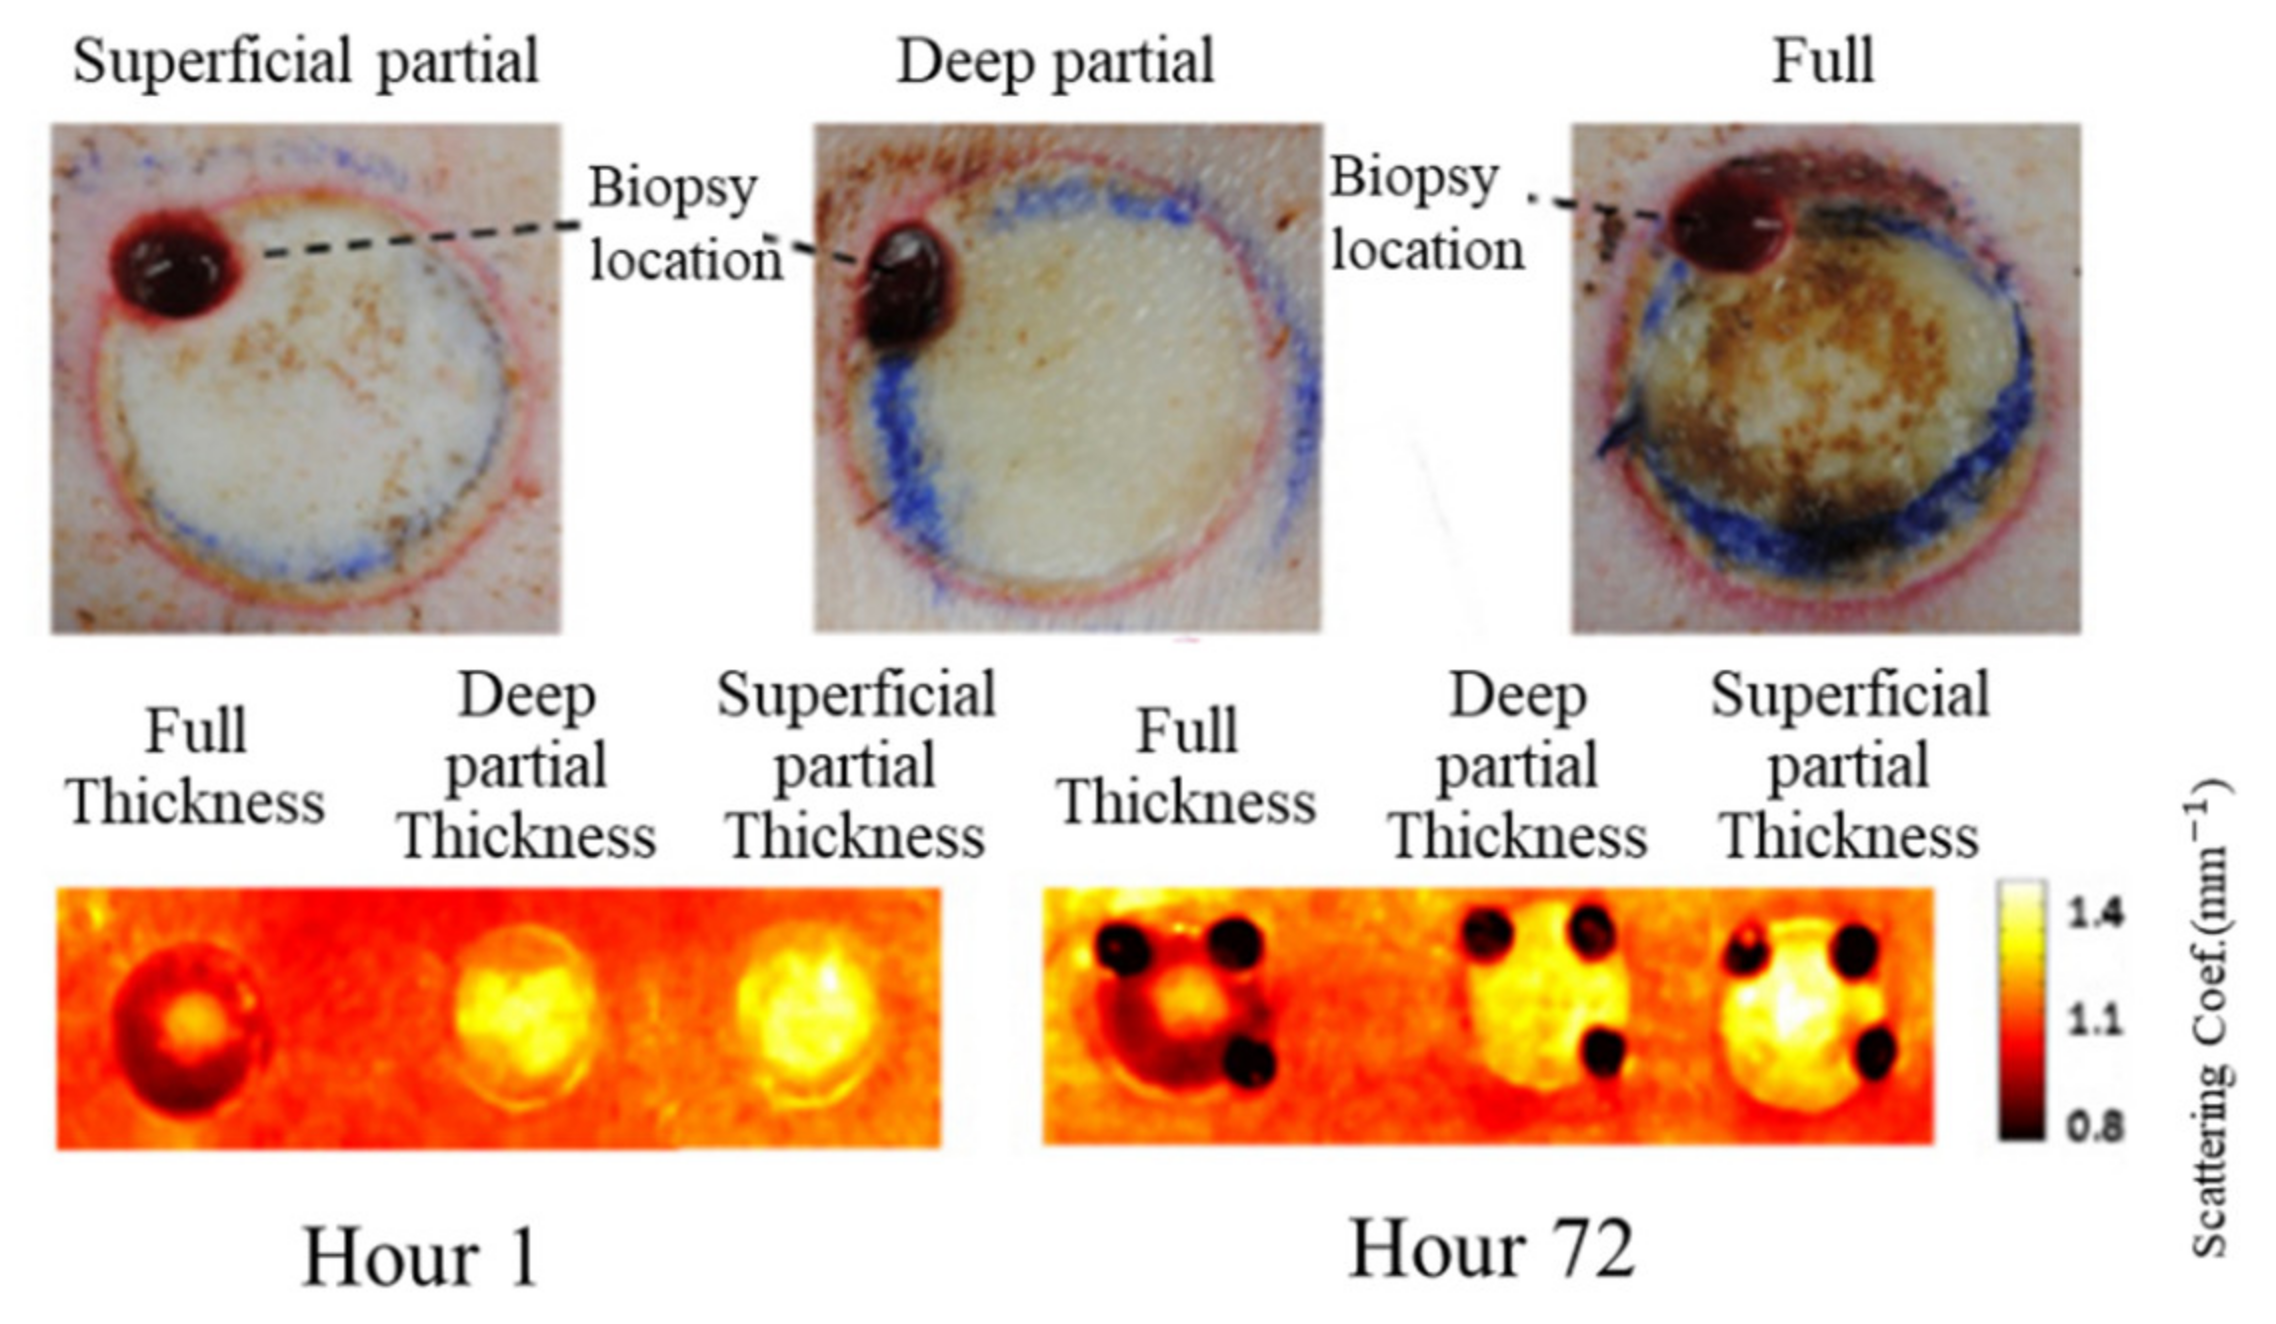
3.1. Burn Assessment

Burn is a common affliction which usually causes damage to the skin, mucous membrane, subcutaneous and submucosal tissues, and even some complications. Accurate detection of burn location and severity is critical for determining the scheme for the treatment and recovery. Thanks to the advantages of SFDI for depth-varying characterizing of biological tissues, it has been applied for surface and subsurface burn detection.
The potential of SFDI for burn assessment was first explored in a rat model, with a graded control scheme for detecting burn severity [58]. The results showed that SFDI technique was capable of quantitatively and noninvasively assessing the burn wound severity, which could assist clinicians to better identify burn areas. Due to the small skin area of rats, it is difficult to realize the artificial controllable burn models; thus, the pig has appeared as a new model for burn assessment [59,60,61]. Mazhar et al. measured 48 cases of severe heat burns in a pig model, and monitored functional and structural parameters of each burn type for more than 72 h [37]. Ponticorvo et al. and Burmeister et al. imaged wounds on the back of pigs with different burn degrees and calculated the absorption coefficient based on Monte Carlo simulation [62]. It was proven that SFDI could reflect the changes of skin parameters after the burns. Ponticorvo et al. shifted their focus to burn care in an attempt to help quantify not only burn depth but also the progress of healing [19]. They showed that SFDI coupled with laser speckle imaging was capable of monitoring changes in hemodynamic and scattering properties in burn wounds over a 28-day period. These results highlighted the potential insights that can be gained by using SFDI to study wound healing.
Table 2 lists the recent applications of burn assessment by using the SFDI technique, including the test sample, measured optical property, indicator, frequency, and wavelength used in the experimental research. It can be observed that frequencies lower than 0.20 mm−1 were frequently used, because low-frequency illumination has larger light penetration depth, which is suitable for detecting the subsurface burns. Visible lighting is still the popular illumination and wavelengths beyond the visible range are lower than 1000 nm. Near-infrared lighting may have abilities in penetrating deeper tissues, but requires more expensive instrumentation, such as imaging and wavelength dispersion devices. Most of the research in Table 2 was conducted on pigs and mice to create artificial burn wounds of different levels. Both μ a and μ s could be used to examine the skin burns by comparing the differences of measured optical property between healthy and burned tissues. Relative changes in oxygenated hemoglobin concentration (HbO2), deoxygenated hemoglobin concentration (Hb), total hemoglobin concentration (HbT), and blood oxygen saturation (StO2) could be used to present the skin condition. StO2 was more frequently used as an index of burn assessment due to its ability in revealing vascular damage and patency. Figure 3 shows typical results of burn assessment for porcine dorsal skin with three levels (i.e., superficial partial, deep partial, and full). It was found that the reduced scattering coefficients of porcine dorsal skin with burns were smaller than those without burns, indicating that the reduced scattering coefficient mappings estimated by the SFDI were capable of burn detection.
A large number of animal experiments on burn assessment have achieved acceptable results, which gives researchers full confidence in the feasibility of applying the SFDI to human beings for burn assessment. Recently, Poon et al. evaluated the burn severity of human tissues using SFDI [63]. The thermal burn treatment of skin obtained during plastic surgery was used as experimental material. Monte Carlo simulation was adopted to replace the DAE for inversely estimating optical properties. Experimental results showed that SFDI could be used for early evaluation of burns in human beings.

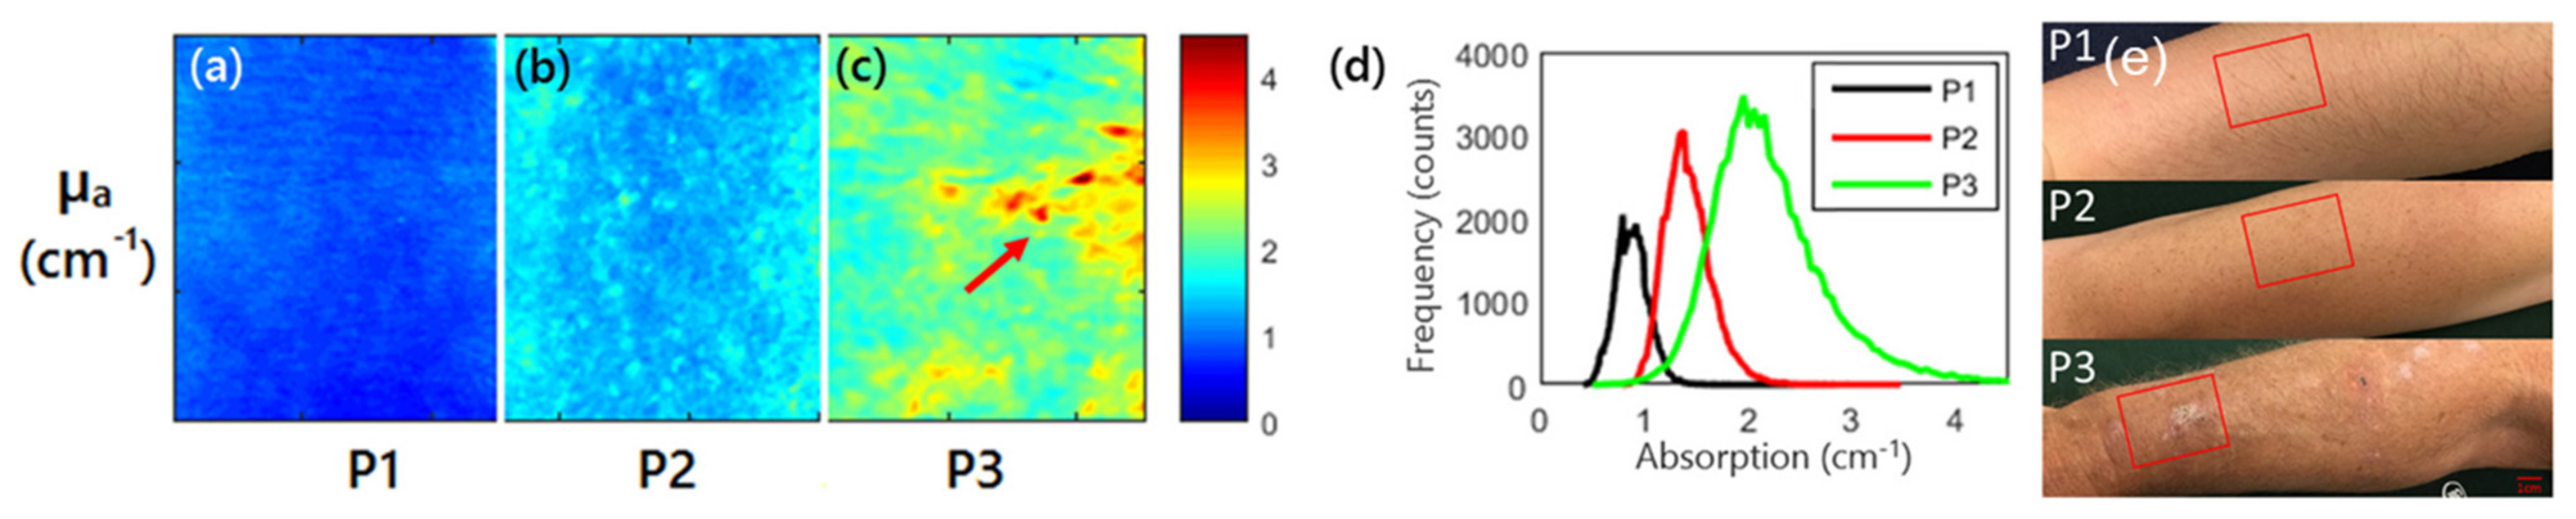
3.2. Skin Tissue Evaluation

Body skin tissue contains melanin, oxyhemoglobin, deoxyhemoglobin, and many other physicochemical constituents. Among them, melanin content and oxygen saturation can reflect the skin health status and provide much valuable information in detecting skin diseases, such as port wine stain (PWS), actinic keratosis (AK), and pressure ulcers. SFDI is advantageous in measuring these indices by extracting and mapping tissue optical properties, which can be used to evaluate the skin tissue.
Cuccia et al. first employed modulated lighting to measure the optical properties of forearm skin tissue, and the extracted optical properties can help detect the accumulation and dissipation of blood volume for the human skin tissue [20]. After that, Chen et al. extended the application of SFDI in skin tissue evaluation by decoupling the absorption of melanin from that of hemoglobin successfully [66]. The measured absorption coefficients were used to predict hemoglobin concentration and oxygen saturation of the skin.
On this basis, Mazhar et al. applied SFDI for recording the biochemical changes of PWS after laser treatment [18]. It was proven that SFDI could present biochemical components of wide-field tissues after laser treatment of PWS lesions. Similarly, the SFDI technique was also employed by Saager et al. for imaging skin cancer lesions [67]. The results demonstrated that SFDI is a new modality which can provide parameter information for photodynamic therapy (PDT), so as to provide more quantitative and controllable dosimetry for lesions.
Furthermore, SFDI has been applied for evaluating other skin diseases, such as AK and pressure ulcers. Travers et al. measured the changes of optical properties and vascular parameters of skin tissue suffering from mild light damage to AK by SFDI [68]. The results showed that SFDI could provide quantitative maps of optical and vascular parameters of precancerous lesions like human actinic keratosis, and also feedback on the process of precancerous lesions transforming into malignant lesions. Figure 4 shows absorption and histogram imaging maps for three patients at 590 nm. It was observed that the value of absorption coefficient of the patient suffering from AK (P3 in Figure 4) was larger than the patient without AK (P1, P2 in Figure 4), which was an early biomarker for evaluating AK. In addition, Yafi et al. used SFDI for detecting pressure ulcers, indicating that SFDI has the potential for risk stratification and healing of pressure ulcers [69]. Recently, Gevaux et al. investigated the potential of combining hyperspectral imaging with SFDI to estimate mappings of absorption and scattering properties of human face skin independently from irradiance drifts [70]. This study showed the feasibility of this method, but additional measurements on calibrated samples are required to fully identify its limitations and sensitivity to errors. Combining SFDI with other optical techniques, such as diffuse reflectance spectroscopy, for imaging a human prostate, demonstrated the ability for distinguishing prostatic tissue (anterior stroma, hyperplasia, and peripheral zone) from extra-prostatic tissue (urethra, ejaculatory ducts, and peri-prostatic tissue) [65].

3.3. Tumor Tissue Detection

Accurate measurement of tumor size and edge is critical for removing the tumor in clinical surgery. Due to the differences of optical properties between tumor tissue and normal tissue, SFDI provides potential for detecting tumor tissue. Diverse tumor tissues, such as non-melanoma tissues, breast cancer tissues, and skin cancer tissues, have been successfully detected by using the SFDI. Researchers decoupled the absorption of melanin and hemoglobin from scattering, measured the hemoglobin concentration and oxygen saturation of the skin, as well as estimated the scattering characteristics of the skin in real time.
Rohrbach et al. demonstrated that combination of SFDI with ultrasound imaging was capable of inspecting non-melanoma skin cancer, and SFDI could characterize non-melanoma skin cancer phototherapy independently [16,71]. They concluded that SFDI could monitor the changes of optical and vascular parameters in real time, thus providing references for clinical surgery. Human ovarian tissues, cervical cancer and bladder tumor tissues were also researched by the biomedical engineers using the SFDI [72,73,74]. It was reported that the information derived from SFDI could provide significant contrast and differentiation between microstructure parameters of different tissue types and disease states, thus enabling tumor detection in these tissues.
SFDI was also used in breast cancer detection. Laughney et al. conducted studies on detecting breast tissue excised during surgery using the SFDI technique [34,75]. The results showed that SFDI could maintain the sensitivity to local scattering contrast in a wide range, which indicated that SFDI is suitable for the edge assessment of breast surgery. Figure 5 shows representative spectral parameter maps for tissue subtypes (i.e., normal, fibroadenoma, ductal carcinoma in situ (DCIS), invasive cancer, and partially treated invasive cancer after neoadjuvant chemotherapy). The extracted parameter maps, such as histology, scattering amplitude, scattering slope, hemoglobin, oxygen, and water maps, were valuable for tumor detection. Furthermore, the detection of breast tumor tissue by SFDI was not limited to the samples excised during surgery, and it was also used in breast tumor in vivo detection. For example, Nguyen et al. applied SFDI to breast reconstruction with perforator flaps [76]. The results suggested that SFDI could provide intraoperative oxygenation images in real time during surgery. With the use of this technique, surgeons can obtain tissue oxygenation and hemoglobin concentration mappings to assist in intraoperative planning. In order to explore the ability of SFDI in detecting different breast tumor tissues, McClatchy et al. studied both freshly homogeneous and heterogeneous resected samples of human breast tissue [77]. The results demonstrated that SFDI provided mappings of microscopic structural biomarkers that cannot be obtained with diffuse imaging (e.g., hyperspectral imaging), as well as characterized spatial variations not resolved by point-based optical sampling (e.g., spatially resolved). In order to further study the imaging ability of SFDI on tumor tissue detection, McClatchy et al., Robbins et al., and Wei et al. conducted SFDI research on different breast tumor tissue samples, and the results confirmed that SFDI could provide a wide-field mapping of scattering parameters for microscopic evaluation and distinguish different breast tissue morphology [78,79,80]. Table 3 summarizes some recent studies on detecting breast tumor by using the SFDI technique. It can be observed that, in general, μ a of tumor tissue is higher than that of normal tissue, while μ s is lower than that of normal tissue. However, the cervical tissue and bladder tumor tissue are the exceptions, with the μ s values being larger than that of normal tissue.
Great efforts have been made to combine the SFDI with other mature techniques to detect tumor on small animals. For instance, Zhao et al. [83] applied the correction of modified sensor to SFDI and conducted a longitudinal drug response study on subcutaneous tumor models of small animals. They suggested that SFDI could transform optical biomarkers of therapeutic response and drug resistance into imaging in vivo. Nandy et al. combined SFDI with rigid endoscopy for imaging a tumor model of a living mouse, which expanded the universality of SFDI application [81]. In the study of Burns et al., mouse tumor models were imaged by SFDI for tumor visualization [84]. They demonstrated that nanovesicles derived from erythrocytes and doped with an NIR chromophore (indocyanine green) could be used in conjunction with SFDI to visualize simulated tumors with different depths and concentration of NIR erythrocyte mimicking transducers within tissue mimicking objects. Moreover, Tabassu et al. employed SFDI for detecting tumor tissue in mice, and a two-layered look-up table model was proposed to improve the identification ability [82]. The two-layered look-up table model was shown to substantially improve the ability of SFDI in the extraction of bottom (tumor) layer’s optical properties, which revealed larger treatment changes in the tumor’s optical properties and a more hypoxic tumor environment.

3.4. Brain Tissue Monitoring

Brain is the main part of the central nervous system and main regulator of vital function. Quantitative measurements of absorption and reduced scattering coefficients of brain tissue can help to describe changes in brain function.
In 2011, Lin et al. used SFDI to conduct optical imaging of brain tissue in mice with Alzheimer’s disease (AD) [17]. The results showed that SFDI could measure quantitative absorption and reduced scattering coefficients of AD model, which can be used to investigate the structural and physiological changes of AD nerve tissue. In a follow-up experimental study, they focused on 3-month-old male CaM/Tet-DTA mice harboring transgenes for the doxycyline-regulated neuronal expression of diphtheria toxin [85]. When doxycycline was removed from the diet, CaM/Tet-DTA mice developed progressive neuronal loss in forebrain neurons. The results demonstrated that neuronal death and brain inflammation were associated with increased values of μ s and this optical biomarker may be useful in pre-clinical AD therapy evaluation or monitoring of disease progression in AD patients. Singh-Moon et al. employed SFDI for evaluating the transport of cationic lipids in the arteries of rats with transient cerebral hypoperfusion to brain tissue, which was the first study to use SFDI for measuring drug uptake in postmortem tissue samples [86]. In the study, they obtained a spatial mapping of drug or tracer deposition for further generation of a dataset. Wilson et al. imaged the brain tissue of mice using square wave image and verified that multispectral SFDI (i.e., 655, 730, and 850 nm) could detect oxygen extraction in the brain as the brain resumed metabolism and electrical activity [87]. Their work enabled concurrent characterization of dynamic changes in tissue hemoglobin concentration, oxygenation, and scattering in an animal model of cardiac arrest and resuscitation. Sibai et al. indicated that implementing SFDI with a fluorescent-light transport model enabled recovery of 2-D images of PpIX, alleviating the need for time-consuming point sampling of the brain surface [88]. Despite the moderate errors in retrieving the absorption and reduced scattering coefficients in the sub-diffusive regime with the values of 14% and 19%, respectively, the recovered PpIX maps were within 10% of the point PpIX values measured by the fiber-optic probe, validating its potential as an extension or an alternative to point sampling during glioma resection. Recently, a method based on SFDI platform and different back-processing algorithms for measuring the refractive index (RI) of mouse brain tissue in the NIR spectral range was proposed by Abookasis et al. [89]. The changes in RI reflected the pathophysiology of the brain during heat stress and presented an additional advantage of SFDI for characterizing brain function. Figure 6 shows a series of 2-D false-color spatial maps of the RI at different wavelengths for two extreme temperatures of 28 °C and 43 °C, indicating that change in temperature leads to localized changes in RI within the brain surface and SFDI was capable of describing the characteristics and functions of the brain tissue.

3.5. Quality Evaluation of Agro-Products

In the field of food and agricultural engineering, SFDI is also involved in the quality evaluation of agricultural products. As early as 2007, Anderson et al. measured the optical properties of normal and damaged apple tissues using the SFDI technique [10]. The results showed that the reduced scattering coefficient of damaged apple tissues was larger than those of normal tissues, demonstrating that SFDI can differentiate the damaged apple from normal fruit. This is the first exploration and application of SFDI in the field of agricultural engineering. However, there was no research reported in the next few years. Until the year 2015, when the researchers in the food and agricultural engineering domain turned their attention back to the SFDI technique for optical property estimation. There are now two leading research groups working on the topic of SFDI technique in the field of agriculture. One is the Intelligent Bio-industrial Equipment Innovation Team (IBE) in Zhejiang University, which has established and developed the SFDI system for measuring optical properties of pear and apple fruit [90,91,92,93]. The measured optical properties are then used for quality evaluation, such as apple internal browning inspection and pear bruise detection. Recently, Hu et al. combined SFDI with frequency optimization to estimate the optical properties of two-layered tissues [94], indicating that the estimation accuracy of the absorption coefficient and reduced scattering coefficient of the second layer was 63.0% and 62.1% improvement, compared to that estimated with fixed frequency. These results are valuable for decoupling the effect of peel tissue of agro-products (e.g., apple, tomato, and peach) from flesh tissue on optical property estimation, as well as on quality assessment. The other group is the postharvest engineering laboratory at Michigan State University. A multispectral SFDI system was established and developed for optical property estimation and food quality evaluation, especially for early apple bruise and defect detection. Inverse algorithms for optical property estimation are optimized for accuracy improvement [10,95,96]. In addition, early apple bruise and surface imperfections are detected [21,22,97,98,99], and the 3-D structure of agro-products are reconstructed [100]. Overall, the study of SFDI in the food and agricultural engineering domain started relatively late and mainly focused on quality evaluation (e.g., early bruise, internal browning, chilling injury, etc.) of agro-products, including apple, pear, peach, tomato, and cucumber. The SFDI technique can be extended to measure optical properties of more agro-products in the future, which can be used to correlate with more quality attributes, such as firmness, soluble solids content, and defects.

4. Challenges and Future Perspectives

Over the past two decades, we have seen significant research efforts in the development and application of SFDI technique for measuring optical properties of biological tissues. While this emerging technique offers new opportunities for disease diagnosis, evaluation and monitoring in biomedical domain, as well as quality assessment of agro-products in food and agricultural domain, there are still considerable issues and challenges in using the technique. First, current modulation illumination patterns used in SFDI are mostly sinusoidal patterns, while some are square waves or ring patterns. However, the irregularity of tissue shape and structure always causes difficulties in the projection of modulation patterns, since the tissue surface condition (e.g., uneven, heterogeneous) can affect the accuracy of optical property estimations. Hence, parameter estimation algorithm for correcting tissue irregularity was studied and proposed. Nguyen et al. [101] studied curvature correction for reducing the incorrect measurement of optical properties due to surface profile, while Nothelfer et al. proposed a new method for correcting surface scattering in SFDI for an accurate determination of volume scattering [102]. There are also some other correction methods, such as phase-measuring profilometry, developed for improving optical property measurement with SFDI [92,103], but the performance of these different correction methods was not quantitatively compared and determined. Therefore, how to determine the most appropriate correction method for different target samples (e.g., skin tissue, tumor tissue, apple fruit, etc.) should be studied in the future.
Second, fast estimations of optical properties by using the SFDI technique are always hindered by relatively slow speed of projection, signal acquisition, and data processing, due to the fact that multiple frequencies, phases, and wavelengths are commonly used, which partly limits the real-time applications, such as surgical imaging and operation. A general SFDI experiment under the condition of two frequencies (e.g., 0 and 0.2 mm−1), three phases (e.g., 0,   2 π 3 and 4 π 3 ), and one wavelength takes about five to twenty seconds or even longer, which cannot meet the requirements of high real-time applications. Many efforts have thus been made to accelerate the speed, such as SSOP, which reduces the number of phase-images from three to one, improving the efficiency by approximately three times [89,104,105,106,107,108,109,110,111]. Development of hardware configurations, like the use of single-pixel camera, instead of industrial CCD camera, could further speed up the optical property measurement using the SFDI [54]. Now, the SFDI has been applied for real-time applications in the field of biomedicine optics, such as visualization of lateral spatial distribution of tissue chromophores over a contoured surface [112], and detection of early plantar ulcer of the patients [113]. However, in the field of food and agricultural engineering, the real-time application of SFDI is still challenging, because the speed requirement is higher than that in biomedical detection. For example, a real-time inspecting and sorting production line of apple quality works at a speed of 5–10 apples/second, which is rather fast and difficult to meet with the current development of SFDI. Therefore, the efficiency of SFDI needs further research in the future, especially for the food and agricultural application.
Third, the handheld SFDI equipment has been designed and manufactured based on the increasing requirements for real-time applications. For example, Nadeau et al. analyzed several compact, low-cost hardware components, and presented data which were related to component evaluation realized by handheld SFDI devices [114]. They designed a small LED lamp with the size of 115 × 65 × 20 mm3. Due to the single wavelength of LED, the frequency choice is relatively narrow. It carries processors without higher power and better performance, so that the data processing is time consuming. Sager et al. designed and manufactured a handheld SFDI device, which could conduct imaging with 1-D spatial resolution [67]. Since they changed the plane imaging to line imaging, the scanning and data processing speed was greatly improved. The instrument is compact, easy to use, and can collect data from in vivo skin at relatively fast speed. At present, there are two ways to optimize and improve the handheld SFDI device. One is to replace all components with compact parts and compress the space between components to achieve a smaller volume of the whole system. However, due to the smaller component size, there may be some loss in the imaging size, wavelength, and frequency selection of the modulated images. Another idea is to separate the detection part from the light source and camera, and connect them with a light guide. This method can make each part be directly connected to each other, i.e., relatively small detection part, while the light source and the camera part are relatively large, so as to avoid the loss of wavelength and frequency of the modulation patterns. The disadvantage is that the two still need to be connected together, and the reliability and flexibility of the connection are potential issues. Since the handheld SFDI device has no sample table for placing samples, the distance between the camera and the measured object cannot be controlled, which provides more challenges for accurate optical property estimation with SFDI.
Fourth and finally, SFDI has been combined with other advanced techniques, such as endoscope and fluorescence imaging, to extend the detection capability. For example, Nandy et al. combined SFDI with endoscope for live mouse tumor imaging and absorption, scattering, hemoglobin, and SO2 were measured in vivo [81], while Gioux et al. applied the combination of these two techniques for real-time acquisition of optical properties of a hand in motion [39]. SFDI was also combined with the technique of fluorescence imaging to acquire maps co-registered in space and time of tissue optical properties and raw fluorescence emissions followed by a model-based correction to estimate the quantitative fluorescence. They provided a means to correct the emitted fluorescence with a quantitative fluorescence model [115]. These combinations integrating the advantages of two or multiple techniques can certainly expand the applications of the SFDI, but it should be mentioned that the system complexity was also increased with more components, which is a new challenge for real-time application. Moreover, multiple cameras were used to acquire images at different wavelengths simultaneously, which can accelerate the speed of image acquisition, at the expense of increasing system cost and calculation amount of image processing. Very recently, deep learning algorithms (e.g., generative adversarial networks, random forest, etc.) have evolved rapidly, which provide new means for image recognition, defect detection, and object classification [116,117,118,119]. What makes such methods attractive is their capacity to perform particularly well in learning nonlinear properties. In the future, deep learning algorithms are expected to be combined with SFDI for rapid and accurate optical property estimations of biological tissues.

5. Conclusions

Rapid advances in SFDI have been taking place over the past two decades, since SFDI serves as an emerging depth-varying and wide-field technique for estimating optical absorption and reduced scattering coefficients, which, in turn, can be used for disease diagnosis, evaluation, and monitoring, as well as food quality assessment. In this review, typical system and principle of SFDI technique for optical property measurement were first described. The applications of SFDI technique in biomedical and agricultural engineering domain were then reviewed and discussed, in terms of burn assessment, skin tissue evaluation, tumor tissue detection, brain tissue monitoring, and quality evaluation of agro-products. Finally, challenges and future perspectives of SFDI technique for measuring optical properties were discussed. This paper presents a comprehensive review of SFDI for optical property measurement, which provides references for the interested researchers to gain more insight into this emerging imaging technique, as well as develop this technique for more extensive applications.

Author Contributions

Writing—original draft preparation: Z.S. Writing—review and editing: D.H. The other authors (Z.W., L.X. and Y.Y.) contributed by reviewing, editing, and making additions to various parts of the paper. All authors have read and agreed to the published version of the manuscript.

Funding

This research was funded by The National Natural Science Foundation of China, grant number 32001414, U20A2019 and The Natural Science Foundation of Zhejiang Province, grant number LQ20C130002.

Conflicts of Interest

The authors declare no conflict of interest.

References

  1. Chen, B.; Tong, C.M. Modified physical optics algorithm for near field scattering. Chin. Phys. B 2018, 27, 114102–114106. [Google Scholar] [CrossRef]
  2. Shi, R.; Hellmann, C.; Wyrowski, F. Physics optics propagation through curved surfaces. J. Opt. Soc. Am. A 2019, 36, 1252–1260. [Google Scholar] [CrossRef] [PubMed]
  3. Liemert, A.; Reitzle, D.; Kienle, A. Analytical solutions of the radiative transport equation for turbid and fluorescent layered media. Sci. Rep. 2017, 7, 3819. [Google Scholar] [CrossRef]
  4. Liemert, A.; Kienle, A. Green’s function of the time-dependent radiative transport equation in terms of rotated spherical harmonics. Phys. Rev. E 2012, 86, 036603. [Google Scholar] [CrossRef] [Green Version]
  5. Liemert, A.; Kienle, A. Spatially modulated light source obliquely incident on a semi-infinite scattering medium. Opt. Lett. 2012, 37, 4158–4160. [Google Scholar] [CrossRef] [PubMed]
  6. Liemert, A.; Kienle, A. Exact and efficient solution of the radiative transport equation for the semi-infinite medium. Sci. Rep. 2013, 3, 2018. [Google Scholar] [CrossRef] [PubMed]
  7. Liemert, A.; Geiger, S.; Kienle, A. Solutions for single-scattered radiance in the semi-infinite medium based on radiative transport theory. J. Opt. Soc. Am. A 2021, 38, 405–411. [Google Scholar] [CrossRef] [PubMed]
  8. Ostermeyer, M.R.; Jacques, S.L. Perturbation theory for diffuse light transport in complex biological tissues. J. Opt. Soc. Am. A 1997, 14, 255–261. [Google Scholar] [CrossRef]
  9. Fan, S.X.; Li, C.Y.; Huang, W.Q.; Chen, L.P. Detection of blueberry internal bruising over time using NIR hyperspectral reflectance imaging with optimum wavelengths. Postharvest Biol. Technol. 2017, 134, 55–66. [Google Scholar] [CrossRef]
  10. Anderson, E.R.; Cuccia, D.J.; Durkin, A.J. Detection of bruises on golden delicious apples using spatial- frequency-domain imaging. Proc. SPIE Int. Soc. Opt. Eng. 2007, 36, 6430. [Google Scholar] [CrossRef]
  11. Vanoli, M.; Van Beers, R.; Sadar, N.; Rizzolo, A.; Buccheri, M.; Grassi, M.; Lovati, F.; Nicolaï, B.; Aernouts, B.; Watté, R.; et al. Time- and spatially-resolved spectroscopy to determine the bulk optical properties of ‘Braeburn’ apples after ripening in shelf life. Postharvest Biol. Technol. 2020, 168. [Google Scholar] [CrossRef]
  12. Wang, L.V.; Wu, H.-I.; Masters, B.R. Biomedical Optics, Principles and Imaging. J. Biomed. Opt. 2008. [Google Scholar] [CrossRef]
  13. Wilson, B.C.; Patterson, M.S.; Flock, S.T. Indirect versus direct techniques for the measurement of the optical properties of tissues. Photochem. Photobiol. 1987, 46, 601–608. [Google Scholar] [CrossRef]
  14. Bashkatov, A.N.; Genina, E.A.; Kochubey, V.I.; Tuchin, V.V. Optical properties of human skin, subcutaneous and mucous tissues in the wavelength range from 400 to 2000 nm. J. Phys. D Appl. Phys. 2005, 38, 2543. [Google Scholar] [CrossRef]
  15. Cheong, W.F.; Prahl, S.A.; Welch, A.J. A review of the optical properties of biological tissues. IEEE J. Quantum. Elect. 1990, 26, 2166–2185. [Google Scholar] [CrossRef] [Green Version]
  16. Rohrbach, D.J.; Muffoletto, D.; Huihui, J.; Saager, R.; Keymel, K.; Paquette, A.; Morgan, J.; Zeitouni, N.; Sunar, U. Preoperative Mapping of Nonmelanoma Skin Cancer Using Spatial Frequency Domain and Ultrasound Imaging. Acad. Radiol. 2014, 21, 263–270. [Google Scholar] [CrossRef] [Green Version]
  17. Lin, A.J.; Koike, M.A.; Green, K.N.; Kim, J.G.; Mazhar, A.; Rice, T.B.; LaFerla, F.M.; Tromberg, B.J. Spatial Frequency Domain Imaging of Intrinsic Optical Property Contrast in a Mouse Model of Alzheimer’s Disease. Ann. Biomed. Eng. 2011, 39, 1349–1357. [Google Scholar] [CrossRef] [PubMed] [Green Version]
  18. Mazhar, A.; Sharif, S.A.; Cuccia, J.D.; Nelson, J.S.; Kelly, K.M.; Durkin, A.J. Spatial frequency domain imaging of port wine stain biochemical composition in response to laser therapy: A pilot study. Laser. Surg. Med. 2012, 44, 611–621. [Google Scholar] [CrossRef] [PubMed] [Green Version]
  19. Ponticorvo, A.; Burmeister, D.M.; Rowland, R.; Baldado, M.; Kennedy, G.T.; Saager, R.; Bernal, N.; Choi, B.; Durkin, A.J. Quantitative long-term measurements of burns in a rat model using Spatial Frequency Domain Imaging (SFDI) and Laser Speckle Imaging (LSI). Laser. Surg. Med. 2017, 49, 293–304. [Google Scholar] [CrossRef] [PubMed] [Green Version]
  20. Cuccia, D.J.; Bevilacqua, F.; Durkin, A.J.; Ayers, F.R.; Tromberg, B.J. Quantitation and mapping of tissue optical properties using modulated imaging. J. Biomed. Opt. 2009, 14, 024012. [Google Scholar] [CrossRef] [PubMed]
  21. Lu, Y.Z.; Li, R.; Lu, R.F. Gram–Schmidt orthonormalization for retrieval of amplitude images under sinusoidal patterns of illumination. Appl. Opt. 2016, 55, 6866–6873. [Google Scholar] [CrossRef]
  22. Lu, Y.Z.; Li, R.; Lu, R.F. Fast demodulation of pattern images by spiral phase transform in structured-illumination reflectance imaging for detection of bruises in apples. Comput. Electron. Agric. 2016, 127, 652–658. [Google Scholar] [CrossRef]
  23. Bassi, A.; D’Andrea, C.; Valentini, G.; Cubeddu, R.; Arridge, S. Temporal propagation of spatial information in turbid media. Opt. Lett. 2008, 33, 2836. [Google Scholar] [CrossRef]
  24. Wang, L.V.; Wu, H.-I. Biomedical Optics: Principles and Imaging; John Wiley & Sons: Hoboken, NJ, USA, 2007. [Google Scholar]
  25. Prahl, S.A.; Vangemert, M.J.C.; Welch, A.J. Determining the optical properties of turbid media by using the adding-doubling method. Appl. Opt. 1993, 32, 559–568. [Google Scholar] [CrossRef] [PubMed]
  26. Patterson, M.S.; Chance, B.; Wilson, B.C. Time resolved reflectance and transmittance for the non-invasive measurement of tissue optical properties. Appl. Opt. 1989, 28, 2331–2336. [Google Scholar] [CrossRef] [PubMed]
  27. Patterson, M.S.; Moulton, J.D.; Wilson, B.C.; Berndt, K.W.; Lakowicz, J.R. Frequency-domain reflectance for the determination of the scattering and absorption properties of tissue. Appl. Opt. 1991, 30, 4474–4476. [Google Scholar] [CrossRef]
  28. Farrell, T.J.; Patterson, M.S.; Wilson, B. A diffusion theory model of spatially resolved, steady-state diffuse reflectance for the noninvasive determination of tissue optical properties in vivo. Med. Phys. 1992, 19, 879–888. [Google Scholar] [CrossRef] [PubMed]
  29. Kienle, A.; Patterson, M.S. Improved solutions of the steady-state and the time-resolved diffusion equations for reflectance from a semi-infinite turbid medium. J. Opt. Soc. Am. A 1997, 14, 246–254. [Google Scholar] [CrossRef]
  30. Cuccia, D.J.; Bevilacqua, F.; Durkin, A.J.; Tromberg, B.J. Modulated imaging: Quantitative analysis and tomography of turbid media in the spatial-frequency domain. Opt. Lett. 2005, 30, 1354–1359. [Google Scholar] [CrossRef]
  31. Wirth, D.; Sibai, M.; Olson, J.; Wilson, B.C.; Roberts, D.W.; Paulsen, K. Feasibility of using spatial frequency-domain imaging intraoperatively during tumor resection. J. Biomed. Opt. 2019, 24, 1–6. [Google Scholar] [CrossRef]
  32. Nothelfer, S.; Bergmann, F.; Liemert, A.; Reitzle, D.; Kienle, A. Spatial frequency domain imaging using an analytical model for separation of surface and volume scattering. J. Biomed. Opt. 2019, 24, 1–10. [Google Scholar] [CrossRef] [PubMed]
  33. Kennedy, G.T.; Stone, R.I.; Kowalczewski, A.C.; Rowland, R.; Chen, J.H.; Baldado, M.L.; Ponticorvo, A.; Bernal, N.; Christy, R.J.; Durkin, A.J. Spatial frequency domain imaging: A quantitative, noninvasive tool for in vivo monitoring of burn wound and skin graft healing. J. Biomed. Opt. 2019, 24, 1–9. [Google Scholar] [CrossRef] [PubMed]
  34. Laughney, A.M.; Krishnaswamy, V.; Rice, T.B.; Cuccia, D.J.; Barth, R.J.; Tromberg, B.J.; Paulsen, K.D.; Pogue, B.W.; Wells, W.A. System analysis of spatial frequency domain imaging for quantitative mapping of surgically resected breast tissues. J. Biomed. Opt. 2013, 18, 036012–036022. [Google Scholar] [CrossRef] [PubMed] [Green Version]
  35. Gioux, S.; Mazhar, A.; Lee, B.T.; Lin, S.J.; Tobias, A.M.; Cuccia, D.J.; Stockdale, A.; Oketokoun, R.; Ashitate, Y.; Kelly, E.; et al. First-in-human pilot study of a spatial frequency domain oxygenation imaging system. J. Biomed. Opt. 2011, 16, 086015. [Google Scholar] [CrossRef] [Green Version]
  36. Balu, M.; Mazhar, A.; Hayakawa, C.K.; Mittal, R.; Krasieva, T.B.; Konig, K.; Venugopalan, V.; Tromberg, B.J. In vivo multiphoton NADH fluorescence reveals depth-dependent keratinocyte metabolism in human skin. Biophys. J. 2013, 104, 258–267. [Google Scholar] [CrossRef] [Green Version]
  37. Mazhar, A.; Saggese, S.; Pollins, A.C.; Cardwell, N.L.; Nanney, L.; Cuccia, D.J. Noncontact imaging of burn depth and extent in a porcine model using spatial frequency domain imaging. J. Biomed. Opt. 2014, 19, 086019–086028. [Google Scholar] [CrossRef] [PubMed]
  38. Gioux, S.; Mazhar, A.; Cuccia, D.J.; Durkin, A.J.; Tromberg, B.J.; Frangioni, J.V. Three-dimensional surface profile intensity correction for spatially modulated imaging. J. Biomed. Opt. 2009, 14, 034045–034055. [Google Scholar] [CrossRef] [Green Version]
  39. Angelo, J.P.; van de Giessen, M.; Gioux, S. Real-time endoscopic optical properties imaging. Biomed. Opt. Express 2017, 8, 5113–5126. [Google Scholar] [CrossRef] [Green Version]
  40. Saager, R.B.; Cuccia, D.J.; Durkin, A.J. Determination of optical properties of turbid media spanning visible and near-infrared regimes via spatially modulated quantitative spectroscopy. J. Biomed. Opt. 2015, 15, 017012. [Google Scholar] [CrossRef] [Green Version]
  41. Andrea, C.D.; Ducros, N.; Bassi, A.; Arridge, S.; Valentini, G.; Dipartimento, P.; Milano, P.; Leonardo, P. Fast 3D optical reconstruction in turbid media using spatially modulated light Abstract. Biomed. Opt. Express 2010, 1, 471–481. [Google Scholar] [CrossRef] [Green Version]
  42. BeaLanger, S.; Abran, M.; Intes, X.; Casanova, C.; Lesage, F. Real-time diffuse optical tomography based on structured illumination. J. Biomed. Opt. 2010, 15, 016006. [Google Scholar] [CrossRef] [PubMed]
  43. Konecky, S.D.; Owen, C.M.; Tyler, R.; Valdés, P.A.; Kolbein, K.; Wilson, B.C.; Frederic, L.; Roberts, D.W.; Paulsen, K.D.; Tromberg, B.J. Spatial frequency domain tomography of protoporphyrin IX fluorescence in preclinical glioma models. J. Biomed. Opt. 2012, 17, 056008. [Google Scholar] [CrossRef] [PubMed] [Green Version]
  44. Konecky, S.D.; Amaan, M.; Cuccia, D.; Durkin, A.J.; Schotland, J.C.; Tromberg, B.J. Quantitative optical tomography of sub-surface heterogeneities using spatially modulated structured light. Opt. Express 2009, 17, 14780–14790. [Google Scholar] [CrossRef] [Green Version]
  45. Gardner, A.R.; Vasan, V. Accurate and efficient Monte Carlo solutions to the radiative transport equation in the spatial frequency domain. Opt. Lett. 2011, 36, 2269–2271. [Google Scholar] [CrossRef] [PubMed] [Green Version]
  46. Yao, R.Y.; Intes, X.; Fang, Q.Q. Generalized mesh-based Monte Carlo for wide-field illumination and detection via mesh retessellation. Biomed. Opt. Express 2016, 7, 171–184. [Google Scholar] [CrossRef] [Green Version]
  47. He, X.M.; Jiang, X.; Fu, X.P.; Gao, Y.W.; Rao, X.Q. Least squares support vector machine regression combined with Monte Carlo simulation based on the spatial frequency domain imaging for the detection of optical properties of pear. Postharvest Biol. Technol. 2018, 145, 1–9. [Google Scholar] [CrossRef]
  48. Regan, C.; Hayakawa, C.K.; Choi, B. Momentum transfer Monte Carlo for the simulation of laser speckle imaging and its application in the skin. Biomed. Opt. Express 2017, 8, 5708–5723. [Google Scholar] [CrossRef] [Green Version]
  49. Kijanka, P.; Packo, P. Novel method for true guided waves spectral characteristics estimation using a logistic function fit and nonlinear least square algorithm. Struct. Control Health Monit. 2019, 26, 13. [Google Scholar] [CrossRef]
  50. Song, J.W.; Lau, D.L.; Ho, Y.S.; Liu, K. Automatic look-up table based real-time phase unwrapping for phase measuring profilometry and optimal reference frequency selection. Opt. Express 2019, 27, 13357–13371. [Google Scholar] [CrossRef] [PubMed]
  51. Vicent Servera, J.; Alonso, L.; Martino, L.; Sabater, N.; Verrelst, J.; Camps-Valls, G.; Moreno, J. Gradient-Based Automatic Lookup Table Generator for Radiative Transfer Models. IEEE Trans. Geosci. Remote Sens. 2019, 57, 1040–1048. [Google Scholar] [CrossRef]
  52. Angelo, J.; Vargas, C.R.; Lee, B.T.; Bigio, I.J.; Gioux, S. Ultrafast optical property map generation using lookup tables. J. Biomed. Opt. 2016, 21, 110501. [Google Scholar] [CrossRef]
  53. Vervandier, J.; Gioux, S. Single snapshot imaging of optical properties. Biomed. Opt. Express 2013, 4, 2938–2944. [Google Scholar] [CrossRef] [Green Version]
  54. Aguenounon, E.; Dadouche, F.; Uhring, W.; Ducros, N.; Gioux, S. Single snapshot imaging of optical properties using a single-pixel camera: A simulation study. J. Biomed. Opt. 2019, 24, 1–6. [Google Scholar] [CrossRef] [PubMed]
  55. Aguenounon, E.; Dadouche, F.; Uhring, W.; Gioux, S. Single snapshot of optical properties image quality improvement using anisotropic two-dimensional windows filtering. J. Biomed. Opt. 2019, 24, 1–21. [Google Scholar] [CrossRef] [Green Version]
  56. Dognitz, N.; Wagnieres, G. Determination of tissue optical properties by steady-state spatial frequency-domain reflectometry. Lasers Med. Sci. 1998, 13, 55–65. [Google Scholar] [CrossRef] [Green Version]
  57. Lu, R.F. Light Scattering Technology for Food Property, Quality and Safety Assessment; CRC Press: Boca Raton, FL, USA, 2017. [Google Scholar]
  58. Nguyen, T.T.A.; Ramella-Roman, J.C.; Moffatt, L.T.; Ortiz, R.T.; Jordan, M.H.; Shupp, J.W. Novel Application of a Spatial Frequency Domain Imaging System to Determine Signature Spectral Differences Between Infected and Noninfected Burn Wounds. J. Burn Care Res. 2013, 34, 44–50. [Google Scholar] [CrossRef] [Green Version]
  59. Kennedy, G.T.; Stone, R.; Kowalczewski, A.C.; Chen, J.H.; Rowland, R.; Ponticorvo, A.; Christy, R.J.; Durkin, A.J. Characterization of debrided burn wounds using spatial frequency domain imaging. Photonics Dermatol. Plast. Surg. 2019, 108510. [Google Scholar] [CrossRef]
  60. Ponticorvo, A.; Rowland, R.; Baldado, M.; Burmeister, D.M.; Christy, R.J.; Bernal, N.P.; Durkin, A.J. Evaluating clinical observation versus Spatial Frequency Domain Imaging (SFDI), Laser Speckle Imaging (LSI) and thermal imaging for the assessment of burn depth. Burns 2019, 45, 450–460. [Google Scholar] [CrossRef] [Green Version]
  61. Rowland, R.; Ponticorvo, A.; Baldado, M.; Kennedy, G.T.; Burmeister, D.M.; Christy, R.J.; Bernal, N.P.; Durkin, A.J. A Simple Burn Wound Severity Assessment Classifier Based On Spatial Frequency Domain Imaging (SFDI) and Machine Learning. Photonics Dermatol. Plast. Surg. 2019, 1085109. [Google Scholar] [CrossRef]
  62. Ponticorvo, A.; Burmeister, D.M.; Yang, B.; Choi, B.; Christy, R.J.; Durkin, A.J. Quantitative assessment of graded burn wounds in a porcine model using spatial frequency domain imaging (SFDI) and laser speckle imaging (LSI). Biomed. Opt. Express 2014, 5, 3467–3481. [Google Scholar] [CrossRef] [Green Version]
  63. Poon, C.; Sunar, U.; Rohrbach, D.J.; Krishnamurthy, S.; Olsen, T.; Kent, M.; Weir, N.M.; Simman, R.; Travers, J.B. Early assessment of burn severity in human tissue ex vivo with multi-wavelength spatial frequency domain imaging. Toxicol. Vitr. 2018, 52, 251–254. [Google Scholar] [CrossRef]
  64. Nguyen, J.Q.; Crouzet, C.; Mai, T.; Riola, K.; Uchitel, D.; Liaw, L.H.; Bernal, N.; Ponticorvo, A.; Choi, B.; Durkin, A.J. Spatial frequency domain imaging of burn wounds in a preclinical model of graded burn severity. J. Biomed. Opt. 2013, 18, 066010. [Google Scholar] [CrossRef] [Green Version]
  65. Burmeister, D.M.; Ponticorvo, A.; Yang, B.; Becerra, S.C.; Choi, B.; Durkin, A.J.; Christy, R.J. Utility of spatial frequency domain imaging (SFDI) and laser speckle imaging (LSI) to non-invasively diagnose burn depth in a porcine model. Burns 2015, 41, 1242–1252. [Google Scholar] [CrossRef] [Green Version]
  66. Chen, X.; Lin, W.; Wang, C.; Chen, S.; Sheng, J.; Zeng, B.; Xu, M. In vivo real-time imaging of cutaneous hemoglobin concentration, oxygen saturation, scattering properties, melanin content, and epidermal thickness with visible spatially modulated light. Biomed. Opt. Express 2017, 8, 5468–5482. [Google Scholar] [CrossRef] [Green Version]
  67. Saager, R.B.; Dang, A.N.; Huang, S.S.; Kelly, K.M.; Durkin, A.J. Portable (handheld) clinical device for quantitative spectroscopy of skin, utilizing spatial frequency domain reflectance techniques. Rev. Sci. Instrum. 2017, 88, 094302. [Google Scholar] [CrossRef]
  68. Travers, J.B.; Poon, C.; Rohrbach, D.J.; Weir, N.M.; Cates, E.; Hager, F.; Sunar, U. Noninvasive mesoscopic imaging of actinic skin damage using spatial frequency domain imaging. Biomed. Opt. Express 2017, 8, 3045–3052. [Google Scholar] [CrossRef] [Green Version]
  69. Yafi, A.; Muakkassa, F.K.; Pasupneti, T.; Fulton, J.; Cuccia, D.J.; Mazhar, A.; Blasiole, K.N.; Mostow, E.N. Quantitative Skin Assessment Using Spatial Frequency Domain Imaging (SFDI) in Patients With or at High Risk for Pressure Ulcers. Lasers Surg. Med. 2017, 49, 827–834. [Google Scholar] [CrossRef] [PubMed]
  70. Gevaux, L.; Cherel, M.; Seroul, P.; Clerc, R.; Tremeau, A.; Hebert, M. Hyperspectral imaging and spatial frequency domain imaging: Combined acquisition for full face skin analysis. Imaging Manip. Anal. Biomol. Cells Tissues Xvii 2019, 10881. [Google Scholar] [CrossRef]
  71. Rohrbach, D.J.; Zeitouni, N.C.; Muffoletto, D.; Saager, R.; Tromberg, B.J.; Sunar, U. Characterization of nonmelanoma skin cancer for light therapy using spatial frequency domain imaging. Biomed. Opt. Express 2015, 6, 1761–1766. [Google Scholar] [CrossRef] [Green Version]
  72. Nandy, S.; Mostafa, A.; Kumavor, P.D.; Sanders, M.; Brewer, M.; Zhu, Q. Characterizing optical properties and spatial heterogeneity of human ovarian tissue using spatial frequency domain imaging. J. Biomed. Opt. 2016, 21, 101402. [Google Scholar] [CrossRef] [PubMed]
  73. Lin, W.H.; Zeng, B.X.; Cao, Z.L.; Chen, X.L.; Yang, K.Y.; Xu, M. Quantitative diagnosis of tissue microstructure with wide-field high spatial frequency domain imaging. Biomed. Opt. Express 2018, 9, 2905–2916. [Google Scholar] [CrossRef] [PubMed]
  74. Lin, W.H.; Zeng, B.X.; Cao, Z.L.; Zhu, D.F.; Xu, M. Wide-field high spatial frequency domain imaging of tissue microstructure. Prog. Biomed. Opt. Imaging Proc. SPIE 2018, 10484. [Google Scholar] [CrossRef]
  75. Laughney, A.M.; Krishnaswamy, V.; Rizzo, E.J.; Schwab, M.C.; Barth, R.J.; Cuccia, D.J.; Tromberg, B.J.; Paulsen, K.D.; Pogue, B.W.; Wells, W.A. Spectral discrimination of breast pathologies in situ using spatial frequency domain imaging. Breast Cancer Res. 2013, 15, R61. [Google Scholar] [CrossRef] [Green Version]
  76. Nguyen, J.T.; Lin, S.J.; Tobias, A.M.; Gioux, S.; Mazhar, A.; Cuccia, D.J.; Ashitate, Y.; Stockdale, A.; Oketokoun, R.; Durr, N.J.; et al. A Novel Pilot Study Using Spatial Frequency Domain Imaging to Assess Oxygenation of Perforator Flaps During Reconstructive Breast Surgery. Ann. Plast. Surg. 2013, 71, 308–315. [Google Scholar] [CrossRef]
  77. McClatchy, D.M.; Rizzo, E.J.; Wells, W.A.; Cheney, P.P.; Hwang, J.C.; Paulsen, K.D.; Pogue, B.W.; Kanick, S.C. Wide-field quantitative imaging of tissue microstructure using sub-diffuse spatial frequency domain imaging. Optica 2016, 3, 613–621. [Google Scholar] [CrossRef] [Green Version]
  78. McClatchy, D.M.; Rizzo, E.; Krishnaswamy, V.; Kanick, S.; Wells, W.; Paulsen, K.; Pogue, B. Combined multispectral spatial frequency domain imaging and computed tomography system for intraoperative breast tumor margin assessment. Prog. Biomed. Opt. Imaging Proc. SPIE 2017, 10057. [Google Scholar] [CrossRef]
  79. Robbins, C.M.; Antaki, J.F.; Kainerstorfer, J.M. Spatial frequency domain imaging for monitoring palpable breast lesions. Prog. Biomed. Opt. Imaging Proc. SPIE 2017, 10059. [Google Scholar] [CrossRef]
  80. Wei, R.L.; Leproux, A.; Laoui, S.; Kuo, J.V.; Daroui, P.; Farol, H.Y.; Ramsinghani, N.S.; Al-Ghazi, M.; Durkin, A.J.; Tromberg, B. Temporal and Spatial Quantification of Tissue Oxygen Saturation and Melanin Deposition During Whole Breast Radiation Using Noninvasive Spatial Frequency Domain Imaging. Int. J. Radiat. Oncol. 2017, 99, E54–E55. [Google Scholar] [CrossRef]
  81. Nandy, S.; Erfanzadeh, M.; Zhou, F.F.; Zhu, Q. Feasibility study of spatial frequency domain imaging using a handheld miniaturized projector and rigid endoscope. Prog. Biomed. Opt. Imaging Proc. SPIE 2017, 10059. [Google Scholar] [CrossRef]
  82. Tabassu, S.; Pera, V.; Greening, G.; Muldoon, T.J.; Roblyer, D. Two-layer inverse model for improved longitudinal preclinical tumor imaging in the spatial frequency domain. J. Biomed. Opt. 2018, 23, 076011. [Google Scholar] [CrossRef] [Green Version]
  83. Zhao, Y.; Tabassum, S.; Piracha, S.; Nandhu, M.S.; Viapiano, M.; Roblyer, D. Angle correction for small animal tumor imaging with spatial frequency domain imaging (SFDI). Biomed. Opt. Express 2016, 7, 2373–2384. [Google Scholar] [CrossRef] [PubMed] [Green Version]
  84. Burns, J.M.; Schaefer, E.; Anvari, B. Near Infrared Spatial Frequency Domain Fluorescence Imaging of Tumor Phantoms Containing Erythrocyte-Derived Optical Nanoplatforms. Prog. Biomed. Opt. Imaging Proc. SPIE 2018, 105060. [Google Scholar] [CrossRef]
  85. Lin, A.J.; Castello, N.A.; Lee, G.; Green, K.N.; Durkin, A.J.; Choi, B.; LaFerla, F.; Tromberg, B.J. In vivo optical signatures of neuronal death in a mouse model of Alzheimer’s disease. Lasers Surg. Med. 2014, 46, 27–33. [Google Scholar] [CrossRef] [PubMed] [Green Version]
  86. Singh-Moon, R.P.; Roblyer, D.M.; Bigio, I.J.; Joshi, S. Spatial mapping of drug delivery to brain tissue using hyperspectral spatial frequency-domain imaging. J. Biomed. Opt. 2014, 19, 096003. [Google Scholar] [CrossRef]
  87. Wilson, R.H.; Crouzet, C.; Torabzadeh, M.; Bazrafkan, A.; Farahabadi, M.H.; Jamasian, B.; Donga, D.; Alcocer, J.; Zaher, S.M.; Choi, B.; et al. High-speed spatial frequency domain imaging of rat cortex detects dynamic optical and physiological properties following cardiac arrest and resuscitation. Neurophotonics 2017, 4, 045008. [Google Scholar] [CrossRef] [PubMed]
  88. Sibai, M.; Fisher, C.; Veilleux, I.; Elliott, J.T.; Leblond, F.; Roberts, D.W.; Wilson, B.C. Preclinical evaluation of spatial frequency domain-enabled wide-field quantitative imaging for enhanced glioma resection. J. Biomed. Opt. 2017, 22, 76007. [Google Scholar] [CrossRef] [PubMed] [Green Version]
  89. Abookasis, D.; Meitav, O. Assessing mouse brain tissue refractive index in the NIR spectral range utilizing spatial frequency domain imaging technique combined with processing algorithms. Clin. Transl. Neurophotonics 2019, 10864. [Google Scholar] [CrossRef]
  90. Li, T.W.; He, X.M.; Fu, X.P.; Rao, X.Q. LabVIEW Base Software for Spatial Frequency Domain Imaging System. In Proceedings of the 2017 ASABE Annual International Meeting, Spokane, WA, USA, 16 July 2017. [Google Scholar]
  91. Hu, D.; Fu, X.P.; He, X.M.; Ying, Y.B. Noncontact and Wide-Field Characterization of the Absorption and Scattering Properties of Apple Fruit Using Spatial-Frequency Domain Imaging. Sci. Rep. 2016, 6, 37920–37930. [Google Scholar] [CrossRef] [Green Version]
  92. He, X.M.; Fu, X.P.; Rao, X.Q.; Fu, F. Nondestructive determination of optical properties of a pear using spatial frequency domain imaging combined with phase-measuring profilometry. Appl. Opt. 2017, 56, 8207–8215. [Google Scholar] [CrossRef]
  93. He, X.M.; Fu, X.P.; Li, T.W.; Rao, X.Q. Spatial frequency domain imaging for detecting bruises of pears. J. Food Meas. Charact. 2018, 12, 1266–1273. [Google Scholar] [CrossRef]
  94. Hu, D.; Lu, R.F.; Ying, Y.B. Spatial-frequency domain imaging coupled with frequency optimization for estimating optical properties of two-layered food and agricultural products. J. Food. Eng. 2020, 277, 109909–109913. [Google Scholar] [CrossRef]
  95. Hu, D.; Lu, R.F.; Ying, Y.B. Optimization of Spatial Frequency Domain Imaging Technique for Estimating Optical Properties of Food and Biological Materials. In Proceedings of the 2017 ASABE Annual International Meeting, Spokane, WA, USA, 16 July 2017. [Google Scholar]
  96. Hu, D.; Lu, R.F.; Ying, Y.B. A two-step parameter optimization algorithm for improving estimation of optical properties using spatial frequency domain imaging. J. Quant. Spectrosc. Radiat. Transf. 2018, 207, 32–40. [Google Scholar] [CrossRef]
  97. Lu, Y.Z.; Lu, R.F. Development of a Multispectral Structured Illumination Reflectance Imaging (SIRI) System and Its Application to Bruise Detection of Apples. Trans. ASABE 2017, 60, 1379–1389. [Google Scholar] [CrossRef]
  98. Lu, Y.Z.; Lu, R.F. Histogram-based automatic thresholding for bruise detection of apples by structured-illumination reflectance imaging. Biosyst. Eng. 2017, 160, 30–41. [Google Scholar] [CrossRef]
  99. Lu, Y.Z.; Huang, Y.P.; Lu, R.F. Innovative Hyperspectral Imaging-Based Techniques for Quality Evaluation of Fruits and Vegetables: A Review. Appl. Sci. 2017, 7, 189. [Google Scholar] [CrossRef]
  100. Lu, Y.Z.; Lu, R.F. Using composite sinusoidal patterns in structured-illumination reflectance imaging (SIRI) for enhanced detection of apple bruise. J. Food Eng. 2017, 199, 54–64. [Google Scholar] [CrossRef]
  101. Nguyen, T.T.A.; Le, H.N.D.; Vo, M.; Wang, Z.Y.; Luu, L.; Ramella-Roman, J.C. Three-dimensional phantoms for curvature correction in spatial frequency domain imaging. Biomed. Opt. Express 2012, 3, 1200–1214. [Google Scholar] [CrossRef] [PubMed] [Green Version]
  102. Nothelfer, S.; Liemert, A.; Reitzle, D.; Bergmann, F.; Kienle, A. A New method for correction of surface scattering in spatial frequency domain imaging for an accurate determination of volume scattering. Opt. InfoBase Conf. Pap. 2017, 10412. [Google Scholar] [CrossRef]
  103. Hachadorian, R.; Bruza, P.; Jermyn, M.; Mazhar, A.; Cuccia, D.; Jarvis, L.; Gladstone, D.; Pogue, B. Correcting Cherenkov light attenuation in tissue using spatial frequency domain imaging for quantitative surface dosimetry during whole breast radiation therapy. J. Biomed. Opt. 2019, 24, 1–10. [Google Scholar] [CrossRef]
  104. Fang, Q.Q.; Kaeli, D.R. Accelerating mesh-based Monte Carlo method on modern CPU architectures. Biomed. Opt. Express 2012, 3, 3223–3230. [Google Scholar] [CrossRef] [PubMed] [Green Version]
  105. Cai, F.H.; Lu, W. A Dynamic Accuracy Estimation for GPU-based Monte Carlo Simulation in Tissue Optics. Curr. Opt. Photonics 2017, 1, 551–555. [Google Scholar] [CrossRef]
  106. Ren, N.; Liang, J.; Qu, X.C.; Li, J.F.; Lu, B.J.; Tian, J. GPU-based Monte Carlo simulation for light propagation in complex heterogeneous tissues. Opt. Express 2010, 18, 6811–6823. [Google Scholar] [CrossRef] [PubMed]
  107. Fang, Q.Q. Mesh-based Monte Carlo method using fast ray-tracing in Plücker coordinates. Biomed. Opt. Express 2010, 1, 165–175. [Google Scholar] [CrossRef] [PubMed]
  108. Alerstam, E.; Svensson, T.; Andersson-Engels, S. Parallel computing with graphics processing units for high-speed Monte Carlo simulation of photon migration. J. Biomed. Opt. 2008, 13, 060504. [Google Scholar] [CrossRef] [Green Version]
  109. Cai, F.H. Using graphics processing units to accelerate perturbation Monte Carlo simulation in a turbid medium. J. Biomed. Opt. 2012, 17, 040502. [Google Scholar] [CrossRef] [Green Version]
  110. Ismail, A.; Idris, M.; Ayub, M.; Por, L. Vision-Based Apple Classification for Smart Manufacturing. Sensors 2018, 18, 4353. [Google Scholar] [CrossRef] [PubMed] [Green Version]
  111. Alerstam, E.; Andersson-Engels, S.; Svensson, T. White Monte Carlo for time-resolved photon migration. J. Biomed. Opt. 2008, 13, 10. [Google Scholar] [CrossRef] [PubMed]
  112. Zhao, Y.Y.; Deng, Y.; Yue, S.H.; Wang, M.; Song, B.; Fan, Y.B. Direct mapping from diffuse reflectance to chromophore concentrations in multi-fx spatial frequency domain imaging (SFDI) with a deep residual network (DRN). Biomed. Opt. Express 2021, 12, 433–443. [Google Scholar] [CrossRef]
  113. Li, Y.; Guo, M.R.; Qian, X.F.; Lin, W.H.; Zheng, Y.; Yu, K.Y.; Zeng, B.X.; Xu, Z.; Zheng, C.; Xu, M. Single snapshot spatial frequency domain imaging for risk stratification of diabetes and diabetic foot. Biomed. Opt. Express 2020, 11, 4471–4483. [Google Scholar] [CrossRef] [PubMed]
  114. Nadeau, K.P.; Khoury, P.; Mazhar, A.; Cuccia, D.; Durkin, A.J. Component and system evaluation for the development of a handheld point-of-care spatial frequency domain imaging (SFDI) device. Prog. Biomed. Opt. Imaging Proc. SPIE 2013, 8573. [Google Scholar] [CrossRef] [Green Version]
  115. Valdes, P.A.; Angelo, J.P.; Choi, H.S.; Gioux, S. qF-SSOP: Real-time optical property corrected fluorescence imaging. Biomed. Opt. Express 2017, 8, 3597–3605. [Google Scholar] [CrossRef] [Green Version]
  116. Wang, Z.D.; Hu, M.H.; Zhai, G.T. Application of Deep Learning Architectures for Accurate and Rapid Detection of Internal Mechanical Damage of Blueberry Using Hyperspectral Transmittance Data. Sensors 2018, 18, 1126. [Google Scholar] [CrossRef] [Green Version]
  117. Liu, R.X.; Yao, M.H.; Wang, X.B. Defects detection based on deep learning and transfer learning. Metall. Min. Ind. 2015, 7, 312–321. [Google Scholar]
  118. Nayeli, V.R.; Juan, G.S.; Jorge, C.P.; Juan, J.C. Early detection of mechanical damage in mango using NIR hyperspectral images and machine learning. Biosyst. Eng. 2014, 122, 91–98. [Google Scholar] [CrossRef]
  119. Baranowski, P.; Mazurek, W.; Pastuszka, W. Supervised classification of bruised apples with respect to the time after bruising on the basis of hyperspectral imaging data. Postharvest Biol. Technol. 2013, 86, 249–258. [Google Scholar] [CrossRef]
Figure 1. (a) Schematics of a typical SFDI system. QTH and LCTF denote quartz tungsten halogen and liquid crystal tunable filter, respectively. (b) Schematic of an endoscopic imaging system: a laser source is expanded and collimated by lenses L1 and L2, passes through a mask of a sinusoid printed onto a transparency and is collimated by L3 into the projection channel of the endoscope. The polarizers P1 and P2 ensure specular light removal. The collection channel of the endoscope sends light through L4 where it is imaged onto a CCD camera (adapted from Ref. [39]).
Photonics 08 00162 g001
Figure 2. Flow chart of data processing for estimating optical properties of biological tissues by using the spatial-frequency domain imaging technique (adapted from Ref. [20]).
Photonics 08 00162 g002
Figure 3. Typical results for burn assessment of porcine dorsal skin in three levels (i.e., superficial partial, deep partial, and full). The top row is for color digital images, and the bottom row is for maps of the reduced scattering coefficients (adapted from Ref. [62]).
Photonics 08 00162 g003
Figure 4. (ac) are absorption maps for three patients at 590 nm, and the red arrow highlights the visible lesion for P3; (d) is histogram of the absorption coefficient for the three patients at 590 nm; P1, P2 (without actinic keratosis), and P3 (with actinic keratosis) in (e) are three patients expressing various levels of photodamage, corresponding to (ac), respectively (adapted from Ref. [68]).
Photonics 08 00162 g004
Figure 5. Representative spectral parameter maps for tissue subtypes. Spectral parameter maps correspond to the pathology subtypes: normal (including fibrocystic disease) (red outline), fibroadenoma (blue outline), DCIS, invasive cancer and partially treated invasive cancer after neoadjuvant chemotherapy (all black outline), and fat (yellow outline or label). Row 1 is the tissue photograph of the cut face of one slice of the specimen with the lesion; row 2 is the corresponding histology; row 3 is the scattering-amplitude maps; row 4 is the scattering slope maps; row 5 is the hemoglobin concentration maps; row 6 is the percentage oxygenated hemoglobin maps; and row 7 is the percentage water maps (adapted from Ref. [75]).
Photonics 08 00162 g005
Figure 6. A series of 2-D false-color spatial maps of the refractive index (RI) at different wavelengths for two extreme temperatures of 28 °C and 43 °C (adapted from Ref. [89]).
Photonics 08 00162 g006
Table 1. Commonly used optical methods for measuring optical properties of biological tissues.
ClassificationMeasuring MethodLight Transfer ModelOptical PropertyRef.
Direct methodCollimated transmittanceBeer–Lambert Law μ a , μ s [24]
Indirect methodIntegrating sphereAdding-doubling μ a , μ s [25]
Time-domainDiffusion approximation equation, Monte Carlo or analytical solutions of radiative transfer equation μ a , μ s [26]
Frequency-domain μ a , μ s [27]
Spatially resolved μ a , μ s [28,29]
Spatial-frequency domain imaging μ a , μ s [5,20,30]
μ a : absorption coefficient, μ s : scattering coefficient, μ s : reduced scattering coefficient.
Table 2. Burn assessment by using the SFDI technique.
ObjectOptical PropertyIndicesFrequency/mm−1Wavelength/nmRef.
Rat burn in vivo model μ s HbO2, Hb, HbT, StO20, 0.10650–970 nm with step length of 20 nm[64]
μ a , μ s StO2, Hb0.20sixteen wavelengths in 500–700 nm[58]
μ s HbO2, Hb, H2O, StO20.20seventeen equally spaced wavelengths in 650–970 nm[19]
Pig burns in vivo model μ a , μ s StO20.20658, 730, 850[62]
μ a ,StO20.20658, 730, 850[65]
μ s -0, 0.05. 0.10, 0.15, 0.20nine wavelengths in 470–970 nm[59]
μ s -0, 0.05. 0.10, 0.15, 0.20eight wavelengths in 471–850 nm[60]
calibrated reflectance-0, 0.05, 0.10, 0.20471, 526, 591, 621, 659, 731, 851[61]
Heat burns skin μ a , μ s -Eleven-frequencies in 0–0.44490, 590, 660, 780[63]
Table 3. Recent studies on detecting tumor by using the SFDI technique.
ObjectWavelength/nmOptical Property of Normal Tissue/mm−1Optical Property of Tumor Tissue/mm−1Ref.
μ a μ s μ a μ s
Breast tissue658---0.910[77]
750---0.750[78]
Mouse tumor5300.0251.8500.0320.950[81]
659--0.0242.054[82]
Non-melanoma skin cancer6300.021 ± 0.0021.497 ± 0.0970.027 ± 0.0031.177 ± 0.120[16]
6300.0251.6700.0591.070[71]
Human ovarian tissue7300.0153.3700.0491.050[72]
Cervical tissue6230.018 ± 0.0010.900 ± 0.0620.040 ± 0.0041.412 ± 0.245[73]
Bladder tumor tissue6230.0180.5500.0451.050[74]
Publisher’s Note: MDPI stays neutral with regard to jurisdictional claims in published maps and institutional affiliations.

