
Synergistic Effect of Co and Mn Co-Doping on SnO2 Lithium-Ion Anodes

 , , and
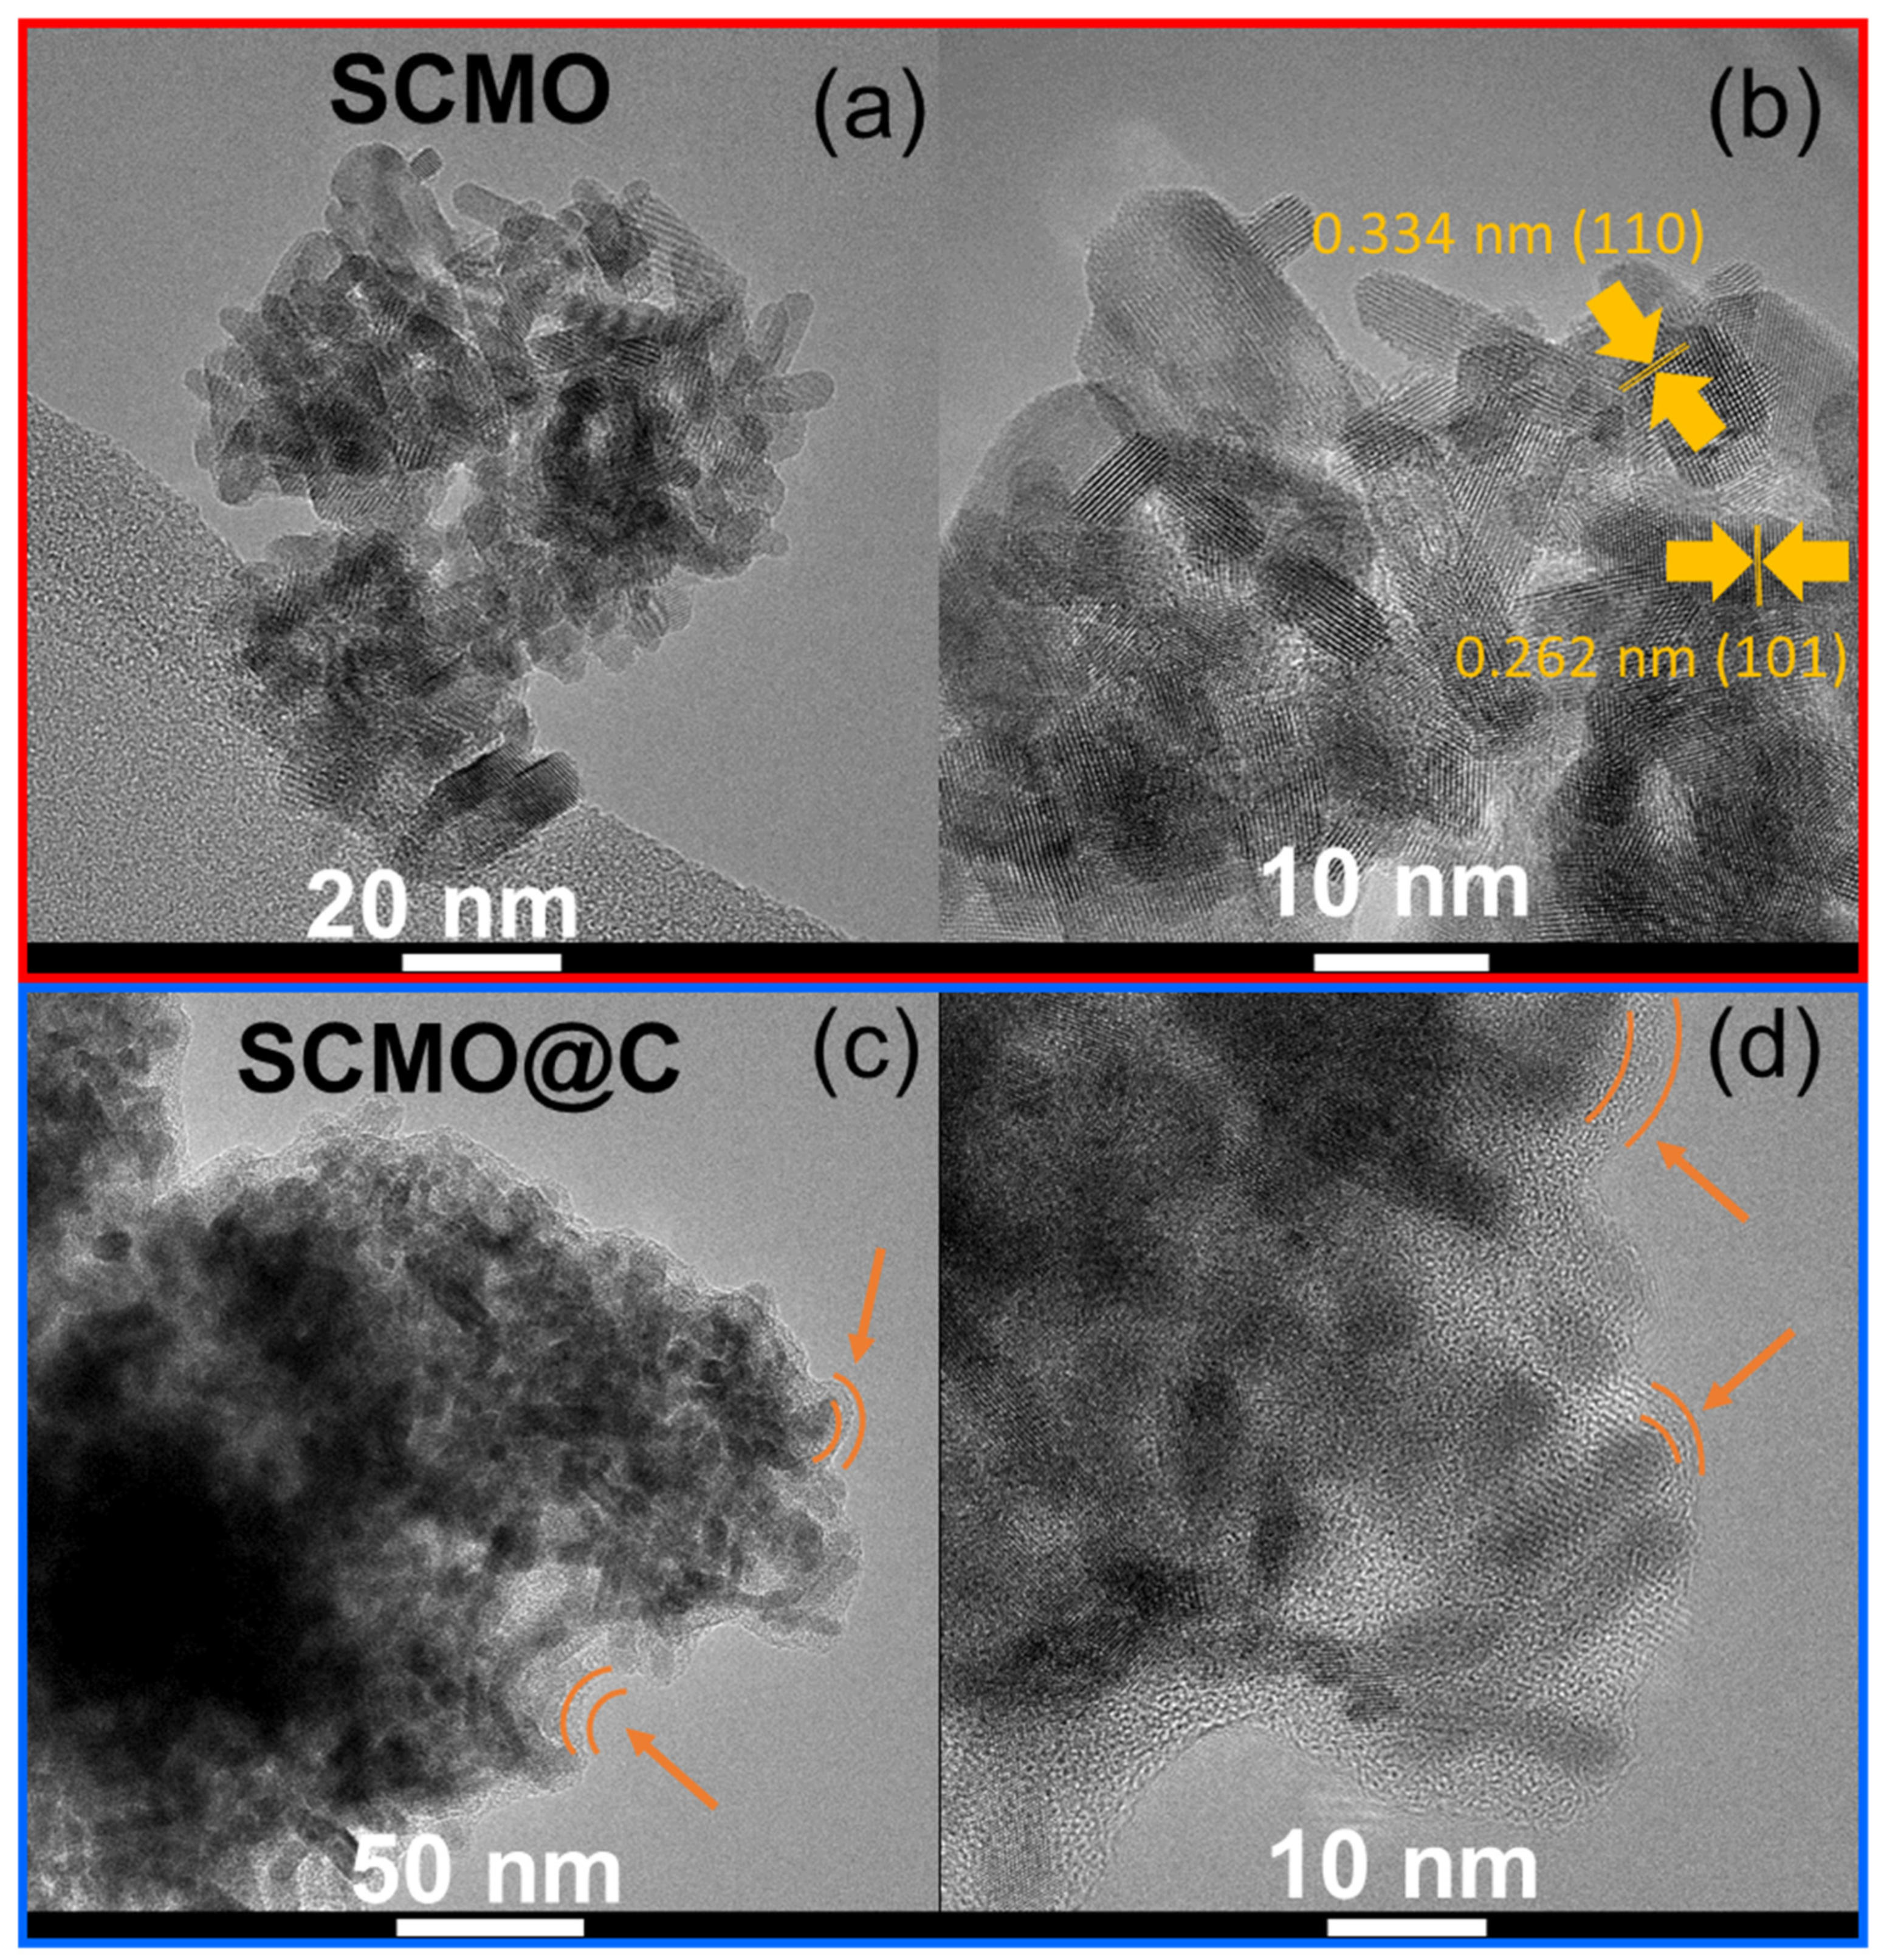
Abstract
:1. Introduction
2. Result and Discussion
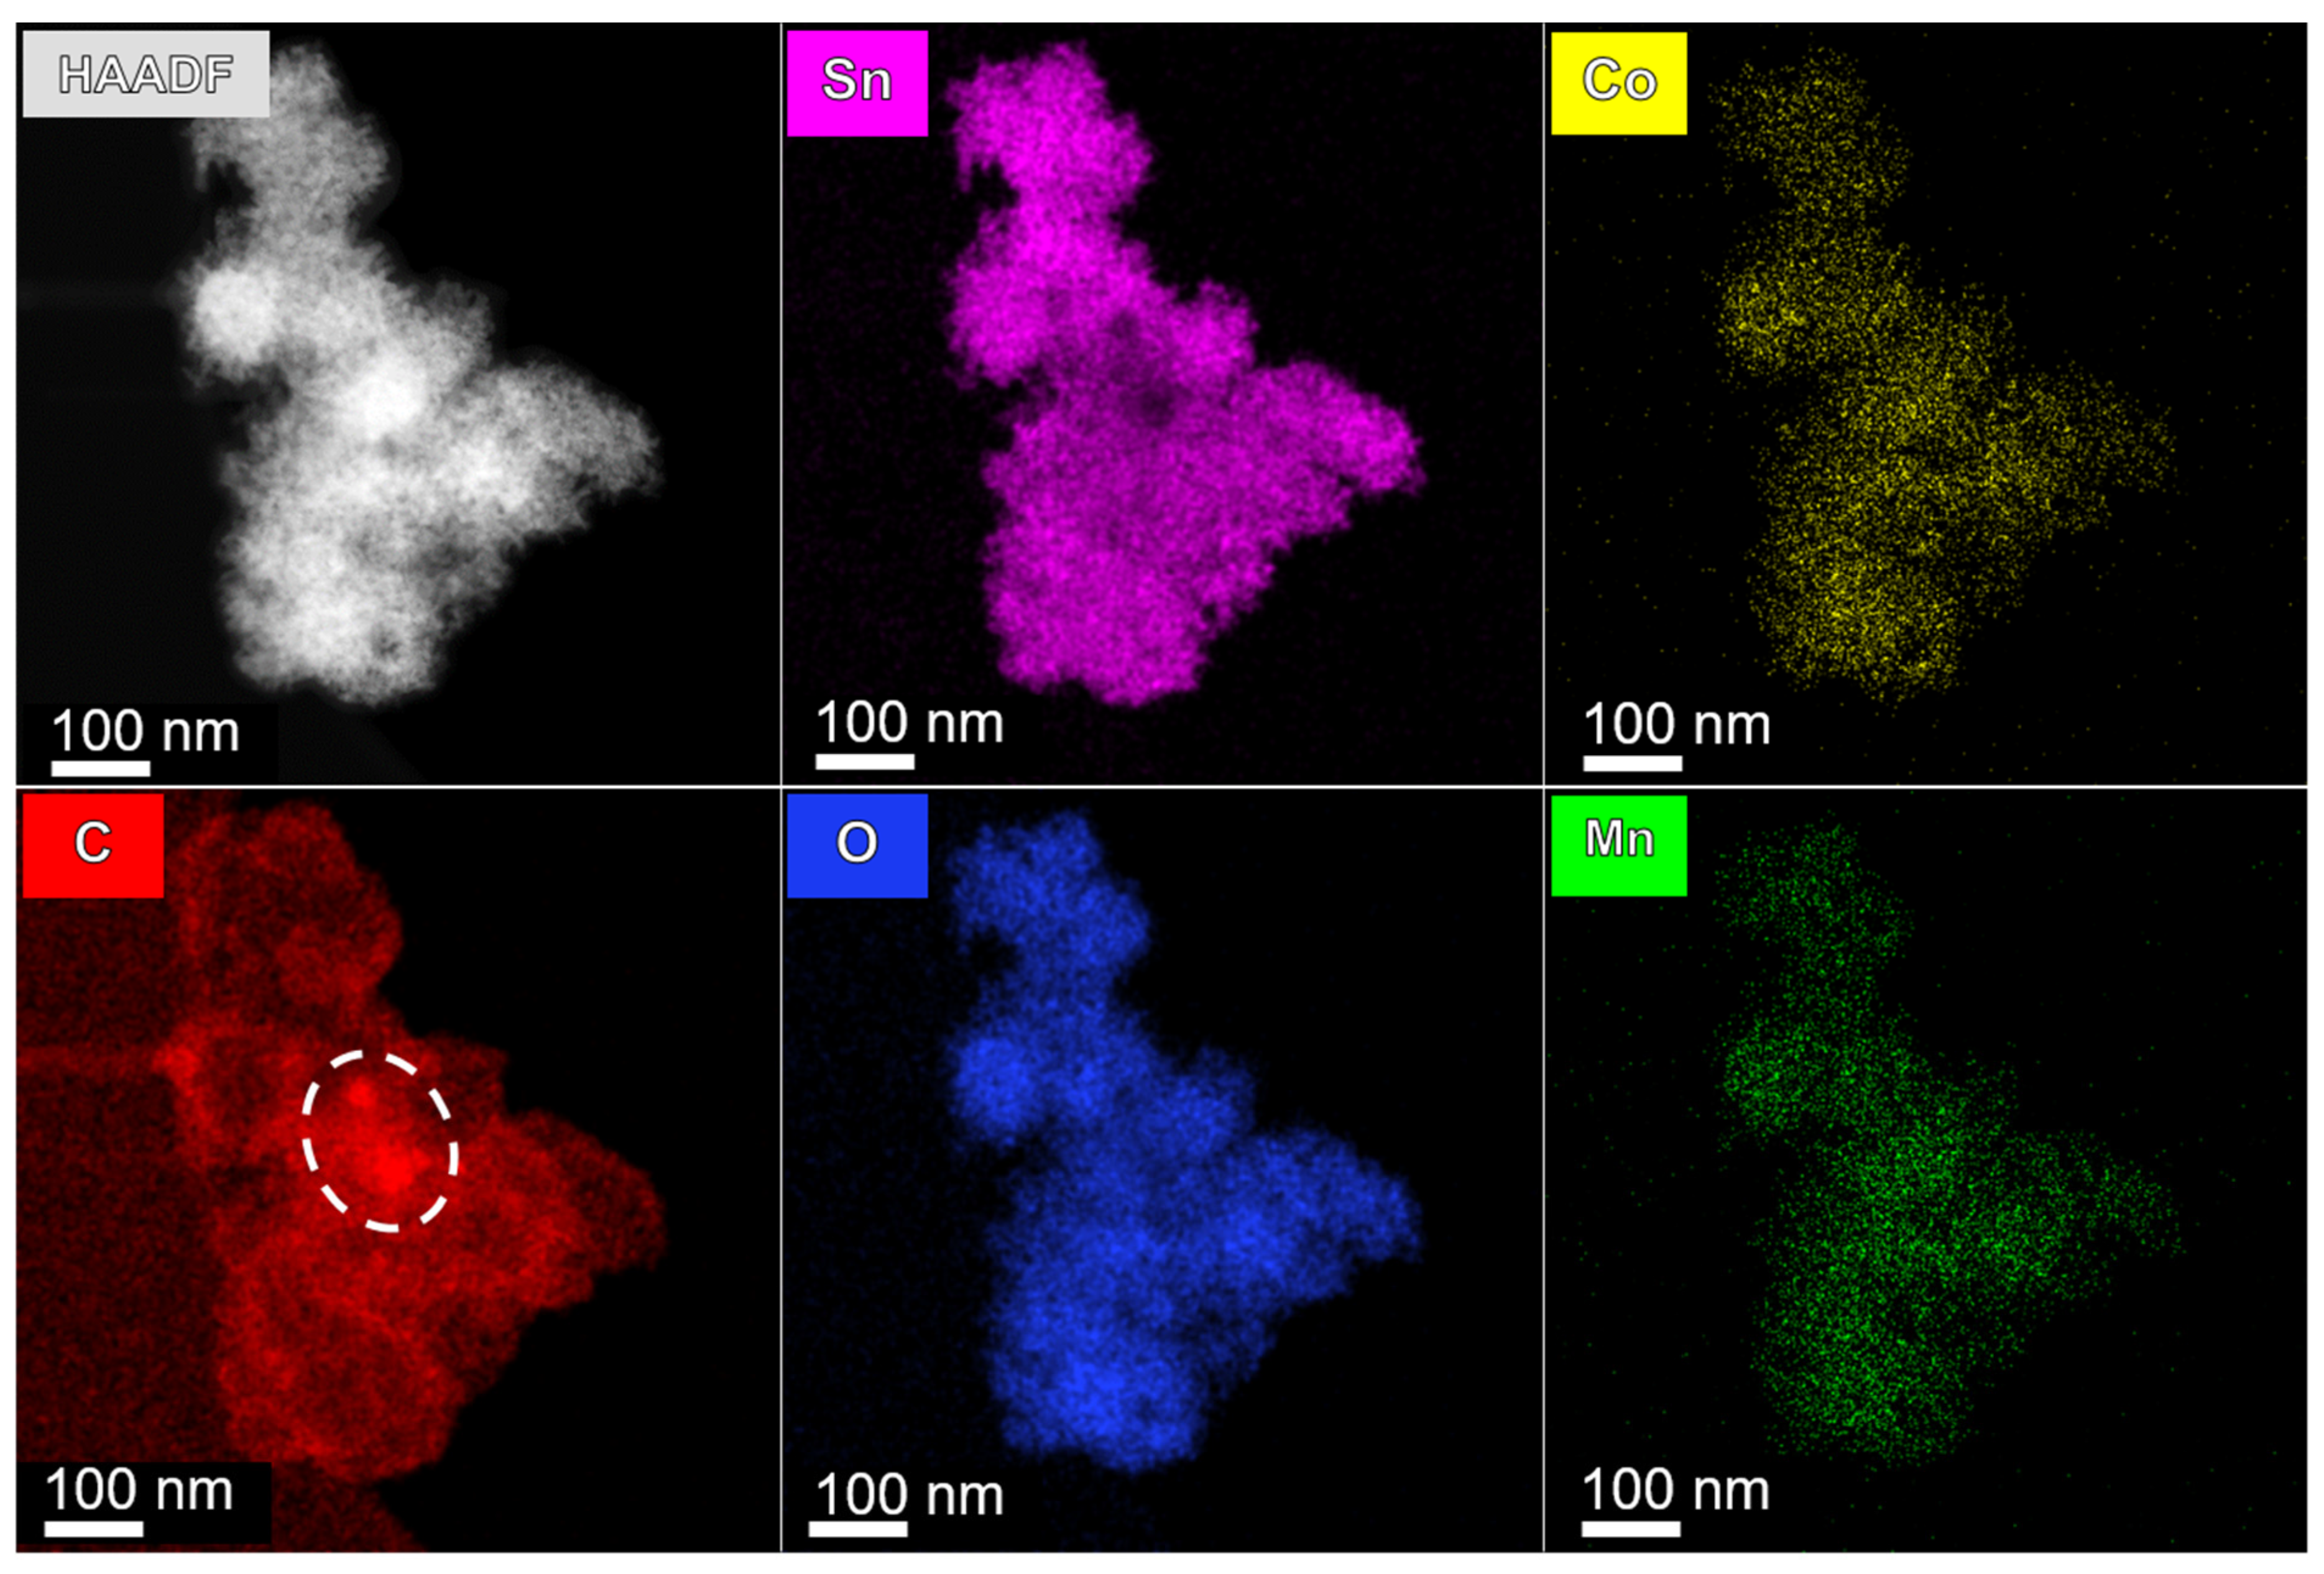
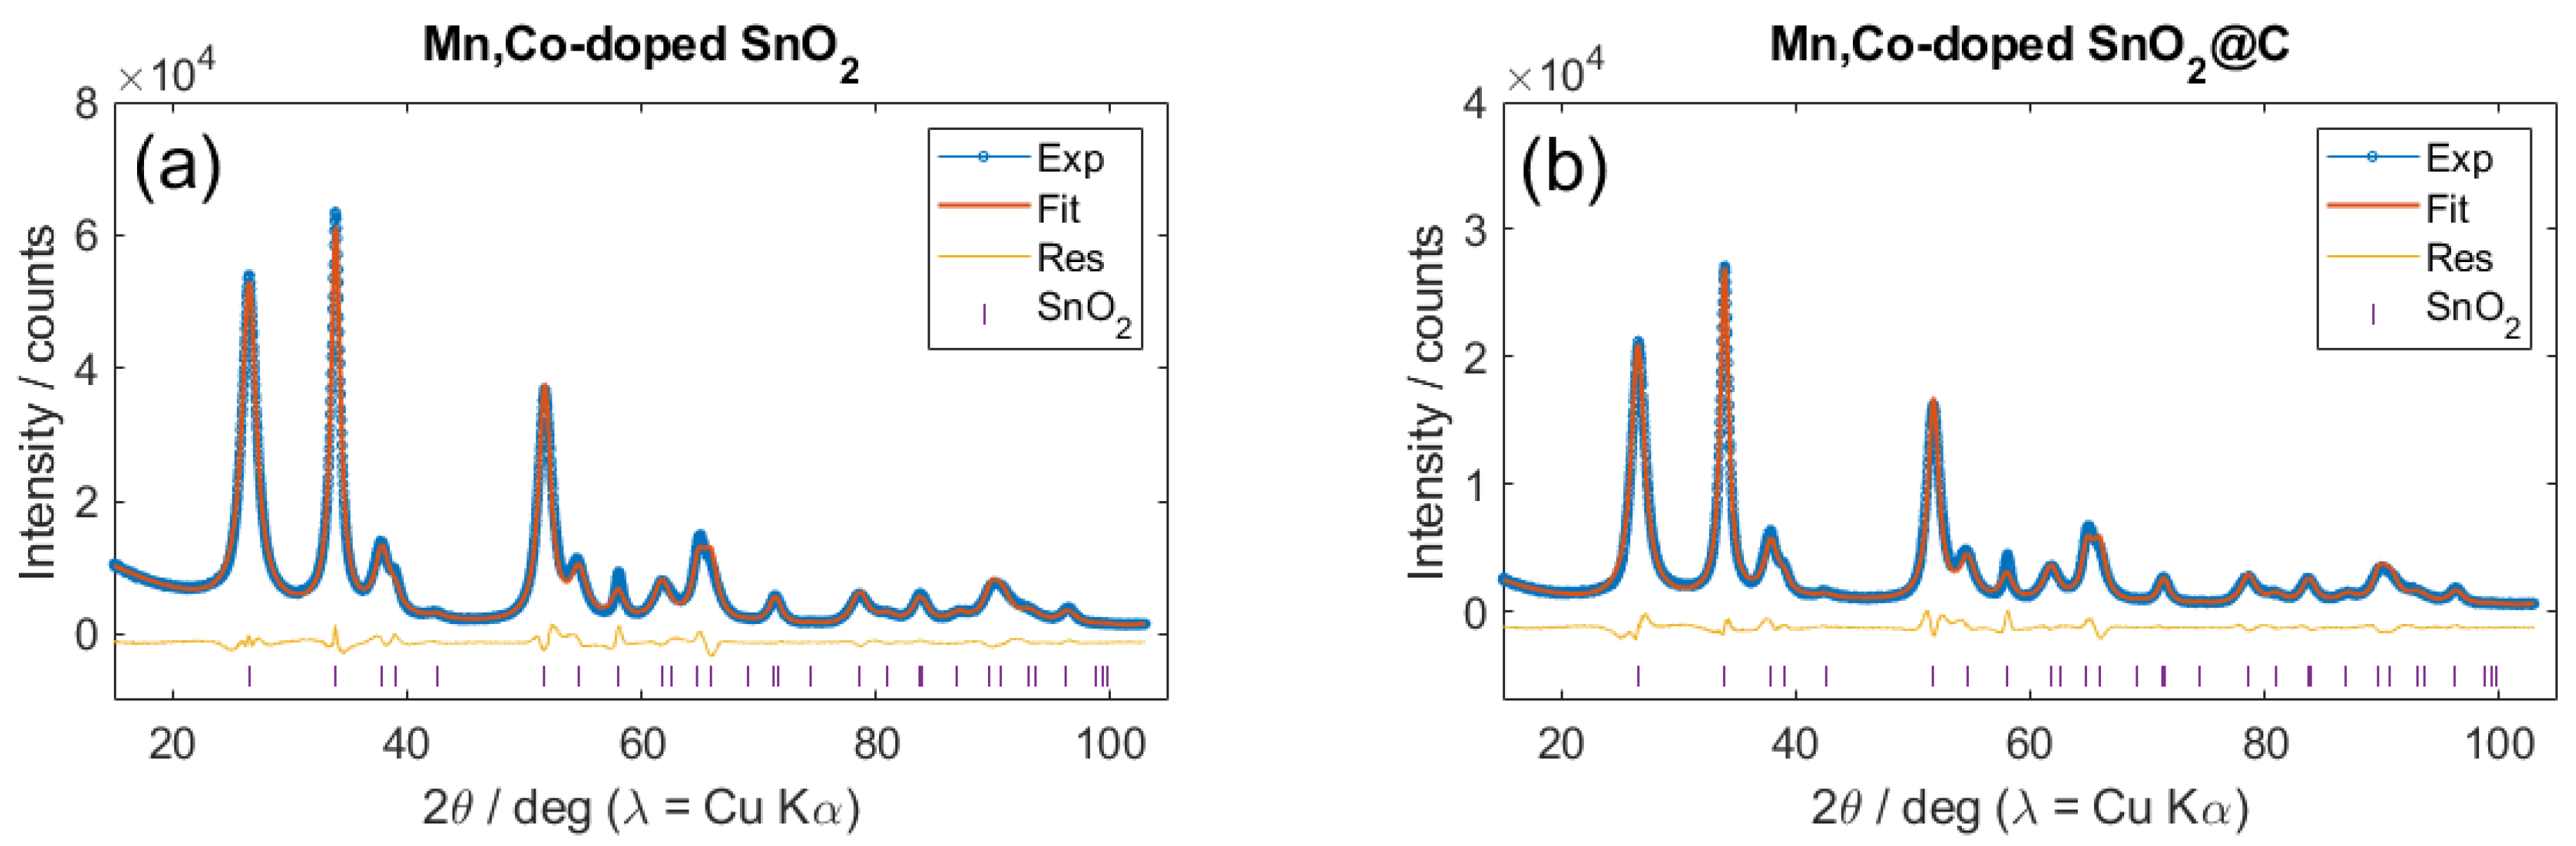
2.1. General Properties of (Carbon-Coated) Sn0.9Co0.05Mn0.05O2
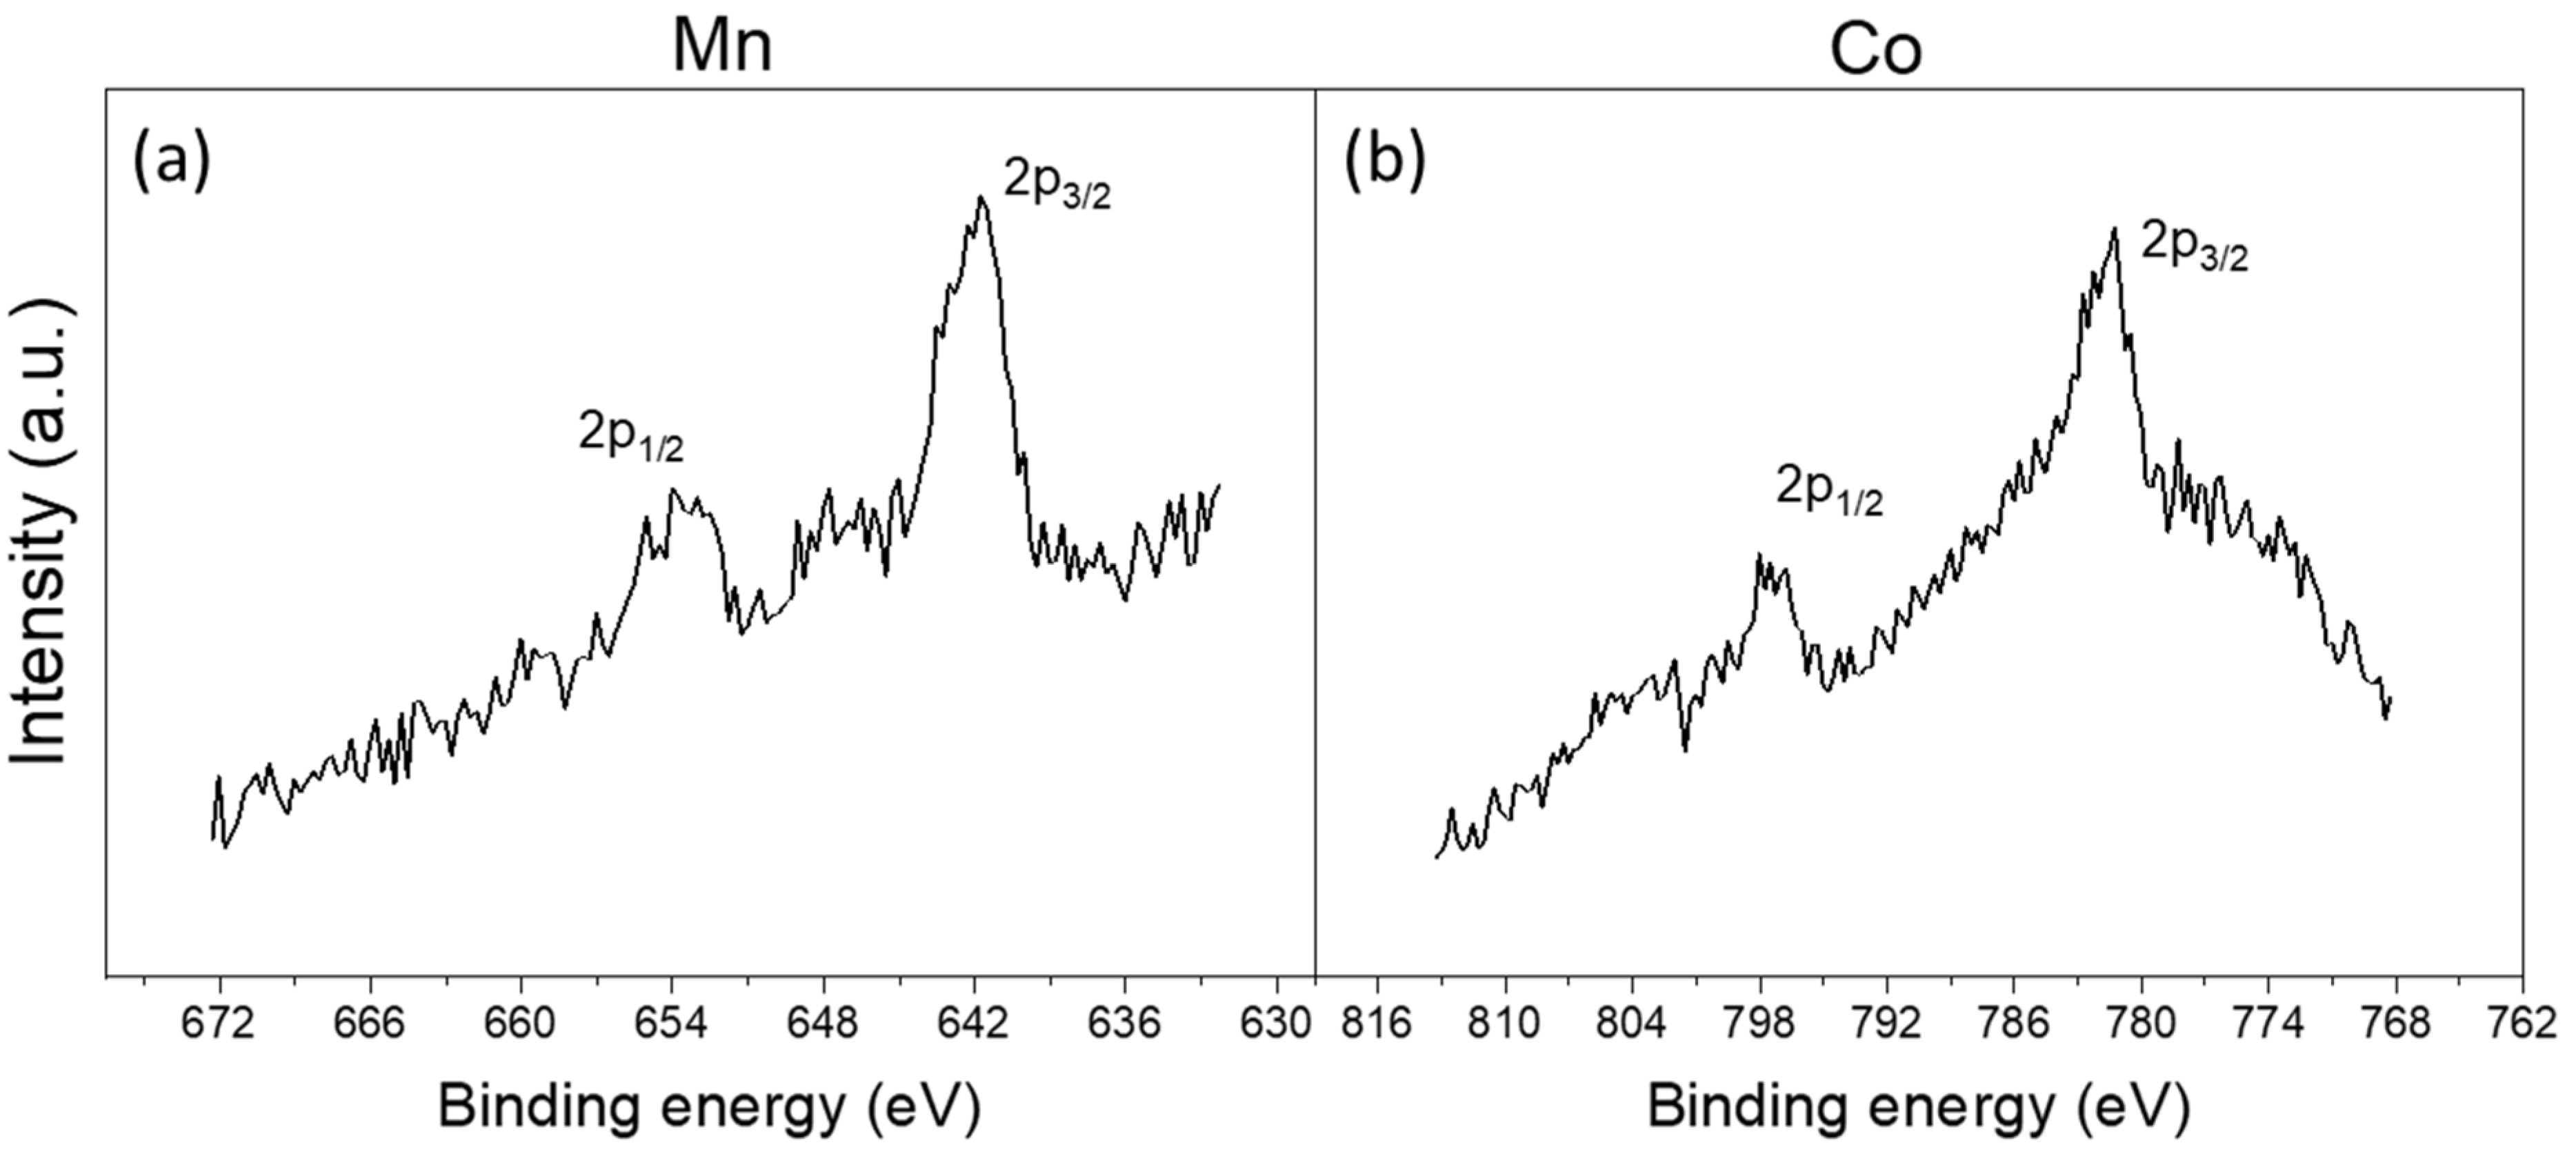
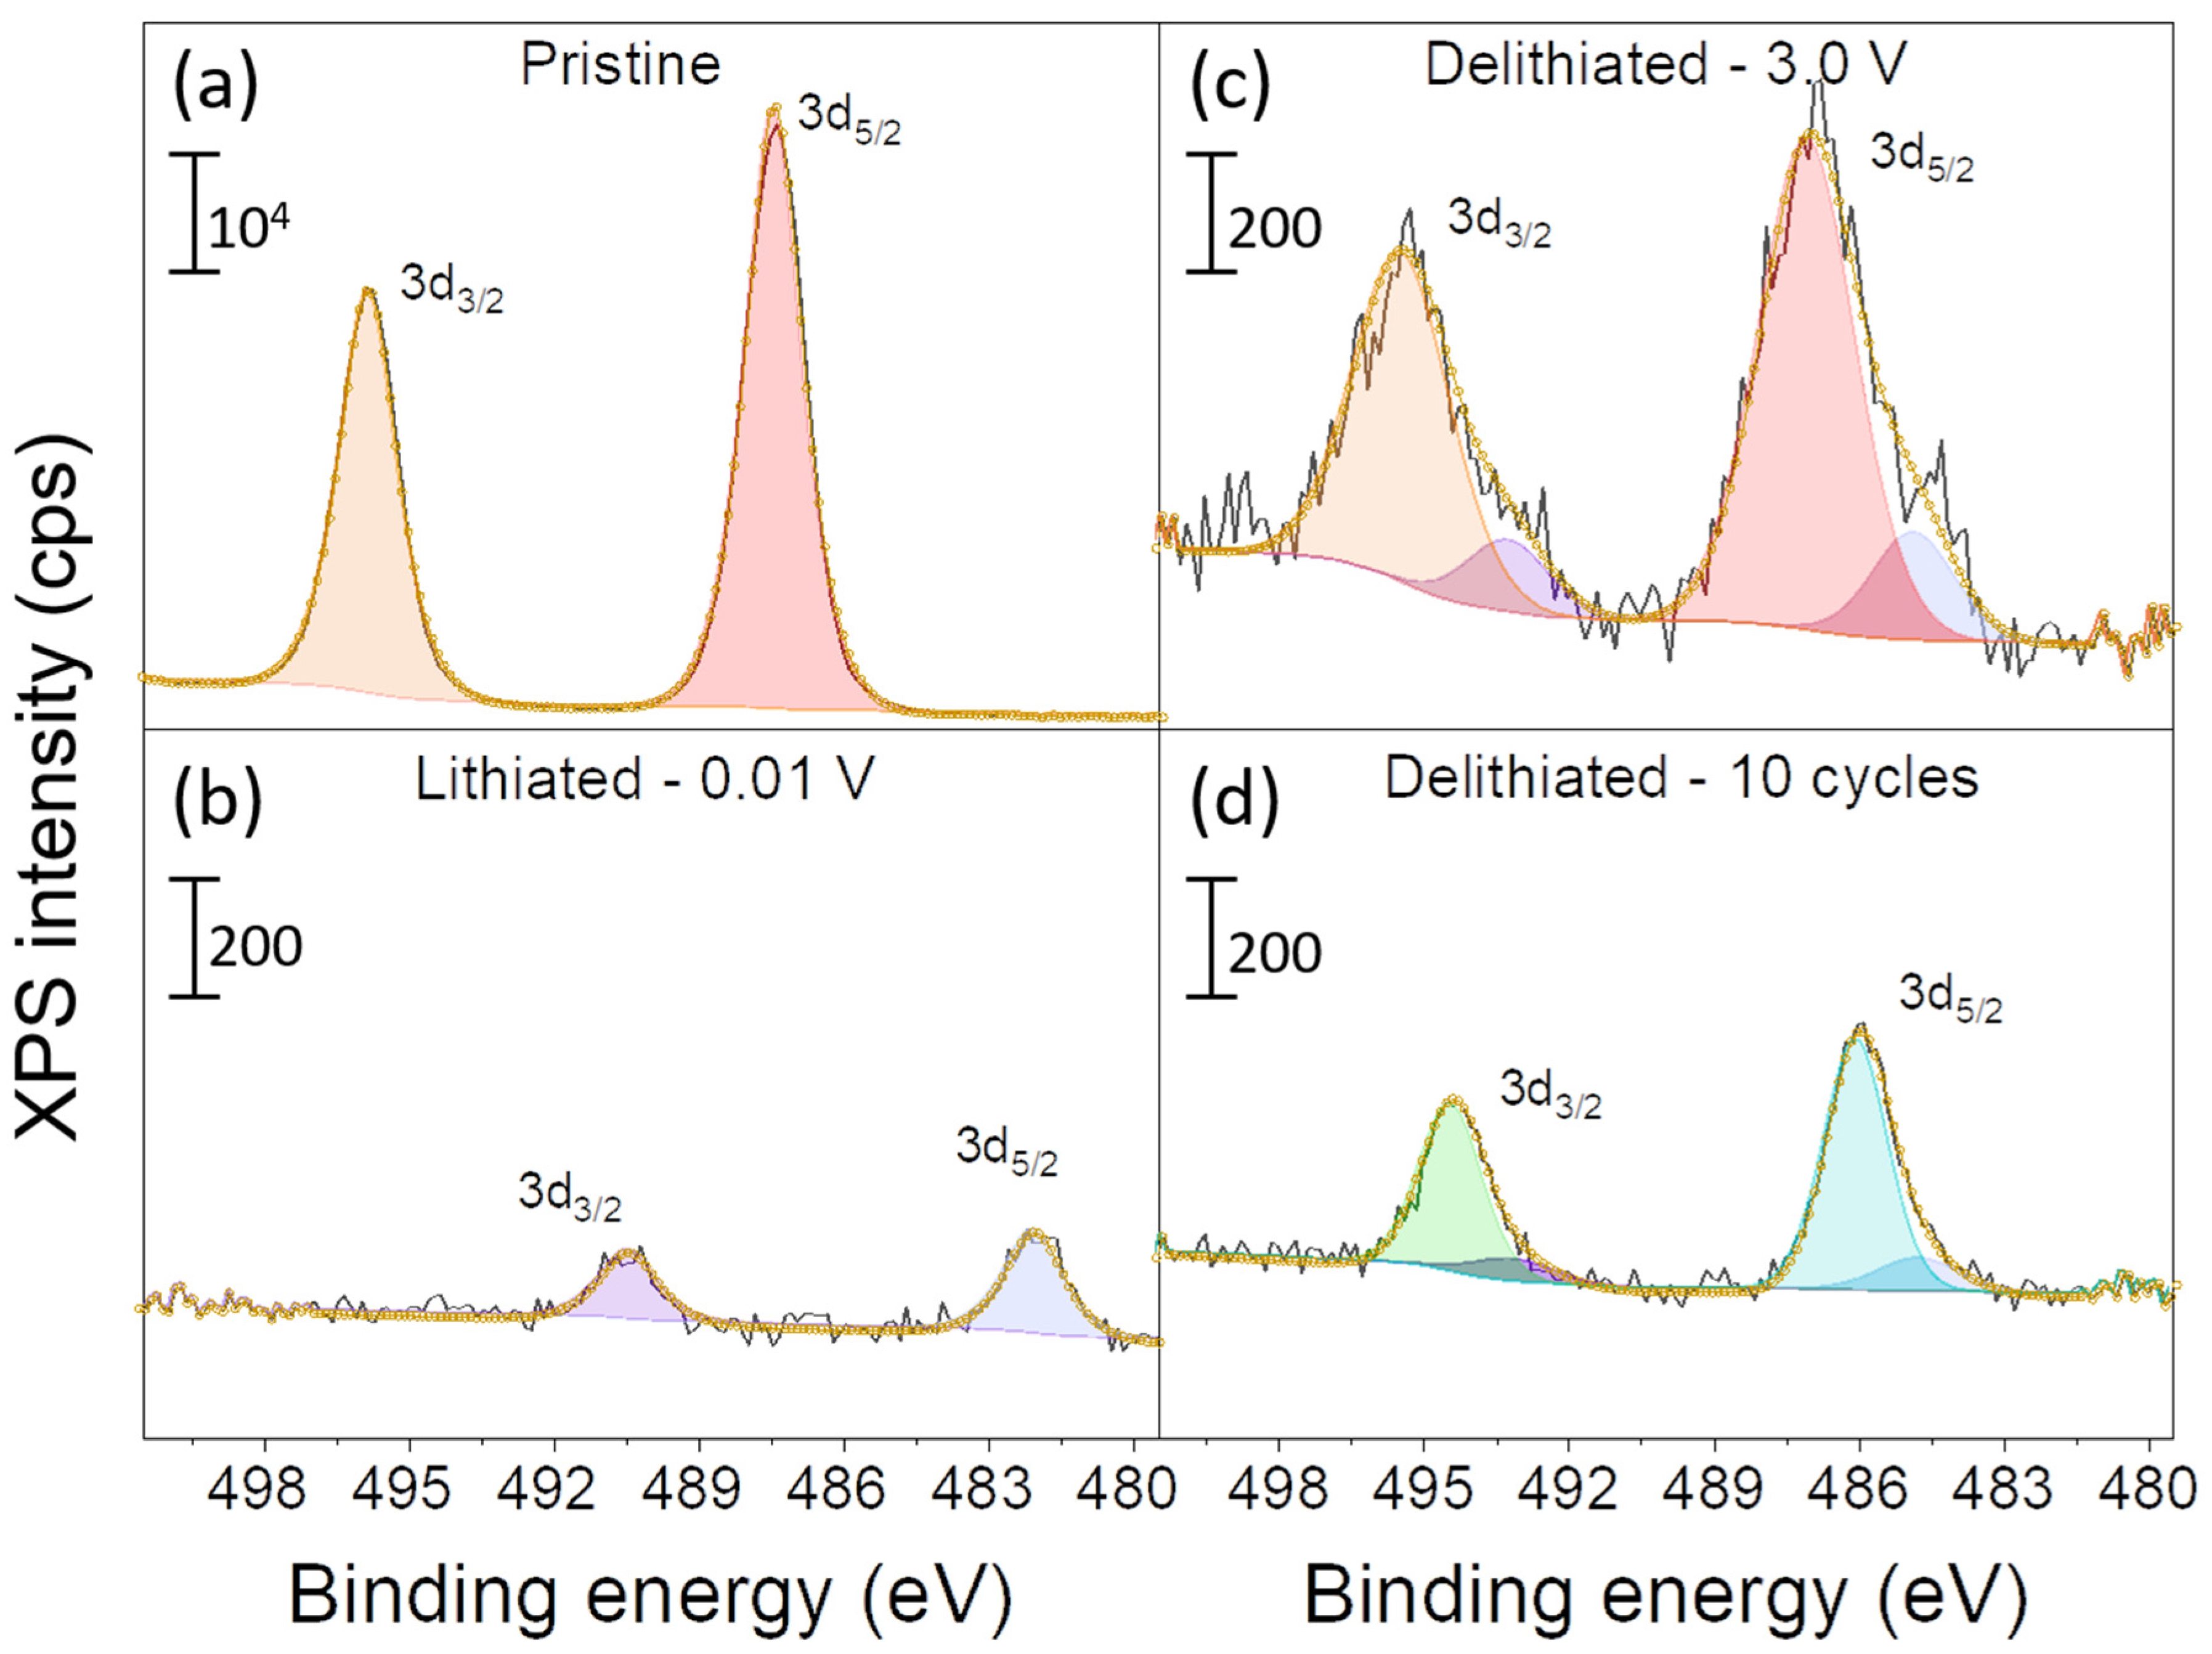
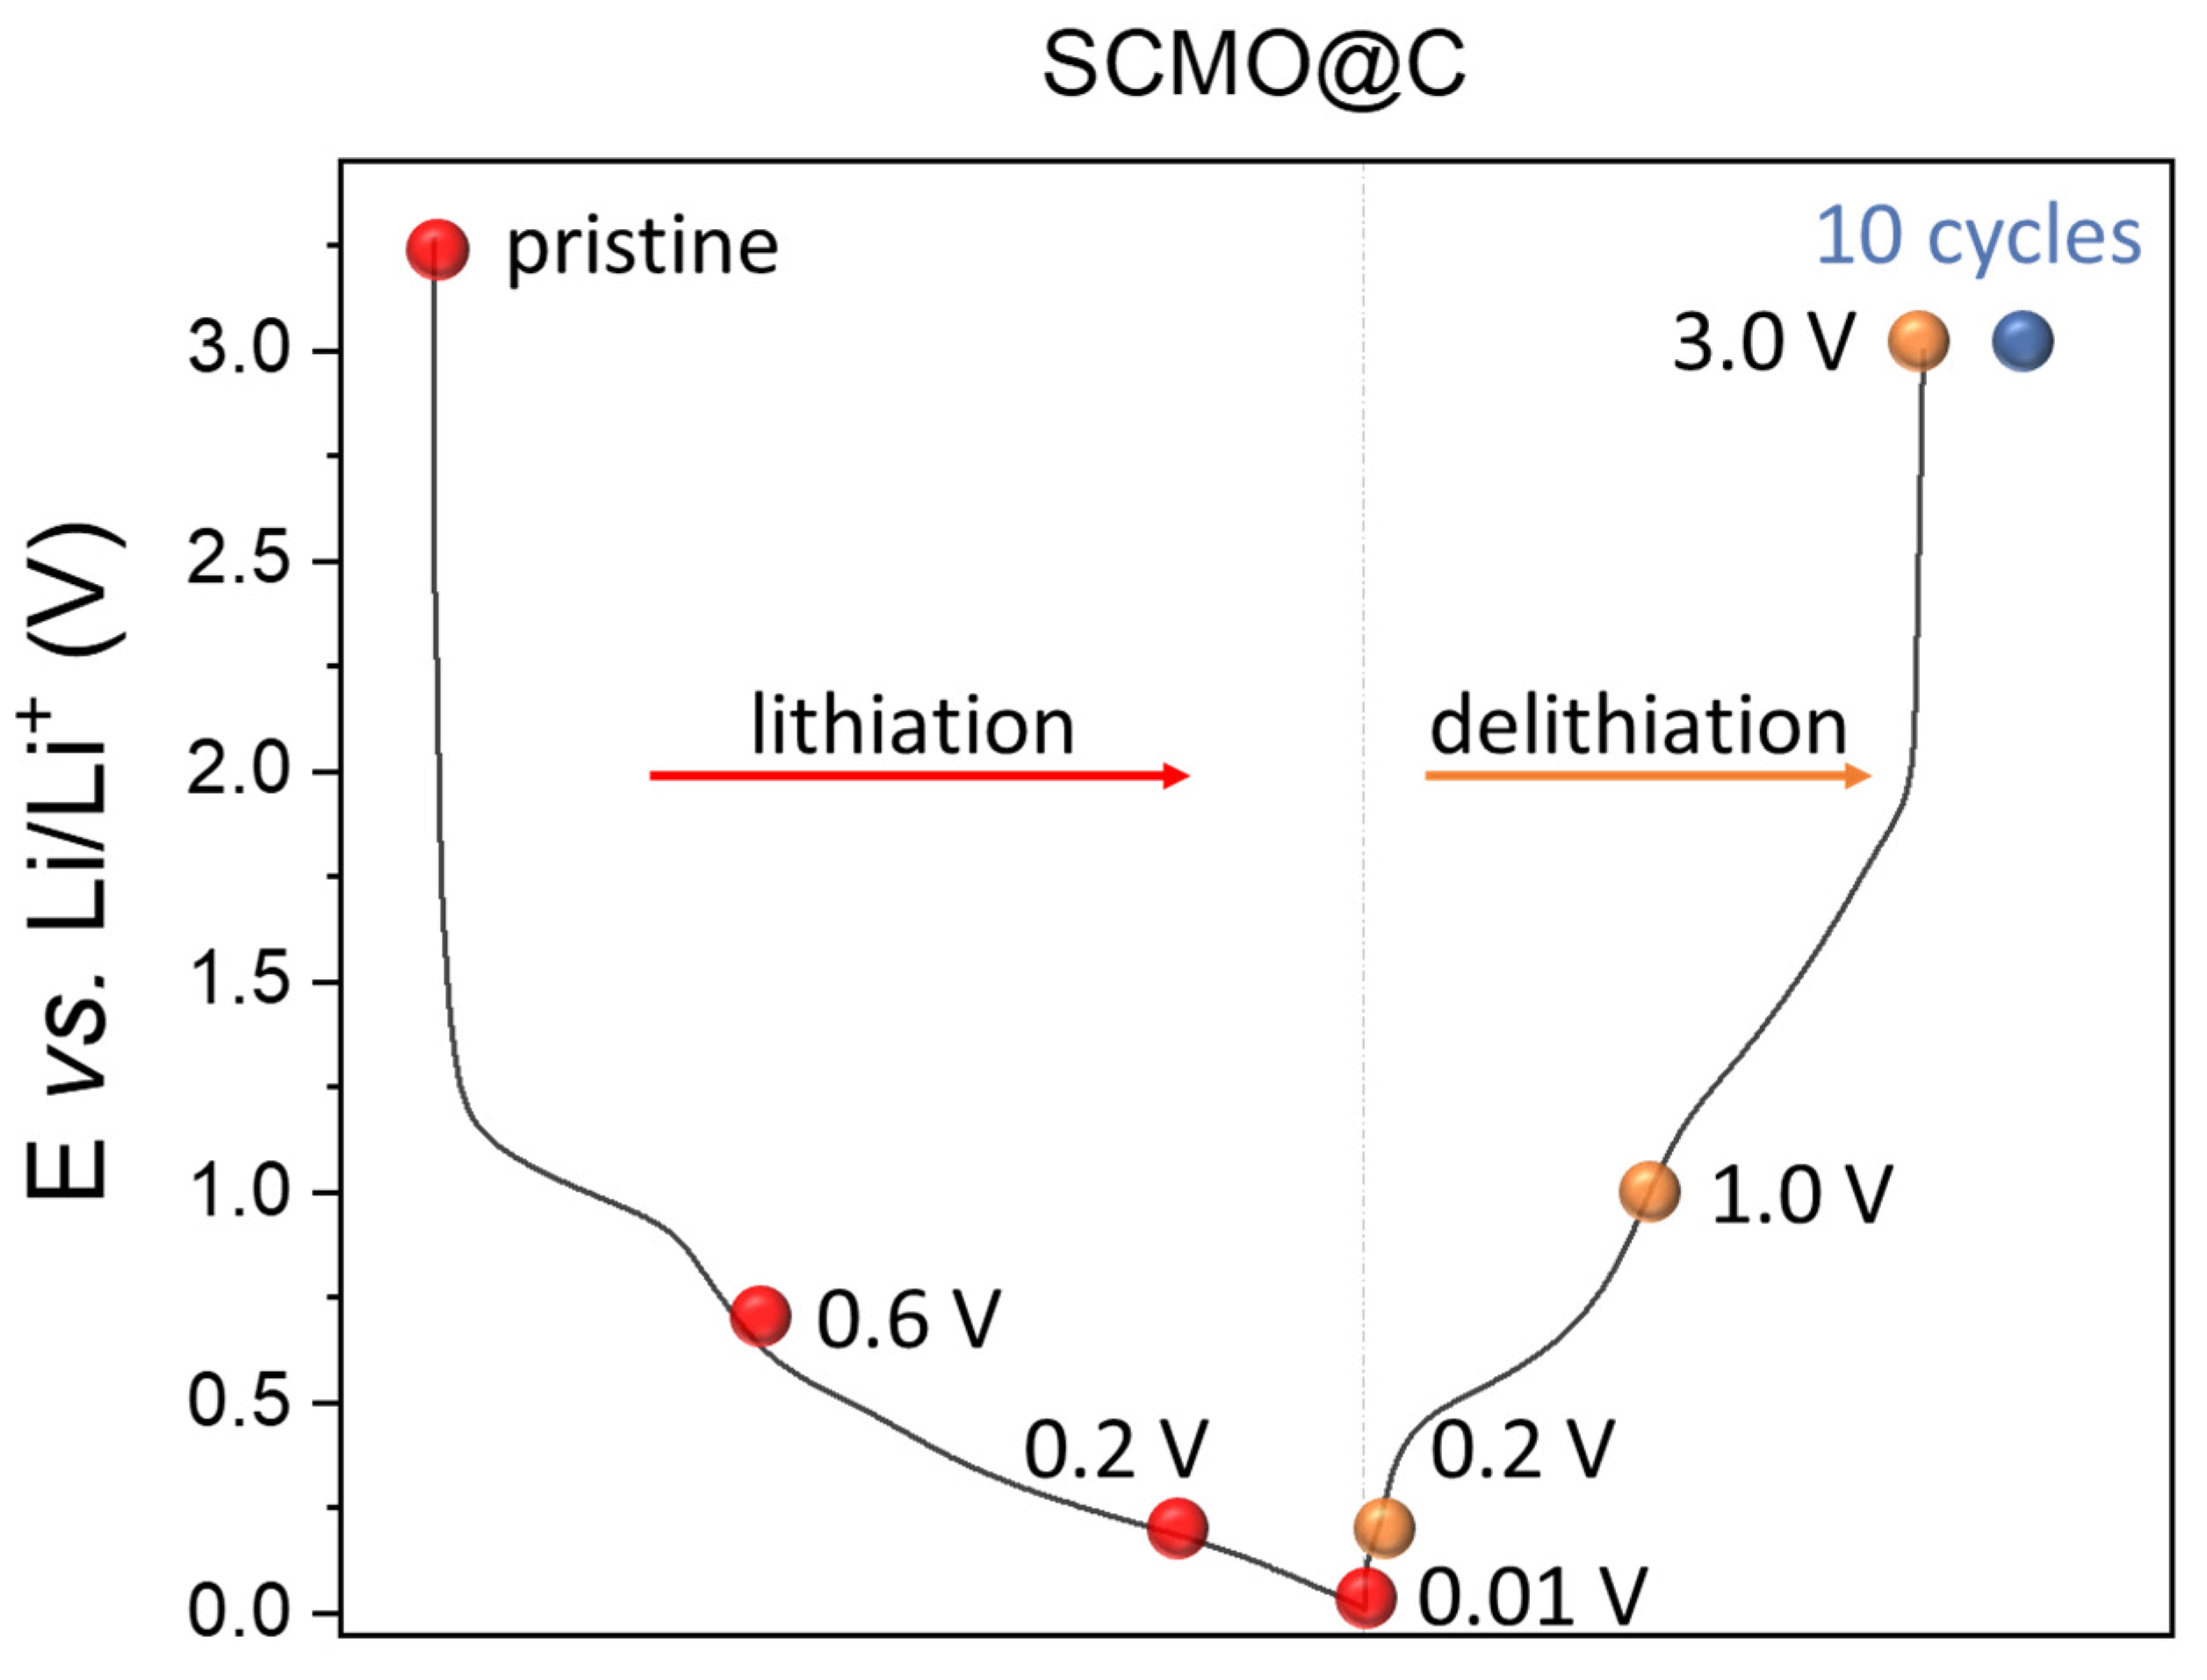
2.2. Ex Situ XPS
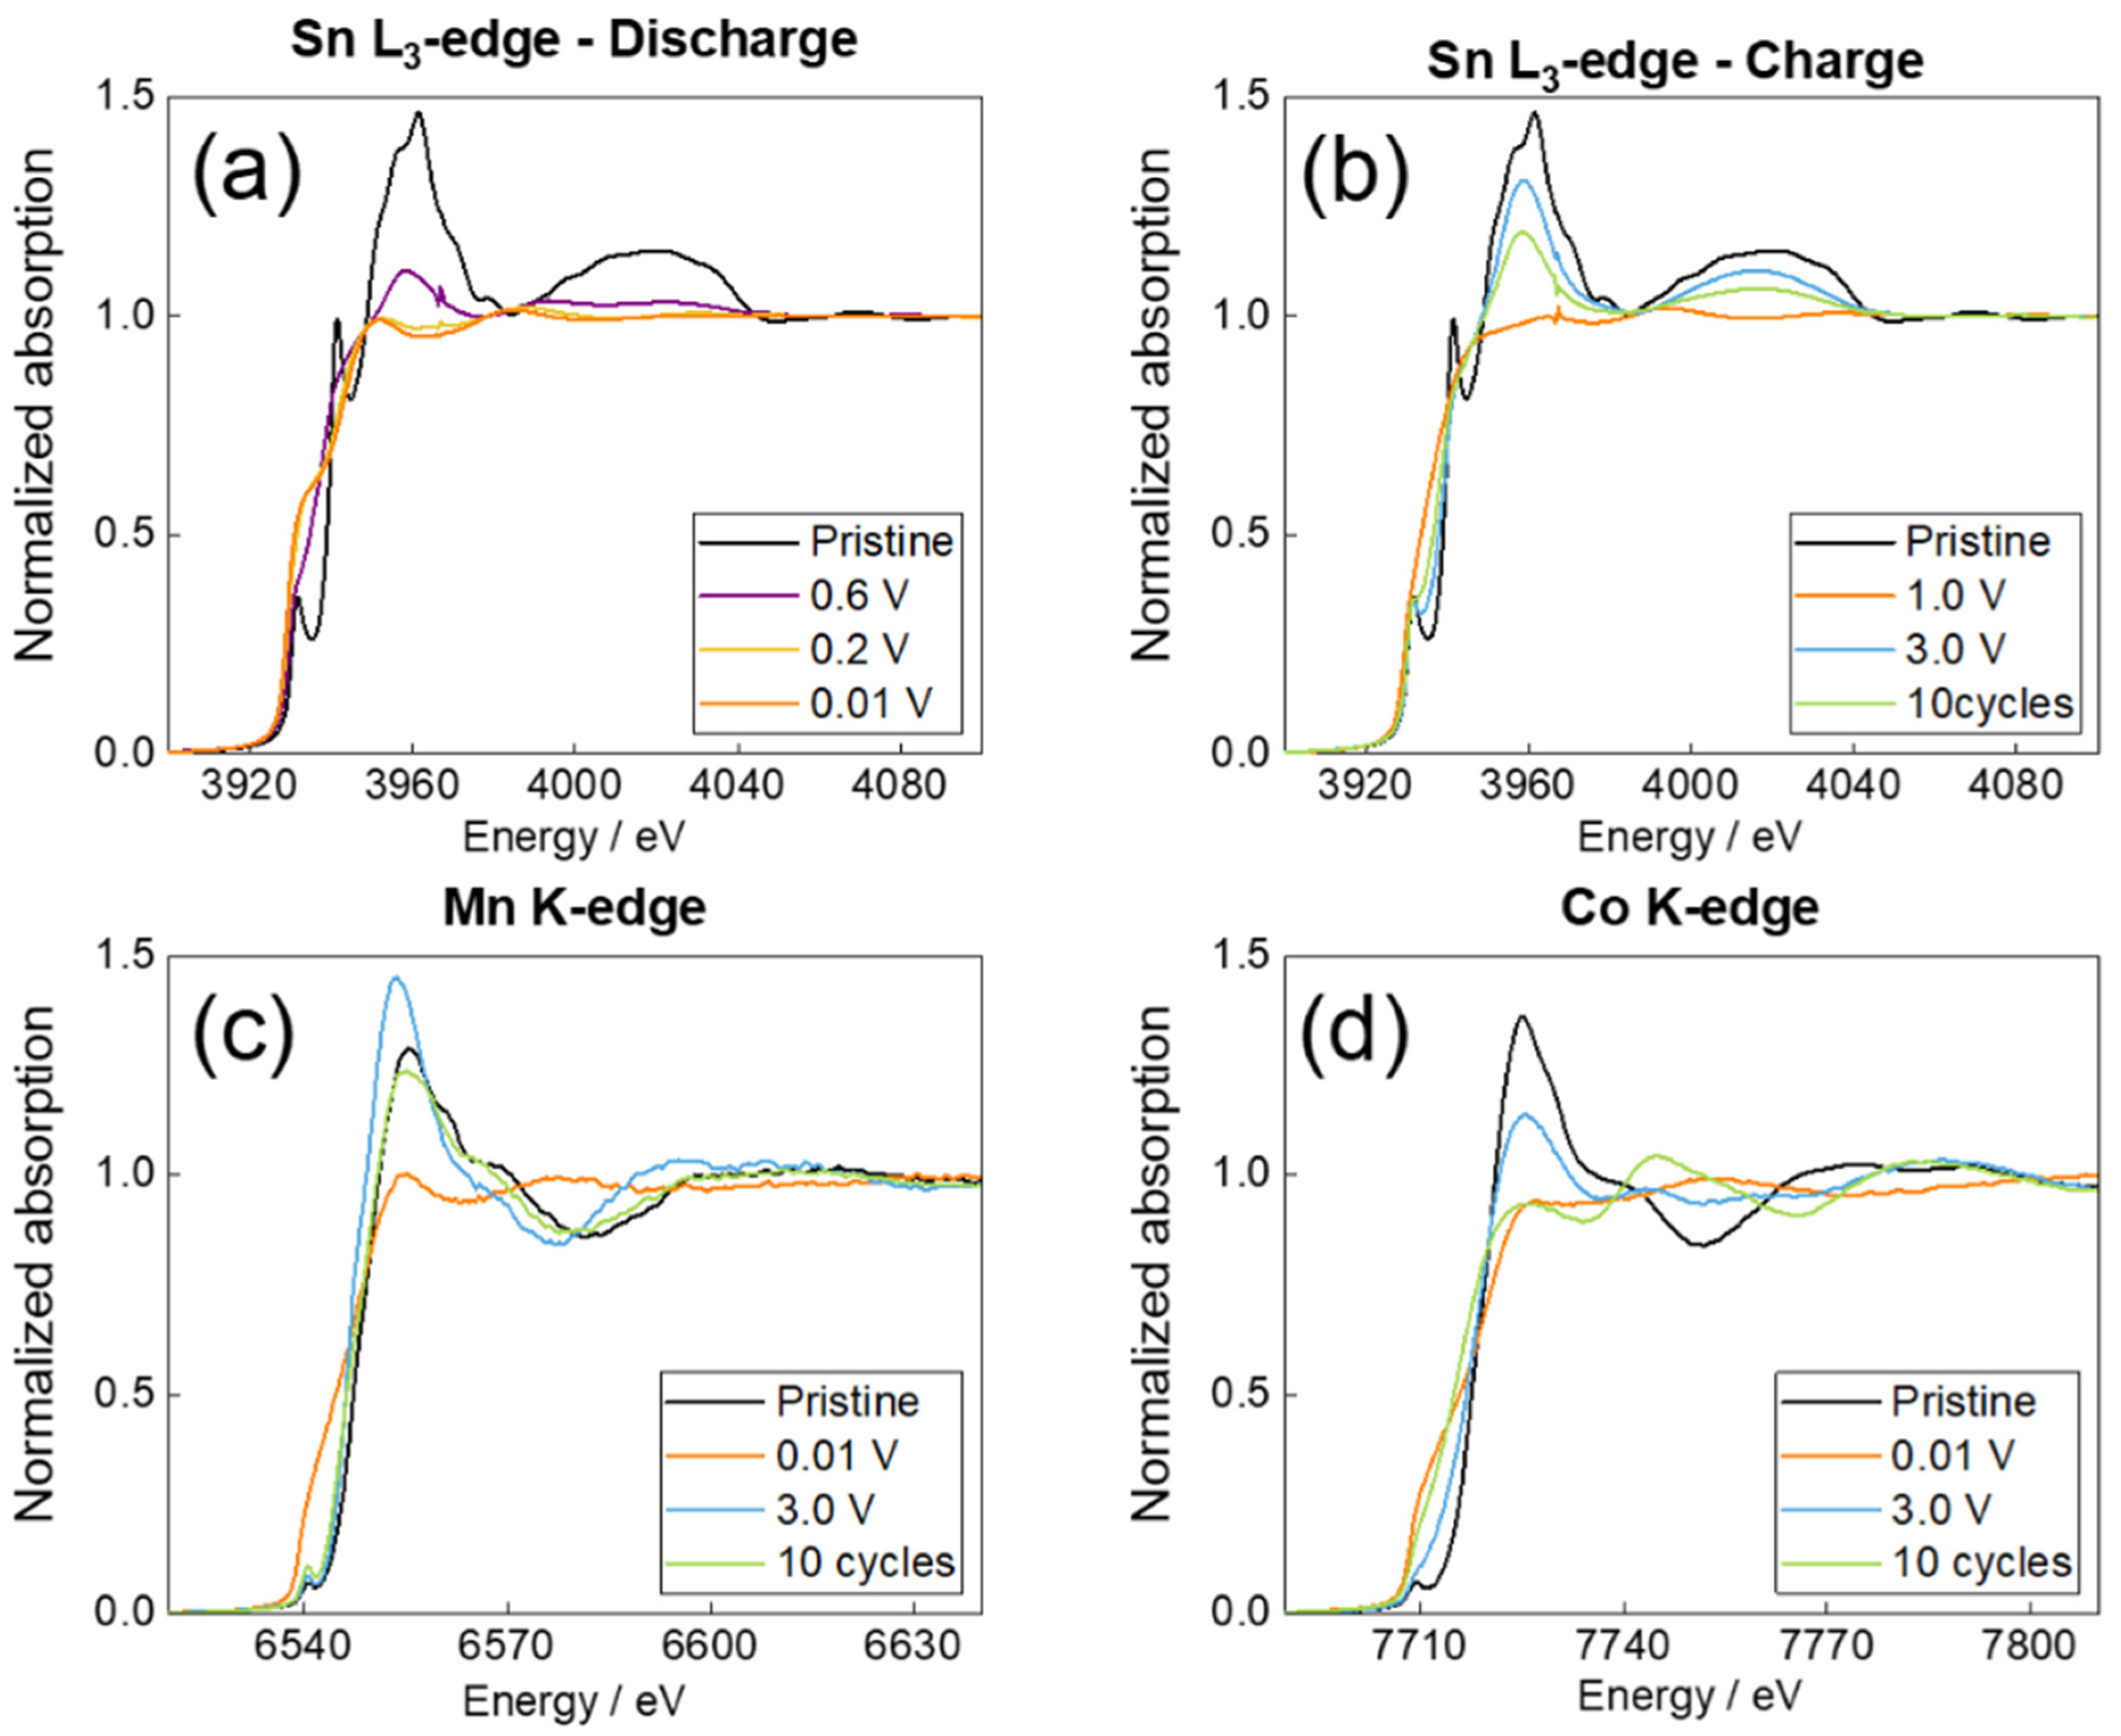
2.3. Ex Situ XAS—Experimental Data
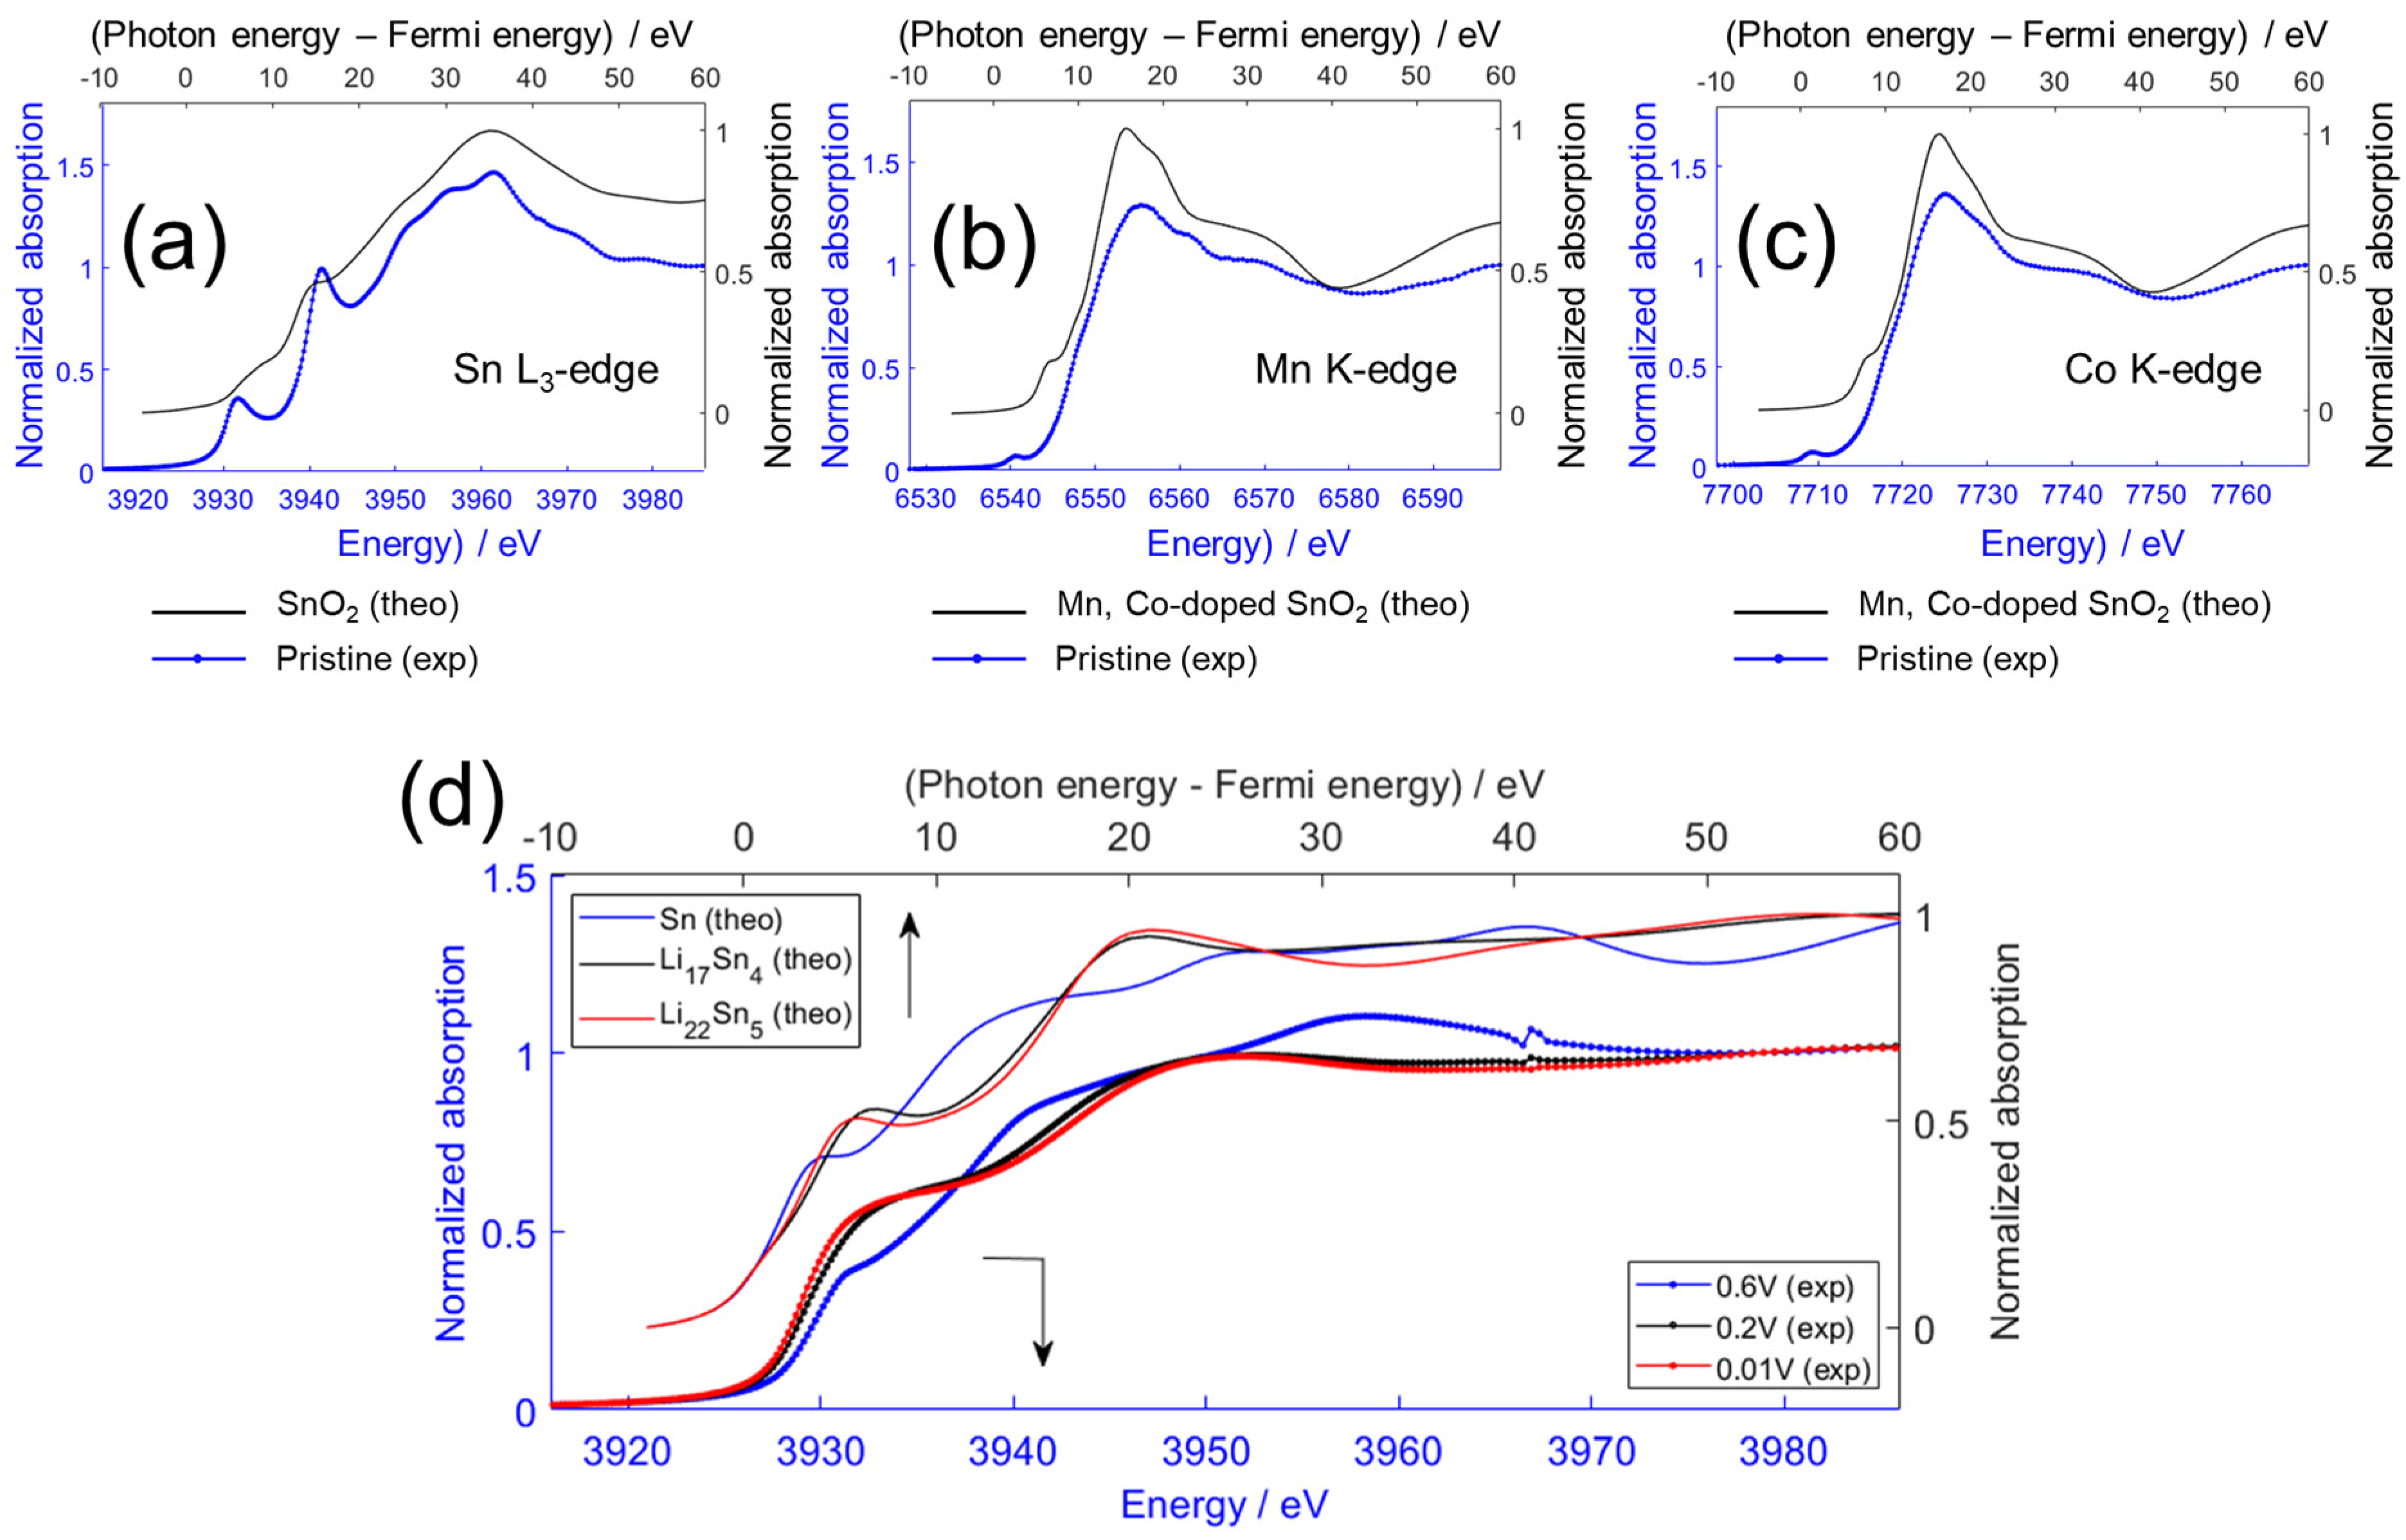
2.4. Ex Situ XAS—Comparison of Experiment and Simulation
3. Conclusions
4. Materials and Methods
4.1. Synthesis of (Carbon-Coated) Sn0.9Co0.05Mn0.05O2
4.2. Physicochemical Characterization
4.3. Ex Situ X-ray Photoelectron Spectroscopy
4.4. Ex Situ X-ray Absorption Spectroscopy—Sample Preparation
4.5. Ex Situ X-ray Absorption Spectroscopy—Data Collection
4.6. Ab Initio XANES Simulation
4.7. Extended X-ray Absorption Fine Structure Analysis
Supplementary Materials
Author Contributions
Funding
Data Availability Statement
Acknowledgments
Conflicts of Interest
References
- Armand, M.; Axmann, P.; Bresser, D.; Copley, M.; Edström, K.; Ekberg, C.; Guyomard, D.; Lestriez, B.; Novák, P.; Petranikova, M.; et al. Lithium-Ion Batteries—Current State of the Art and Anticipated Developments. J. Power Sources 2020, 479, 228708. [Google Scholar] [CrossRef]
- Armand, M.; Tarascon, J.-M. Building Better Batteries. Nature 2008, 451, 652–657. [Google Scholar] [CrossRef] [PubMed]
- Asenbauer, J.; Eisenmann, T.; Kuenzel, M.; Kazzazi, A.; Chen, Z.; Bresser, D. The Success Story of Graphite as a Lithium-Ion Anode Material—Fundamentals, Remaining Challenges, and Recent Developments Including Silicon (Oxide) Composites. Sustain. Energy Fuels 2020, 4, 5387–5416. [Google Scholar] [CrossRef]
- Xu, K.; Lam, Y.; Zhang, S.S.; Jow, T.R.; Curtis, T.B. Solvation Sheath of Li+ in Nonaqueous Electrolytes and Its Implication of Graphite/Electrolyte Interface Chemistry. J. Phys. Chem. C 2007, 111, 7411–7421. [Google Scholar] [CrossRef]
- Bresser, D.; Passerini, S.; Scrosati, B. Leveraging Valuable Synergies by Combining Alloying and Conversion for Lithium-Ion Anodes. Energy Environ. Sci. 2016, 9, 3348–3367. [Google Scholar] [CrossRef] [Green Version]
- Obrovac, M.N.; Chevrier, V.L. Alloy Negative Electrodes for Li-Ion Batteries. Chem. Rev. 2014, 114, 11444–11502. [Google Scholar] [CrossRef] [PubMed]
- Bresser, D.; Paillard, E.; Niehoff, P.; Krueger, S.; Mueller, F.; Winter, M.; Passerini, S. Challenges of “Going Nano”: Enhanced Electrochemical Performance of Cobalt Oxide Nanoparticles by Carbothermal Reduction and In Situ Carbon Coating. ChemPhysChem 2014, 15, 2177–2185. [Google Scholar] [CrossRef] [PubMed]
- Cabana, J.; Monconduit, L.; Larcher, D.; Palacín, M.R. Beyond Intercalation-Based Li-Ion Batteries: The State of the Art and Challenges of Electrode Materials Reacting Through Conversion Reactions. Adv. Mater. 2010, 22, E170–E192. [Google Scholar] [CrossRef] [PubMed]
- Fang, S.; Bresser, D.; Passerini, S. Transition Metal Oxide Anodes for Electrochemical Energy Storage in Lithium- and Sodium-Ion Batteries. Adv. Energy Mater. 2020, 10, 1902485. [Google Scholar] [CrossRef]
- Ma, Y.; Ma, Y.; Giuli, G.; Diemant, T.; Behm, R.J.; Geiger, D.; Kaiser, U.; Ulissi, U.; Passerini, S.; Bresser, D. Conversion/Alloying Lithium-Ion Anodes—Enhancing the Energy Density by Transition Metal Doping. Sustain. Energy Fuels 2018, 2, 2601–2608. [Google Scholar] [CrossRef] [Green Version]
- Asenbauer, J.; Varzi, A.; Passerini, S.; Bresser, D. Revisiting the Energy Efficiency and (Potential) Full-Cell Performance of Lithium-Ion Batteries Employing Conversion/Alloying-Type Negative Electrodes. J. Power Sources 2020, 473, 228583. [Google Scholar] [CrossRef]
- Asenbauer, J.; Binder, J.R.; Mueller, F.; Kuenzel, M.; Geiger, D.; Kaiser, U.; Passerini, S.; Bresser, D. Scalable Synthesis of Microsized, Nanocrystalline Zn0.9Fe0.1O-C Secondary Particles and Their Use in Zn0.9Fe0.1O-C/LiNi0.5Mn1.5O4 Lithium-Ion Full Cells. ChemSusChem 2020, 13, 3504–3513. [Google Scholar] [CrossRef] [PubMed]
- Eisenmann, T.; Asenbauer, J.; Rezvani, S.J.; Diemant, T.; Behm, R.J.; Geiger, D.; Kaiser, U.; Passerini, S.; Bresser, D. Impact of the Transition Metal Dopant in Zinc Oxide Lithium-Ion Anodes on the Solid Electrolyte Interphase Formation. Small Methods 2021, 5, 2001021. [Google Scholar] [CrossRef] [PubMed]
- Asenbauer, J.; Kuenzel, M.; Eisenmann, T.; Birrozzi, A.; Chang, J.-K.; Passerini, S.; Bresser, D. Determination of the Volume Changes Occurring for Conversion/Alloying-Type Li-Ion Anodes upon Lithiation/Delithiation. J. Phys. Chem. Lett. 2020, 8, 8238–8245. [Google Scholar] [CrossRef]
- Mueller, F.; Geiger, D.; Kaiser, U.; Passerini, S.; Bresser, D. Elucidating the Impact of Cobalt Doping on the Lithium Storage Mechanism in Conversion/Alloying-Type Zinc Oxide Anodes. ChemElectroChem 2016, 3, 1311–1319. [Google Scholar] [CrossRef]
- Trapananti, A.; Eisenmann, T.; Giuli, G.; Mueller, F.; Moretti, A.; Passerini, S.; Bresser, D. Isovalent vs. Aliovalent Transition Metal Doping of Zinc Oxide Lithium-Ion Battery Anodes—In-Depth Investigation by Ex Situ and Operando X-Ray Absorption Spectroscopy. Mater. Today Chem. 2021, 20, 100478. [Google Scholar] [CrossRef]
- Asenbauer, J.; Passerini, S.; Bresser, D. ZnO-Based Conversion/Alloying Negative Electrodes for Lithium-Ion Batteries: Impact of Mixing Intimacy. Energy Technol. 2021, 9, 2001084. [Google Scholar] [CrossRef]
- Birrozzi, A.; Asenbauer, J.; Ashton, T.E.; Groves, A.R.; Geiger, D.; Kaiser, U.; Darr, J.A.; Bresser, D. Tailoring the Charge/Discharge Potentials and Electrochemical Performance of SnO₂ Lithium-Ion Anodes by Transition Metal Co-Doping. Batter. Supercaps 2020, 3, 284–292. [Google Scholar] [CrossRef] [Green Version]
- Giuli, G.; Trapananti, A.; Mueller, F.; Bresser, D.; d’Acapito, F.; Passerini, S. Insights into the Effect of Iron and Cobalt Doping on the Structure of Nanosized ZnO. Inorg. Chem. 2015, 54, 9393–9400. [Google Scholar] [CrossRef] [Green Version]
- Biesinger, M.C.; Payne, B.P.; Grosvenor, A.P.; Lau, L.W.M.; Gerson, A.R.; Smart, R.S.C. Resolving Surface Chemical States in XPS Analysis of First Row Transition Metals, Oxides and Hydroxides: Cr, Mn, Fe, Co and Ni. Appl. Surf. Sci. 2011, 257, 2717–2730. [Google Scholar] [CrossRef]
- Briggs, D.; Wanger, C.D.; Riggs, W.M.; Davis, L.E.; Moulder, J.F.; Muilenberg, G.E. Handbook of X-Ray Photoelectron Spectroscopy; Perkin-Elmer Corp., Physical Electronics Division: Eden Prairie, MI, USA, 1981; Volume 3, p. 195. [Google Scholar] [CrossRef]
- Huang, J.; Liu, Y.; Wu, Y.; Li, X. Influence of Mn Doping on the Sensing Properties of SnO2 Nanobelt to Ethanol. Am. J. Anal. Chem. 2017, 8, 60–71. [Google Scholar] [CrossRef] [Green Version]
- Tallapally, V.; Esteves, R.J.A.; Nahar, L.; Arachchige, I.U. Multivariate Synthesis of Tin Phosphide Nanoparticles: Temperature, Time, and Ligand Control of Size, Shape, and Crystal Structure. Chem. Mater. 2016, 28, 5406–5414. [Google Scholar] [CrossRef]
- Li, J.-T.; Swiatowska, J.; Seyeux, A.; Huang, L.; Maurice, V.; Sun, S.-G.; Marcus, P. XPS and ToF-SIMS Study of Sn–Co Alloy Thin Films as Anode for Lithium Ion Battery. J. Power Sources 2010, 195, 8251–8257. [Google Scholar] [CrossRef]
- Ehinon, K.K.D.; Naille, S.; Dedryvère, R.; Lippens, P.-E.; Jumas, J.-C.; Gonbeau, D. Ni3Sn4 Electrodes for Li-Ion Batteries: Li−Sn Alloying Process and Electrode/Electrolyte Interface Phenomena. Chem. Mater. 2008, 20, 5388–5398. [Google Scholar] [CrossRef]
- Wen, C.J.; Huggins, R.A. Thermodynamic Study of the Lithium-Tin System. J. Electrochem. Soc. 1981, 128, 1181–1187. [Google Scholar] [CrossRef]
- Huggins, R.A.; Wen, C.J. Chemical Diffusion in Intermediate Phase in the Lithium-Tin System. J. Solid State Chem. 1980, 35, 376–384. [Google Scholar]
- Winter, M.; Besenhard, J.O. Electrochemical Lithiation of Tin and Tin-Based Intermetallics and Composites. Electrochim. Acta 1999, 45, 31–50. [Google Scholar] [CrossRef]
- Goward, G.R.; Taylor, N.J.; Souza, D.C.S.; Nazar, L.F. The True Crystal Structure of Li17M4 (M=Ge, Sn, Pb)–Revised from Li22M5. J. Alloys Compd. 2001, 329, 82–91. [Google Scholar] [CrossRef]
- Ma, Y.; Ulissi, U.; Bresser, D.; Ma, Y.; Ji, Y.; Passerini, S. Manganese Silicate Hollow Spheres Enclosed in Reduced Graphene Oxide as Anode for Lithium-Ion Batteries. Electrochim. Acta 2017, 258, 535–543. [Google Scholar] [CrossRef]
- Darr, J.A.; Zhang, J.; Makwana, N.M.; Weng, X. Continuous Hydrothermal Synthesis of Inorganic Nanoparticles: Applications and Future Directions. Chem. Rev. 2017, 117, 11125–11238. [Google Scholar] [CrossRef] [Green Version]
- Toby, B.H.; Von Dreele, R.B. GSAS-II: The Genesis of a Modern Open-Source All Purpose Crystallography Software Package. J. Appl. Crystallogr. 2013, 46, 544–549. [Google Scholar] [CrossRef]
- Ravel, B.; Newville, M. ATHENA, ARTEMIS, HEPHAESTUS: Data Analysis for X-Ray Absorption Spectroscopy Using IFEFFIT. J. Synchrot. Radiat. 2005, 12, 537–541. [Google Scholar] [CrossRef] [Green Version]
- Joly, Y. X-Ray Absorption near-edge Structure Calculations beyond the Muffin-Tin Approximation. Phys. Rev. B Condens. Matter Mater. Phys. 2001, 63, 125120. [Google Scholar] [CrossRef]
- Hedin, L.; Lundqvist, B.I.; Lundqvist, S. Local Exchange-Correlation Potentials. Solid State Commun. 1971, 9, 537–541. [Google Scholar] [CrossRef]
- Filipponi, A.; Di Cicco, A.; Natoli, C.R. X-Ray-Absorption Spectroscopy and n-Body Distribution Functions in Condensed Matter. I. Theory. Phys. Rev. B 1995, 52, 15122–15134. [Google Scholar] [CrossRef] [PubMed]
- Filipponi, A.; Di Cicco, A. X-Ray-Absorption Spectroscopy and n-Body Distribution Functions in Condensed Matter. II. Data Analysis and Applications. Phys. Rev. B 1995, 52, 15135–15149. [Google Scholar] [CrossRef]
- Giorgetti, M.; Mukerjee, S.; Passerini, S.; McBreen, J.; Smyrl, W.H. Evidence for Reversible Formation of Metallic Cu in Cu0.1V2O5 Xerogel Cathodes during Intercalation Cycling of Li+ Ions as Detected by X-ray Absorption Spectroscopy. J. Electrochem. Soc. 2001, 148, A768. [Google Scholar] [CrossRef] [Green Version]


Publisher’s Note: MDPI stays neutral with regard to jurisdictional claims in published maps and institutional affiliations. |
© 2022 by the authors. Licensee MDPI, Basel, Switzerland. This article is an open access article distributed under the terms and conditions of the Creative Commons Attribution (CC BY) license (https://creativecommons.org/licenses/by/4.0/).
Share and Cite
Birrozzi, A.; Mullaliu, A.; Eisenmann, T.; Asenbauer, J.; Diemant, T.; Geiger, D.; Kaiser, U.; Oliveira de Souza, D.; Ashton, T.E.; Groves, A.R.; et al. Synergistic Effect of Co and Mn Co-Doping on SnO2 Lithium-Ion Anodes. Inorganics 2022, 10, 46. https://0-doi-org.brum.beds.ac.uk/10.3390/inorganics10040046
Birrozzi A, Mullaliu A, Eisenmann T, Asenbauer J, Diemant T, Geiger D, Kaiser U, Oliveira de Souza D, Ashton TE, Groves AR, et al. Synergistic Effect of Co and Mn Co-Doping on SnO2 Lithium-Ion Anodes. Inorganics. 2022; 10(4):46. https://0-doi-org.brum.beds.ac.uk/10.3390/inorganics10040046
Chicago/Turabian StyleBirrozzi, Adele, Angelo Mullaliu, Tobias Eisenmann, Jakob Asenbauer, Thomas Diemant, Dorin Geiger, Ute Kaiser, Danilo Oliveira de Souza, Thomas E. Ashton, Alexandra R. Groves, and et al. 2022. "Synergistic Effect of Co and Mn Co-Doping on SnO2 Lithium-Ion Anodes" Inorganics 10, no. 4: 46. https://0-doi-org.brum.beds.ac.uk/10.3390/inorganics10040046