
Size Dependent Properties of Reactive Materials


FG Nanotechnologie, Institut für Mikro—und Nanelektronik and Institut für Mikro—und Nanotechnologien MacroNano® and Institut für Werkstofftechnik, TU Ilmenau, Postfach 100565, 98684 Ilmenau, Germany
*
Authors to whom correspondence should be addressed.
Inorganics 2022, 10(4), 56; https://0-doi-org.brum.beds.ac.uk/10.3390/inorganics10040056
Submission received: 2 March 2022
/
Revised: 10 April 2022
/
Accepted: 11 April 2022
/
Published: 18 April 2022
(This article belongs to the Section Inorganic Materials)
Abstract
:The nature of the self-sustained reaction of reactive materials is dependent on the physical, thermal, and mechanical properties of the reacting materials. These properties behave differently at the nano scale. Low-dimensional nanomaterials have various unusual size dependent transport properties. In this review, we summarize the theoretical and experimental reports on the size effect on melting temperature, heat capacity, reaction enthalpy, and surface energy of the materials at nano scale because nanomaterials possess a significant change in large specific surface area and surface effect than the bulk materials. According to the theoretical analysis of size dependent thermodynamic properties, such as melting temperature, cohesive energy, thermal conductivity and specific heat capacity of metallic nanoparticles and ultra-thin layers varies linearly with the reciprocal of the critical dimension. The result of this scaling relation on the material properties can affect the self-sustained reaction behavior in reactive materials. Resultant, powder compacts show lower reaction propagation velocities than bilayer system, if the particle size of the reactants and the void density is decreased an increase of the reaction propagation velocity due to an enhanced heat transfer in reactive materials can be achieved. Standard theories describing the properties of reactive material systems do not include size effects.
1. Introduction
Reactive materials represent a relatively new form of energetic materials that consist of a well-defined, heterogeneous structure and stored chemical energy. These metastable solids are composed from thin layers and fine powders of different reactants. For reactive multilayer materials, total layer thicknesses are in the range of ~0.1 to 300 μm [1]. On the other hand, for reactive nanoparticles, particle size varies from several micrometers to tens of nanometers. These are the key feature for reactive materials which distinguish them from others [1]. In general, the reactants are chosen on the basis of their tendency to react and generate heat. This means that the majority of reactant pairs are characterized by a large heat of reaction (ΔHo) and high adiabatic reaction temperature (Tad) [2]. The driving force for reactions in reactive multilayer materials is the stable and less free energy from the products. The kinetics of chemical reactions are mass diffusion and thermal transport with some energy loss mechanisms, playing against the thermodynamics and inhibiting the potential reactions [3]. These reactive materials or multilayers react either from thermal explosion, electric sparks, or mechanical force. Resultantly, heat generates and transfers through neighboring unreacted parts of the system to cause additional mixing, which induces the self-sustaining propagation reaction [3]. The nature of the self-sustaining reaction is basically dependent on the physical, thermal, and mechanical properties of the reactants, since reactive materials are the combination of micro/nano particles or nanolayers of the reactive metals or compounds [4]. However, low-dimensional nanomaterials have various unusual size dependent transport properties, owing to the distinct quantum confinement, interfacial scatterings, and surface effect at the nanoscale [2].
Nanomaterials have a large surface area to volume ratio and the effect of the surface is significant, which becomes insignificant for bulk materials [5]. The traditional thermodynamics of the bulk material is not entirely valid for nanomaterials. In general, the properties of nanomaterials depend on the surface area. However, in addition, Kaptay showed the general equation of the size dependent nanomaterial properties which is applied to their molar Gibbs energy [6]. The generalized form is as follows [6]:
where Y shows specific and molar property of ϕ phase as Yϕ, Yb,ϕ is a certain bulk value and Ys,ϕ is a certain surface value. Asp,ϕ is the surface area, where Asp,ϕ for ‘r’ radius of sphere is Asp,sphere = 3/r, and for ‘a’ side length cube is Asp,cube = 6/a. For the surface area of a cylinder, Asp,cyl =, where ‘rcap’ is the radius of the cylinder and ‘L’ is length, and for the specific area of a thin film with a ‘d’, small thickness is Asp,film =. Vm,ϕ is the molar volume of the phase and Wϕ is the molar surface area. Equation (1) shows that specific properties are proportional to the specific surface area and inversely proportional to the size of the phase. These specific properties become negligible beyond the 100 nm size of the phase. In Equation (1), size dependence on the molar volume is also applicable. However, density is inversely proportional to its molar volume. This shows that properties of nanomaterial and nanophase are not only affected by the surface area, but also by the other physical properties. So, a good understanding of size effects on thermodynamic properties are required. Generally, thermodynamic properties comprise enthalpy, melting temperature, cohesive energy, boiling temperature, melting entropy, specific heat capacity, and elastic moduli, etc. A good understanding of these thermodynamic properties allow us to utilize the reactive materials for further new applications [7].
It is observed that most thermodynamic properties for nanoparticles differ linearly with 1/D as a first estimation, i.e., D is the particle diameter. In simple words, the size dependent thermodynamic properties for nanomaterials (Pn) take the form of Pn = Pb (1 − K/D), where Pb is the equivalent to bulk value and K is a constant depending on material properties [8]. This may be observed as a scaling law for most of the size dependent thermodynamic properties for different materials [8]. However, these properties contain enthalpy, melting temperature, elastic moduli, melting entropy, and specific heat capacity etc. These identifications can assist us to make best use of the advantages and avoid the disadvantages of nanomaterials. For example, melting enthalpy depends on the surface properties influenced by high surface to volume ratio and broken, stressed, or non-saturated bonds of the surface. As the particle size reduces, the surface free energy rises, because in nano size materials the excess energy of the surface atoms contributes to the increase of the free surface energy [9]. On the other hand, in bulk materials, the contribution of the free surface energy is negligible because very few layers associate with the surface atoms. This is also reflected by the fact that bulk materials have a lower ratio of total volume to the surface atoms volume than nanomaterials. So far, numerous efforts have been devoted to understanding these behaviors through fundamental studies. Including the influence of size in reactive nanoparticles and multilayer materials on their self-propagating velocity, as well as the ignition temperature and phase transformations in heterogeneous reactions [10,11,12]. So far, to the best of our knowledge, there is no published study available that attempts to summarize the influence of size effects on the properties of reactive materials.
In this review, we summarized the theoretical and experimental reports on the size effect on melting temperature, heat capacity, reaction enthalpy, surface energy, and reaction kinetics of the materials. Consequently, this review reveals the understanding of different self-sustained reaction behavior in reactive particle and reactive multilayer systems.
2. Size Effects of Materials Properties
2.1. Melting Temperature
Different models have been developed to consider the effect of size of nanoparticles on melting temperature. Joshi et al. [12] reported the thermodynamic analysis and molecular dynamic (MD) simulations to investigate the size effect of alumina nanocrystals at melting point. Different shapes were considered, e.g., cubic and spherical particles, spherical shells, and planar thin films. They considered homogeneous and heterogeneous melting models [12]. Homogeneous melting of nanocrystals were calculated by thermodynamic analysis using models of Qi et al. [13], Guisbiers et al. [14] and the Gibbs–Thomson model [12]. The Gibbs–Thomson model equates the chemical potential for liquid and solid nanoparticles [12]. The resultant expression of the melting temperature is:
where Tmn denotes the nanocrystal melting temperature, T0 belongs to bulk melting temperature, Hm is latent heat of melting, ρs solid phase density, and γ is for interfacial energy, where l stands for liquid phase, s for solid phase, and v for vapor phase. According to Kaptay [15,16], the Gibbs–Thompson approach is not applicable for the description of the thermodynamic properties of nano materials. A strict thermodynamic description causes a change of the numerical constant in Equation (2). From Equations (2) and (3), for a spherical nanoparticle geometry [6], a more correct description of the Gibbs equation which has to be used.
The Guisbiers et al. [14] model calculates the Gibbs free energy of the solid and liquid nanocrystals. It accounts the variations in Gibbs free energy owing to the existence of free surfaces:
where A/V is the surface area/volume ratio. In contrast, the Qi et al. [13] model expresses the dependency of the cohesive energy on the melting temperature as follows:
where n belongs to Asp/Aa which shows the number of atoms present at the interface, Aa denotes an atomic area for the nanocrystal. The total number of atoms (N) is given by V/Va, V, and Va are the volume of the nanocrystal and atomic volume, respectively.
For most of the cases, heterogeneous melting is spotted. In heterogeneous melting, nucleation of the melting phase takes place at the free surface or grain boundaries and with time, melting front propagates into the inner regions of the crystal. The variation in Gibbs free energy is expressed through melt nucleation and growth as follows [12]:
where G signifies to Gibbs free energy, Asl denotes the area of solid-liquid interface, and Vm is volume of the melted region.
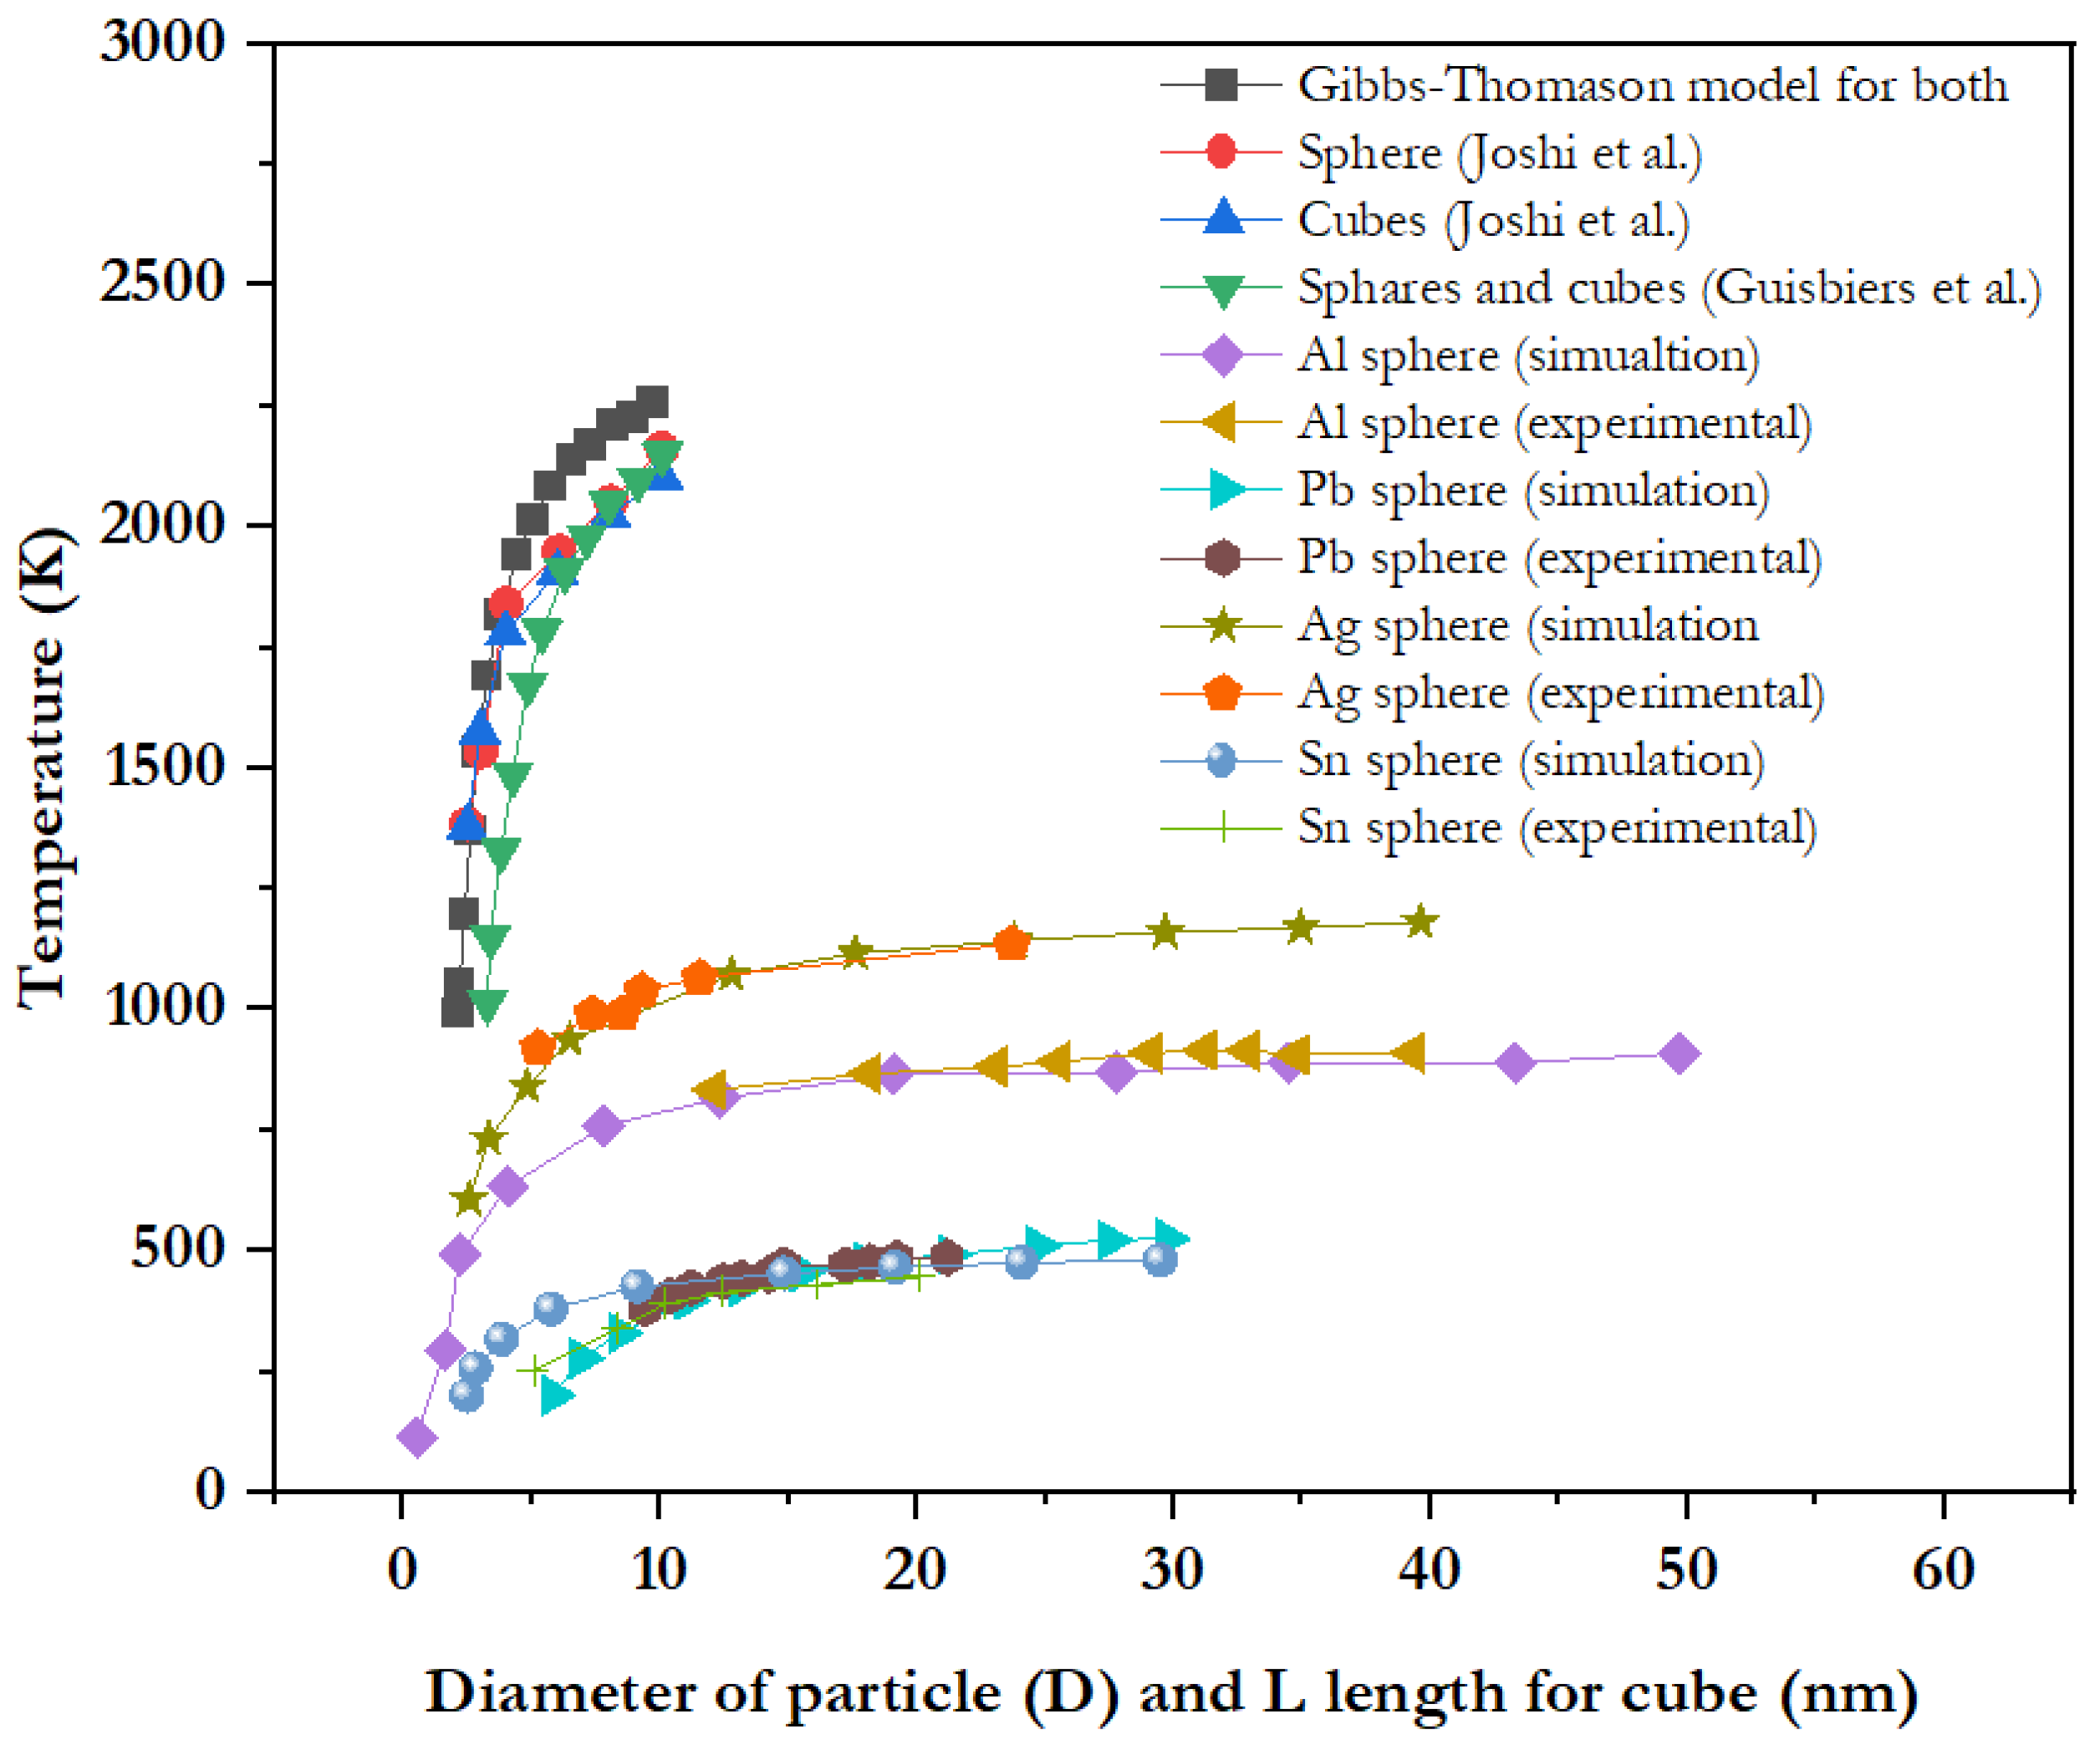
The heterogeneous nucleation of the melted phase possesses a nucleation barrier, and therefore an additional energy is required to create this interface [12]. As a result, the Gibbs free energy increases with an increase in liquid shell thickness, depending on the temperature. Simulation result [12] shows that the melting temperature drops abruptly at the threshold particle size. This threshold particle size is 4 nm for cubic and spherical particles as shown in Figure 1 [12]. Beyond 4 nm, crystal size applies a weak effect on the melting point. 1 µm is threshold for finite or semi-infinite films as shown in Figure 2 [12].
The melting point of nanoparticles is also affected by the formation of a particle shell, i.e., oxide layers. This is illustrated in Figure 2. Likewise, the melting temperature fluctuates in the range of 1800–2350 K for 100 nm or greater particle sizes with a 2–4 nm thick oxide layer [12]. This range is relatively close to the bulk melting point. Melting of the oxide layer becomes independent beyond 10 nm core size [12]. The size of the core does not create an additional ‘‘nano effect”, except the size is very small.
Both Guisbiers et al. [14] and Gibbs–Thomson [12] models explained the size dependent melting temperature behavior of nanocrystals. Guisbiers et al. [14] and Gibbs–Thomson models [12] signify the lower and upper limits of the growth melting and heterogeneous liquid nucleation respectively. Moreover, this shows that the melting temperature decreases with decrease in particle size. Nevertheless, it has to be noted that the Gibbs–Thompson approach is not correct [15,16] and the numerical constant has to be exchanged by the values given in [6]. The Gibbs–Thomson models also fails to describe the first-order nature of the solid to liquid phase transition and discontinuity of the melting transition. However, a further modified model proposed for two phases, i.e., liquid and solid phases, is represented by the following equation [7]:
relates to nanocrystal size and the shape due to the specific surface area that varies with different shaped crystals. belongs to specific surface area, Gi is Gibbs free energy for i phase where I = s or l for solid or liquid phases, and are for surface tension for liquid and surface energy for solid, ΔmH denotes the melting enthalpy at the melting point of the metal.
As we can see from the Figure 1, the melting temperatures are decreasing with decrease in particle size. The difference in the behavior of the nano-system compared to the macro-system is due to their high specific surface area (due to Gibbs or Kelvin and Gibbs –Thompson, i.e., the last two approaches are not correct according to [15,16]) [7]. It was also observed that starting from D = 10 nm, the melting temperature rapidly decreases. Sun and Simon [20], reported the effect of the oxide passivation layer on the melting temperature behavior for aluminum nanoparticles. They studied the broad to narrow size distributed particles from 8 to 50 nm particle radius ranges. They explained the correlation in melting temperature with particle size depression by the non-correct Gibbs–Thomson equation as follows [20]:
Equation (8) predicts a linear relationship between the melting point depression and the inverse of particle size, and Hm(∞) is for latent melting heat for bulk. denotes the interfacial energy for solid liquid. Further, they have included the melting heat in in the Gibbs–Thomson equation owing to the increase in the surface energy as follows:
Hm(r) represents the heat of fusion of the r particle size.
The oxide layer of aluminium creates the compressive pressure on the Al core. The correct description using the Gibbs equation will cause an exchange of the numerical constant 2 into 3 for spherical nano particles [6,15,16]) in Equations (8) and (9). Each Al nanoparticle has a 3–5 nm passivation oxide layer. As the particle size reduces, the total Al2O3 percentage increases and can convert into a considerable amount of powder. Equation (8) demonstrates that heat of fusion is reciprocal from the size of Al core. Resultantly, the oxide layer of the nanoparticles generates a compressive force to the Al core. Therefore, the observed heat of fusion and melting point are increasing. The effect of pressure on the melting temperature is introduced through the differential thermal expansion between the Al oxide shell and Al core. The compressive pressure induced from the aluminium oxide shell to the Al core. The change in melting point can be determined by the Clausius–Clapeyron equation as follows [21]:
where P denotes the pressure, belongs to the change of melting temperature due to the pressure effect, and ρl and ρs signify the liquid and solid density.
The external pressure acting on the nanoparticle core can be estimated using the following equation:
where K specifies the bulk modulus of Al, while and αAl denote the thermal expansion coefficients for aluminium oxide and Al, respectively. Tr specifies the stress-free temperature and ε denotes strain of the oxide shell.
Equation (11) is the coupled equation where the volumetric strain is induced due to differential thermal expansion subtracting the volumetric strain inside the Al core because of the accepting the oxide shell. The pressure is also affected by the temperature of oxide formation (i.e., Tr). However, the aluminium oxide layer is initially amorphous and crystallizes between 300 to 635 °C [17]. Therefore, Tr has to be taken near to the point where crystallization process finishes. The pressure P in Equation (10), will depend on particle size and shell thickness since the biaxial stress σ and biaxial strain ε in the oxide shell depend on particle size and shell thickness [22]:
where a and b denote the radius of Al core and whole particle, respectively. Y specifies the oxide biaxial modulus.
Since the oxide layer crystallizes at temperatures above Tr, the values of correspond to crystalline aluminium oxide. Lai et al. [23] showed the function of weight-average radius with melting temperature and proved the difference which was induced due to the pressure effects through the oxide layer. In addition, Kitsyunk et al. defined the change of melting temperature of thin films [19]. As the thickness of the film decreases, melting temperature decreases as well. With decreasing film thickness, the contribution of the surface energy to the total energy of the film is increasing, but the total energy of the film is decreasing due to the decreasing thickness.
2.2. Surface Energy
The surface energy affects surface phenomena of the metal like surface reconstruction, surface segregation, catalysis, fracture, and growth rate [24,25,26]. Approaching the nano size range, its behavior is completely different. Many investigations of the dependence on the size on the surface energy were carried out. Zhang et al. [27] reported the theoretical model for size and temperature dependent surface energy model and verified it by the experimental data. Zhang et al. expressed the size dependent surface energy as follows [27]:
where (R) and b are the surface energy of metals and for the bulk, NA is Avogadro constant, Z belongs to the coordination or bond number and Zs coordination number for surface atom, Eb is bonding energy, ηs and ηb are the number of atoms which are present on the surface and interior in one mole of the crystalline materials, respectively. ηs is expressed as ηs/(1 − ηs) = D0/(p − D0), with p as the nanomaterial size and D0 as the critical diameter of the nanocrystal which is located at the surface. D0 is expressed as D0 =2(3 − d)D, which depends on the q (dimensionality) and D (atomic diameter), where d = 0 for nanoparticles, 1 for nanowires and 2 for nanothin films [28].
Further, they showed the combined effect of the temperature and size of the nanomaterials on the surface energy as follows [27]:
where U(T0) is the cohesive energy at the reference temperature T0 and CV(T) is the temperature dependent specific heat at constant volume. CV(T) can be calculated using the Debye model, α(T) is the linear expansion coefficient at temperature T, C is the bond contraction coefficient, where defines the effect of the size dependency on surface energy and can explain the influence of the temperature on surface energy [27].
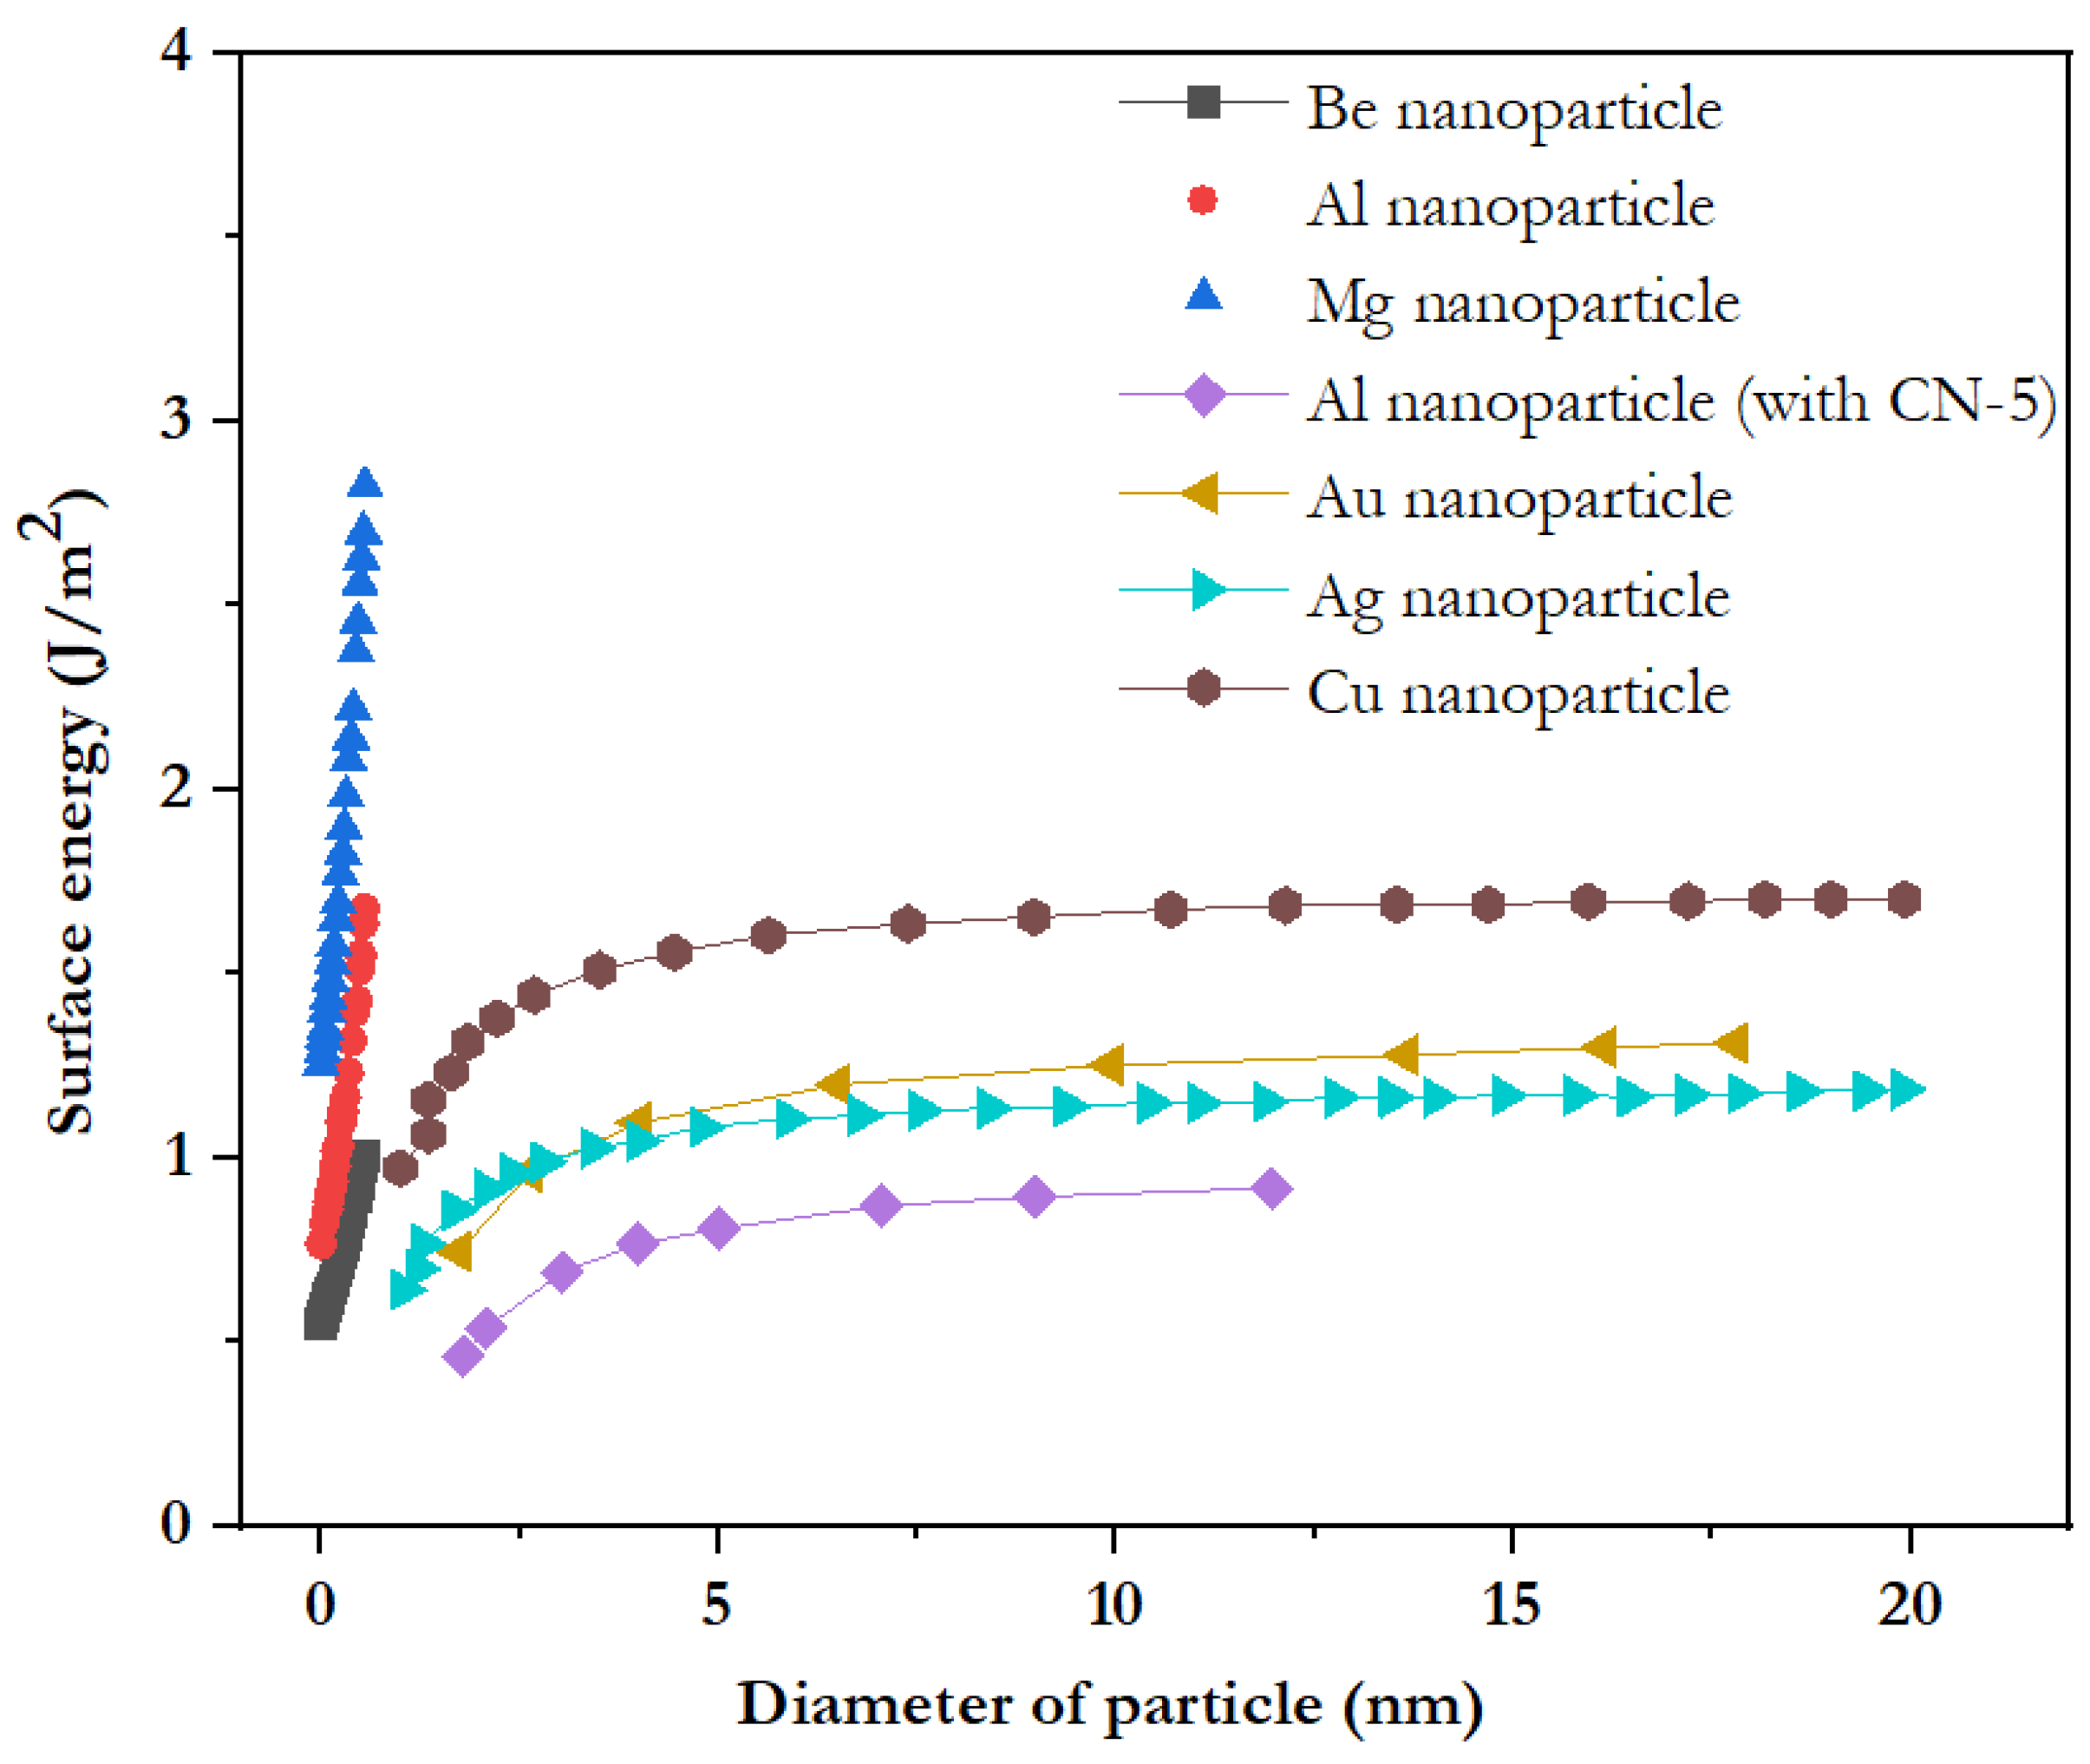
So, it can be concluded that surface energy decreases with decrease in size, as illustrated in Figure 3. This behavior might be due to the long correlation distances is involved in the finite size distribution [27].
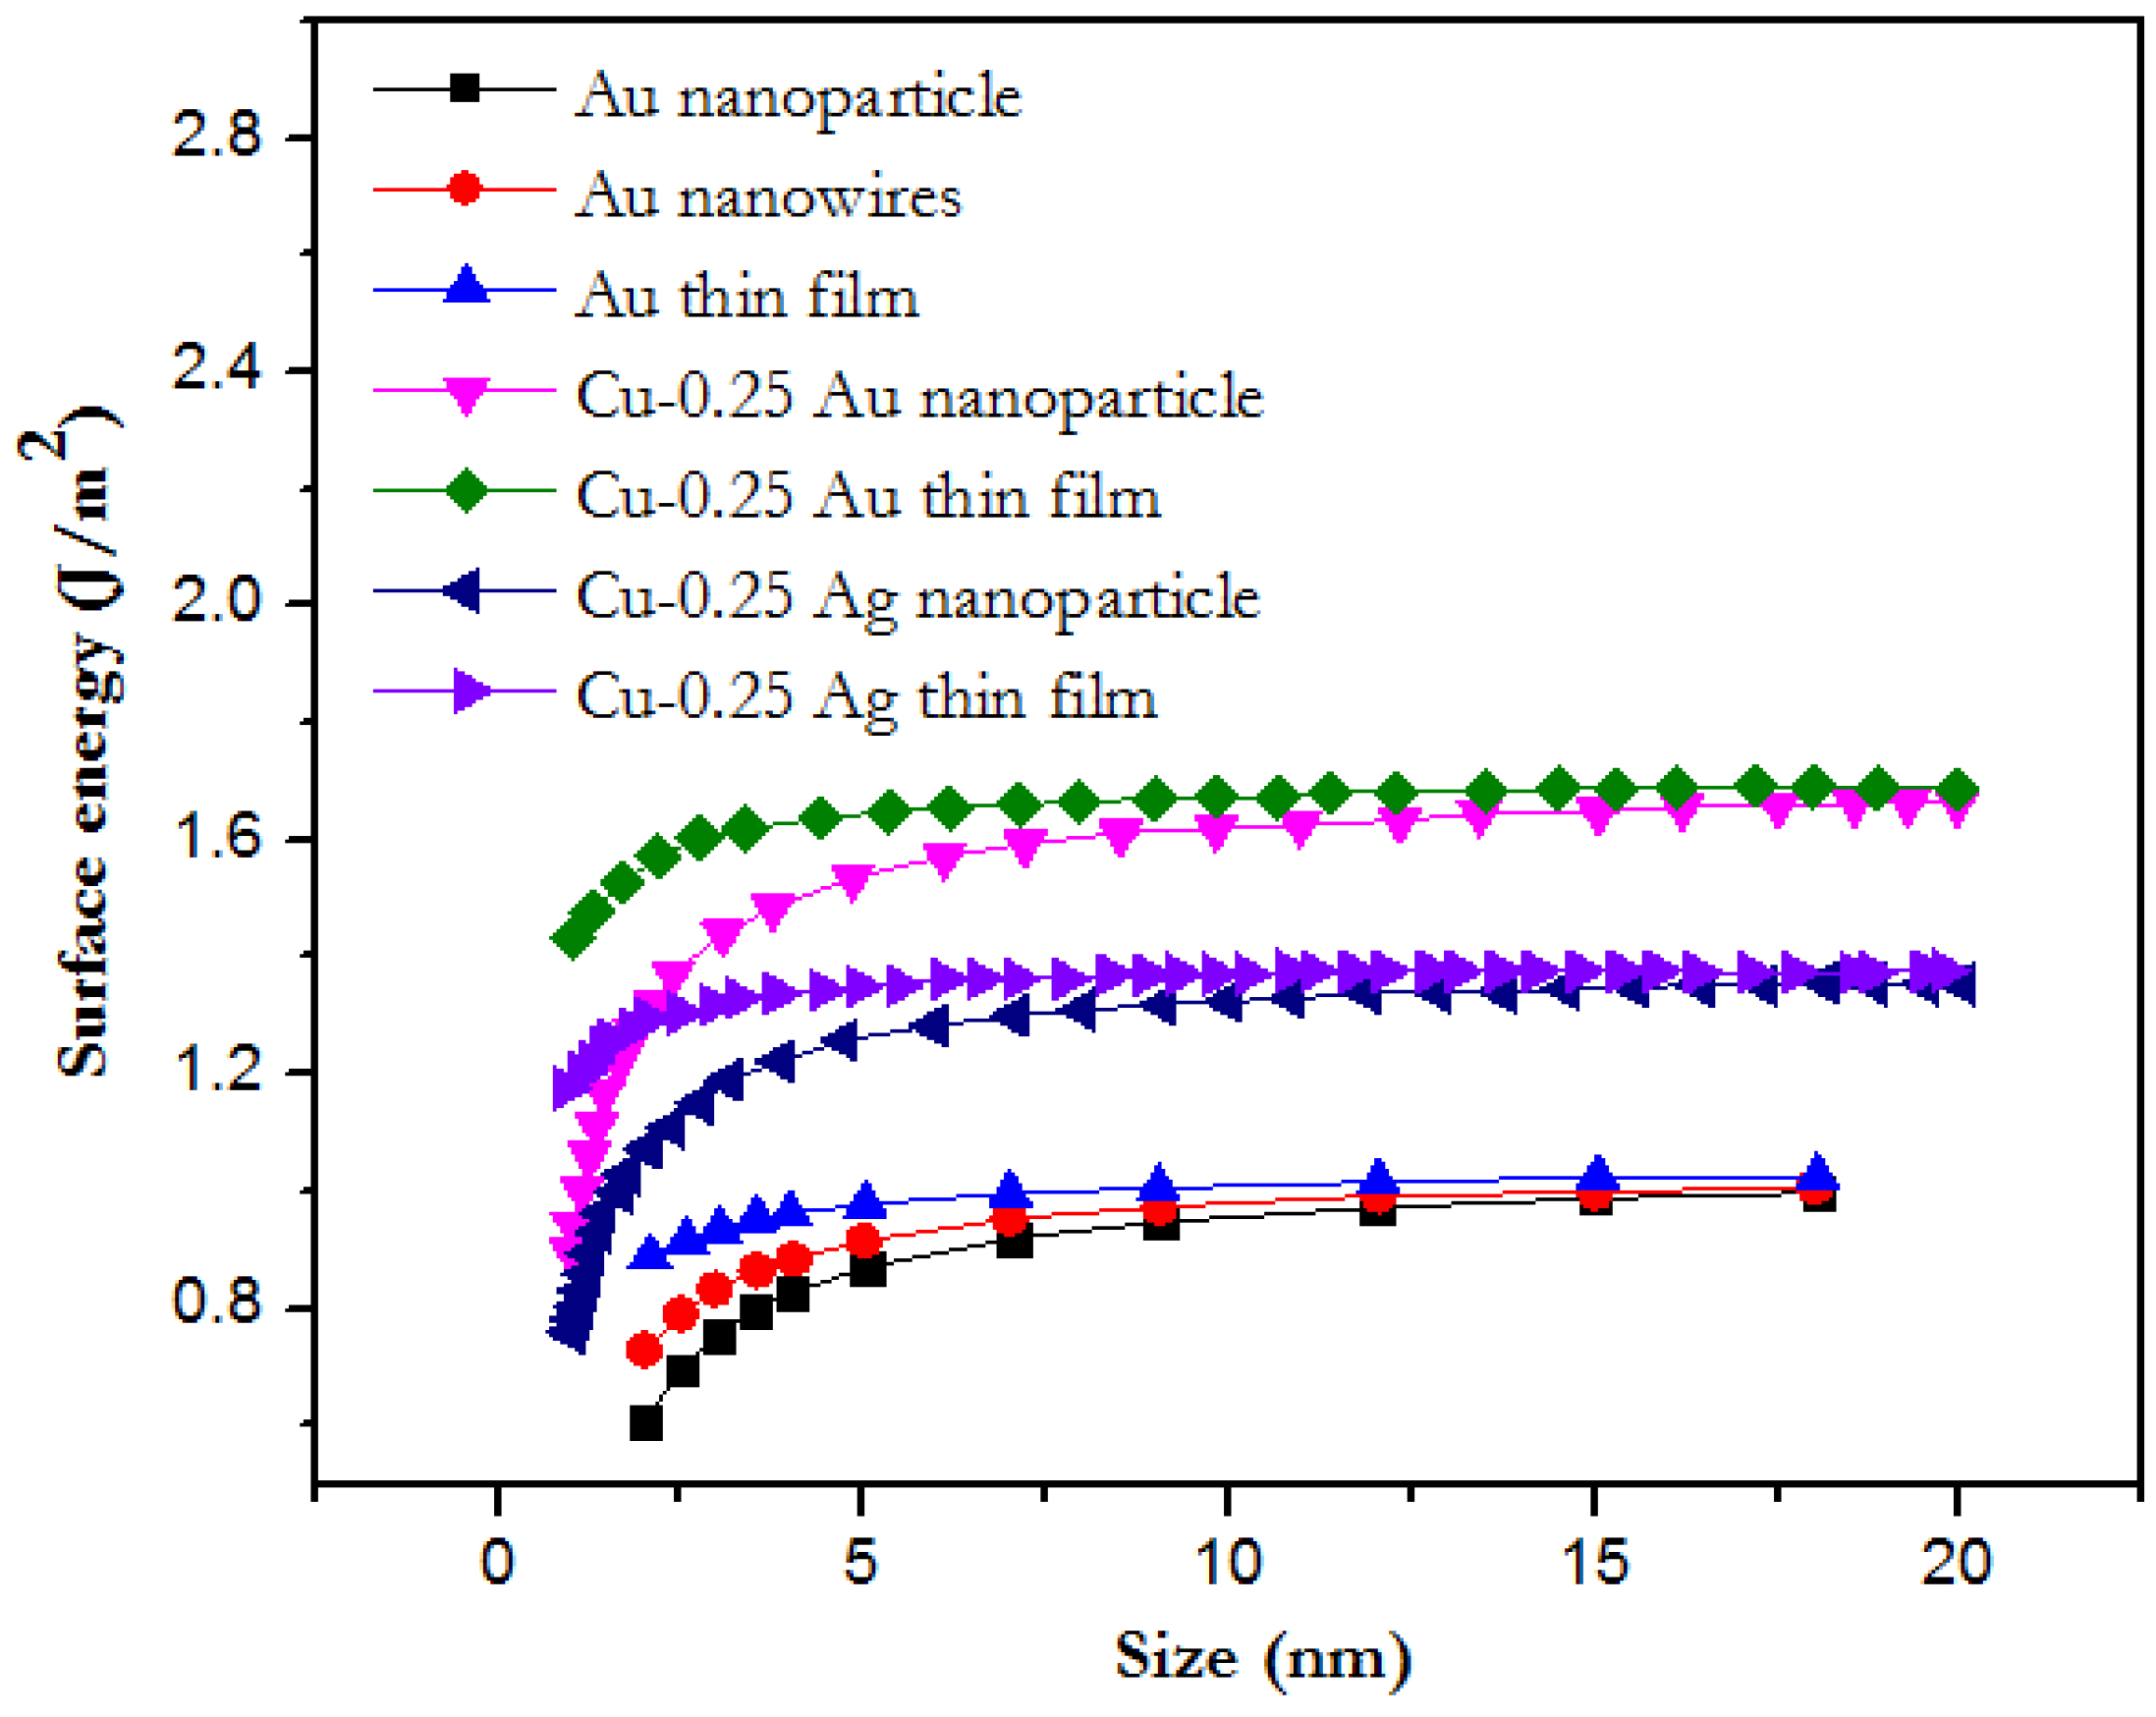
Figure 4 explains the effect of different shapes of the same materials on surface energy and varied by the following way: thin films < nanowires < nanoparticles. It means maximum surface energy can be observed on nanoparticles than thin film. This is due to the D0 (critical size) being shape dependent, which increases the ratio between surface atoms to the total atoms in nanoparticles compared to the nanowires and thin films [27]. Further, Zhang et al. [27] explained the shape dependency on the surface energy of nanoparticles, nanowires, and nanofilm of the FCC metal. They calculated the surface energy of nanoparticles, nanofilm, and nanowires by taking Z (co-ordination number) = 12, Zs = 6, and c = 0.94 into consideration for the surface energy model [27]:
2.3. Specific Heat Capacity
The specific heat capacity of the material (solid or liquid) is the heat which is required to increase by one degree the temperature of the per unit mass of that material. For bulk materials, the specific heat capacity depends only on the temperature, not on the size. On the other hand, in nanomaterials, the specific heat capacity is mainly affected by surface effects of the material which make it different from the bulk value [7]. Specific heat is the result of the atomic vibration in the lattice of the solid. In contrast to the Einstein theory of specific heat, where it is stated that each atom has the same vibrational frequency, Debye postulated that there is a continuous range of frequencies that cuts off at a maximum frequency (νD), which is the characteristic frequency of a particular solid. This theory leads to the conclusion that the specific heat capacity is dependent on the Debye temperature as follows [31,32]:
Here, Cpn is the specific heat capacity and θDn the Debye temperature for nano materials.
Further, Ansari [7] defined this equation at constant pressure as follows:
where VP is molar volume for phases. ∆mHm is molar standard enthalpy.
From the above-mentioned equation, it follows that the specific heat capacity for nano materials is inversely proportional to the size as well as dependent on the molar standard enthalpy and the surface tension of the material. Singh et al. [32] and Ansari [7] reported the specific heat capacity values in dependence on the particle diameter of different metals.
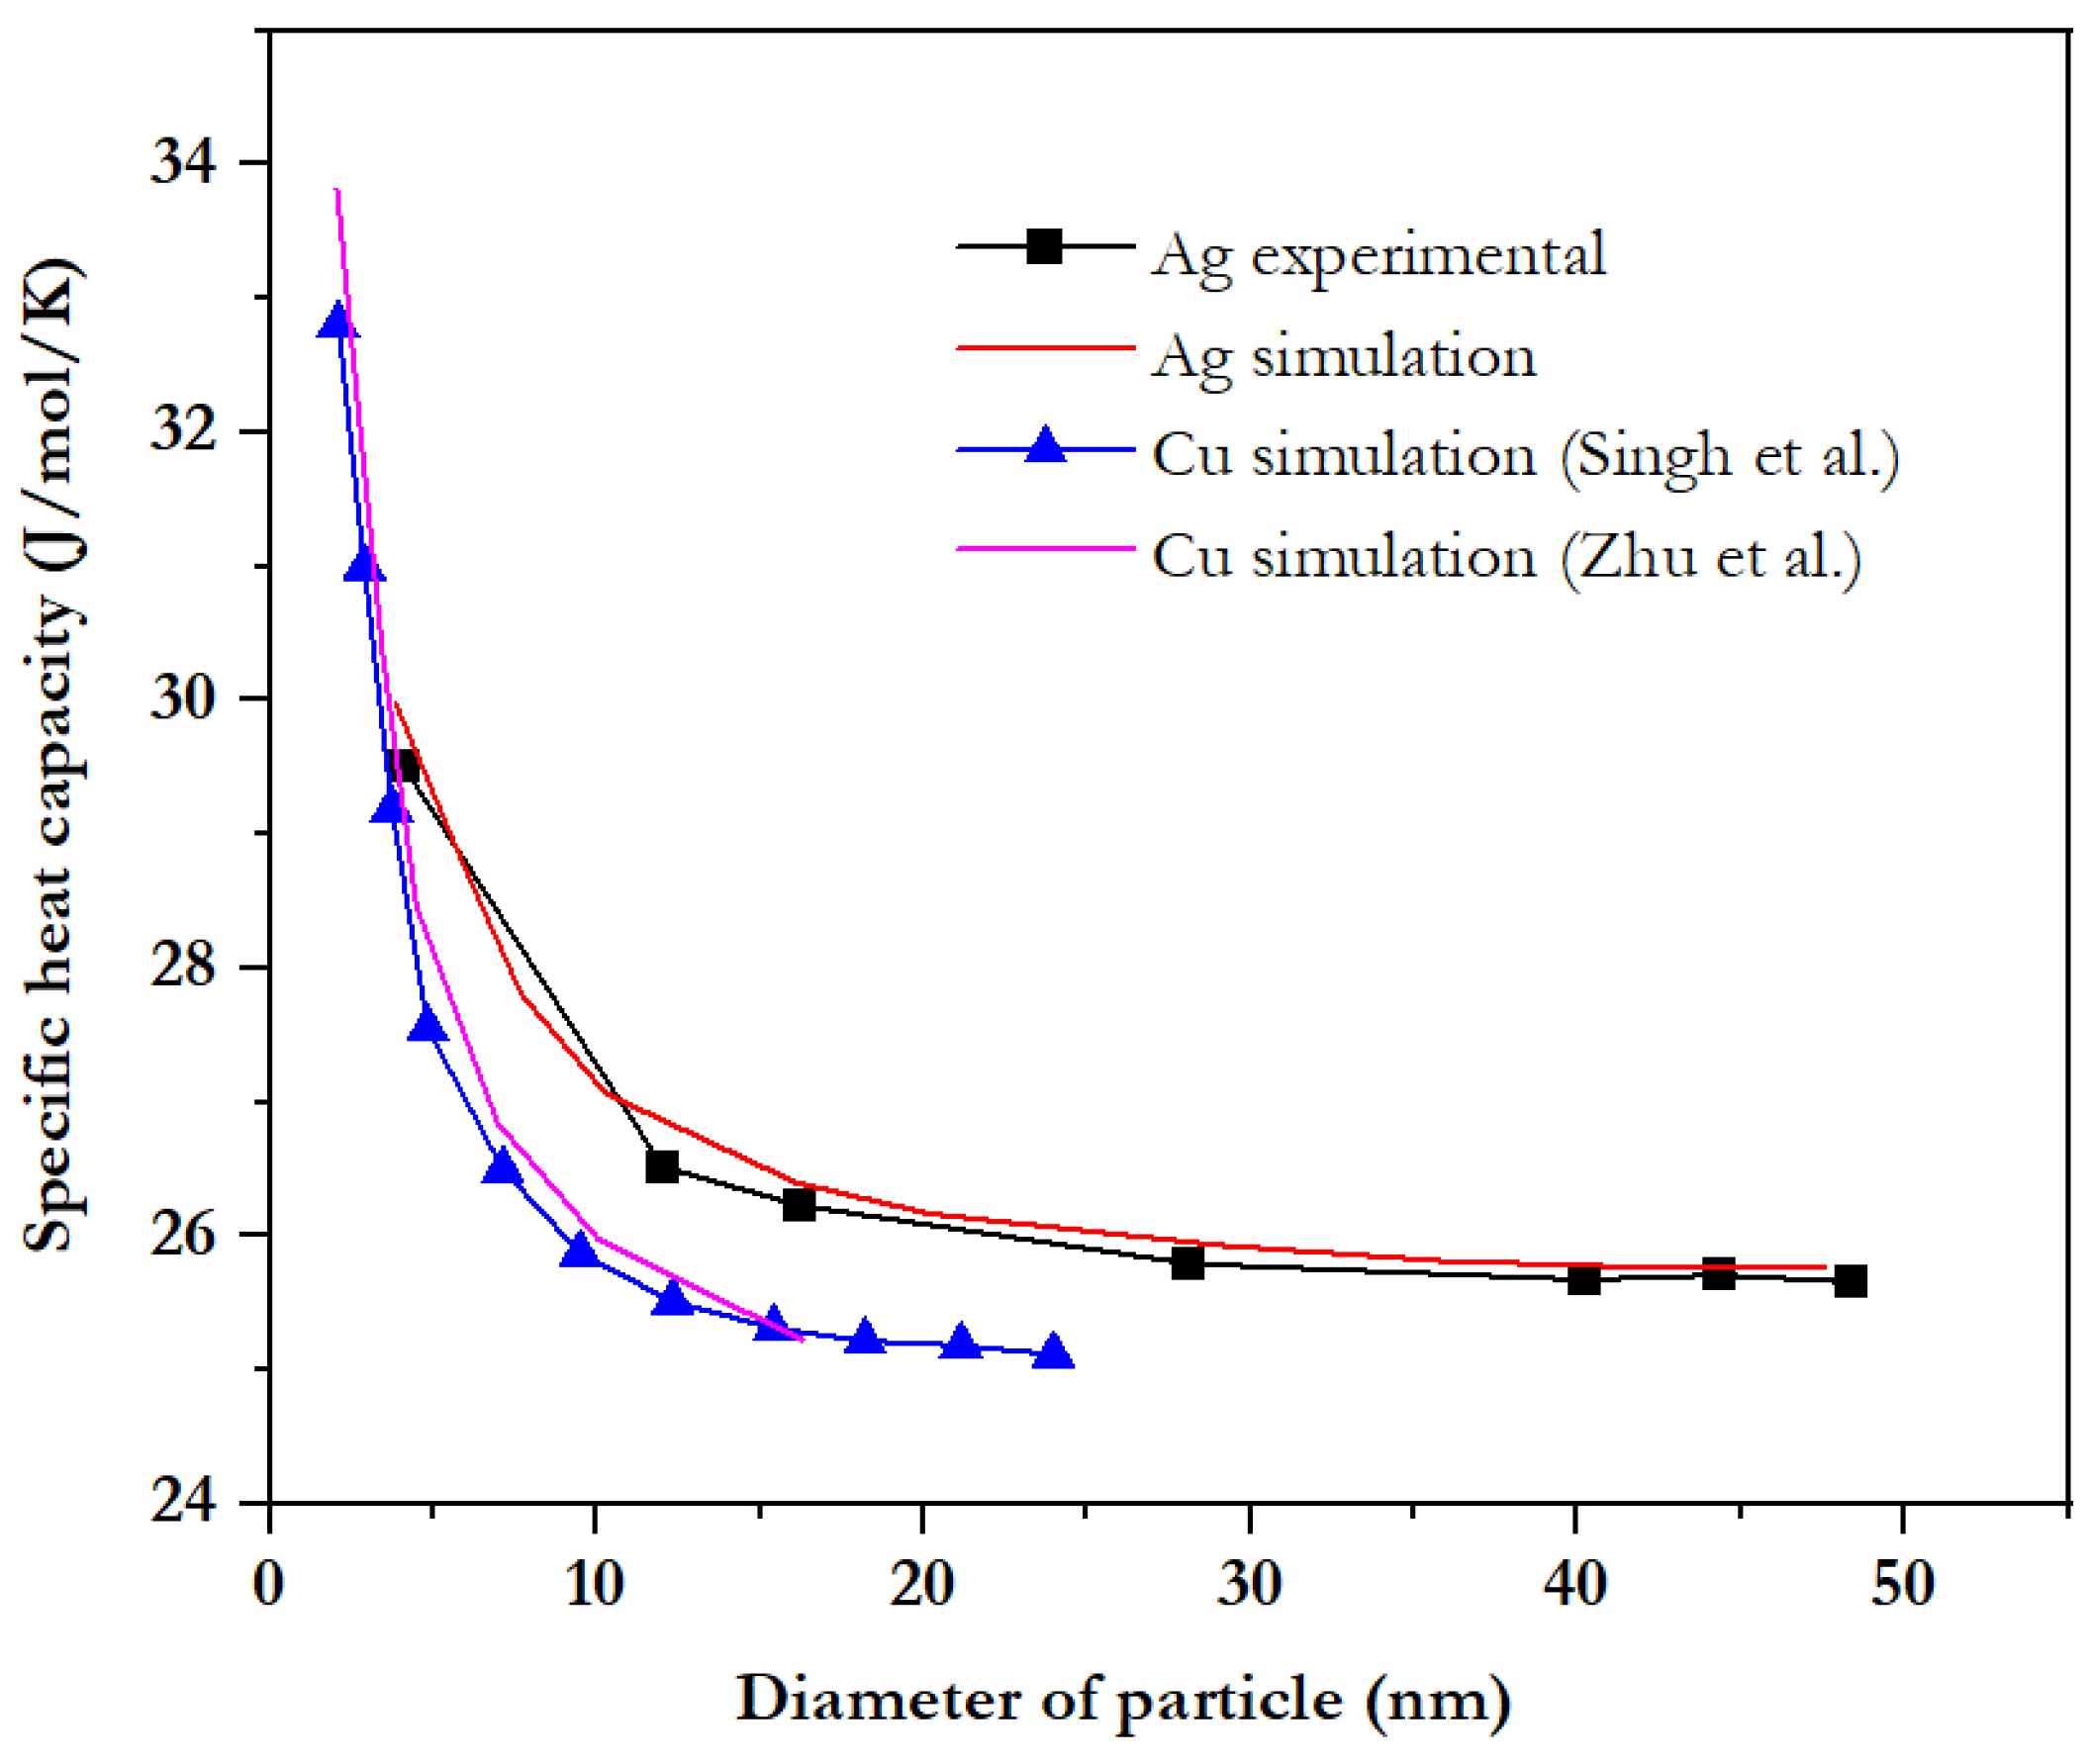
Figure 5 shows the variation of specific heat capacity with particle sizes of the Ag and Cu. Figure 5 is the combination of the model and the experimental data points and it is found that there is an increase in the specific heat with a decrease in the size of nanocrystal, indicating that the specific heat capacity varies inversely with the particle size. The cause of the increased specific heat at small sizes is the high atomic thermal vibration energies of the surface atoms [33]. Sun [34] also showed that the vibrational amplitude of the surface atoms is larger for nanosolids than that of bulk materials, resulting in the higher vibrational energy of the surface atoms. Figure 5 shows a good agreement with the experimental values.
Singh et al. [32] extended the study by including the shape effect from nanoparticles, nanowires, and thin film, on the surface energy. In Equation (19), ηs/2n is further defined by the 2da/D for spherical nano solids, where D is the diameter of spheric nanosolid and da is the atomic diameter. For nanofilm and nanowires, the values of ηs/2n are expressed as 2da/3d and 4da/3I respectively, where d is the width of nanofilm and I is nanowire diameter. They performed model prediction in In and Se, as shown in the Figure 6 [32], and compared the result with the experimentally observed heat capacity of Ag nanosolids [35]. One can conclude that heat capacity increases with a decrease in the size as well as shapes in the following way: nanoparticles > nanowires > thin film.
It can also be concluded that specific heat capacity is not only dependent on the size, but also on the temperature of nanoparticles. Further, Xiong et al. [8] expressed the numerical expression of specific heat capacity at constant volume with the size of the nanoparticle as follows [8]:
where R refers to the gas constant, while Cv and CP are the heat capacity at constant volume and pressure.
Due to the relation between Cp and Cv are Cp − Cv = 3RA0TCv/Tm [8], where A0 is 1.63 × 10⁻² a constant. The specific heat capacity of nanoparticles at constant pressure and constant volume Cnp and CnV. Figure 5 shows the experimental and simulated specific heat capacity values of Cu and Ag with the size of nanoparticle at constant volume. Consequently, specific heat capacity either at constant pressure or at constant volume (cnp/cnV) increases with a decrease in nano-particle size, due to a higher vibrational amplitude of surface atoms compared to the bulk atoms [34]. Therefore, more heat is required to increase the temperature of surface atoms by one degree. Though we cannot derive a linear relationship between specific heat capacity (cnp/cbp) and 1/D from Equation (20) [8].
2.4. Melting and Reaction Enthalpy
Self-sustained reactions occur in materials systems when enthalpy is transferred to the environment, i.e., the reaction is exothermic and not endothermic. The self-propagating reaction is supported if the reaction enthalpy of the exothermic reaction exceeds the melting enthalpy, if the reaction occurs under the condition that one of the reactants is in the liquid phase. For the determination of the enthalpy the entropy is required. The relationship between enthalpy and entropy for nanomaterials is as follows [32]:
where Hn is enthalpy for nanomaterials and Sn denotes the entropy for nanomaterials.
The size dependent melting entropy for nanomaterials can be measured with their size dependent melting points [32]. The melting entropy for metallic crystals is largely due to the vibration, instead of electronic in nature, as follows [8]:
where R belongs to the gas constant, while Smb and Smn are the melting entropy of bulk and nanomaterials, respectively.
With the help of the Equation (22), enthalpy behavior can be expressed as follows, dependent on the size and shape of the nanomaterials:
where Hmn and Hmb are the melting enthalpy of the nanoparticles and bulk materials as well. Tb denotes bulk melting temperature of the materials, whereas n and N are the total number of atoms present in the nanosolid and number of surface atoms, respectively.
The N/2n ratio expresses the shape and size of the nanomaterials. Qi et al. [13] stated that the direction dependent thermodynamic properties can be determined through the coherent interface whereas the quantity of variation depends upon the crystal size [32]. From Equation (23), the N/2n for spherical nanoparticles is 2da/D, where da signifies the atomic diameter and D the spherical diameter for nanomaterials, and N/2n for nanowires and nanofilm are expressed through 4da/3l and 2da/3h, respectively, where l displays the diameter for nanowires and h demonstrates the width of nanofilm.
As observed from Equation (22), the melting entropy of the metal is proportional to the particle size, i.e., it decreases with the size of the nanomaterials [8,36].
On the other hand, from Equation (23), melting enthalpy of nano particulates materials is observed to decrease with the decreasing particle size, as shown in Figure 7. It occurred due to the enthalpy reliant on the surface influence properties like high surface to volume ratio and breaking bond on the surface [32]. By way of the size reductions, the surface free energy rises because, in nano size, materials have excess energy to the surface atoms which sets the free surface energy [9,37]. From Equation (22), N/2n ratio is related to the shape factor as described earlier, the shape depending melting entropy of Au, Al, and Se nano size particles as shown in Equation (22), for different shapes, such as nanoparticle, nanofilm, and nanowires. The entropy is found to decrease with the decrease in size of particles. Furthermore, the amount of decrease in melting entropy are in the following order: nanofilm < nanowires < nanoparticles [37]. From Equation (22), it is reported that the melting entropy is reliant on N/2n ratio, where this ratio becomes 1:2:3 for the nanofilms, nanowires, and nanospheres respectively [38]. On the other hand, Equation (23) shows the shape dependent enthalpy, and it is demonstrated in Figure 7. It is observed that it increased from nanospheres to nanowires to nanofilms, because the surface-to-volume ratio increases. Therefore, the surface free energy increases for the nanomaterials. Hence, for the nano-size particles, the thermodynamic properties change [32].
Chung et al. [39] reported the effect of the oxidation on the enthalpy of Al particle size by model simulation. They included the cohesive energy from the reactant particles, product lattice energy, surface capping effects, and extent of product agglomeration with variation of particle size. The strongest effects can easily be noticed from below 10 nm Al particle size. They observed that more energy was released from agglomerated oxide product as compared to the energy release from the nanoscale oxide products. Huang et al. [40] investigated the effect of the morphology, nanostructure, and size on the kinetics and surface energy of nanomaterials with the help of Ag3PO4 micro and nanocrystals. From the conclusion, it came out that molar surface entropy, molar surface enthalpy, molar surface energy, and Gibbs free energy are larger for cubic Ag3PO4 micro and nanocrystals than rhombic dodecahedral Ag3PO4 micro-/nanocrystals, because cubic Ag3PO4 with high surface energy shows a higher reaction rate with lower activation energy, activation enthalpy, activation Gibbs free energy, and entropy. Resultant cubic Ag3PO4 micro-/nanocrystals require lower activation energy to overcome a small energy barrier than rhombic dodecahedral Ag3PO4 micro-/nanocrystals [40]. Similar conclusions have been reported by Tang et al. [41] concerning the Cu2O nanoparticle system.
3. Consequences for Self-Sustained Reactions in Reactive Materials
It is determined that the use of reactive materials in engineering and commercial applications is dependent on the induced propagation velocity, ignition temperature, and phases formed during the reaction that must be controlled for desired properties in reactive materials. Reactive materials are made from the intermetallic compounds from transition metals and C, B, or Si by highly exothermic reactions. Reactions are induced by the thermal diffusion between the different constituents due to solid state diffusive intermixing or by reacting through a liquid phase. The minute the reaction starts with electric pulses, heat, or energy source, a large amount of energy is released in the form of a sharp rise in temperature due to solid state or liquid phase intermixing. Thereafter, the reactions can turn out to be self-propagating. Generally, the form of constituents is either fully dense multilayer foils or compacted powders. So, in the following section, we describe the effect of thin film and nano powder reactive materials on the ignition temperature and self-propagation velocity.
3.1. Reaction Propagation Velocity
To optimize the performance of the reactive materials, it is necessary to have a clear understanding of the physical processes that dictate the velocity of the reactive material system. Several existing models have been explored so far to describe the propagation velocity of the exothermic reaction.
Figure 8 shows the example of a bilayer system consisting of two reactive layers x and y, where Δ is the bilayer thickness (the sum of x and y layers), while w is the average premixed thickness due to the fabrication process conditions. Atomic diffusion between x and y reactants is always in the perpendicular direction to the bilayers, whereas thermal diffusion happens along the bilayers, as shown in Figure 8. Mann et al. and Gavens et al. [42,43] reported that the reaction propagation velocity (Vx) of reactive materials is dependent on many factors, such as bilayer thickness (Δ), thickness of the premixed region (w), etc. Nevertheless, it has also been observed that, in some systems, reaction propagation velocity actually decreases dramatically at small lattice periods [42]. This drop in velocity has been revealed to be closely related to a decrease in the heat of the reaction [42,44]. This is believed to be due to the presence of a small premixing area between the layers during fabrication [43]. The heat of reaction is a significant parameter to predict how reaction velocity varies with Δ. Hence, first, we require to know the relationship between ∆Hrxn and Δ. Weihs et al. [44] defined the relationship between ΔHrxn and Δ, where a fixed volume of premixing was expected to be present at the interface between layers in every annealing condition [43]. The heat loss happened during the reaction due to premixing, which is proportional to 2w/Δ, as expressed by the following equation [43]:
As shown in Figure 9, the total heat of reaction is decreasing with the decrease in bilayer thickness. This behavior is due to the presence of small premixed region which forms between the layers during deposition [45]. This premixed region decreases the amount of energy obtainable from the reaction. As bilayer thickness decreases, the premixed region creates a larger volume fraction in the multilayers which lead to greater energy losses [45,46]. Further, Gavens et al. explained the premixed region in AlNi multilayers system where Al9Ni2 formed instead of the final phase Al3Ni2 [43]. Therefore, the relation between reaction propagation velocity and premixed thickness is expressed as follows:
where B is a constant that denotes the thermal conductivity, atomic diffusivity, heat capacity, and density of the final product [47]. B* is a constant like B, but belongs to the premixed phase [43].
From Figure 10, it is clearly visible that the reaction propagation velocity behavior can be separated into two different regimes. In the first regime for thicker bilayers, the average atomic diffusion distance is large. Therefore, the reaction temperature and reaction velocity decreased, and vice versa for thin bilayer system, where bilayer thickness decreased and reaction velocity is observed to increase due to decrease in diffusion distance between different metal layers, e.g., Al and Ni layers for intermixing completely. On the other hand, in the second regime for thinner bilayers, the reaction velocity is dominated by the decrease in available energy owing to intermixing. In this regime, less bilayer thickness decreases the reaction velocity [43,45].
Furthermore, Mossino [48] also explained the reaction propagation velocity expression as follows:
where a0 denotes a layer thickness of a reactant and is related to the thickness of the other reactant by the stoichiometric ratio w = 1 + b0/a0 of reaction, E is the activation energy of diffusion and D0 belongs to the pre-exponential factor of the diffusion coefficient.
Further, he also explained in terms of the temperature profile and bilayer thickness as follows:
where Deff belongs to the effective diffusion coefficient and Ta is the ambient temperature.
Equations (28) and (29) also show that the reaction propagation velocity is inversely proportional to the layer and bilayer thickness of the reactive multilayer system. Further, Mossino [48] pointed out the particle size distribution effect on the degree of conversion as follows:
where
which demonstrates the effective heterogeneity particle size with x(P), is the particle size distribution function; P1 is the smallest particle size and P2 is largest particle size. From Equation (30), velocity is inversely proportional to the P2.
This shows the particle size of the starting reactive system plays a major role in a self-propagating system. It can be stated that fine particles generally encourage the reaction, increasing the combustion velocity and reaction temperature due to a more dense structure enhancing the heat transfer [48]. The starting particle size of the system also impacts the grain size of the end products. Further, Matsuda et al. [46] compared the heat of reaction on multilayer AlNi flakes and AlNi multilayer foils which were deposited by DC magnetron sputtering.
They observed that thin bilayer flakes showed lower energy due to the thickness of premixed layer being larger in thin bilayer flakes than the thick bilayer flakes [46]. In the matter for the same volume, the whole surface area of the flakes was 1.13 times larger than the film [46]. Moreover, heat of energy for the flakes was 4% smaller than the same bilayer films [46]. The reason for the difference between the films and flakes is considered to be the side surfaces. This may be due to the oxidation on side surfaces of the Al/Ni multilayered flakes reduce the whole heat energy. Further, Mutsuda et al. [46] also showed the similar behavior that as less bilayer thickness decreases the velocity but they have included the other influencing factors as well. Like the influence of the density, some changes in the physical properties also present the effect of oxidation at the side surface of the AlNi flakes [46].
Denser flakes showed a lower propagation velocity than the AlNi films [46]. This slow velocity due to the heat transmission was taking a longer time between flakes than the continuous film. This means that, in the flakes, the heat was used to heat the next nearest flake., and this heat transmission between flakes takes a longer time than the sequenced AlNi films [46].
Gromov et al. have reported the effect of different parameters on self-propagation velocity of NiAl reactive nanoparticles [1]. The velocity of AlNi nanoparticles of 70–110 nm in size varied from 2.7 to 8 cm/s and then became saturated. This variation is observed due to the presence of porosity (η). The porosity varied from 0.91 to 0.34, which increased the velocity with decrease in η. Here, the author reported the presence of the porosity in the compactness of the powder will reduce the propagation velocity [1]. The obtained dependency of the velocity on the porosity is predictable. This happened because of the elimination of pores between the particles to provide the possibility for diffusion and heat transfer owing to the growth of the heat conductance, as it was described by Naiborodenko and Itin [49].
Naiborodenko and Itin [49] found an increase in the reaction front propagation velocity from 7 to 14 cm/s with a decrease in the size of aluminum particles from 60 to 5 µm. This might have happened due to the effect of the increment of the surface to volume ratio and the effect of the surface energy. Naiborodenko and Itin [49] observed a similar effect when the reaction front propagation velocity increased up to 10 cm/s with a decrease in porosity in the system [1].
3.2. Ignition Temperature
Ignition temperature is the temperature necessary for the initiation of the self-sustained reaction. Many simulation models have been proposed to understand the ignition temperature in reactive materials. For igniting the reactive materials, an intense energy source is needed. Rogachev et. al. [50] ignited the Ti/Al multilayers by using the tungsten filament to initiate the exothermic reaction [50]. The exothermic reaction can also be initiated by many methods, e.g., ignition by uniform heating, laser pulses, mechanical impact, electric ignition [3,45]. In the uniform heating method, reaction of reactive materials perform on hot plate where the reaction can be examined [50,51]. According to the work of Fritz et al. [51], reactions will not even start when they are heated to temperatures just 1 K below the threshold ignition temperature (Tig), as expressed in Equation (32):
The expression of ignition temperature considered the ignition volume, microstructure, and physical material properties of the film [51]. This equation includes the variables of the atomic fraction of a reactant (m), the fractional concentration over which the product phase exists (f), the gas constant (R), and a geometrical term (g), activation energy (EA), Arrhenius diffusion coefficient (D0), and reaction heat (Hrxn).
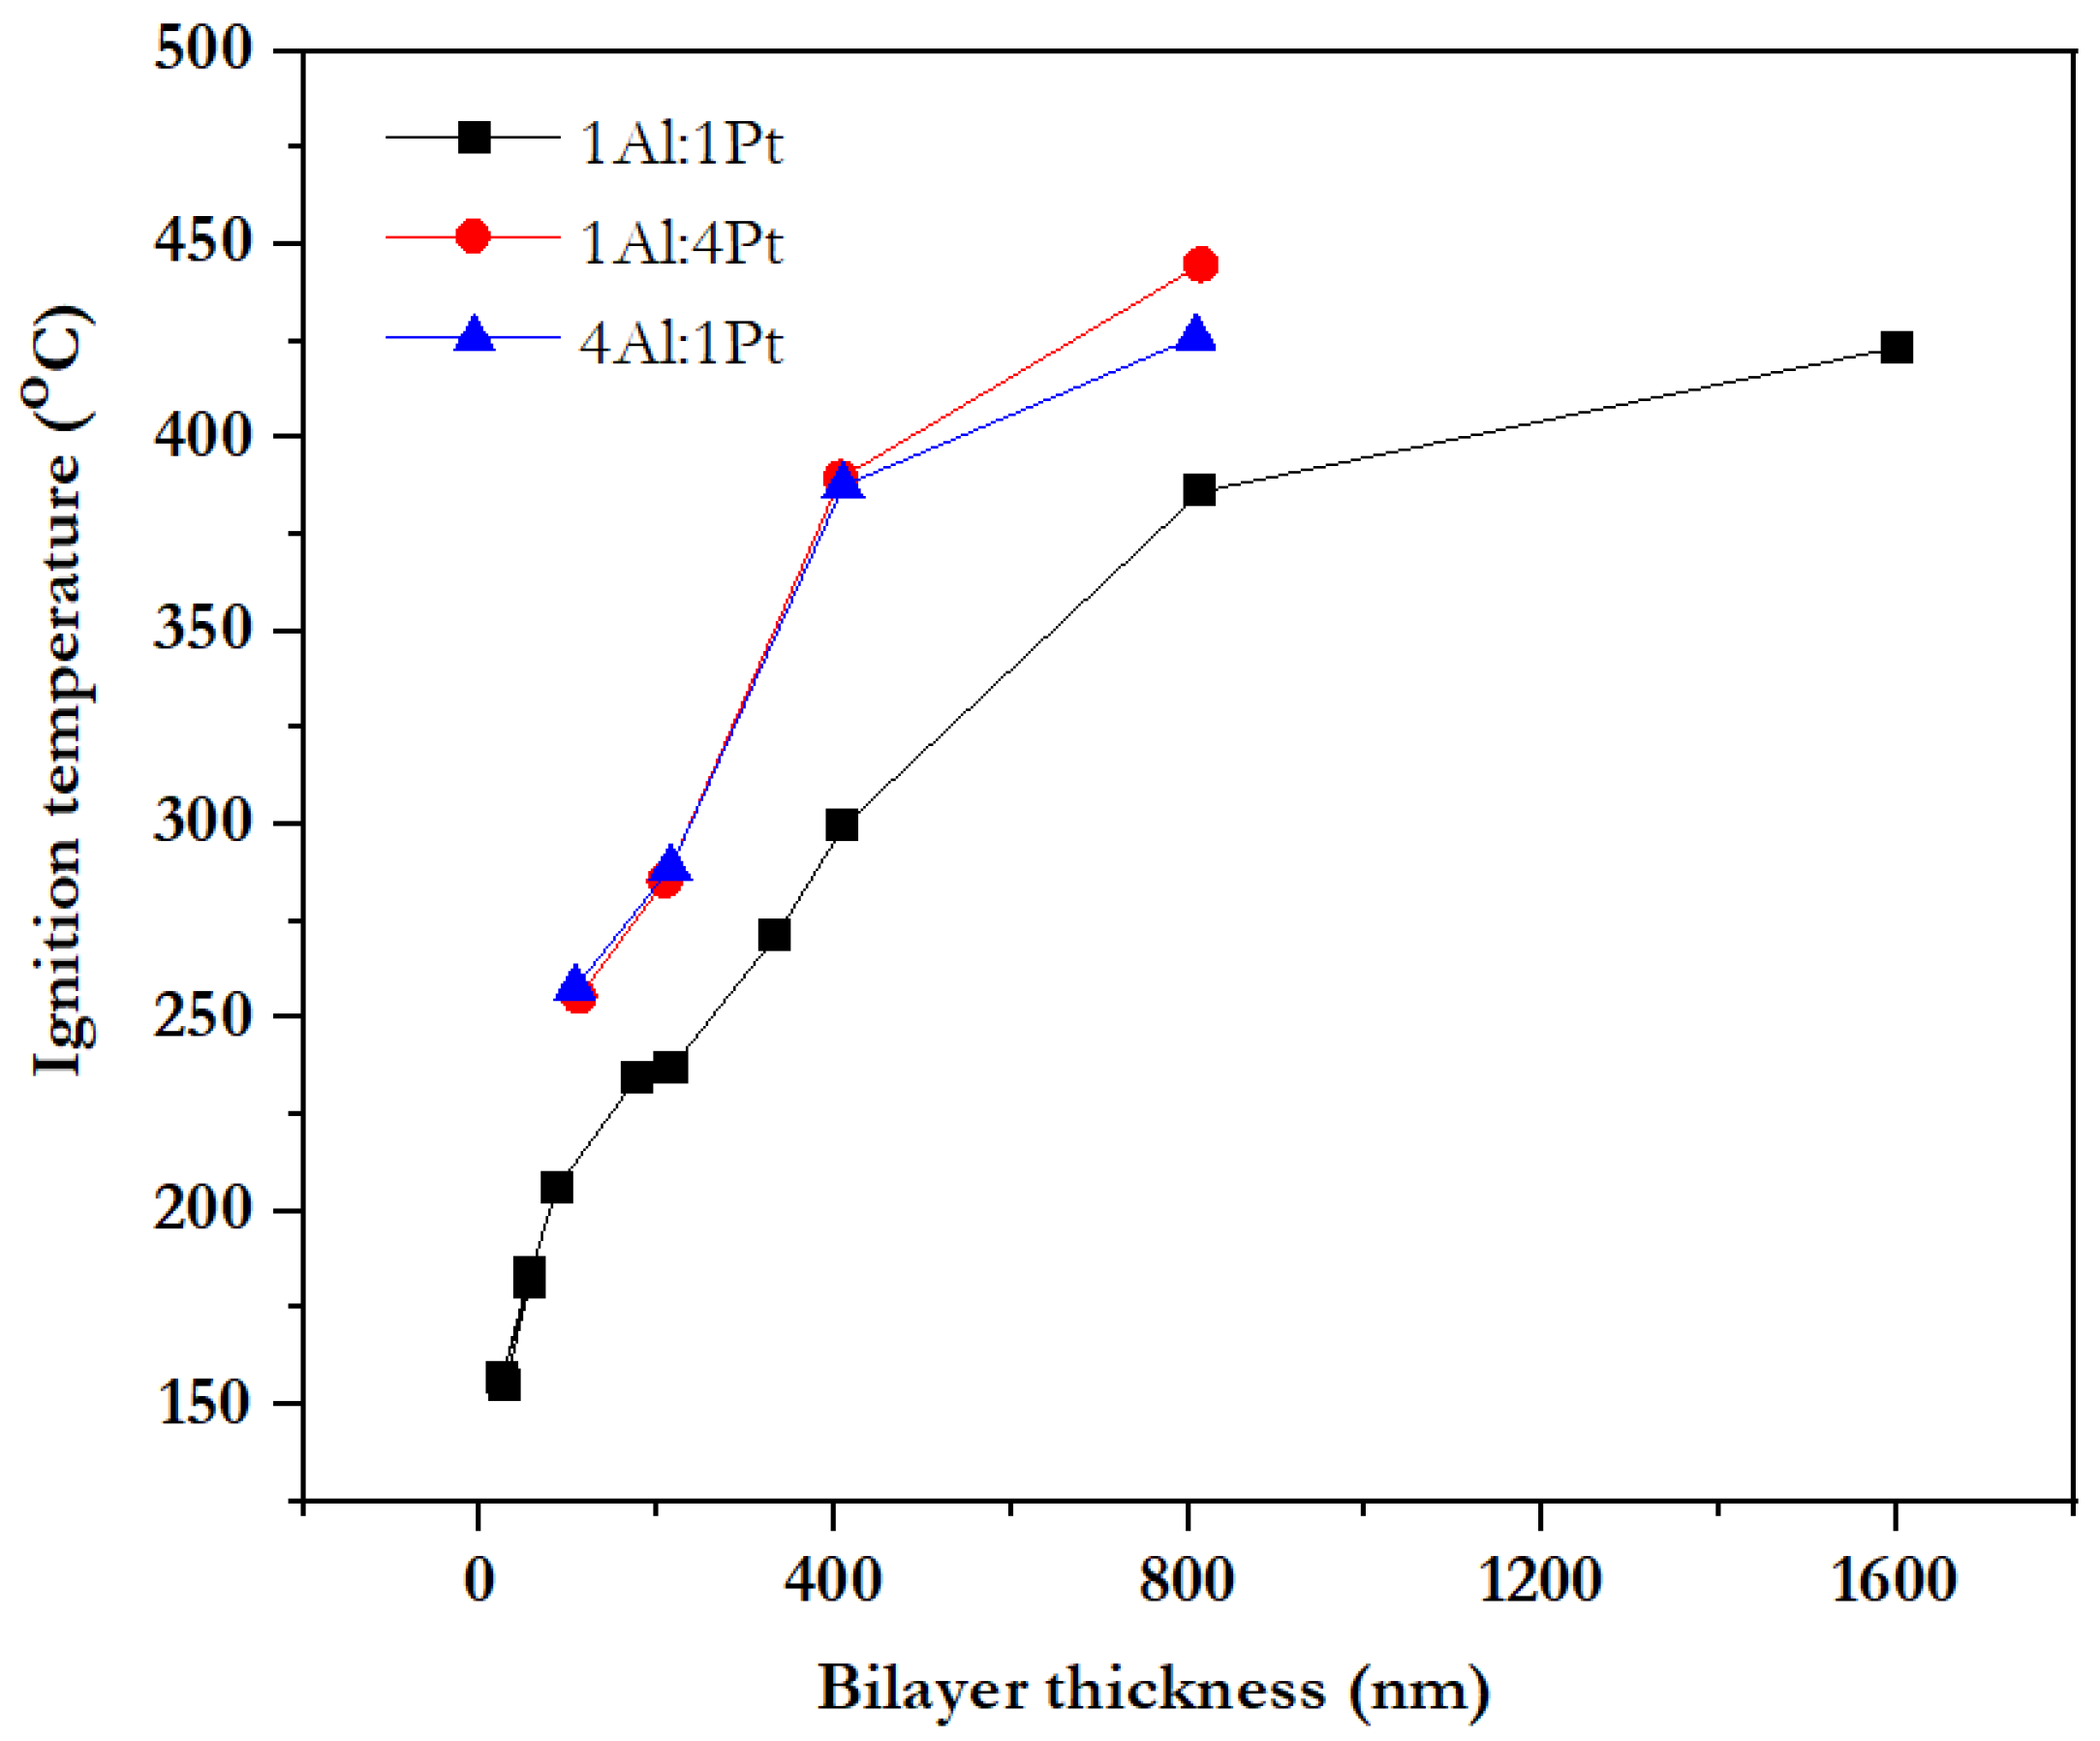
As shown in Figure 11, the absolute ignition temperature shows a logarithmic dependency on the bilayer thickness of each multilayer film. If the applied temperature is not high enough, even just 1 K below the ignition temperature Tig, the self-propagating reaction will not be initiated. Additionally, multilayer films will show only colour change because of the surface oxidation and transformation in phases [51]. Further, Pauli et al. [52] explored the addition of a third metal layer to the binary multilayer. The additional layers were nickel and platinum to the Ru/Al multilayer system. They observed that additional third layer can reduce the ignition temperature due to the introduction of an additional exothermic reaction at lower temperatures. Al-Ni and Al-Pt reactions in the Ru/Al ternary multilayers happen at considerably lower temperatures than the reaction in Ru/Al multilayers in the binary reference due to the formation of interphase. As in Pt added Ru/Al multilayers, two different exothermic reactions were observed. The first one is a solid state amorphous transformation at 200 °C. The second one is a crystalline transformation into Al3Pt2 from 200 to 300 °C [52]. Further, for Ni added Ru/Al multilayers, the first exothermic reaction formed Al9Ni2 metastable phase. It formed at 250 °C around Al/Ni interfaces and accumulated on the Al grain boundaries [52]. In contrast, hafnium added Ru/Al multilayers did not show any additional phase effect. Therefore, no lower ignition temperature was observed. Thus, the Tig is dependent on the interphase layer. It reduces the Tig even below the melting and eutectic temperature, signifying the ignition initiated through solid state mixing of reactants [52,53]. It is similar in the case of reactive nanoparticle, where Shuck et al. [54] reported the Tig behavior of AlNi nanocomposite materials. They reported that the Tig happened due to a solid state diffusion reaction, indicating that no melting process happens during the reaction [54]. Additionally, the stacking sequence of elements and choice of the elements play a significant role in affecting the Tig temperature [52,53]. It can be described by the effect reactive interface density per total thickness of the reactive multilayer stacks. The rises in the comparative number of interfaces tend to lower the Tig of exothermic reactions [52,53]. Further, Shuck et al. reported that reducing the diffusive layer thickness of reactant materials leads to the decrease of Tig [54]. It was previously demonstrated that the reaction in Al-Ni system happens first from Ni dissolving into the Al [54]. As the Al layers become thinner, two major effects should be considered. The first one is that, for thin Al layer, the shorter diffusive distance of Ni is required to reach a critical degree of transformation, which is enough for self-ignition in the investigated conditions. Furthermore, as the layers become thinner, the surface area contact between reactants increases. Resultantly, this effect leads to an increase of the influence of the interface diffusion to the global mass transport procedure. Since interface diffusion is much faster than the volume diffusion, the overall diffusion rate significantly increases [54].
In the above section, the effect of the surface energy increases in the nanoscale has also been described. Resultantly, it will also be a responsible factor to increase the surface diffusion contribution and decrease the activation energy of the system. Therefore, the lower Eeff (effective activation energy) is predictable for the total combustion reaction. Hence, the following equation demonstrates the relationship between Tig and Eeff as follows [54]:
where T0 belongs to the ambient temperature. The Ar (Arrhenius number) = RT0/Eeff is typically smaller for a thermal explosion. In our case, T0 is less than 800 K and Eeff ranges from 40−210 kJ/mol.
Therefore, with high accuracy, Tig can be estimated as:
Thus, on the one hand, the reduction of the effective kinetic activation energy, which is shown in the increase of surface diffusion, results in a decrease of Tig under the same heat loss conditions (T0). On the other hand, the Tig is observed to decrease with milling time, suggesting that Eeff should also gradually decrease. It is worth noticing that Tig for the Ni + Al conventional powder remains basically constant in the vicinity of the Al melting point [54]. However, particle size also plays a major role in the ignition temperature of reactive material system, as shown in Equation (34) [48]. They considered this behavior in TiC system, where maximum temperature decreases with increase in particle size of Ti [48]. As particle size increases, the temperature profile of the combustion front broadens and the maximum temperature decreases. Hence, there is an increase in the broadening of a reaction front due to a decrease in the degree of completeness of the reaction [48].
4. Conclusions
A theoretical study was conducted to investigate the effect of size on the properties of reactive materials. Different geometries, namely spherical and cubic particles, spherical shells, and planar thin films, were included. A number of thermodynamic melting models, including both homogeneous and heterogeneous melting models, were considered to understand the self-propagating reaction in reactive materials through theoretical study. At the nanoscale, the thermal, physical properties changed, affecting the properties of reactive materials significantly. It was shown that the total heat of reaction is needed for a self-propagation reaction in reactive materials. However, the heat of reaction decreases with bilayer spacing. As the layers become thinner, the surface area contact between reactants increases and interface energy is increased due to nanomaterials. Resultantly, this effect leads to an increase in the interface diffusion influence due to the global mass transport process. Since interface diffusion is much larger than the volume diffusion, the overall diffusion rate significantly increases, which supports the self-ignition in the investigated conditions. The analysis undertaken here demonstrates that in the current semiempirical and theoretical models, size effects of the material properties in the reactive materials constituents are not taken into account and have to be considered in the development of more general models describing the characteristic properties of them.
Author Contributions
Conceptualization, D.S. and J.P.; validation, D.S., M.V. and J.P.; formal analysis, D.S. and M.V.; data curation, D.S.; writing—original draft preparation, D.S. and M.V.; writing—review and editing, D.S. and J.P.; supervision, J.P.; project administration, D.S. and J.P.; funding acquisition, J.P. All authors have read and agreed to the published version of the manuscript.
Funding
This research was funded by the German Science Foundation under contracts PE 624/16-1.
Institutional Review Board Statement
Not applicable.
Informed Consent Statement
Not applicable.
Data Availability Statement
Data will be available on request.
Conflicts of Interest
The authors declare no conflict of interest.
References
- Gromov, D.; Sherchenkov, A.; Lebedev, E.; Babich, A.; Nemtseva, S.; Shaman, Y.; Maniecki, T.; Maniukiewicz, W.; Mierczynski, P.; Ciesielski, R. The influence of compression conditions on the peculiarities of self-propagating exothermal reaction in Al–Ni powder reactive materials. J. Therm. Anal. Calorim. 2018, 134, 35–44. [Google Scholar] [CrossRef]
- Barbee Jr, T.W.; Weihs, T. Ignitable Heterogeneous Stratified Structure for the Propagation of an Internal Exothermic Chemical Reaction along an Expanding Wavefront and Method of Making Same. U.S. Patent No. 5,538,795, 23 July 1996. [Google Scholar]
- Adams, D. Reactive multilayers fabricated by vapor deposition: A critical review. Thin Solid Films 2015, 576, 98–128. [Google Scholar] [CrossRef] [Green Version]
- Weihs, T. Fabrication and characterization of reactive multilayer films and foils. In Metallic Films for Electronic, Optical and Magnetic Applications; Elsevier: Amsterdam, The Netherlands, 2014; pp. 160–243. [Google Scholar]
- Kaptay, G. On the size and shape dependence of the solubility of nano-particles in solutions. Int. J. Pharm. 2012, 430, 253–257. [Google Scholar] [CrossRef] [PubMed]
- Kaptay, G. On the size dependence of molar and specific properties of independent nano-phases and those in contact with other phases. J. Mater. Eng. Perform. 2018, 27, 5023–5029. [Google Scholar] [CrossRef]
- Ansari, M.A. Modelling of size-dependent thermodynamic properties of metallic nanocrystals based on modified Gibbs–Thomson equation. Appl. Phys. A 2021, 127, 1–11. [Google Scholar] [CrossRef]
- Xiong, S.; Qi, W.; Cheng, Y.; Huang, B.; Wang, M.; Li, Y. Universal relation for size dependent thermodynamic properties of metallic nanoparticles. Phys. Chem. Chem. Phys. 2011, 13, 10652–10660. [Google Scholar] [CrossRef] [PubMed]
- Roduner, E. Size matters: Why nanomaterials are different. Chem. Soc. Rev. 2006, 35, 583–592. [Google Scholar] [CrossRef] [PubMed]
- Trenkle, J.; Koerner, L.; Tate, M.; Walker, N.; Gruner, S.; Weihs, T.; Hufnagel, T. Time-resolved x-ray microdiffraction studies of phase transformations during rapidly propagating reactions in Al/Ni and Zr/Ni multilayer foils. J. Appl. Phys. 2010, 107, 113511. [Google Scholar] [CrossRef] [Green Version]
- Qiu, X.; Wang, J. Experimental evidence of two-stage formation of Al3Ni in reactive Ni/Al multilayer foils. Scr. Mater. 2007, 56, 1055–1058. [Google Scholar] [CrossRef]
- Joshi, N.; Mathur, N.; Mane, T.; Sundaram, D. Size effect on melting temperatures of alumina nanocrystals: Molecular dynamics simulations and thermodynamic modeling. Comput. Mater. Sci. 2018, 145, 140–153. [Google Scholar] [CrossRef]
- Qi, W.; Wang, M.; Zhou, M.; Shen, X.; Zhang, X. Modeling cohesive energy and melting temperature of nanocrystals. J. Phys. Chem. Solids 2006, 67, 851–855. [Google Scholar] [CrossRef]
- Guisbiers, G.; Buchaillot, L. Modeling the melting enthalpy of nanomaterials. J. Phys. Chem. C 2009, 113, 3566–3568. [Google Scholar] [CrossRef]
- Kaptay, G. The Gibbs equation versus the Kelvin and the Gibbs-Thomson equations to describe nucleation and equilibrium of nano-materials. J. Nanosci. Nanotechnol. 2012, 12, 2625–2633. [Google Scholar] [CrossRef] [PubMed]
- Kaptay, G. The chemical (not mechanical) paradigm of thermodynamics of colloid and interface science. Adv. Colloid Interface Sci. 2018, 256, 163–192. [Google Scholar] [CrossRef]
- Dreizin, E.; Allen, D.; Glumac, N.G. Depression of melting point for protective aluminum oxide films. Chem. Phys. Lett. 2015, 618, 63–65. [Google Scholar] [CrossRef]
- Puri, P.; Yang, V. Thermo-mechanical behavior of nano aluminum particles with oxide layers during melting. J. Nanopart. Res. 2010, 12, 2989–3002. [Google Scholar] [CrossRef]
- Kitsyuk, E.; Gromov, D.; Redichev, E.; Sagunova, I. Specifics of low-temperature melting and disintegration into drops of silver thin films. Prot. Met. Phys. Chem. Surf. 2012, 48, 304–309. [Google Scholar] [CrossRef]
- Sun, J.; Simon, S. The melting behavior of aluminum nanoparticles. Thermochim. Acta 2007, 463, 32–40. [Google Scholar] [CrossRef]
- Smith, J.M. Introduction to chemical engineering thermodynamics. J. Chem. Educ. 1950, 27. [Google Scholar] [CrossRef] [Green Version]
- Roark, R.; Young, W. Formulas for Stress and Strain, 5th ed.; McGraw-Hill: New York, NY, USA, 1975; Volume 180, p. 140. [Google Scholar]
- Lai, S.; Carlsson, J.; Allen, L. Melting point depression of Al clusters generated during the early stages of film growth: Nanocalorimetry measurements. Appl. Phys. Lett. 1998, 72, 1098–1100. [Google Scholar] [CrossRef]
- Zhao, M.; Zheng, W.; Li, J.; Wen, Z.; Gu, M.; Sun, C.Q. Atomistic origin, temperature dependence, and responsibilities of surface energetics: An extended broken-bond rule. Phys. Rev. B 2007, 75, 085427. [Google Scholar] [CrossRef] [Green Version]
- Cheng, T.; Fang, D.; Yang, Y. A temperature-dependent surface free energy model for solid single crystals. Appl. Surf. Sci. 2017, 393, 364–368. [Google Scholar] [CrossRef]
- Fu, B.-Q.; Liu, W.; Li, Z.-L. Calculation of the surface energy of bcc-metals with the empirical electron theory. Appl. Surf. Sci. 2009, 255, 8511–8519. [Google Scholar] [CrossRef]
- Zhang, X.; Li, W.; Kou, H.; Shao, J.; Deng, Y.; Zhang, X.; Ma, J.; Li, Y.; Zhang, X. Temperature and size dependent surface energy of metallic nano-materials. J. Appl. Phys. 2019, 125, 185105. [Google Scholar] [CrossRef]
- Jiang, Q.; Shi, H.; Zhao, M. Melting thermodynamics of organic nanocrystals. J. Chem. Phys. 1999, 111, 2176–2180. [Google Scholar] [CrossRef]
- Lu, H.; Jiang, Q. Size-dependent surface energies of nanocrystals. J. Phys. Chem. B 2004, 108, 5617–5619. [Google Scholar] [CrossRef]
- Jabbareh, M.A. Size, shape and temperature dependent surface energy of binary alloy nanoparticles. Appl. Surf. Sci. 2017, 426, 1094–1099. [Google Scholar] [CrossRef]
- Daintith, J. Debye Theory of Specific Heat; Oxford University Press: Oxford, UK, 2009. [Google Scholar] [CrossRef]
- Singh, M.; Lara, S.o.; Tlali, S. Effects of size and shape on the specific heat, melting entropy and enthalpy of nanomaterials. J. Taibah Univ. Sci. 2017, 11, 922–929. [Google Scholar] [CrossRef] [Green Version]
- Rupp, J.; Birringer, R. Enhanced specific-heat-capacity (c p) measurements (150–300 K) of nanometer-sized crystalline materials. Phys. Rev. B 1987, 36, 7888. [Google Scholar] [CrossRef]
- Sun, C.Q. Size dependence of nanostructures: Impact of bond order deficiency. Prog. Solid State Chem. 2007, 35, 1–159. [Google Scholar] [CrossRef]
- Lu, H.; Wen, Z.; Jiang, Q. Nucleus–liquid interfacial energy of elements. Colloids Surf. A Physicochem. Eng. Asp. 2006, 278, 160–165. [Google Scholar] [CrossRef]
- Eckert, J.; Holzer, J.; Ahn, C.; Fu, Z.; Johnson, W. Melting behavior of nanocrystalline aluminum powders. Nanostruct. Mater. 1993, 2, 407–413. [Google Scholar] [CrossRef]
- Fu, Q.; Zhu, J.; Xue, Y.; Cui, Z. Size-and shape-dependent melting enthalpy and entropy of nanoparticles. J. Mater. Sci. 2017, 52, 1911–1918. [Google Scholar] [CrossRef]
- Qi, W. Size effect on melting temperature of nanosolids. Phys. B Condens. Matter 2005, 368, 46–50. [Google Scholar] [CrossRef]
- Chung, S.W.; Guliants, E.A.; Bunker, C.E.; Jelliss, P.A.; Buckner, S.W. Size-dependent nanoparticle reaction enthalpy: Oxidation of aluminum nanoparticles. J. Phys. Chem. Solids 2011, 72, 719–724. [Google Scholar] [CrossRef]
- Huang, Z.-Y.; Li, X.-X.; Liu, Z.-J.; He, L.-M.; Tan, X.-C. Morphology effect on the kinetic parameters and surface thermodynamic properties of Ag3PO4 micro-/nanocrystals. J. Nanomater. 2015, 16, 388. [Google Scholar]
- Tang, H.; Huang, Z.; Xiao, M.; Liang, M.; Chen, L.; Tan, X. Theoretical and experimental study on the effects of particle size and temperature on the reaction kinetics of cubic nano-Cu2O. J. Nanopart. Res. 2017, 19, 1–13. [Google Scholar] [CrossRef]
- Mann, A.; Gavens, A.; Reiss, M.; Van Heerden, D.; Bao, G.; Weihs, T. Modeling and characterizing the propagation velocity of exothermic reactions in multilayer foils. J. Appl. Phys. 1997, 82, 1178–1188. [Google Scholar] [CrossRef]
- Gavens, A.; Van Heerden, D.; Mann, A.; Reiss, M.; Weihs, T. Effect of intermixing on self-propagating exothermic reactions in Al/Ni nanolaminate foils. J. Appl. Phys. 2000, 87, 1255–1263. [Google Scholar] [CrossRef]
- Weihs, T.; Barbee, T.; Wall, M. Measuring enthalpies of formation using thick multilayer foils and differential scanning calorimetry. MRS Online Proc. Libr. (OPL) 1995, 382. [Google Scholar] [CrossRef] [Green Version]
- Knepper, R.; Snyder, M.R.; Fritz, G.; Fisher, K.; Knio, O.M.; Weihs, T.P. Effect of varying bilayer spacing distribution on reaction heat and velocity in reactive Al/Ni multilayers. J. Appl. Phys. 2009, 105, 083504. [Google Scholar] [CrossRef]
- Matsuda, T.; Inoue, S.; Namazu, T. Self-propagating explosive Al/Ni flakes fabricated by dual-source sputtering to mesh substrate. Jpn. J. Appl. Phys. 2014, 53, 06JM01. [Google Scholar] [CrossRef]
- Weihs, T. Self-propagating exothermic reactions in nanoscale multilayer materials. Chem. Phys. Nanostruct. Relat. NonEquilibrium Mater. 1997. [Google Scholar]
- Mossino, P. Some aspects in self-propagating high-temperature synthesis. Ceram. Int. 2004, 30, 311–332. [Google Scholar] [CrossRef]
- Naiborodenko, Y.S.; Itin, V.I. Gasless combustion of metal powder mixtures. Combust. Explos. Shock Waves 1975, 11, 293–300. [Google Scholar] [CrossRef]
- Rogachev, A.; Grigoryan, A.; Illarionova, E.; Kanel, I.; Merzhanov, A.; Nosyrev, A.; Sachkova, N.; Khvesyuk, V.; Tsygankov, P. Gasless combustion of Ti–Al bimetallic multilayer nanofoils. Combust. Explos. Shock Waves 2004, 40, 166–171. [Google Scholar] [CrossRef]
- Fritz, G.M.; Spey, S.J., Jr.; Grapes, M.D.; Weihs, T.P. Thresholds for igniting exothermic reactions in Al/Ni multilayers using pulses of electrical, mechanical, and thermal energy. J. Appl. Phys. 2013, 113, 014901. [Google Scholar] [CrossRef]
- Pauly, C.; Woll, K.; Gallino, I.; Stüber, M.; Leiste, H.; Busch, R.; Mücklich, F. Ignition in ternary Ru/Al-based reactive multilayers—Effects of chemistry and stacking sequence. J. Appl. Phys. 2018, 124, 195301. [Google Scholar] [CrossRef]
- Adams, D.P.; Reeves, R.V.; Abere, M.; Sobczak, C.; Yarrington, C.D.; Rodriguez, M.A.; Kotula, P.G. Ignition and self-propagating reactions in Al/Pt multilayers of varied design. J. Appl. Phys. 2018, 124, 095105. [Google Scholar] [CrossRef]
- Shuck, C.E.; Pauls, J.M.; Mukasyan, A.S. Ni/Al energetic nanocomposites and the solid flame phenomenon. J. Phys. Chem. C 2016, 120, 27066–27078. [Google Scholar] [CrossRef]
Figure 1.
Variation of melting temperature with particle diameter for spheres and a length cubes, for Gibbs-Thomsan model for spheres and cubes [12], for red spheres [12], for blue cubes [12], for Al, Pb, Ag and Sn [7].

Figure 2.
Variation of melting temperature with thin film of semi infinite Alumina film [12], core shell Al [17,18], Cu film [14], Ag film [19].

Figure 3.
Variation of surface energy with particle diameter of Be, Al, Mg [29], Al (CN-5), Au [27], Ag and Cu [30].

Figure 4.
The variation of surface energy with particle size of different shapes [27].
Figure 4.
The variation of surface energy with particle size of different shapes [27].


Figure 6.
Shape dependent specific heat capacity for In and Se [32].
Figure 6.
Shape dependent specific heat capacity for In and Se [32].

Figure 7.
Shape and size dependent melting enthalpy of Ag, In, Cu and Se [32].
Figure 7.
Shape and size dependent melting enthalpy of Ag, In, Cu and Se [32].

Figure 8.
Schematic of the reactive multilayers of x and y metals.

Figure 9.
Measured heat of reaction as a function of bilayer thickness at different annealing time [45].
Figure 9.
Measured heat of reaction as a function of bilayer thickness at different annealing time [45].

Figure 10.
Variation of velocity with function of bilayer thickness of thin film, predicted and measured values [43].
Figure 10.
Variation of velocity with function of bilayer thickness of thin film, predicted and measured values [43].

Figure 11.
Variation of ignition temperature with function of bilayers with variation of composition [53].
Figure 11.
Variation of ignition temperature with function of bilayers with variation of composition [53].

Publisher’s Note: MDPI stays neutral with regard to jurisdictional claims in published maps and institutional affiliations. |
© 2022 by the authors. Licensee MDPI, Basel, Switzerland. This article is an open access article distributed under the terms and conditions of the Creative Commons Attribution (CC BY) license (https://creativecommons.org/licenses/by/4.0/).
Share and Cite
MDPI and ACS Style
Shekhawat, D.; Vauth, M.; Pezoldt, J. Size Dependent Properties of Reactive Materials. Inorganics 2022, 10, 56. https://0-doi-org.brum.beds.ac.uk/10.3390/inorganics10040056
AMA Style
Shekhawat D, Vauth M, Pezoldt J. Size Dependent Properties of Reactive Materials. Inorganics. 2022; 10(4):56. https://0-doi-org.brum.beds.ac.uk/10.3390/inorganics10040056
Chicago/Turabian StyleShekhawat, Deepshikha, Maximilian Vauth, and Jörg Pezoldt. 2022. "Size Dependent Properties of Reactive Materials" Inorganics 10, no. 4: 56. https://0-doi-org.brum.beds.ac.uk/10.3390/inorganics10040056
Note that from the first issue of 2016, this journal uses article numbers instead of page numbers. See further details here.