Article

Investigation into the Incorporation of Phosphate into BaCe1−yAyO3−y/2 (A = Y, Yb, In)

School of Chemistry, University of Birmingham, Birmingham B15 2TT, UK
*
Author to whom correspondence should be addressed.
Submission received: 26 November 2013 / Revised: 23 January 2014 / Accepted: 24 January 2014 / Published: 29 January 2014
(This article belongs to the Special Issue Energy Storage and Conversion)

Abstract

:
In this paper we examine the effect of doping phosphate into BaCe1−yAyO3−y/2 (A = Y, Yb, In). The samples were analysed through a combination of X-ray diffraction, TGA, Raman spectroscopy and conductivity measurements. The results showed that phosphate could be incorporated into this system up to the 10% doping level, although this required an increased Y/Yb/In content, e.g., BaCe0.6(Y/In/Yb)0.3P0.1O2.9. The phosphate doping was, however, shown to lead to a decrease in conductivity; although at low phosphate levels high conductivities were still observed, e.g., for BaCe0.65Y0.3P0.05O2.875, σ = 4.3 × 10⁻³ S cm−1 at 600 °C in wet N2. In terms of the effect of phosphate incorporation on the CO2 stability, it was shown to lead to a small improvement for the In containing samples, whereas the yttrium doped compositions showed no change in CO2 stability.

1. Introduction

There has been considerable research carried out into perovskite-related materials for use as electrode and electrolyte materials in solid oxide fuel cells. Traditional doping strategies to optimize electrolyte materials have involved doping a cation with a similar sized aliovalent cation e.g., LaGaO3, doped with Sr on the La site and Mg on the Ga site [1,2,3]. This doping strategy introduces oxide ion vacancies into the lattice, which allows the conduction of oxide ions or the incorporation of water to facilitate proton conduction [1,3,4]. Ba(Ce/Zr)O3 doped with Y on the Ce/Zr site has attracted considerable interest as a high temperature proton conductor in wet atmospheres, due to water incorporation into the oxide ion vacancies according to Equation 1 [5,6,7].
vO●● + OO + H2O ↔ 2 OHO
While Y doped BaCeO3 shows very high proton conductivity a major drawback with this system is its instability towards CO2, forming BaCO3 at the operating temperatures of solid oxide fuel cells (500–800 °C) [8]. Y doped BaZrO3 can be used as an alternative electrolyte, as it displays improved CO2 stability, however this system typically exhibits a high grain boundary resistivity [9,10]. Recently there has been considerable interest in strategies to increase the grain size in Y doped BaZrO3, through the use of sintering aids, or in the preparation of mixed Zr/Ce systems to try and resolve these issues [11,12]. Another system that has attracted a significant attention is the brownmillerite structured Ba2In2O5 [13,14,15,16]. This system has a high level of oxygen vacancies and this leads to oxygen vacancy ordering such that there are alternating layers of octahedrally and tetrahedrally coordinated In, leading to a comparatively low ionic conductivity. Doping this system with higher charge aliovalent cations of similar size (e.g., Zr4+ and Ti4+ for In3+) has been shown to introduce disorder onto the oxide lattice, and hence improve the conductivity. An alternative strategy developed in our group to optimize the conductivity of Ba2In2O5 has been to introduce oxyanions (MO4n; M = Si, P, S), where the central cation of the oxyanion is located onto the perovskite cation B site, and the oxide ions of this group fill four of the available six oxide ion sites surrounding it (albeit displaced so as to achieve the tetrahedral coordination of the oxyanion group). This strategy was found to enhance oxide ion conduction by creating disorder on the oxide ion sublattice. Further enhancements in the conductivity were observed in wet atmospheres leading to water incorporation and a protonic contribution to the conductivity. Oxyanion doping was also shown to improve the stability of the system to CO2 atmospheres attributed to a reduction of the basicity of the system with these acidic dopants [17,18,19,20]. This strategy was then extended to Ba2Sc2O5 and Ba2Sc2−yGayO5, with phosphate and sulfate doping showing improved stability to CO2 [21,22]. In this paper, we extend this oxyanion doping strategy to In, Y, Yb doped BaCeO3 with the hope of improving the CO2 stability and analyzing the effect on the conductivity. As noted previously by Soares et al., the effect of P additions in BaCeO3 is also of relevance, since phosphate esters have been used as dispersants to prevent nanoparticle agglomeration in the preparation of related perovskite materials [23]. In this previous work, Soares et al. examined (1 − x)BaY0.15Zr0.85O2.925:xP2O5 mixtures, and observed the presence of Ba3(PO4)2 impurities, and had a negative effect on the conductivity. The addition of P2O5 to an as-prepared single phase BaY0.15Zr0.85O2.925 perovskite, however meant that the examined compositions were effectively A site deficient, if one assume P as a B site dopant (as shown in our previous work on Ba2(In/Sc)2O
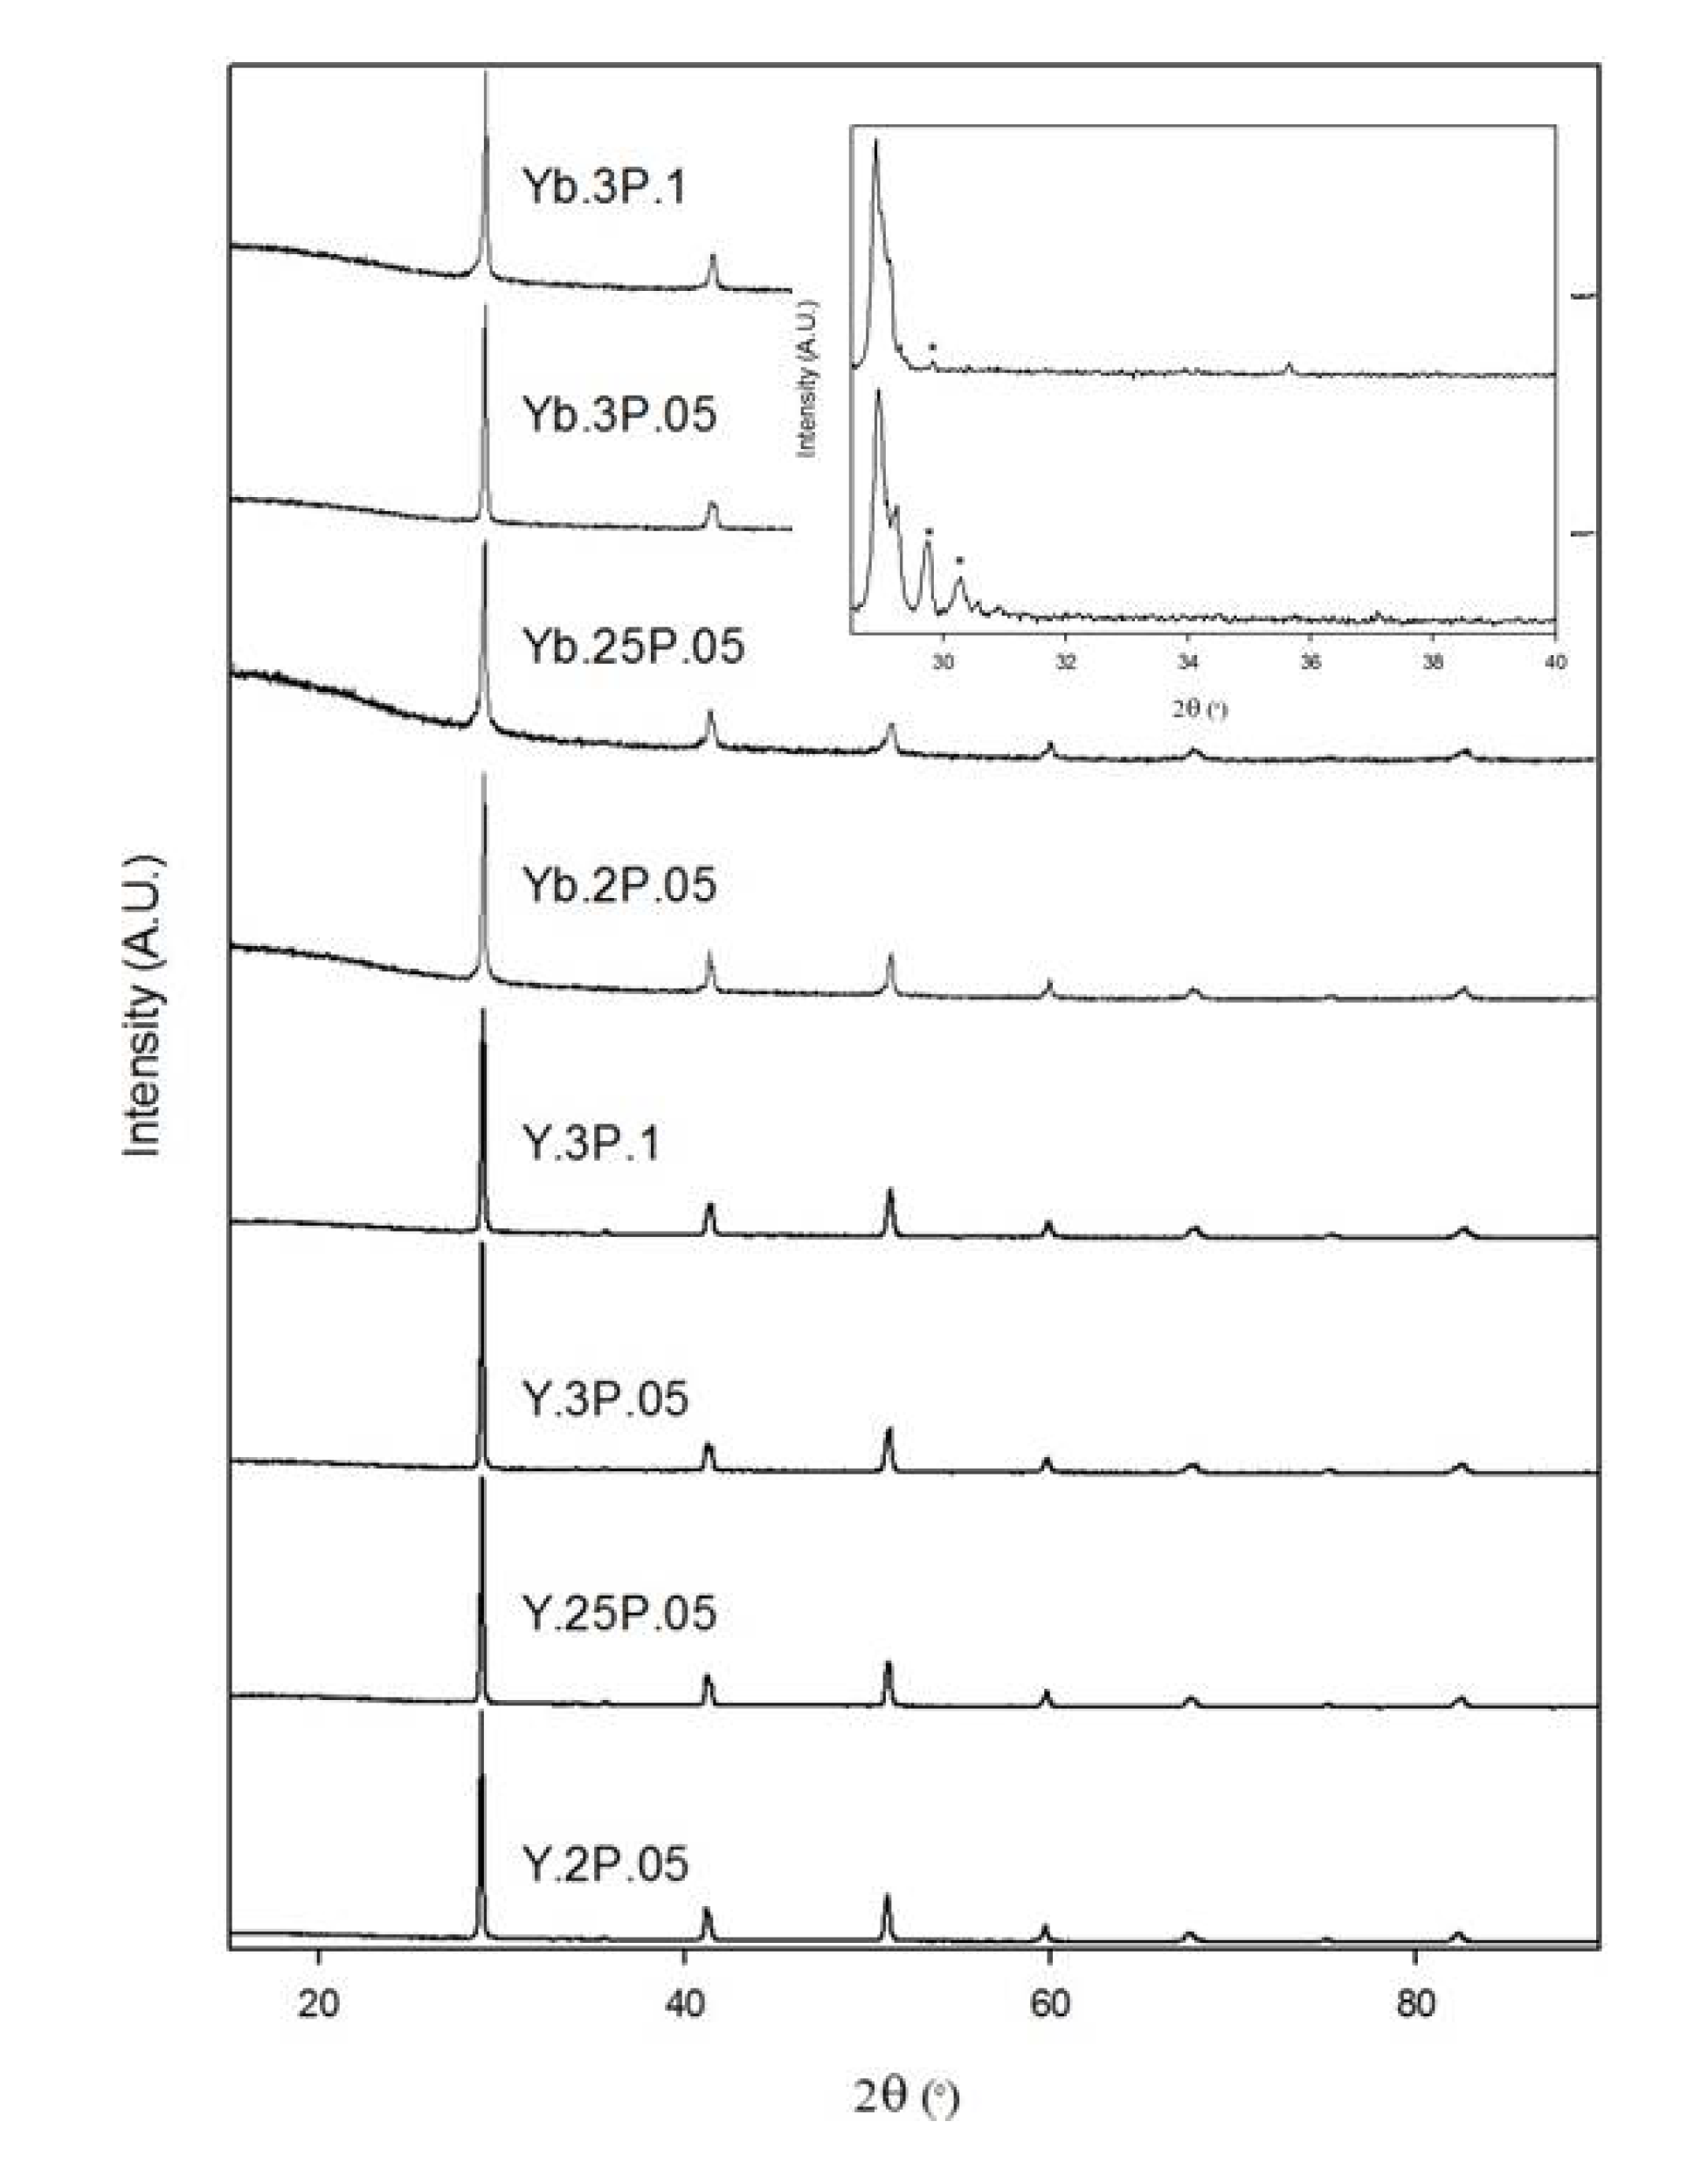
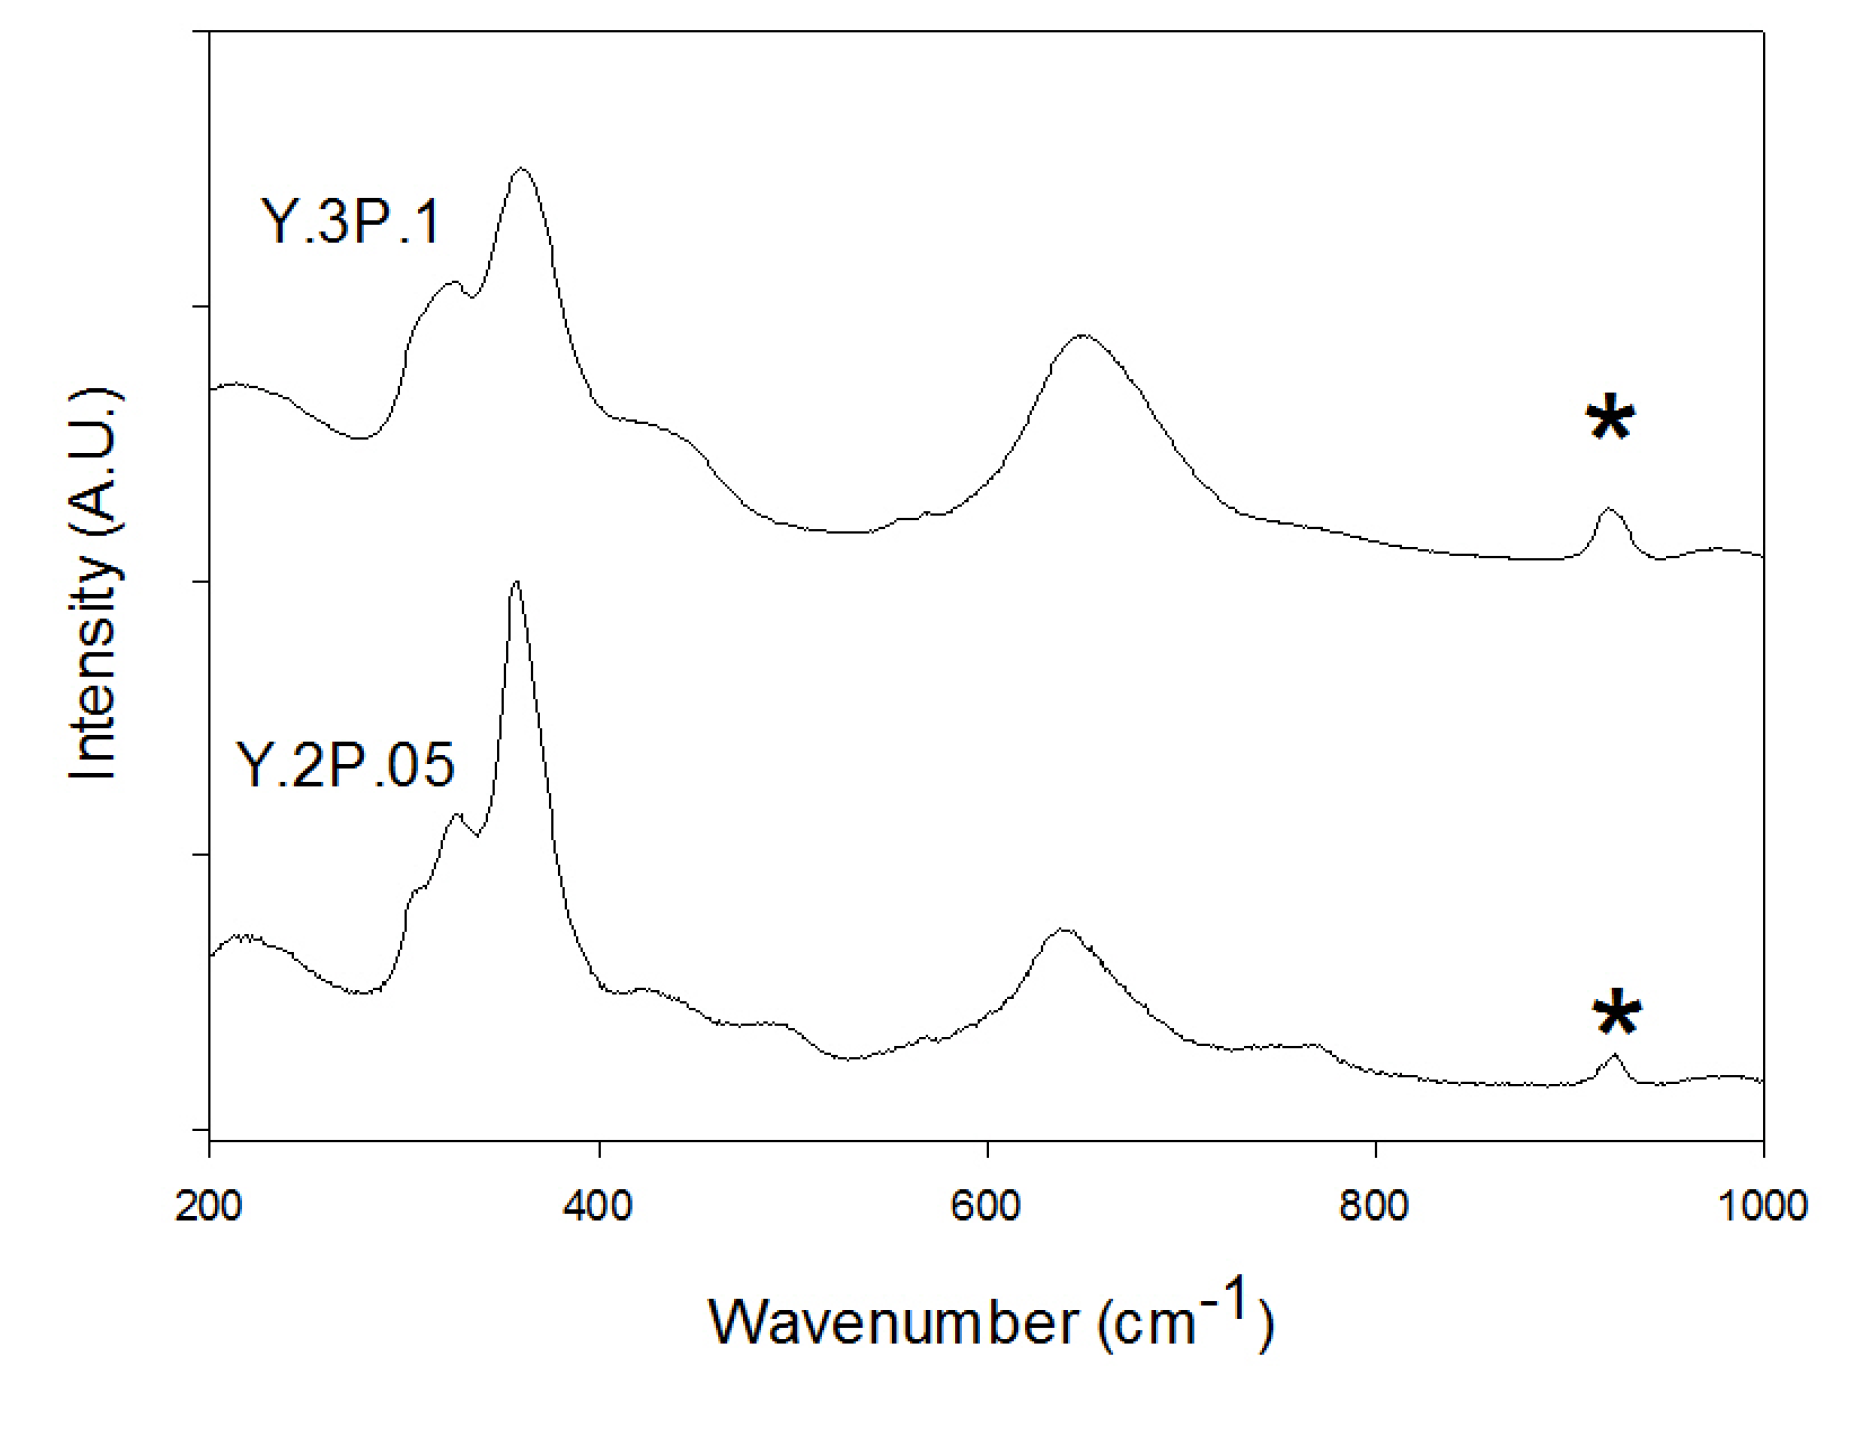
5), and this can explain the appearance of phosphate impurities. In this work, we have therefore examined cation stoichiometric compositions, assuming the incorporation of P on the B cation site, i.e., BaCe1−yx(Y/Yb/In)yPxO3−y/2+x/2, in order to determine whether some phosphate can be incorporated into the perovskite phase. We evaluate the effect of the trivalent cation dopant level on the incorporation of phosphate, and the resultant effect on conductivity and CO2 stability.

2. Results and Discussion

2.1. BaCe1−y−xYyPxO3−y/2+x/2 and BaCe1−y−xYbyPxO3−y/2+x/2

Similar to the results of Soares et al. on P2O5 additions to BaY0.15Zr0.85O2.925, we found that for low levels of Y/Yb (y < 0.2) it was not possible to introduce significant levels of phosphate [23]. Thus, for example, a composition BaY0.1Ce0.8P0.1O3 showed the presence of small Ba10(PO4)6(OH)2 impurities (Figure 1). The presence of such impurities can most probably be related to the need for significant oxide ion vacancies to allow the tetrahedral coordination of phosphate. In agreement with this conclusion, increasing the Y/Yb content to introduce further oxide ion vacancies led to the synthesis of single phase phosphate doped samples. Therefore the results indicate that provided the Y/Yb content is sufficiently high, phosphate can be accommodated into the structure. The powder X-ray diffraction patterns (Figure 2) thus indicated single phase compositions for a range of compounds (x = 0.05, y = 0.2, 0.25, 0.3; x = 0.1, y = 0.3) for both Y/Yb doped samples. At higher yttrium and ytterbium contents, Ba3Y4O9 and Ba3Yb4O9 impurities were formed. The lattice parameters, Table 1, were found to decrease on increased ytterbium content, in agreement with the smaller size of Yb3+ compared to Ce4+, and decrease on increased phosphate content in agreement with the smaller size of P5+ compared to Ce4+. In the case of Y doping, a similar decrease in cell volume on phosphate doping was observed, but the cell volume also somewhat unexpectedly decreased on increasing Y content, despite the larger size of Y3+ versus Ce4+. This was attributed to partial substitution of Y onto the Ba site, which was supported by preliminary structural refinements using the X-ray diffraction data. Similar effects have been observed in BaCe1−yYyO3−y/2 by Wu et al [24]. Such partial substitution of Y on the Ba site would lead to a reduction in the oxide ion vacancy concentration, and likely contribute to a negative effect on the conductivity. It is possible that similar partial substitution on Yb on the Ba site is also occurring for the Yb containing samples. Further structural characterisation using neutron diffraction data is required to get more detailed structural information, in particular regarding the oxide ion sites.
Raman data were collected on all the samples to confirm the presence of phosphate and these showed a band at ~940 cm−1, with selected compositions shown in Figure 3, consistent with the incorporation of phosphate groups into the sample as seen by Shin et al [21]. The other bands seen in the Raman spectrum are all indicative of bands associated with yttria doped barium cerates.
The conductivities of all the samples were initially collected in N2 atmospheres to eliminate any p-type contribution to the conductivity, as has been seen in oxyanion doped Ba2(Sc/In)2O5 and Ba2Sc2−yGayO5, and in dry and wet N2 atmospheres to observe any protonic contribution to the conductivity [21,22]. The data showed high conductivities with a significant enhancement in wet N2. This enhanced conductivity in the presence of water vapour is consistent with water incorporation leading to a protonic contribution to the conductivity, Table 2 and Figure 4. Similar conductivities were observed for all samples, with small variations with Y/Yb and phosphate content. The observed conductivities were, however, inferior to the conductivities reported in the literature for Y/Yb doped BaCeO3 without phosphate doping [1,3], suggesting that in this system, the phosphate doping is detrimental to the conductivity, which may be due to partial oxide ion vacancy defect trapping around the phosphate, so as to maintain its tetrahedral coordination. Measurements carried out in dry O2 showed a conductivity enhancement over the data in dry N2, which confirms the presence of a p-type contribution at elevated temperatures (>550 °C) to the conductivity, consistent with the results for Ba(Ce/Zr)O3 systems without phosphate doping (Figure 5). The Y doped samples were analysed further in order to determine the level of water uptake. To hydrate the samples, they were heated up to 800 °C and then slow cooled (0.4 °C/min) to room temperature under flowing wet N2. The water contents were then determined using TGA analysis, Table 3, showing water contents of up to 0.1 moles per formula unit.
A major concern with yttrium doped BaCeO3 is its instability towards CO2 atmospheres, as it has a tendency to form BaCO3 when heated in a CO2 atmosphere at typical fuel cell operating temperatures (500–800 °C) [8]. Phosphate doping had previously been shown to improve the CO2 stability of Ba2M2O5 (M = In, Sc) proton conductors, and therefore the stabilities of these samples were examined by TGA measurements under heating in 1:1 N2:CO2, and compared with BaCe0.9Y0.1O2.95 [19,21]. The collected data showed that for the Y containing systems there was no improvement in CO2 stability upon phosphate doping with all compositions showing a similar gain in mass at 450 °C. For the Yb doped samples, there was again little change in stability, although for the higher ytterbium content samples, a small improvement was seen, with the temperature at which the initial mass gain occurred increasing to 500 °C, Figure 6.

2.2. BaCe1−y−xInyPxO3−y/2+x/2

As for the Y/Yb doped samples, it was necessary to increase the In content to accommodate phosphate. The successfully prepared BaCe1−y−xInyPxO3−y/2+x/2 phases are listed in Table 4 with the XRDs shown in Figure 7. The cell parameters were obtained, Table 5, and the cell volumes show a general decrease upon increasing indium and phosphate content in agreement with In3+ and P5+ having a smaller ionic radius than Ce4+. Raman data confirmed the incorporation of phosphate, with all samples showing bands at ~940 cm−1, Figure 8.
The conductivities of these In doped samples were lower than those obtained for BaCe1−yxY/YbyPxO3−y/2+x/2, Table 5, and the conductivities were furthermore lowered on increasing phosphate content. As for the Y,Yb doped samples, these samples showed enhanced conductivities in wet N2 and dry O2 consistent with a protonic and p-type conductivity contribution respectively, Figure 9 and Figure 10.
The water contents of hydrated samples were determined by TGA measurements and these data (Table 6) showed that the levels of water incorporation were lower than seen for the yttrium analogues, which may explain the lower conductivities observed. In particular it would suggest that less oxide ion vacancies are available for water incorporation, and hence would imply a greater degree of oxide ion vacancy defect trapping.
The relative CO2 stabilities were also measured and in this case there appeared to be an improvement in the CO2 stability on phosphate doping, with the temperature at which the initial mass gain occurred increasing from 450 to 575 °C, Table 6. This indicated that while phosphate doping lowers the conductivity in BaCe1−yxInyPxO3−y/2+x/2 it does appear to improve the chemical stability towards CO2 as similarly seen for Ba2In2O5 and Ba2Sc2O5 [19,21]. At present, it is not clear why there is an improvement in the CO2 stability for the In containing samples, but not for the Y, Yb containing samples. Further work would be required to clarify this, but it could be affected by different degrees of local order between the trivalent dopants and the phosphate group, and in this respect computer modeling studies may provide some insight.
Table 1. Cell parameter data for orthorhombic BaCe1−yx(Y/Yb)yPxO3−y/2+x/2.
Sample (nominal composition)Unit cell parameters (Å)Unit cell volume (Å3)
abc
BaCe0.8Y0.2O2.9 8.9137(9)6.1815(6)6.1793(7)340.48(8)
BaCe.75Y0.2P0.05O2.9258.7431(3)6.1998(2)6.2186(2)337.09(2)
BaCe0.7Y0.25P0.05O2.98.7363(3)6.1978(2)6.2188(2)336.73(2)
BaCe0.65Y0.3P0.05O2.8758.7302(4)6.1969(3)6.2191(2)336.46(3)
BaCe0.6Y0.3P0.1O2.98.7240(5)6.1856(3)6.2061(3)334.90(3)
BaCe.75Yb0.2P0.05O2.9258.7267(6)6.1815(4)6.2113(4)335.06(5)
BaCe0.7Yb0.25P0.05O2.98.718(1)6.174(1)6.213(1)334.4(1)
BaCe0.65Yb0.3P0.05O2.8758.6973(5)6.1714(4)6.1964(3)332.59(4)
BaCe0.6Yb0.3P0.1O2.98.697(1)6.1578(6)6.1892(6)321.49(7)
Table 2. Conductivity data for BaCe1−yYyxPxO3−y/2+x/2.
Sample (nominal composition) Conductivity (S cm−1)
500 °C 800 °C
Dry N2Wet N2 Dry N2Wet N2
BaCe0.8Y0.2O2.9 3.7 × 10‑33.7 × 10‑3 2.4 × 10−21.9 × 10−2
BaCe.75Y0.2P0.05O2.925 1.4 × 10−31.7 × 10−3 4.9 × 10−35.9 × 10−3
BaCe0.7Y0.25P0.05O2.9 1.4 × 10−32.1 × 10−3 6.0 × 10−37.3 × 10−3
BaCe0.65Y0.3P0.05O2.875 2.0 × 10−32.5 × 10−3 6.8 × 10−38.2 × 10−3
BaCe0.6Y0.3P0.1O2.9 1.2 × 10−31.4 × 10−3 3.3 × 10−34.1 × 10−3
BaCe.75Yb0.2P0.05O2.925 8.6 × 10−42.0 × 10−3 6.4 × 10−37.2 × 10−3
BaCe0.7Yb0.25P0.05O2.9 1.7 × 10−32.5 × 10−3 1.2 × 10−21.2 × 10−2
BaCe0.65Yb0.3P0.05O2.875 8.5 × 10−41.6 × 10−3 4.3 × 10−34.6 × 10−3
BaCe0.6Yb0.3P0.1O2.9 4.4 × 10−46.3 × 10−4 2.6 × 10−32.8 × 10−3
Table 3. Water content for BaCe1yxYyPxO3−y/2+x/2.
Sample (nominal composition)Moles of water per formula unit
BaCe0.8Y0.2O2.9 0.10(1)
BaCe.75Y0.2P0.05O2.9250.03(1)
BaCe0.7Y0.25P0.05O2.90.11(1)
BaCe0.65Y0.3P0.05O2.8750.09(1)
BaCe0.6Y0.3P0.1O2.90.05(1)
Table 4. Cell parameter data for orthorhombic BaCe1−yxInyPxO3−y/2+x/2.
Sample (nominal composition)Unit cell parameters (Å)Unit cell volume (Å3)
abc
BaCe0.8In0.2O2.96.2094(2)6.1898(2)8.7204(3)335.17(2)
BaCe0.75In0.2P0.05O2.9256.1940(1)6.1700(1)8.7135(2)333.01(2)
BaCe0.7In0.25P0.05O2.96.1587(2)6.1796(1)8.6999(3)331.11(2)
BaCe0.65In0.3P0.05O2.8756.1445(2)6.1632(2)8.6892(3)329.06(1)
BaCe0.6In0.3P0.1O2.96.1285(4)6.1496(3)8.6692(5)326.73(2)
Table 5. Conductivity data for BaCe1−yxInyPxO3−y/2+x/2.
Sample (nominal composition) Conductivity (S cm−1)
500 °C 800 °C
Dry N2 Wet N2 Dry N2 Wet N2
BaCe0.8In0.2O2.9 7.4 × 10‑55.3 × 10‑4 1.6 × 10−32.4 × 10−3
BaCe0.75In0.2P0.05O2.925 1.8 × 10−52.5 × 10−4 2.8 × 10−48.7 × 10−4
BaCe0.7In0.25P0.05O2.9 1.4 × 10−42.4 × 10−4 1.3 × 10−31.3 × 10−3
BaCe0.65In0.3P0.05O2.875 2.1 × 10−52.4 × 10−4 6.2 × 10−41.2 × 10−3
BaCe0.6In0.3P0.1O2.9 8.5 × 10−61.1 × 10−4 2.3 × 10−44.7 × 10−4
Table 6. Water content and temperature for uptake of CO2 for BaCe1−yInyPxO3−y/2+x/2.
Sample (nominal composition)Moles of water per formula unit Temperature of CO2 mass gain (°C)
BaCe0.8In0.2O2.90.04(1)450
BaCe0.75In0.2P0.05O2.9250.03(1)525
BaCe0.7In0.25P0.05O2.90.03(1)550
BaCe0.65In0.3P0.05O2.8750.02(1)550
BaCe0.6In0.3P0.1O2.90.04(1)575
Figure 1. XRD pattern for attempted synthesis of “BaCe0.8Y0.1P0.1O3” with Ba10(PO4)6(OH)2 impurity peaks indicated.
Inorganics 02 00016 g001
Figure 2. XRD patterns for BaCe1−y(Y/Yb)yPxO3−y/2+x/2 with inset showing Ba3Y4O9 and Ba3Yb4O9 impurity phase for attempted synthesis of BaCe0.5Y0.4P0.1O2.8 and BaCe0.5Yb0.4P0.1O2.8.
Inorganics 02 00016 g002
Figure 3. Raman spectra of BaCe0.75Y0.2P0.05O2.925 and Ba2Ce0.6Y0.3P0.1O2.9 with band showing the presence of phosphate indicated.
Inorganics 02 00016 g003
Figure 4. Conductivity data between 350 °C and 800 °C for BaCe0.75Y0.2P0.05O2.925 (circle) and BaCe0.65Y0.3P0.05O2.875 (square) in dry (empty) and wet (filled) N2.
Inorganics 02 00016 g004
Figure 5. Conductivity data between 400 °C and 800 °C for BaCe0.65Y0.3P0.05O2.875 in dry N2 (filled circle) and dry O2 (empty circle).
Inorganics 02 00016 g005
Figure 6. TG profiles (10 °C min−1 to 1000 °C in 1:1 CO2 and N2 mixture) for (a) BaCe0.6Y0.3P0.1O2.9 and (b) BaCe0.6Yb0.3P0.1O2.9.
Inorganics 02 00016 g006
Figure 7. XRD patterns for BaCe1−yxInyPxO3−y/2+x/2 (x = 0.05, y = 0.2, 0.25, 0.3; x= 0.1, y = 0.3).
Inorganics 02 00016 g007
Figure 8. Raman spectra of BaCe0.75In0.2P0.05O2.925 and BaCe0.6In0.3P0.1O2.9 with band showing the presence of phosphate indicated.
Inorganics 02 00016 g008
Figure 9. Conductivity data between 350 °C and 800 °C for BaCe0.75In0.2P0.05O2.925 (circle) and BaCe0.65In0.3P0.05O2.875 (square) in dry (empty) and wet (filled) N2.
Inorganics 02 00016 g009
Figure 10. Conductivity data between 500 °C and 800 °C for BaCe0.65In0.3P0.05O5.875 in dry N2 (filled circle) and dry O2 (empty circle).
Inorganics 02 00016 g010

3. Experimental Section

High purity BaCO3, CeO2, Y2O3, In2O3, Yb2O3 and NH4H2PO4 were used to prepare BaCe1−yxYyPxO3−y/2+x/2, BaCe1−yxInyPxO3−y/2+x/2 and BaCe1−yxYbyPxO3−y/2+x/2 samples. A small (3%) excess of BaCO3 was employed, in order to overcome Ba loss at elevated temperatures as has been seen in other studies synthesising similar Ba containing phases [18,19]. The powders were intimately ground and heated initially to 1000 °C for 12 h. They were then ball-milled (350 rpm for 1 h, Fritsch Pulverisette 7 Planetary Mill) and reheated to 1100 °C for 12 h. The resulting powders were then ball-milled (350 rpm for 1 h, Fritsch Pulverisette 7 Planetary Mill) a second time and pressed as pellets (1.3 cm diameter) and sintered at 1400 °C for 12 h. The pellets were covered in sample powder and the crucible was covered with a lid to limit the amount of Ba loss during the sintering process. Powder X-ray diffraction (Bruker D8 diffractometer with Cu Kα1 radiation) was used to demonstrate phase purity as well as for preliminary structure determination. For the latter, the GSAS suite of programs was used [25].
Raman spectroscopy measurements were made in order to provide further evidence for the successful incorporation of phosphate. These measurements utilised a Renishaw inVia Raman microscope with excitation using a Cobolt Samba CW 532 nm DPSS Laser.
The CO2 stabilities of samples were determined using thermogravimetric analysis (Netzsch STA 449 F1 Jupiter Thermal Analyser). Samples were heated at 10 C min−1 to 1000 C in a 1:1 CO2 and N2 mixture to determine at what temperature CO2 incorporation occurred.
The water contents of hydrated samples were determined from thermogravimetric analysis (Netzsch STA 449 F1 Jupiter Thermal Analyser). Samples were heated at 10 C min−1 to 1000 C in N2, and the water content was determined from the observed mass loss.
For the conductivity measurements, the sintered pellets (>80% theoretical) were coated with Pt paste, and then heated to 800 °C for 1 hour to ensure bonding to the pellet. Conductivities were then measured by AC impedance measurements (Hewlett Packard 4192A impedance analyser) in the range from 0.1 to 1.3 × 10³ kHz. Measurements were made in dry N2 and wet N2 (in which the gas was bubbled at room temperature through water) to identify any protonic contribution to the conductivity. Measurements were also made in dry O2 to determine if there was a p-type electronic contribution to the conductivity. The impedance spectra typically showed a single broad semicircle, corresponding to overlapping of bulk and grain boundary components. The total resistance was determined by the low frequency intercept of this semicircle. Attempts to increase the pellet density by higher temperature sintering were unsuccessful, with such heat treatments leading to evidence for Ba loss and insignificant improvements in densities.

4. Conclusions

The results demonstrate that it is possible to dope phosphate onto the B-cation site in Y,Yb, In doped BaCeO3, although it was necessary to increase the trivalent dopant content to at least 20% to achieve this, which can be explained by the need for sufficient oxide ion vacancies to allow for the accommodation of tetrahedral P5+. The results showed that this doping strategy leads to an improvement to the CO2 stability for BaCe1−yxInyPxO3−y/2+x/2, although for the comparable Y, Yb doped samples there was little improvement in this respect. Conductivities for all samples were lower than literature reports for such samples without phosphate doping. This may be related both to problems with achieving fully dense pellets for these phosphate doped samples, along with the influence of trapping of oxide ion vacancies around P5+ to achieve the required tetrahedral coordination for the phosphate group. The results, nevertheless, highlight the potential of perovskites to accommodate oxyanions.

Acknowledgments

We would like to express thanks to EPSRC (grant EP/I003932) for funding. The Bruker D8 diffractometer, Renishaw inVia Raman microscope, and Netzsch STA 449 F1 Jupiter Thermal Analyser used in this research were obtained through the Science City Advanced Materials project: Creating and Characterising Next generation Advanced Materials project, with support from Advantage West Midlands (AWM) and part funded by the European Regional Development Fund (ERDF).

Conflicts of Interest

The authors declare no conflict of interest.

References

  1. Kreuer, K.D. Proton-conducting oxides. Annu. Rev. Mater. Res. 2003, 33, 333–359. [Google Scholar] [CrossRef]
  2. Goodenough, J.B. Oxide-ion electrolytes. Annu. Rev. Mater. Res. 2003, 33, 91–128. [Google Scholar] [CrossRef]
  3. Orera, A.; Slater, P.R. New Chemical Systems for Solid Oxide Fuel Cells. Chem. Mater. 2010, 22, 675–690. [Google Scholar] [CrossRef]
  4. Norby, T. Solid-state protonic conductors: Principles, properties, progress and prospects. Solid State Ionics 1999, 125, 1–11. [Google Scholar] [CrossRef]
  5. Iwahara, H.; Uchida, H.; Ono, K.; Ogaki, K. Proton conduction in sintered oxides based on BaCeO3. J. Electrochem. Soc. 1988, 135, 529–533. [Google Scholar] [CrossRef]
  6. Yajima, T.; Kazeoka, K.; Yogo, T.; Iwahara, H. Proton conduction in sintered oxides based on CaZrO3. Solid State Ionics 1991, 47, 271–275. [Google Scholar] [CrossRef]
  7. Iwahara, H.; Yajima, T.; Hibino, T.; Ozaki, K.; Suzuki, H. Protonic conduction in calcium, strontium and barium zirconates. Solid State Ionics 1993, 61, 65–69. [Google Scholar] [CrossRef]
  8. Scholten, M.J.; Schoonman, J.; van Miltenburg, J.C.; Oonk, H.A.J. Synthesis of strontium and barium cerate and their reaction with carbon dioxide. Solid State Ionics 1993, 61, 83–91. [Google Scholar] [CrossRef]
  9. Babilo, P.; Haile, S.M. Enhanced sintering of yttrium-doped barium zirconate by addition of ZnO. J. Am. Ceram. Soc. 2005, 88, 2362–2368. [Google Scholar] [CrossRef]
  10. Tao, S.; Irvine, J.T.S. Conductivity studies of dense yttrium-doped BaZrO3 sintered at 1325 degrees C. J. Solid State Chem. 2007, 180, 3493–3503. [Google Scholar] [CrossRef]
  11. Ryu, K.H.; Haile, S.M. Chemical stability and proton conductivity of doped BaCeO3-BaZrO3 solid solutions. Solid State Ionics 1999, 125, 355–367. [Google Scholar] [CrossRef]
  12. Katahira, K.; Kohchi, Y.; Shimura, T.; Iwahara, H. Protonic conduction in Zr-substituted BaCeO3. Solid State Ionics 2000, 138, 91–98. [Google Scholar] [CrossRef]
  13. Goodenough, J.B.; Ruizdiaz, J.E.; Zhen, Y.S. Oxide-ion conduction in Ba2In2O5 and Ba3In2CeO8, Ba3In2HFO8, or Ba3In2ZrO8. Solid State Ionics 1990, 44, 21–31. [Google Scholar] [CrossRef]
  14. Rolle, A.; Vannier, R.N.; Giridharan, N.V.; Abraham, F. Structural and electrochemical characterisation of new oxide ion conductors for oxygen generating systems and fuel cells. Solid State Ionics 2005, 176, 2095–2103. [Google Scholar] [CrossRef]
  15. Quarez, E.; Noirault, S.; Caldes, M.T.; Joubert, O. Water incorporation and proton conductivity in titanium substituted barium indate. J. Power Sources 2010, 195, 1136–1141. [Google Scholar]
  16. Karlsson, M.; Matic, A.; Knee, C.S.; Ahmed, I.; Eriksson, S.G.; Borjesson, L. Short-range structure of proton-conducting perovskite BaInxZr1−xO3−x/2 (x = 0–0.75). Chem. Mater. 2008, 20, 3480–3486. [Google Scholar] [CrossRef]
  17. Shin, J.F.; Hussey, L.; Orera, A.; Slater, P.R. Enhancement of the conductivity of Ba2In2O5 through phosphate doping. Chem. Commun. 2010, 46, 4613–4615. [Google Scholar] [CrossRef]
  18. Shin, J.F.; Apperley, D.C.; Slater, P.R. Silicon Doping in Ba2In2O5: Example of a Beneficial Effect of Silicon Incorporation on Oxide Ion/Proton Conductivity. Chem. Mater. 2010, 22, 5945–5948. [Google Scholar] [CrossRef]
  19. Shin, J.F.; Orera, A.; Apperley, D.C.; Slater, P.R. Oxyanion doping strategies to enhance the ionic conductivity in Ba2In2O5. J. Mater. Chem. 2011, 21, 874–879. [Google Scholar] [CrossRef]
  20. Shin, J.F.; Slater, P.R. Enhanced CO2 stability of oxyanion doped Ba2In2O5 systems co-doped with La, Zr. J. Power Sources 2011, 196, 8539–8543. [Google Scholar] [CrossRef]
  21. Shin, J.F.; Joubel, K.; Apperley, D.C.; Slater, P.R. Synthesis and characterization of proton conducting oxyanion doped Ba2Sc2O5. Dalton Trans. 2012, 41, 261–266. [Google Scholar] [CrossRef]
  22. Smith, A.D.; Shin, J.F.; Slater, P.R. Synthesis and characterization of oxyanion (phosphate, sulphate) doped Ba2Sc2−yGayO5. J. Solid State Chem. 2013, 198, 247–252. [Google Scholar] [CrossRef]
  23. Soares, H.S.; Zhang, X.; Antunes, I.; Frade, J.R.; Mather, G.C.; Fagg, D.P. Effect of phosphorus additions on the sintering and transport properties of proton conducting BaZr0.85Y0.15O3−delta. J. Solid State Chem. 2012, 191, 27–32. [Google Scholar] [CrossRef]
  24. Wu, J.; Li, L.P.; Espinosa, W.T.P.; Haile, S.T. Defect chemistry and transport properties of BaxCe0.85M0.15O3−delta. J. Mater. Res. 2004, 19, 2366–2376. [Google Scholar] [CrossRef]
  25. Larson, A.C.; von Dreele, R.B. General Structure Analysis System (GSAS); Report. No LAUR 86–748; Los Alamos National Laboratory: Los Alamos, NM, USA, 2004. [Google Scholar]

