Article

Silver(I) Extraction with Benzo-18-Crown-6 Ether from Water into 1,2-Dichloroethane: Analyses on Ionic Strength of the Phases and their Equilibrium Potentials

1
Graduate School of Science, Chiba University, Chiba 263-8522, Japan
2
Department of Chemistry, Faculty of Science, Chiba 263-8522, Japan
*
Author to whom correspondence should be addressed.
Submission received: 19 May 2017 / Revised: 23 June 2017 / Accepted: 25 June 2017 / Published: 30 June 2017

Abstract

:
Extraction constants (Kex & Kex±) for the extraction of silver picrate (AgPic) by benzo-18-crown-6 ether (B18C6) into 1,2-dichloroethane (DCE) were determined at 298 K and various ionic strength (I)-values of a water phase with or without excess HNO3. Here the symbols, Kex and Kex±, were defined as [AgLPic]DCE/P and [AgL+]DCE[Pic]DCE/P with P = [Ag+][L]DCE[Pic] and L = B18C6, respectively; [ ]DCE refers to the concentration of the corresponding species in the DCE phase at equilibrium. Simultaneously, KD,Pic (= [Pic]DCE/[Pic]) and K1,DCE (= Kex/Kex±) values for given I and IDCE values were determined, where the symbol IDCE shows I of the DCE phase. Also, equilibrium potential differences (Δφeq) based on the Pic transfer at the water/DCE interface were obtained from the analysis of the KD,Pic [= KD,PicS exp{−(F/RT) Δφeq}] values; the symbol KD,PicS shows KD,Pic at Δφeq = 0 V. On the basis of these results, I dependences of logKex and logKex± and IDCE ones of logK1,DCE and logKex± were examined. Extraction experiments of AgClO4 and AgNO3 by B18C6 into DCE were done for comparison. The logKex±-versus-Δφeq plot for the above Ag(I) extraction systems with Pic, ClO4, and NO3 gave a good positive correlation.

1. Introduction

It is well known that crown compounds (L) extract alkali and alkaline-earth metal ions (Mz+, z = 1, 2) from water (w) into various diluents [1,2,3,4]. In many extraction experiments, extraction constants for L have been determined so far [1,2,3,4,5,6,7,8]. For example, the two representative constants, Kex and Kex±, for the extraction of a univalent metal salt (MIA) by L have been defined as [MLA]org/P [2,3] and [ML+]org[A]org/P [1,4] with P = [M+][L]org[A], respectively. Generally, the Kex value is effective for the evaluation of an extraction-ability and -selectivity of L against M+ into low-polar diluents, while the Kex± value is for those of L into high-polar ones. Here, the subscript ″org″ denotes an organic phase and A does a univalent pairing anion. For the latter Kex±, its thermodynamic equilibrium constants have been reported [4]. For the former Kex, its thermodynamic treatment seems to be few. The authors were not able to find out the study with respect to a dependence of logKex on the ionic strength (I) of the w phase.
Presences of equilibrium potential differences (Δφeq) between aqueous and diluent solutions have been recently reported for the extraction of some M+ or M2+ with L [5,6,7]. This symbol Δφeq was defined as ∑{inner potential (φ ) of ionic species in the w phase} − ∑{φ of those in the org or diluent phase} [8], according to the definition [9,10], φwφorg, of an interfacial equilibrium potential-difference in the electrochemistry at liquid/liquid interfaces. In the above studies, an approximation method [5,6,7,8] for the Δφeq determination, namely the method with a use of a ″conditional″ distribution constant (KD,A) of A into the org phase, has been described in comparison with its more-precise method with solving higher-degree equations [6]. Here the ″conditional″ is due to the fact that the KD,A values change depending on the Δφeq ones, even at fixed pressure and temperature. However, it is still not clarified whether the Δφeq values determined by the KD,A values equal those coming from the distribution of M+ into the org phases or not.
In the present paper, we determined the Kex, Kex±, and KD,A values [6,8] at 298 K by the extraction experiments into 1,2-dichloroethane (DCE) with silver picrate (AgPic) and benzo-18-crown-6 ether (B18C6), in order to elucidate mainly the above two subjects for I and Δφeq. The same experiments were performed under the condition of the presence of excess HNO3 in the w phases. Then, an ion-pair formation constant (K1,DCE/mol−1·dm3) for Ag(B18C6)+Pic in the DCE phase, DCE saturated with water, and the Δφeq values were calculated from the relations, K1,DCE = Kex/Kex± [6,8] and Δφeq = −(2.303RT/F){logKD,A − log(KD,A standardized at Δφeq = 0 V)} [11], respectively. Here, R, T, and F are usual meanings. On the basis of these data, the dependences of logKex and logKex± on the I values and those of logK1,DCE and logKex± on the I values (IDCE) of the DCE phases were examined. Moreover, a relation between the Δφeq values determined by the KD,A ones and the conditional distribution constants (KD,Ag) of Ag+ into the DCE phases was discussed indirectly. For comparison, the Kex± and Kex values were experimentally determined at 298 K for the AgClO4- and AgNO3-B18C6 extraction into DCE. As basic data, the KD,AgS value was determined in terms of a simple Ag+Pic extraction experiment into DCE. The symbol KD,AgS denotes the distribution constant of Ag+ into the DCE phase standardized at Δφeq = 0 V, that is, the standard distribution one.

2. Results

2.1. Determination of LogKD,AgS

According to our previous paper [12], the KD,MS value has been obtained from a plot of DA′ versus [A] based on the equation
DA′ = [A]t,org/[A] = Kex,MA[A] + KD, ±
with
KD, ±2 = KD,MS·KD,AS = KD,M·KD,A
and Kex,MA = KMA,org(KD, ±)2 (= [MA]org/[M+][A]), where KMA,org is [MA]org/[M+]org[A]org and [A]t,org denotes a total concentration, [MA]org + [A]org, of A(−I) in the org phase. A regression analysis of the plot (see Figure 1) yields a straight line with a slope of Kex,AgPic and an intercept of KD, ±. We call this KD, ± a mean distribution constant.
Using the KD,PicS value (= 10−1.011 [12]), we immediately can obtain the KD,AgS one from Equation (2). The thus-determined values were logKD, ± = −3.74 ± 0.04, logKex,AgPic = −1.49 ± 0.05, and logKAgPic,DCE = 5.992 ± 0.008 and then the logKD,AgS value became −6.47 ± 0.04 from the logarithmic form of Equation (2). This KD,AgS value was used only for the KAgL,DCE calculation (see Table 1 and Table 2).

2.2. Composition Determination of Complex Species Extracted into DCE

Compositions of species extracted into DCE have been determined by a plot of 2logD or log(D/[A]) versus log[L]org [2,7,13]. When the slope of both plots is in unity, it independently gives the compositions of ML+ with A or MLA as the extracted major species. Among their plots, experimental slopes of all the log(D/[Pic])-versus-log[B18C6]org plots were less than unity, suggesting the dissociation of Ag(B18C6)Pic in the DCE phases [13]. On the other hand, the 2logD-versus-log[L]org plots were in the slope ranges of 1.01–1.11 for the AgPic extraction with L = B18C6, in the slopes of 1.09 for the AgClO4 one and of 1.08 for the AgNO3 one (Figure 2). These results indicate the AgB18C6+ extraction into DCE with A = Pic, ClO4, or NO3. That is, the extraction systems were accompanied with the dissociation process, Ag(B18C6)ADCE AgB18C6+DCE + ADCE (see Appendix).

2.3. Determination of Various Equilibrium Constants for the Extraction Systems

For the determination of KD,A, Kex±, and Kex, the following extraction-constant parameter (Kexmix/mol−2·dm6) has been employed [7,8,11].
logKexmix = log{([MLA]org + [ML+]org + [M+]org)/P}
Rearranging this equation, we immediately obtain
logKexmix ≈ log{Kex + (KD,A/[M+][L]org)}
≈ log{Kex + (Kex±/P)1/2}
under the assumption of [MLA]org + [ML+]org >> [M+]org. So we can determine the KD,A and Kex± values from the plots of logKexmix versus −log([M+][L]org) {see Equation (3a)} and −(1/2)logP {see Equation (3b)}, respectively, together with the Kex values. Figure 3 and Figure 4 show examples for such plots. Additionally, the ion-pair formation constant, K1,org, for MLA in the org phase was calculated from K1,org = Kex/Kex± for a given Iorg on average.
Similarly, a complex formation constant (KAgB18C6,DCE/mol−1·dm3) for AgB18C6+ in the DCE phase was estimated from the thermodynamic relation of KAgB18C6,DCE = Kex±/(KD,AgS·KD,PicS). Table 1 and Table 2 list the logarithmic KD,A, Kex±, Kex, K1,DCE, and KAgB18C6,DCE values thus-obtained, together with the average I and IDCE values.

2.4. Determination of Equilibrium Potential Differences between the Water and DCE Phases

The logKD,A values were obtained from the plots based on Equation (3a). Next, the equilibrium potential differences Δφeq can be evaluated from using the following equation [11]:
Δφeq = −(2.303RT/F)(logKD,A − logKD,AS)
with
logKD,AS = (F/2.303RTφA°′
where the symbols, KD,AS and ΔφA°′, are called the standard distribution constant of A into the org phase, namely KD,A at Δφeq = 0 V, and a standard formal potential for the A transfer at the w/diluent interface, respectively; see Section 2.1 for the KD,PicS value. The thus-evaluated values are listed in Table 1 and Table 2.
Strictly speaking, Δφeq and ΔφA0′ are the equilibrium potential differences between the two bulk phases. However, they can be regarded approximately as the equilibrium potential differences at the liquid/liquid interfaces [9,10].

3. Discussion

3.1. I Dependences of LogKex and LogKex±

The dependences of logKex and logKex± on I are considered below. On the basis of their definitions, the Kex value can be dependent on [M+] and [A], while, in addition to these concentrations, the Kex± value can be on [ML+]org and [A]org. Therefore, Kex is mainly a function of I, while Kex± is a function with the two parameters, I and Iorg; the relations [14] of [M+] = aM/y+(I) and [A]org = aA,org/y−,org(Iorg) hold as examples (see below for the symbols a and y). The I dependence of logKex± is of an approximate.
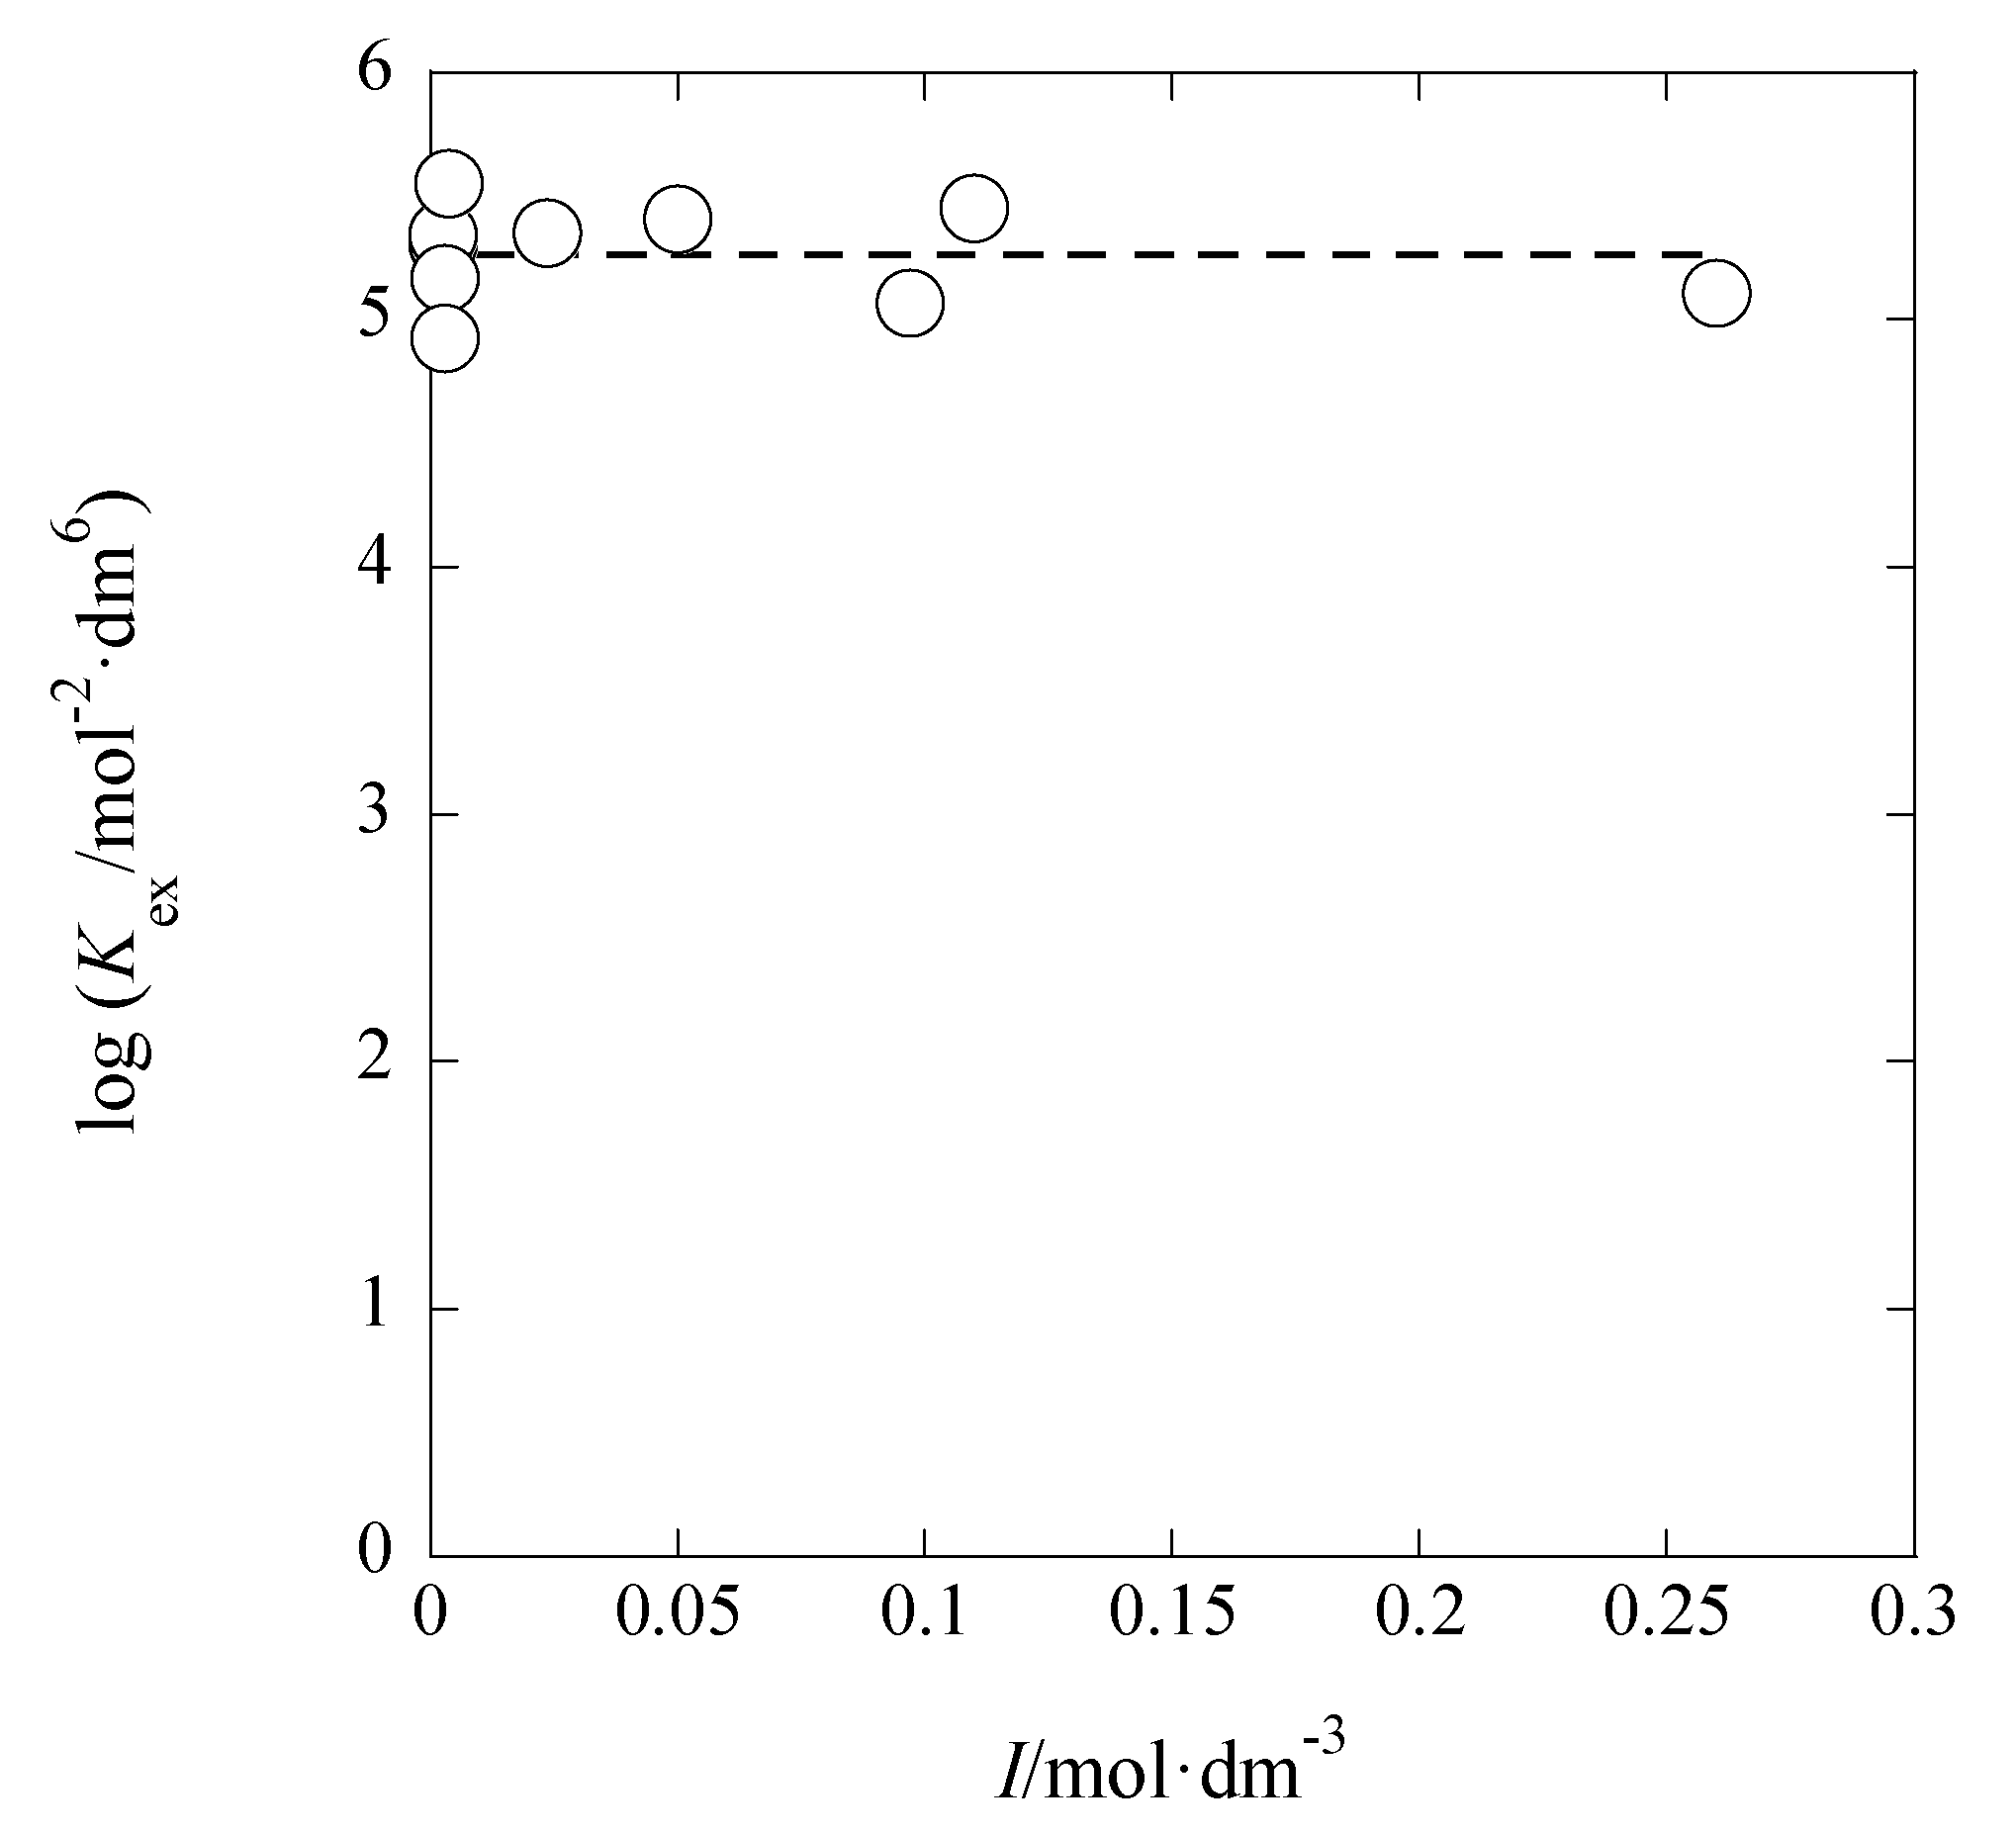
Figure 5 shows the logKex-versus-I plot for the AgPic-B18C6 extraction system with DCE; in the plot, the average value of I was employed as I (x-axis) of each system. Using the extended Debye-Hückel (DH) equation [14], the extraction constant (Kex0) at I → 0 mol·dm−3 is expressed as
logKex0 = log([MLA]org/aM[L]orgaA) = logKex − log(y+y)
=   log K ex +   2 A I / ( 1   + B å I )
where the symbols, aj and y, denote the activity of species j (= M+, A) and its activity coefficient with I, respectively [14]. Rearranging Equation (5), the following equation was obtained immediately:
log K ex =   log K ex 0   2 A I / ( 1   + B å I )
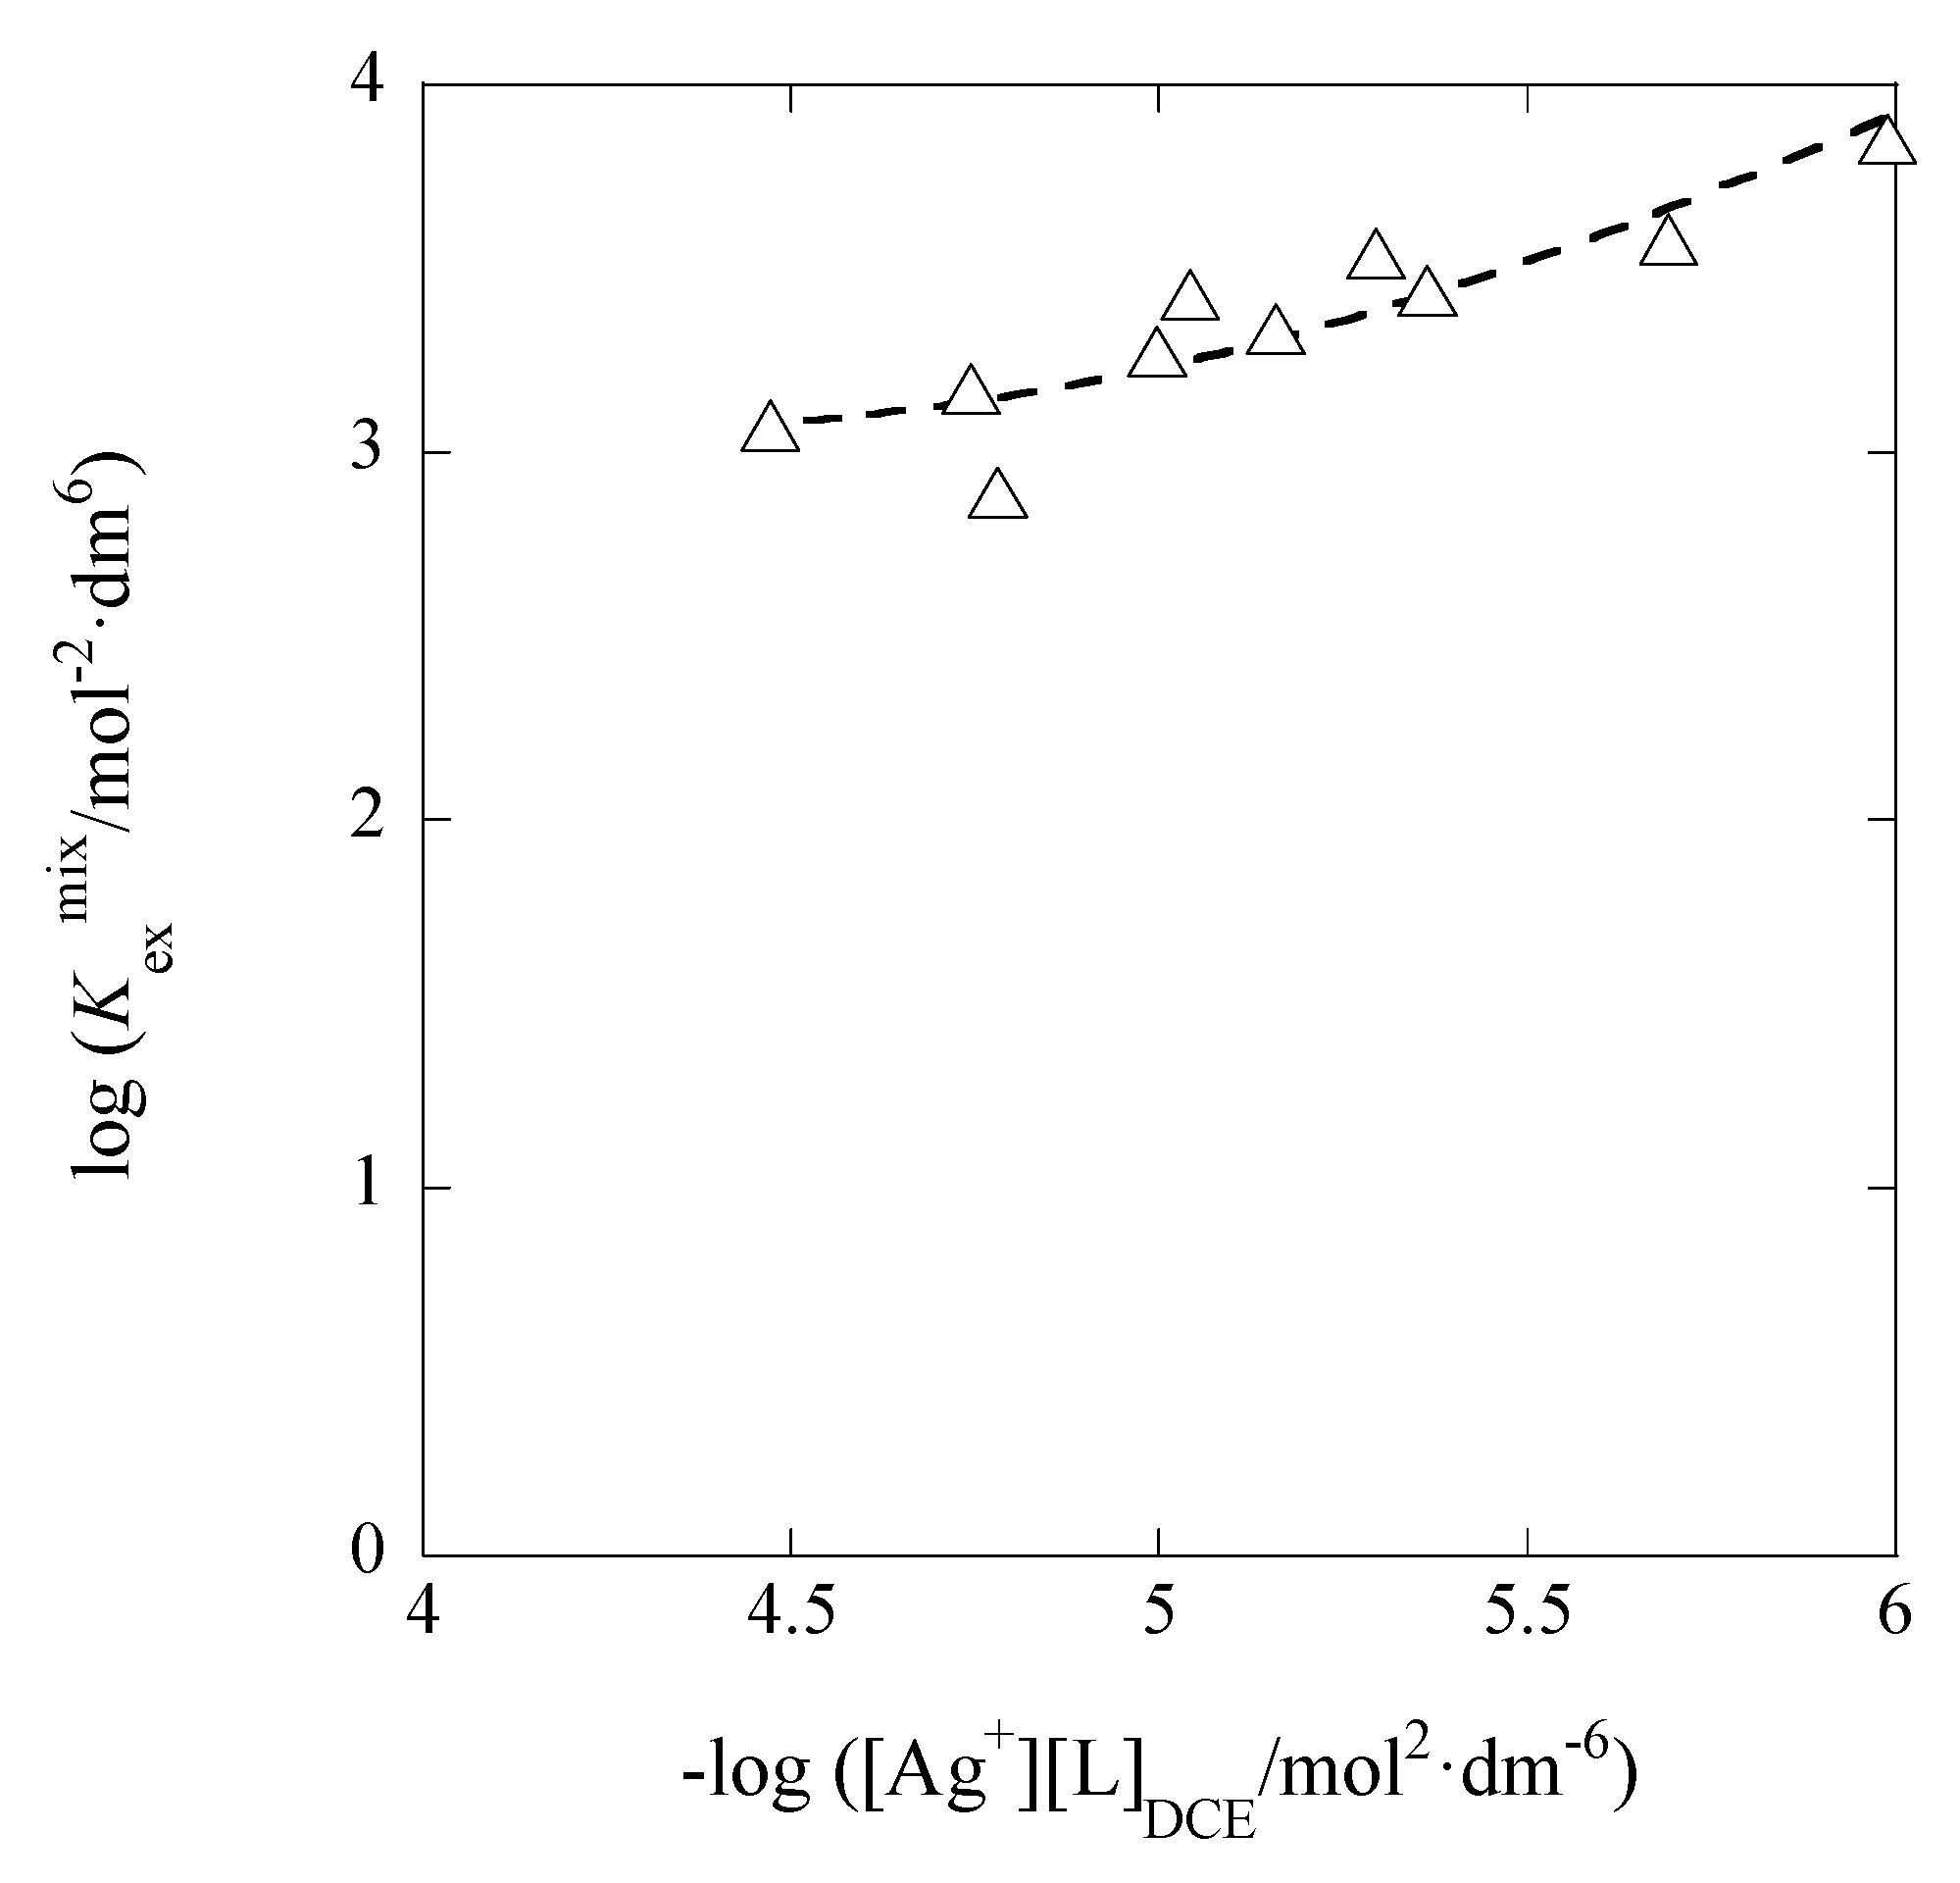
The regression analysis of the plot in Figure 5 based on this equation yielded the regression line with log(Kex0/mol−2·dm6) = 5.28 ± 0.25 and = 44 ± 661 mol−1/2·dm3/2 Å at r = 0.024 and N (number of data) = 10, the fixed A value (= 0.5114) in pure water, and 298 K. Considering the error of the experimental value, it is difficult to discuss the or å value in this result. When the three parameters, logKex0, A, and , had been used for the regression analysis, it gave the results of logKex0 > 0, A < 0, and < 0. Consequently, we gave up such an analysis.
Similarly, the extraction constant (Kex±0) at I → 0 is expressed as
logKex±0 = log(aML,orgaA,org/aM[L]orgaA)
= logKex± + log(yML,orgy−,org) − log(y+y)
where the subscript “ML” means the complex ion ML+. Rearranging this equation, we can immediately obtain
log K ex ± =   log K ex ± 0     2 A I / ( 1   + B å I ) ,
where Kex±0′ denotes Kex±0/(yML,orgy−,org) (= [ML+]org[A]org/aM[L]orgaA). Unfortunately, the analysis of the plot based on Equation (6a) did not yield the suitable result which satisfies the condition of > 0.
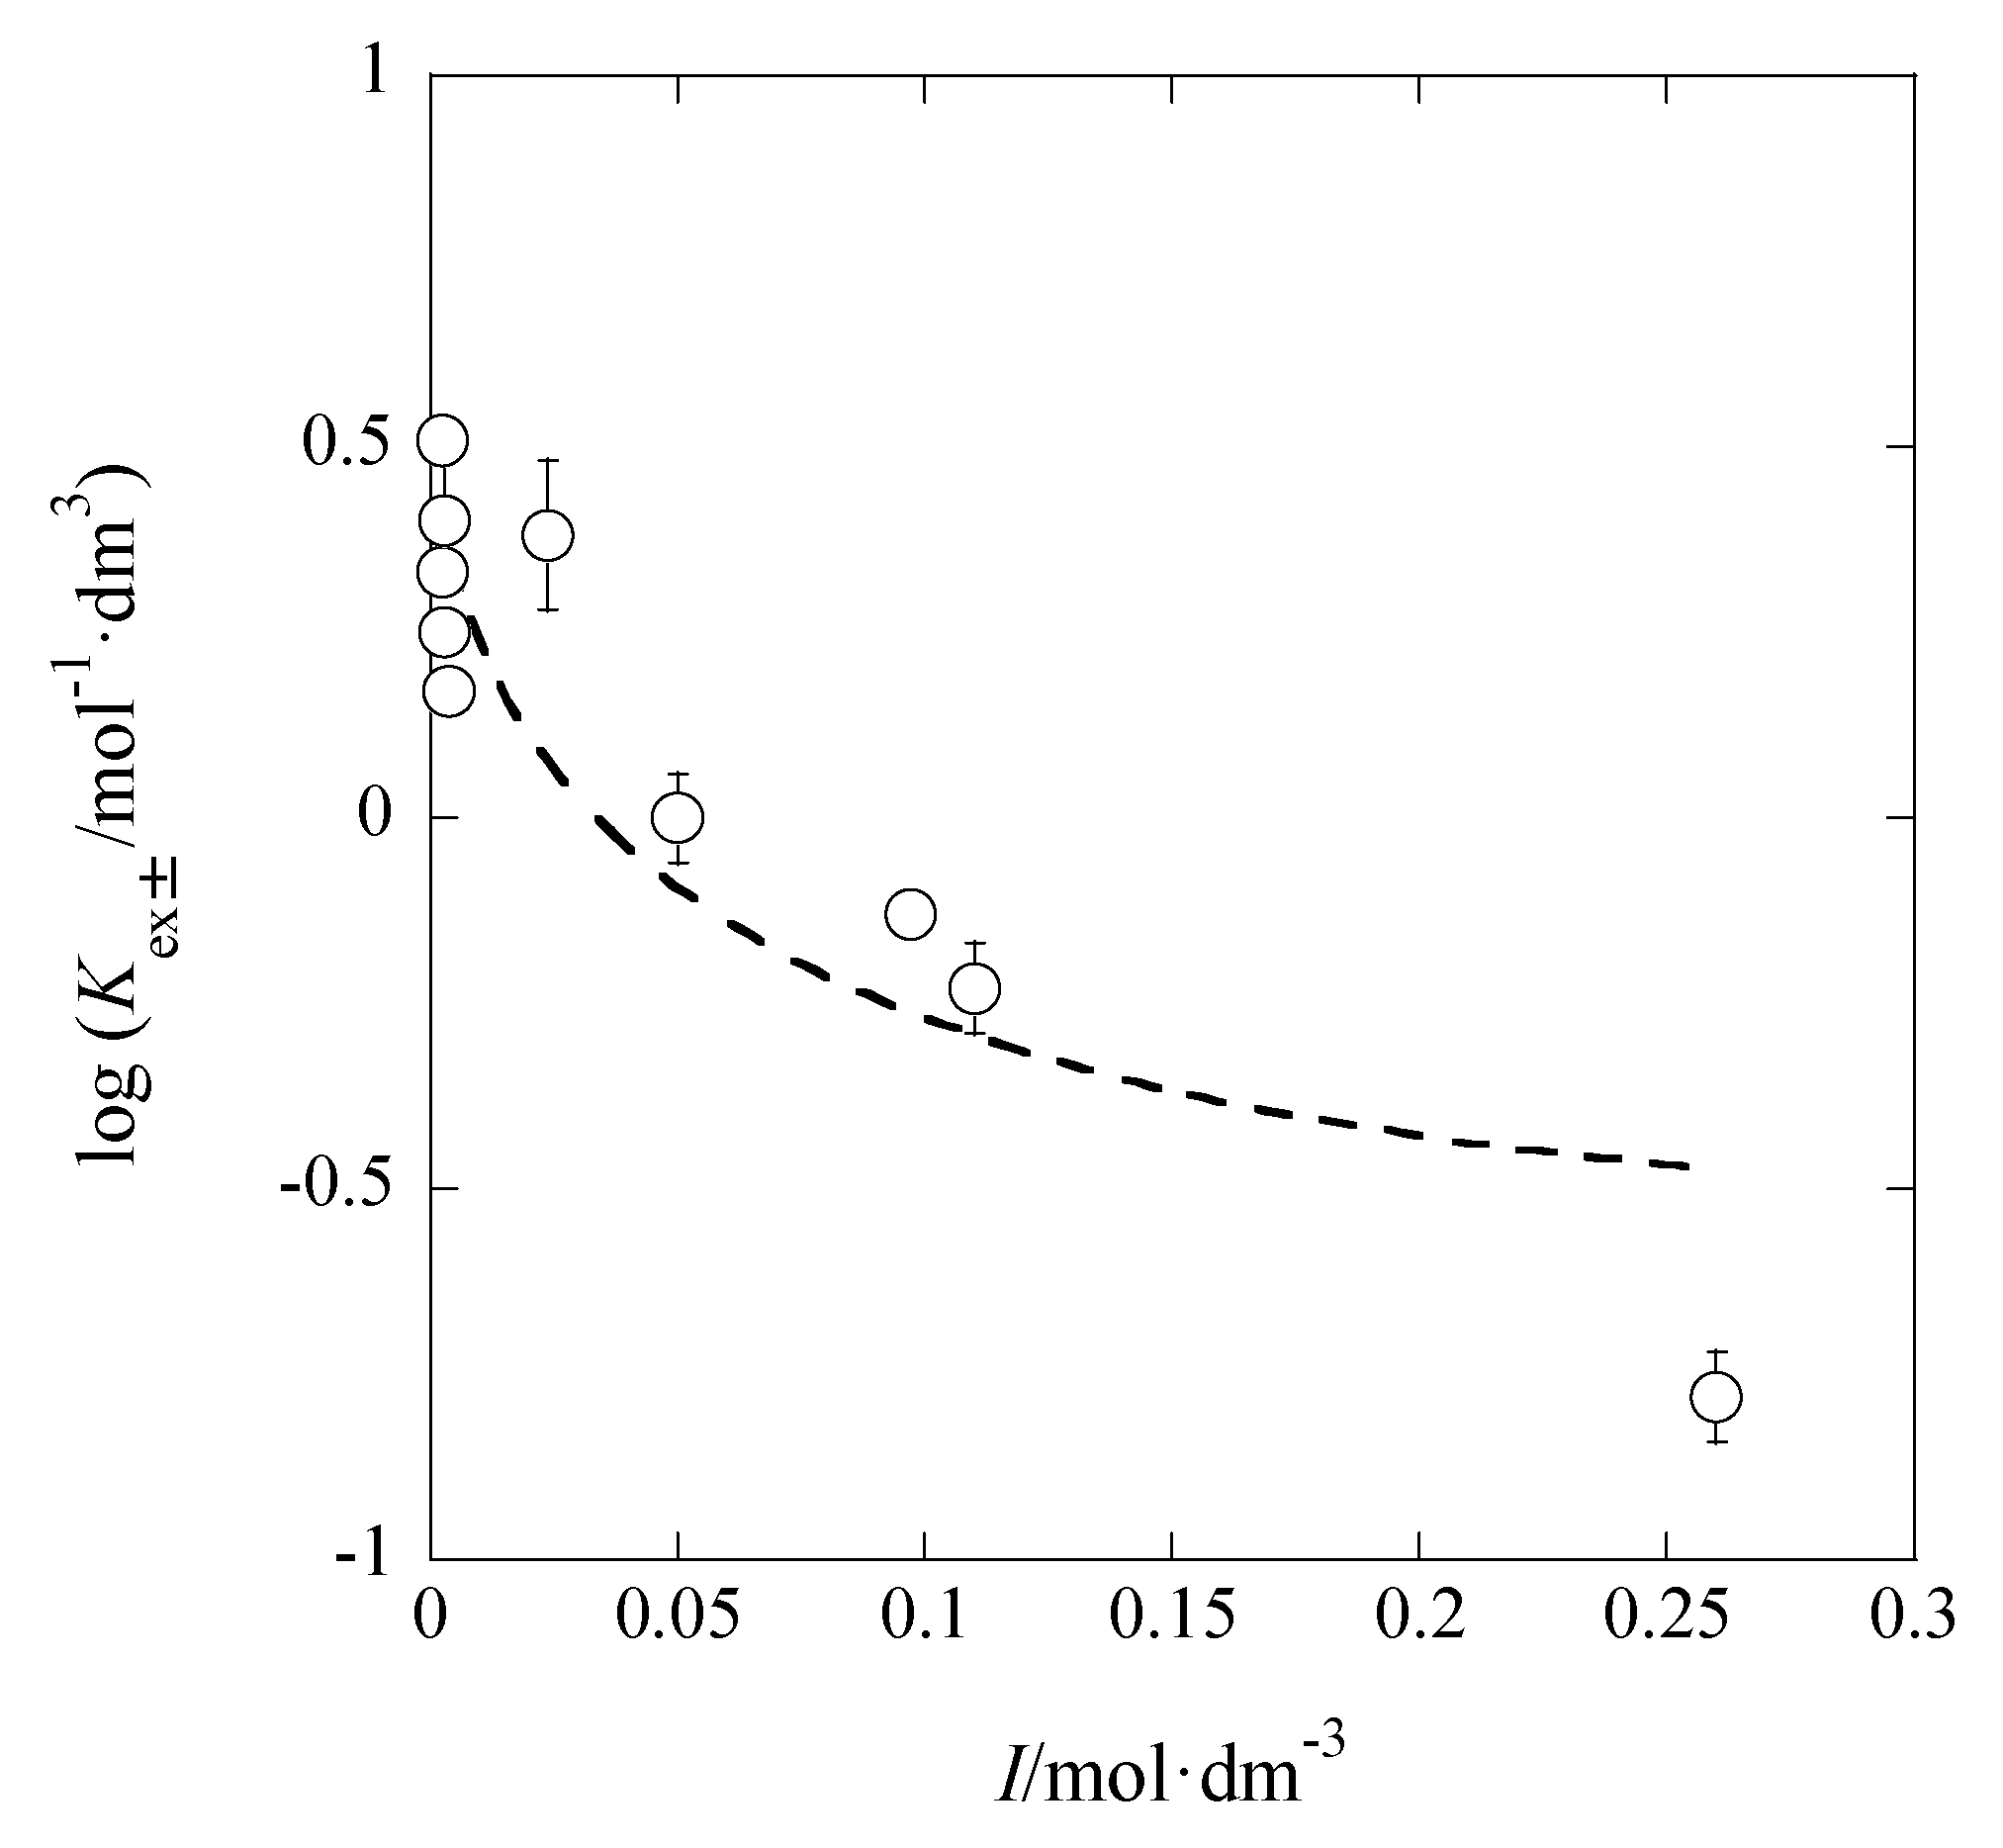
On the other hand, using the Davies equation without instead of the extended DH equation [14], logKex±0′ = 0.60 ± 0.11 and A = 2.05 ± 0.38 mol−1/2·dm3/2 were obtained (Figure 6). The Davies equation is logy = −A z 2 { I /(1 + I   ) − 0.3I} [14], where z shows a formal charge of ionic species with a sign (refer to the Introduction).
The analysis of the logKex-versus-I plot by the Davies equation yielded logKex0 = 5.29 ± 0.11 with A = 0.08 ± 0.40 mol−1/2·dm3/2. Within the calculation error of ±0.3, this logKex0 value was in accord with 5.3 determined by the DH equation (see above in this section).

3.2. IDCE Dependence of LogKex±

Applying the DH limiting law [14] for the system and rearranging Equation (6) at org = DCE, we can easily obtain
log K ex ±   log K ex ± 0   +   2 A DCE I DCE .
Hence, a plot of logKex± versus IDCE yields logKex±0′′ and ADCE values immediately. Here, Kex±0′′ is defined as aML,DCEaA,DCE/([M+][L]DCE[A]) (=y+yKex±0). Figure 7 shows its plot for the AgPic-18C6 extraction systems with DCE.
Also the average values of IDCE were used for the plot (see Section 3.1) and the y+y value in Kex±0′′ was estimated on average (N = 10) to be 0.76 ± 0.14. This product was calculated from the ion size parameters, a(Ag+) = 2.5 and a(Pic) = 7 Å, in water [15]. A plot analysis gave logKex±0′′ = −0.45 ± 0.24 and ADCE = 116 ± 46 mol−1/2·dm3/2 at r = 0.665. Accordingly, introducing y+y in logKex±0′′ = logy+y + logKex±0, the logKex±0 value became –0.36 ± 0.24. The experimental ADCE value was much larger than its theoretical one (= 10.6 mol−1/2·dm3/2) for a pure DCE at 298 K. This difference between these ADCE values may be due to simple errors caused by the narrow experimental IDCE-range of (0.097–2.2) × 10−5 mol·dm−3 or to the condition where the diluent DCE was saturated with water.

3.3. IDCE Dependences of LogK1,DCE

The thermodynamic ion-pair formation constant (K1,org0) at Iorg → 0 is described as
logK1,org0 = log([MLA]org/aML,orgaA,org) = logK1,org − log(yML,orgy−,org)
Rearranging this equation at org = DCE and ML+ = AgB18C6+ can give the following equation:
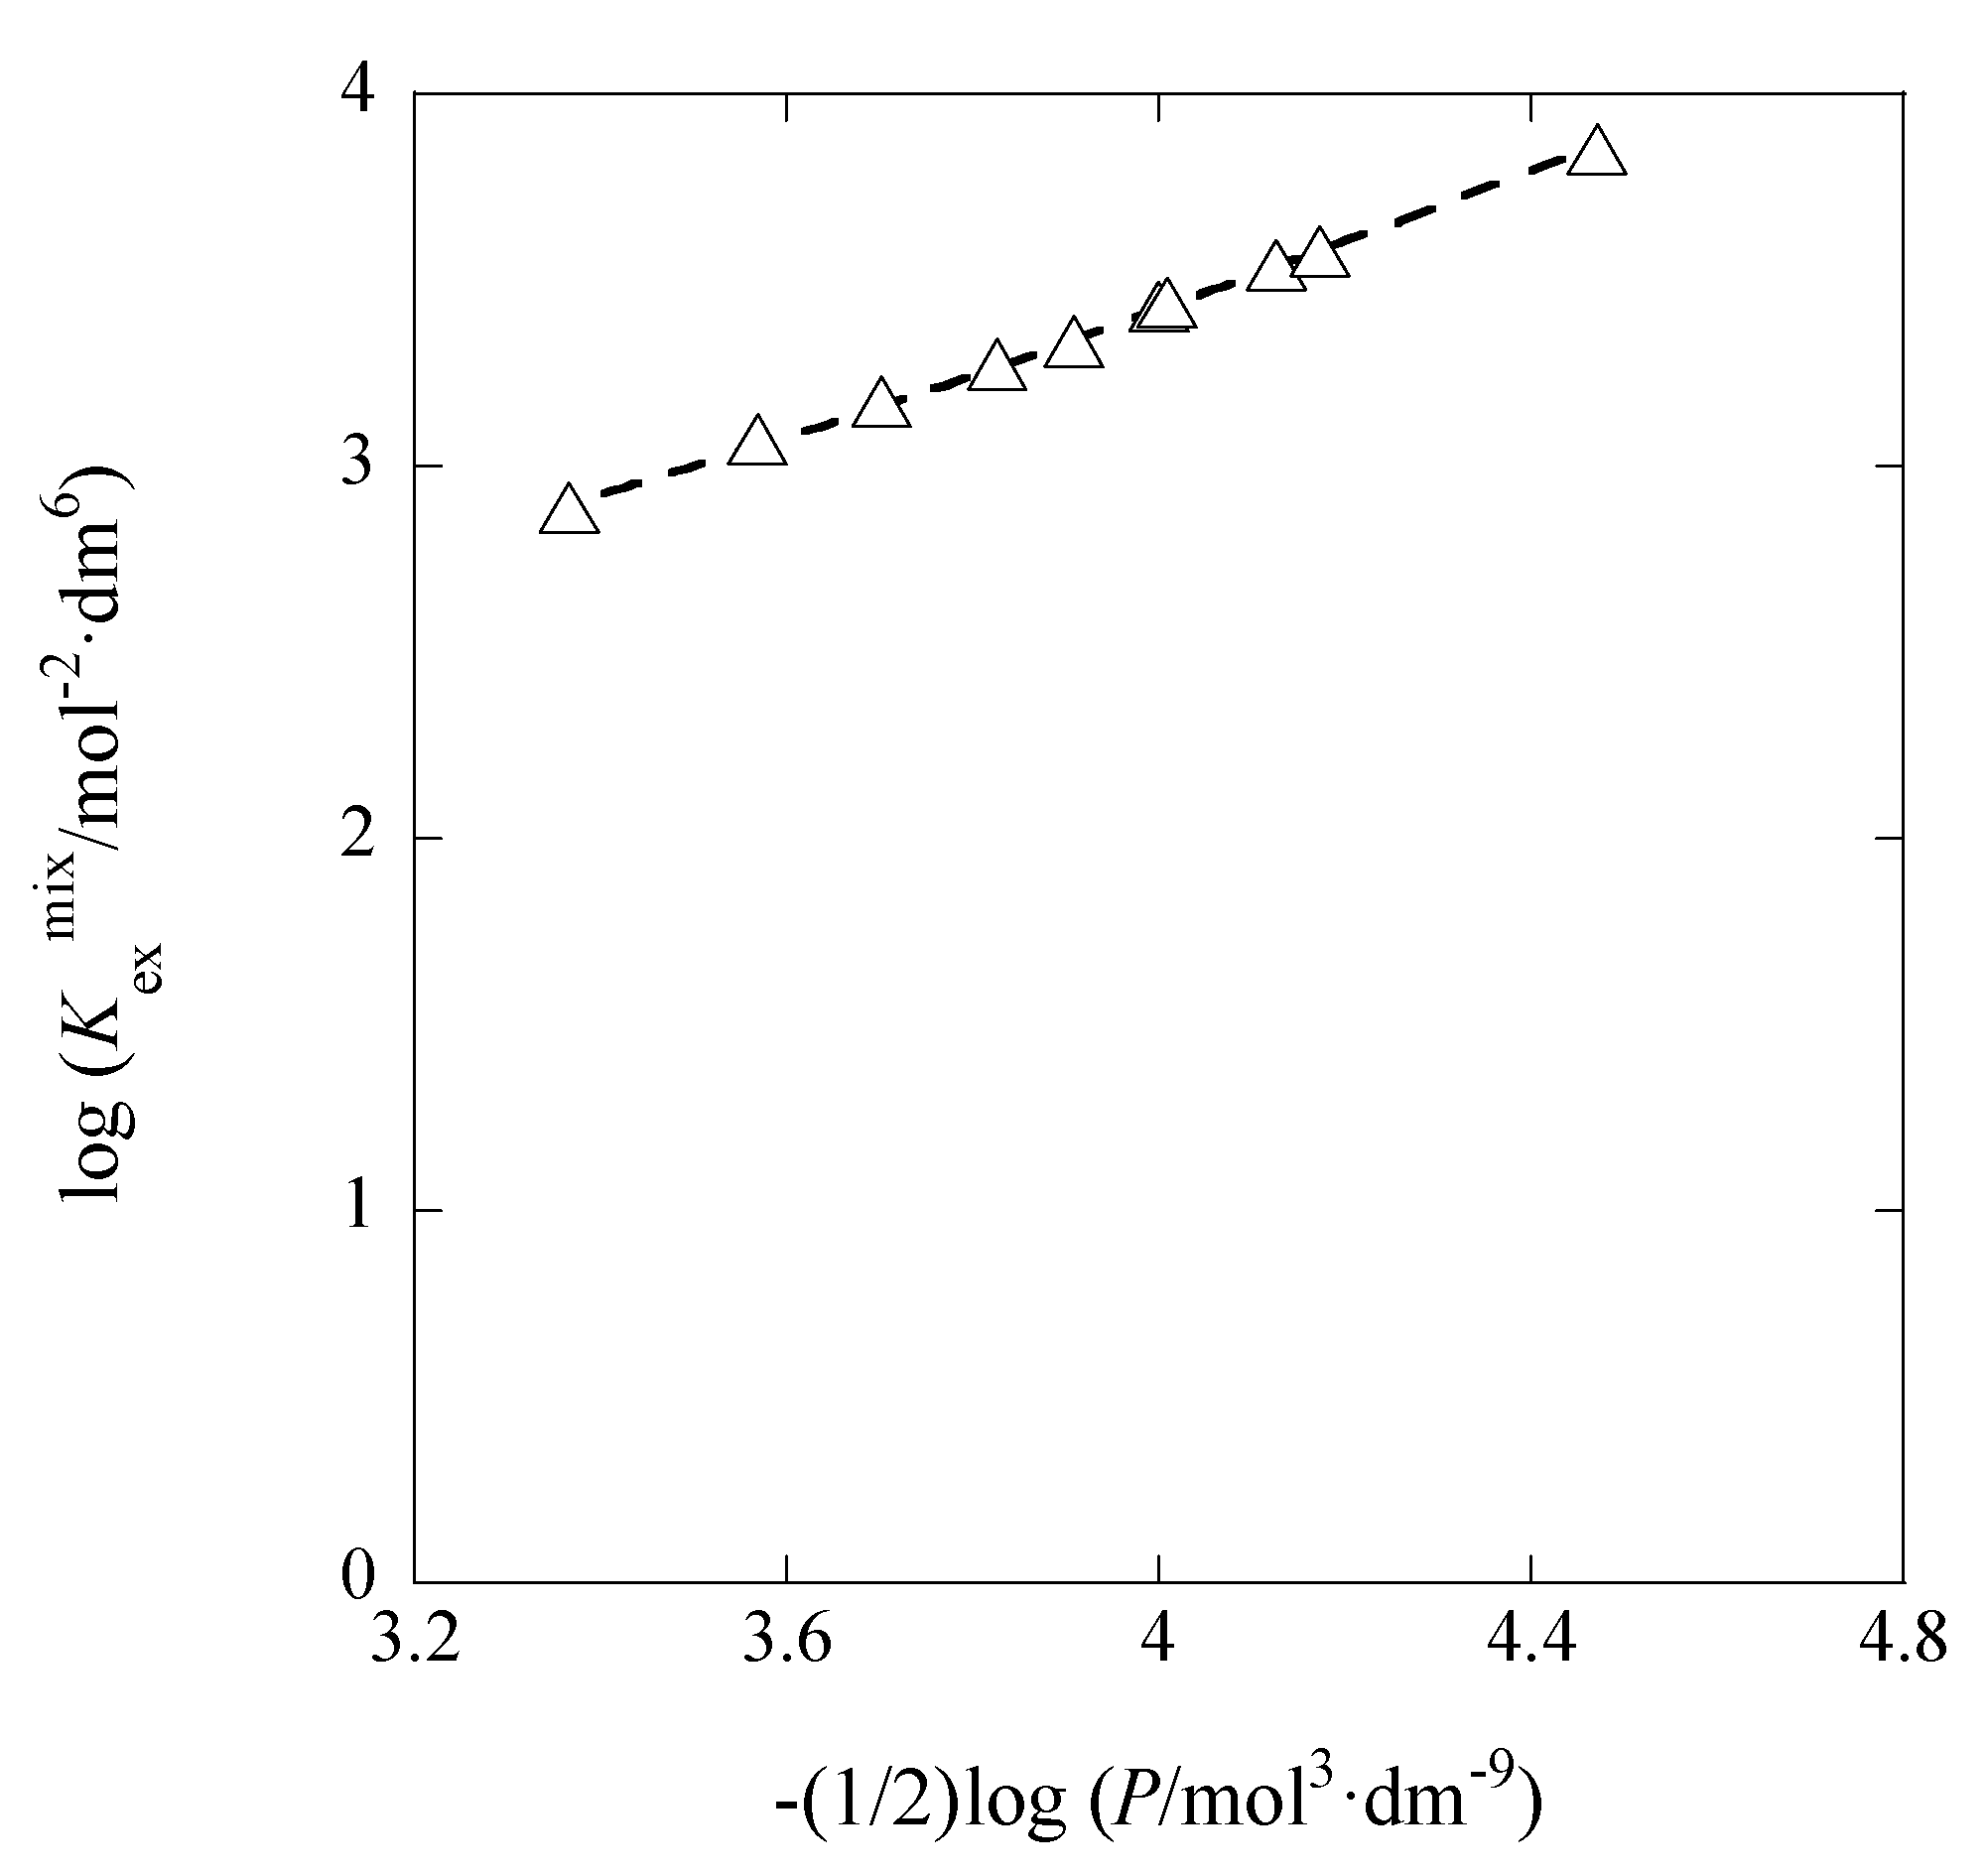
log K 1 , DCE =   log K 1 , DCE 0 +   log ( y AgB 18 C 6 , DCE y , DCE )     log K 1 , DCE 0   2 A DCE I DCE
A plot of logK1,DCE versus IDCE is shown in Figure 8. The plot analysis yielded the regression line with logK1,DCE0 = 5.89 ± 0.19 and ADCE = 152 ± 37 mol−1/2·dm3/2 at r = 0.821 and N = 10. This ADCE value overlaps with the value (= 116) determined above (see Section 3.2), within the calculation error (= 46) and much larger than the theoretical one too. The authors cannot clearly explain the larger experimental ADCE values, as similar to Section 3.2.
The logarithmic value, logK1,DCEav, of simple average-K1,DCE one was 5.36 ± 0.42 in the IDCE range of (0.097-2.2) × 10−5 mol·dm−3 at N = 10 and was smaller than the logK1,DCE0 value (= 5.9 at I → 0). Although the experimental IDCE values were adequately small (IDCE << 0.001), the magnitude of K1,DCE decreased with an increase in IDCE. Also, the logK1,DCEav value was smaller than the logKAgPic,DCE one (= 6.0, see Section 2.1). From the logKex±0′ value (= 0.6) in Section 3.1 and the logKex±0 one (= −0.36) in 3.2, we obtained log(yAgB18C6,DCEy,DCE) (= logKex±0 − logKex±0′) = −0.96 ± 0.27. Hence, the logK1,DCE value was estimated to be 4.93 {= logK1,DCE0 + log(yAgB18C6,DCEy−,DCE) = 5.89−0.96}, being somewhat smaller than the logK1,DCEav value (= 5.4). These facts indicate that the logK1,DCEav value is not properly reflective of the logK1,DCE one in Equation (7).
On the other hand, the log(KAgB18C6,DCE/mol1·dm3) values were calculated from the relation logKML,org = logKex± − logKD,MSKD,AS for a given IDCE. Here, we assumed that, considering the smaller IDCE values, the ratio, yMl,DCE/y+,DCE, of the activity coefficients in the thermodynamic complex-formation constant, KML,DCE0, equals unity. Accordingly, the approximation that an average value among the KAgB18C6,DCE ones equals the KAgB18C6,DCE0 value becomes valid. Consequently, as its logarithmic value, 7.77 ± 0.25 was obtained on average (N = 12) at 298 K.

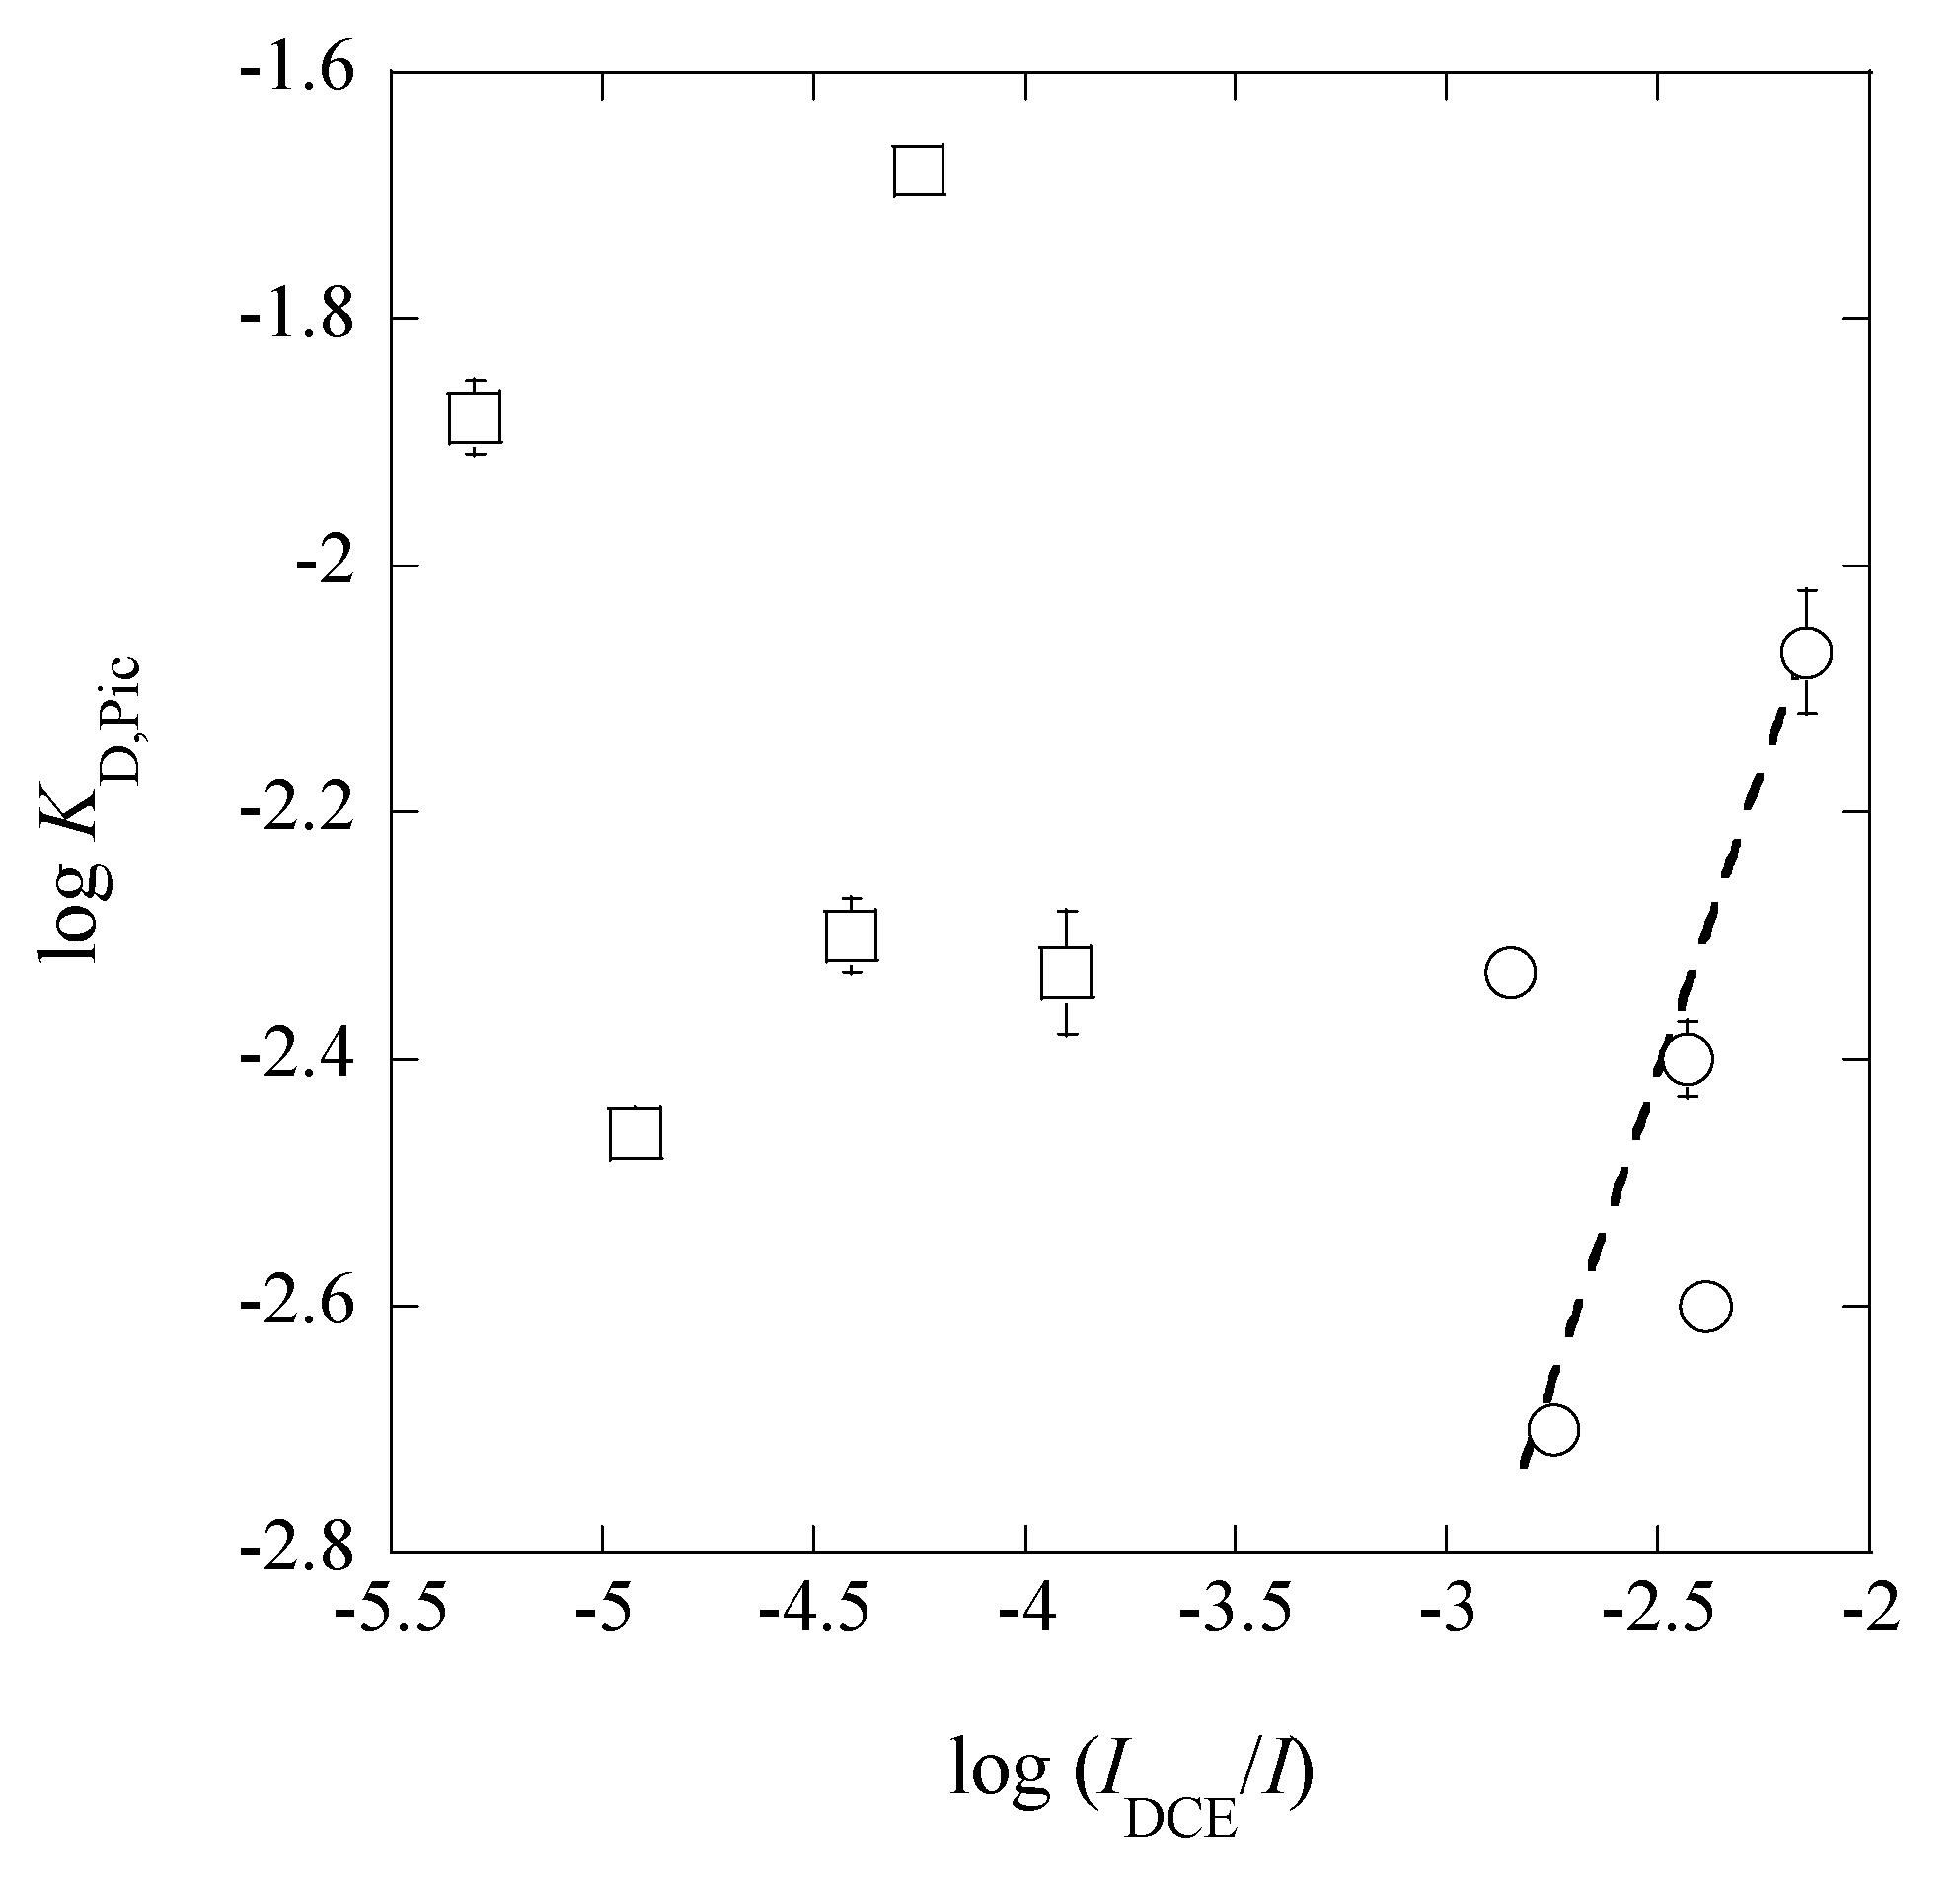
3.4. A Trend between LogKD,Pic and Log(IDCE/I)

From a plot of logKD,Pic versus log(IDCE/I), we obtained a theoretical line of logKD,Pic = log(IDCE/I) − (0.09 ± 0.12) at r = 0.398 (Figure 9) under the condition of the fixed slope of unity, except for the points in the I range of 0.024-0.26 mol·dm3. This trend suggests that the KD,Pic values are basically proportional to the ratios of (IDCE/I), as reported before [16]. The deviation of the five points in Figure 9 can come from an effect of the higher I values in (IDCE/I). An answer to this deviation is explained as follows.
For the case of only MA (or mixture of MX with small excess organic acid, HA) in w phase with L, we can propose the following equation for I and Iorg.
I = (1/2)([M+] + [ML+] + [A]) = [A]
with the charge balance equation of [M+] + [ML+] = [A]. Similarly, the authors can obtain
Iorg = (1/2)([M+]org + [ML+]org + [A]org) ≈ [A]org
in the org phase. The assumption that [AgB18C6+]DCE is much larger than [Ag+]DCE, namely [AgB18C6+]DCE ≈ [Pic]DCE, was employed for the experiments. From Equations (8) and (8a), one can see easily the experimental relation that (IDCE/I) is basically proportional to KD,Pic.
On the other hand, for the present case of mixture of MX with the small excess HA and excess HX (strong acid) in the w phase with L, the corresponding equations are
I = (1/2)([M+] + [H+] + [ML+] + [HL+] + [A] + [X]) ≈ [A] + [X]
and
Iorg = (1/2)([M+]org + [H+]org + [ML+]org + [HL+]org + [A]org + [X]org) ≈ [A]org
with the assumptions that [M+] + [ML+] + [H+] ≈ [A] + [X] and [M+]org + [H+]org + [ML+]org + [HL+]org ≈ [A]org (>> [X]org), respectively. Therefore, Equations (9) and (9a) give the experimental relation of
(IDCE/I) ≈ [Pic]DCE/([Pic] + [NO3]) = KD,Pic/(1 + [NO3]/[Pic])
and then its ratio becomes smaller than the KD,Pic value in the case of [NO3] >> [Pic]. When [NO3] nearly equals [Pic] in Equation (9b), the log(IDCE/I) value deviates from the logKD,Pic one by +0.3: that is, (IDCE/I) ≈ KD,Pic/2. However, such a deviation is comparable to experimental errors. Thus, Equation (9b) explains well the deviation of the five points from the regression line in Figure 9. Obviously, the deviation becomes larger, when an excess of HX, such as HNO3, was added in the w phase and X less distribute into the org phase than A does (for example, see the KD,PicS & KD,NO3S values in Table 3).

3.5. Δφeq Dependences of LogKM/ML and LogKex±

The logKM/ML, defined as log([ML+]org/[M+][L]org) [8], can be resolved as follows and calculated from logKex± − logKD,A.
logKM/ML = logKD,M + logKML,org = 16.90Δφeq + logKD,MS·KML,org
at 298 K with
logKD,M = (F/2.303RTφeq + logKD,MS
Here, the term of log(KD,MSKML,org) has to be a constant, because these two equilibrium constants are independent of Δφeq; logKML,org = −(F/2.303RT) (standard formal potential of the ML+ formation in the org phase) [8]. The magnitude of the KM/ML (or KM/MLS) value shows an incorporation-ability into the org phase of L against M+. Then, the plot of logKM/ML versus Δφeq based on Equation (10) can yield a straight line with the slope of 17 V−1 and the intercept of logKD,MSKML,org.
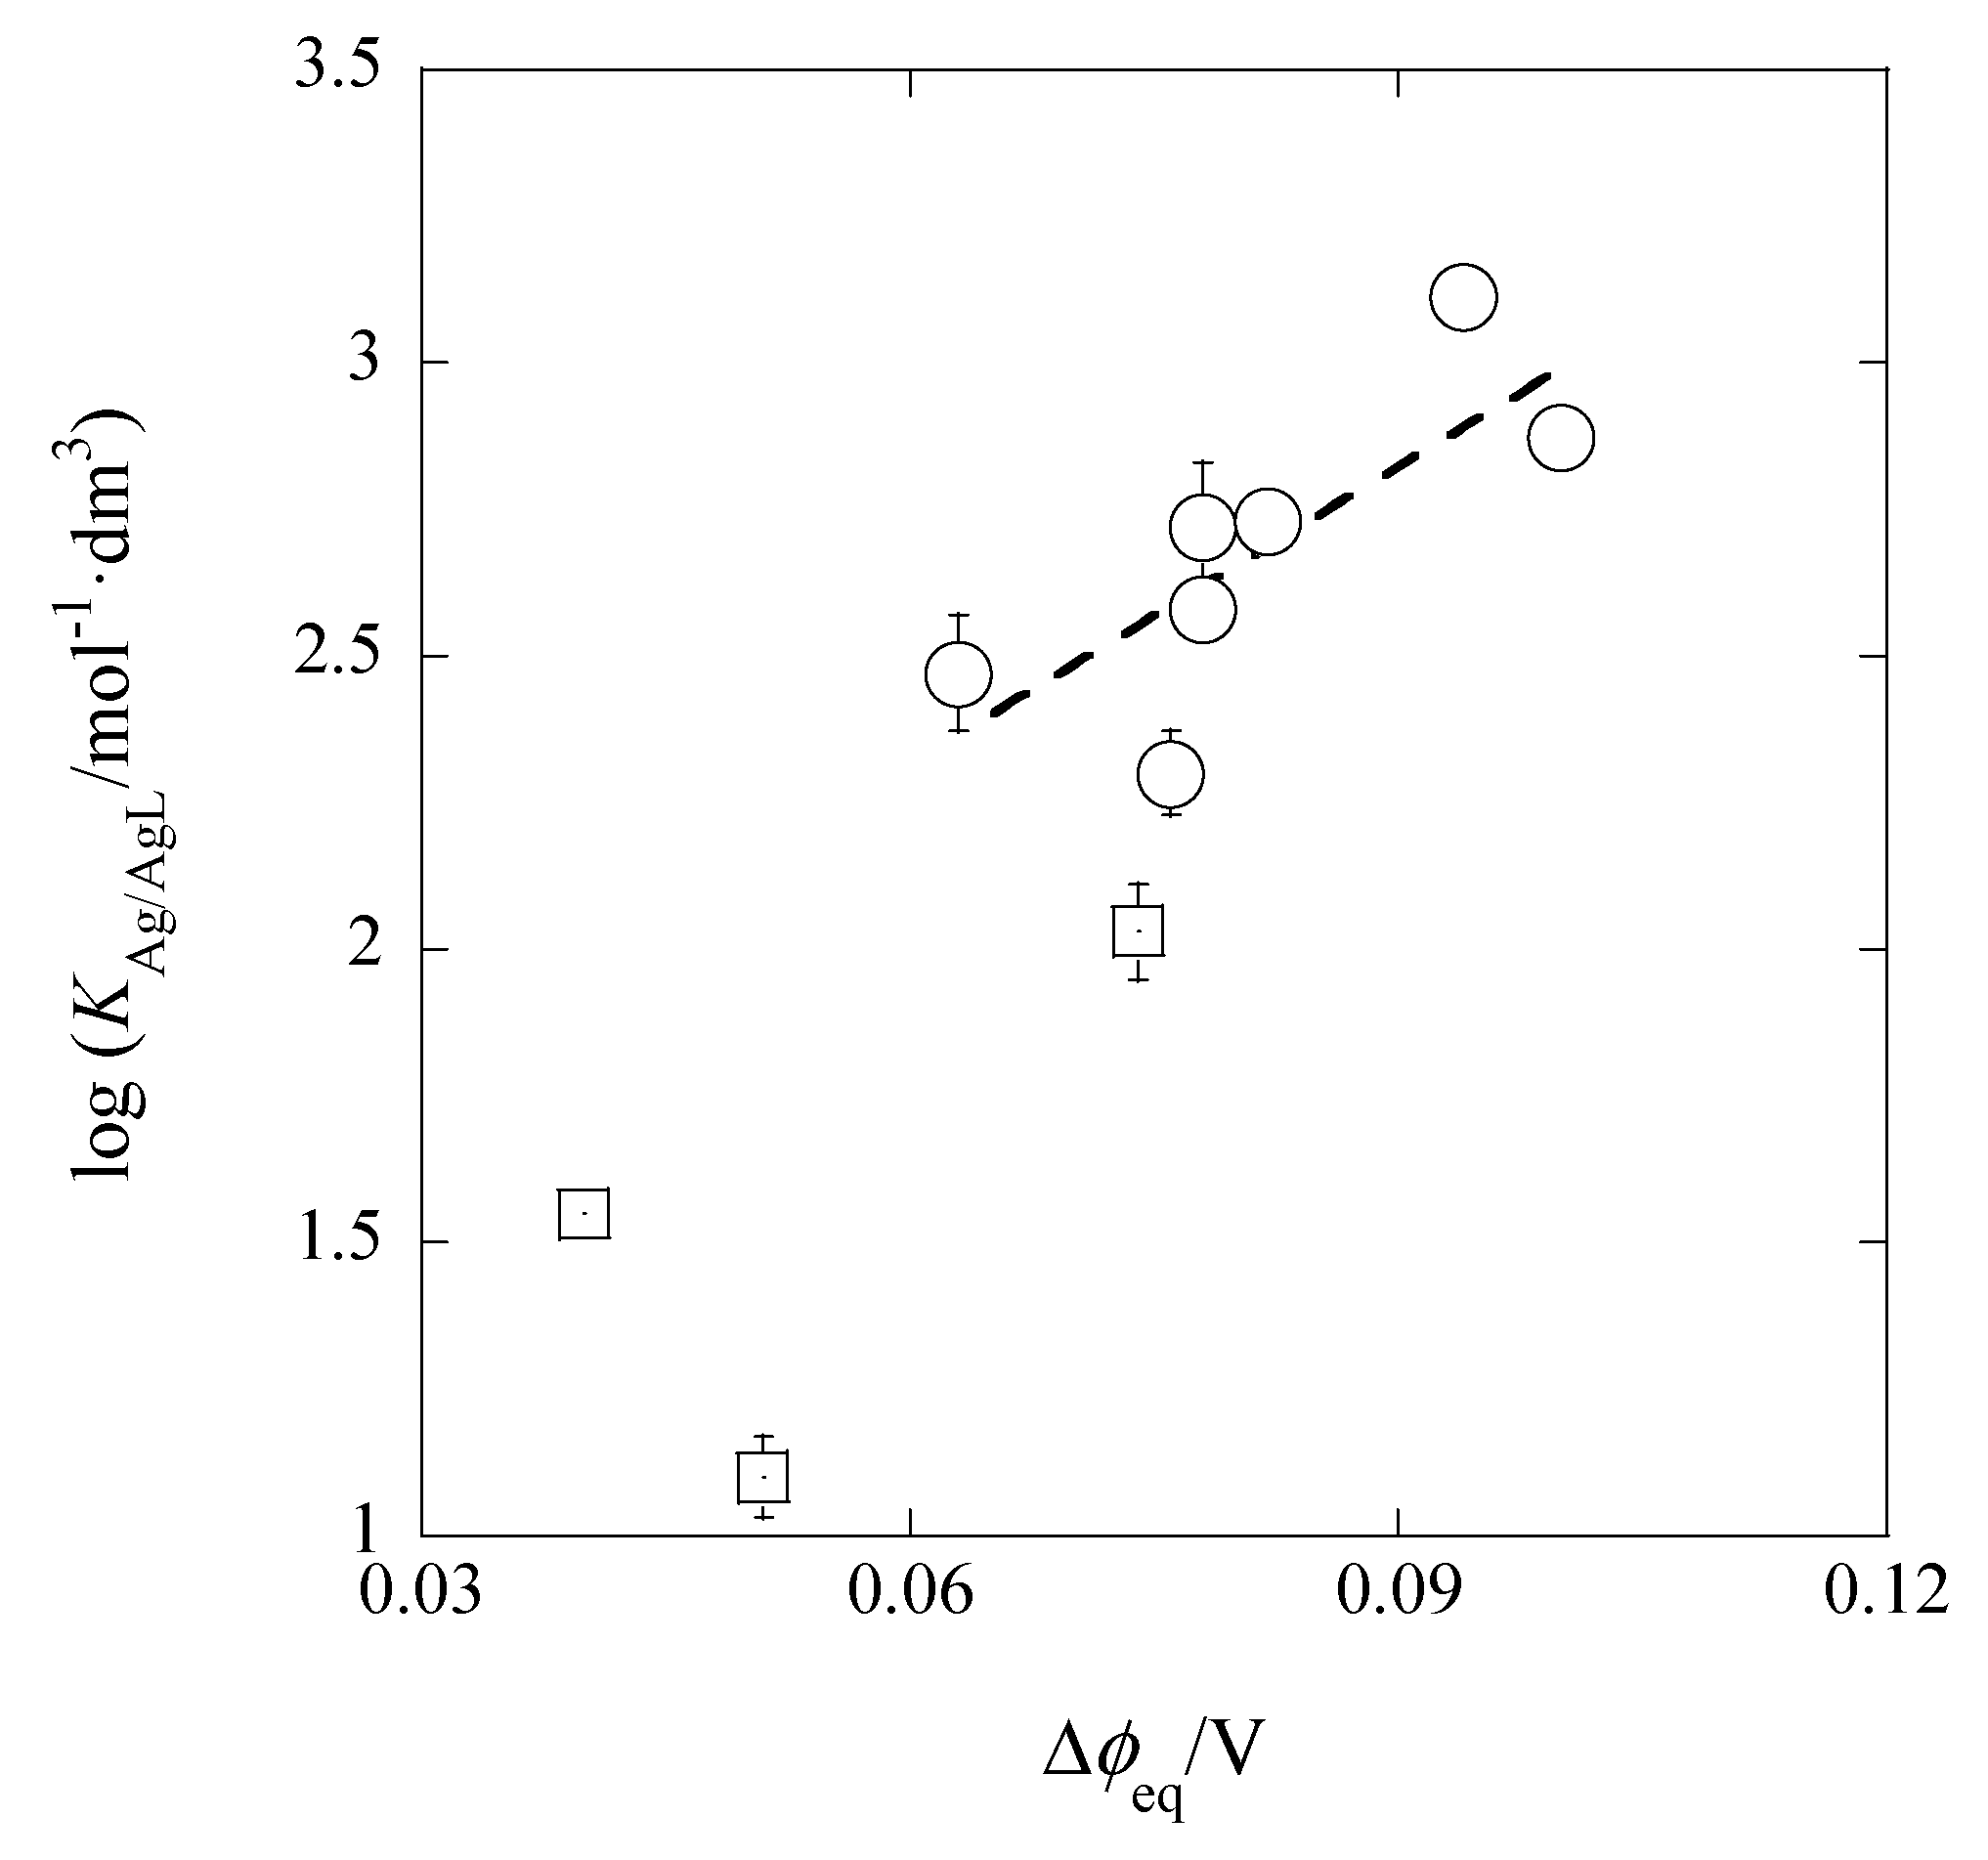
Figure 10 shows its plot, of which the experimental regression line was logKM/ML = (16.8 ± 6.1)Δφeq,Pic + (1.30 ± 0.50) at r = 0.775 and N = 7. Here, the three data (the squares in Figure 10) were neglected from the calculation of the line, because their I values were much larger than the values of the extraction systems without the presence of excess HNO3 in the w phase (see Table 1 and Table 2). The Δφeq,Pic values show the Δφeq ones obtained from the experimental logKD,Pic values. The predictable intercept value was calculated to be 1.30 (= logKD,AgS + logKAgB18C6,DCE = −6.47 + 7.77) ± 0.25, being in accord with the experimental value. Similarly, the slope value was in good agreement with its theoretical one (= 17). These facts indicate that the Δφeq,Pic values essentially correspond to the Δφeq ones in logKD,Ag {see Equation (10a)}. In other words, the relation of logKAg/AgB18C6 = (slope) × Δφeq,Pic + logKD,AgS·KAgB18C6,DCE is satisfied.
A plot of logKex± versus Δφeq for the A = Pic, ClO4, and NO3 systems also gave a regression line with a slope of 19.3 ± 2.0 V−1 and an intercept of −1.23 ± 0.18 at r = 0.974 and N = 7 in the narrow I range (see Table 1 for their basic data). This slope was very close to the theoretical value (= 17). As similar to the previous results [11], these results indicate that the plot satisfies the relation of logKex± = 16.90Δφeq + logKD,A + logKD,AgS·KAgB18C6,DCE (= 16.90Δφeq + logKD,A + 1.30). The (logKD,A + 1.3) term corresponds to the intercept [11] within ±0.3 at least.

3.6. Evaluation of LogKex± Based on LogKD,AS

Using the logKM/MLS and logKD,AS values, we can immediately evaluate the logKex± value as follows. A thermodynamic cycle gives
logKex± = logKM/MLS + logKD,AS = logKM/ML + logKD,A
by using Equations (10a) and (4). It is difficult to accurately determine the KD,MS {or KD,Mφeq): the function of Δφeq, see Equation (10a)} and KML,org values. On the other hand, it is comparatively easy to determine the KM/MLS value. So, if the logKM/MLS {or logKM/MLφeq)} value is determined for given ML+ and diluent, then the logKex± values can be calculated from Equation (11) with the logKD,AS {or logKD,Aφeq)} ones. In this study, we determined the logKAg/AgLS value to be 1.30 from the data (see Table 1) of the AgPic-B18C6 extraction systems with DCE. Calculated logKex± values for some A are listed in Table 3, together with several experimental values.
The determination of the Kex± values will be experimentally difficult for the Cl to I extraction systems, because of the precipitation [18] of their silver salts. The same is true of the SCN extraction system, because of its low solubility product (= 1.0 × 10⁻¹² mol2·dm−6 [18]) against Ag+ in water. Also, AgN3, which is a white insoluble crystal, is explosive [19]. Therefore, the experimental Kex± values were determined at 298 K for the ClO4 and NO3 extraction systems (see Table 1). Considering the differences (0.03–0.26) between the logKD,AS values at a fixed A in Table 3 and the standard deviation (= 0.3) of the logKAg/AgB18C6S value, these experimentally-obtained logKex± values are very close to the values evaluated here.
Similar results were obtained for the NaA-B18C6 extraction into DCE. Their logKex± values evaluated from logKNa/NaB18C6S = 0.53, which were calculated here, were −2.8 for A = MnO4 and −2.3 for ClO4. Their experimental logKex± values were −2.23 [13] at I = 0.0077 mol·dm−3 for MnO4 and −3.65 ± 0.07 at 0.074 for ClO4 of which the value was re-calculated from the data reported before [8]. These differences, ≤ ∣1.4∣, between the evaluated and experimental values were larger than those for the AgA-B18C6 extraction systems.
The above fact indicates that the logKex± values can be evaluated from a sum of the logKAg/AgB18C6S and logKD,AS (or logKAg/AgB18C6 & logKD,A) ones. Namely, the order, A = NO3 < ClO4 << Pic, in logKex± for a given extraction system at fixed AgB18C6+ and DCE is fundamentally predicted from that of logKD,AS (see Table 3). Thus, for the systems where the extraction experiments are difficult, the present procedure becomes easy to evaluate the log
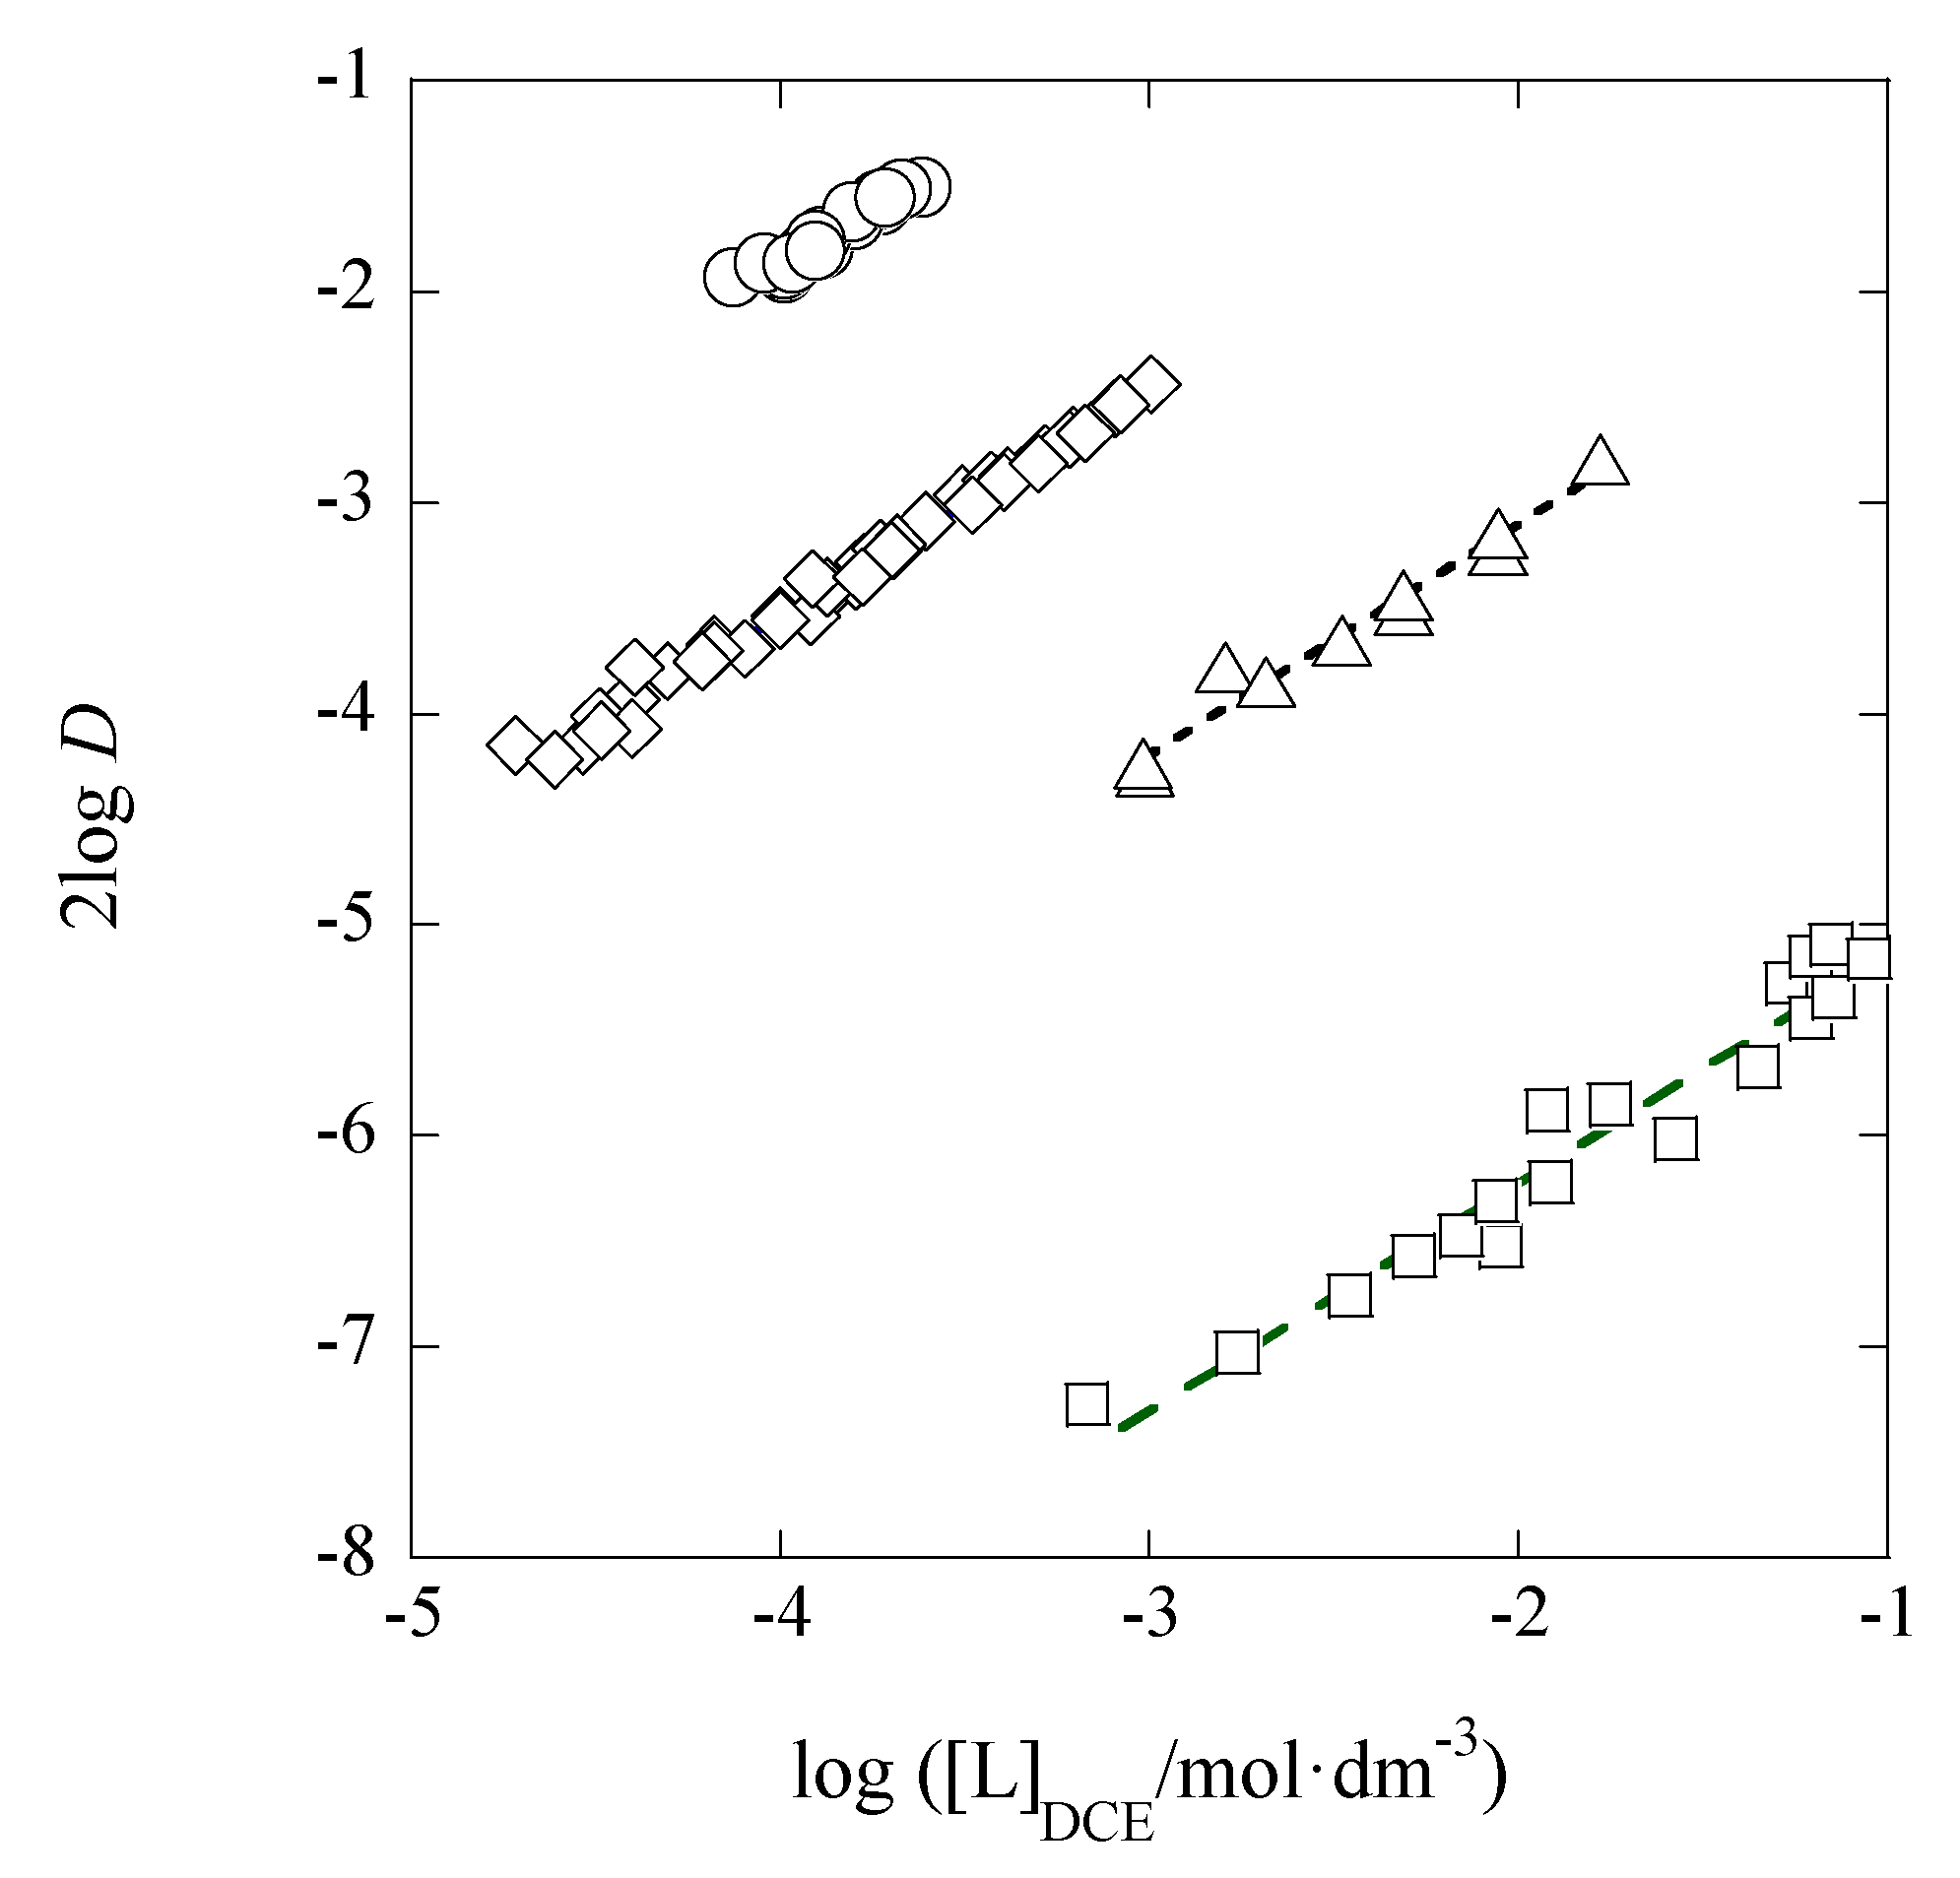
Kex± values. Also, the experimental intercepts (≈ logKex± [13]) of the straight lines in Figure 2 support this order: the intercepts were −4.05 for A = NO3, −0.92 for ClO4, and 2.20 for Pic.

4. Materials and Methods

4.1. Materials

An aqueous solution of a commercial Ba(OH)2·8H2O (≥98%, Wako Pure Chemical Industries, Tokyo, Japan) and a solution with 2 equivalents of HPic·nH2O (≥99.5%, Wako Pure Chemical Industries, Tokyo, Japan) were mixed, that of Ag2SO4 (≥99.5%, Kanto Chemicals Co. Ltd., Tokyo, Japan) was added in the mixture, and immediately BaSO4 precipitated. After standing the mixture overnight, the thus-obtained yellow solution with the precipitate was filtered and then its filtrate was evaporated by a rotary evaporator (type RE1-N, Iwaki, Japan) in order to deposit a fine yellow crystal. The crystal obtained was filtered and dried in vacuo for 21 h. Found: 97.29% for Ag by the AAS measurements at 328.1 nm; 101% for Pic by spectrophotometric measurements at 355.0 nm. An amount of water in the AgPic crystal was not detected by a Karl-Fischer titration. This crystal was employed only for the AgPic extraction experiments without B18C6.
Concentrations of the aqueous solution with AgNO3 (≥99.8%, Kanto Chemicals Co. Ltd., Tokyo, Japan) and that with AgClO4 (97%, Aldrich, Missouri, MO, USA) were determined by a precipitation titration with NaCl (99.98% ± 0.01%, Wako: standard reagent for volumetric analysis, Wako Pure Chemical Industries, Tokyo, Japan). A commercial DCE (guaranteed-pure reagent, Kanto Chemicals Co. Ltd., Tokyo, Japan) was treated with the same procedure as that described previously [13,16]. All other chemicals used in this study were of guaranteed-pure reagent grade.

4.2. Extraction Experiments

Procedures for both the AgPic extraction experiments and the AgA extraction ones with B18C6 into DCE were essentially the same as those [8,20] reported before. The latter experiments were performed by using mixtures of AgNO
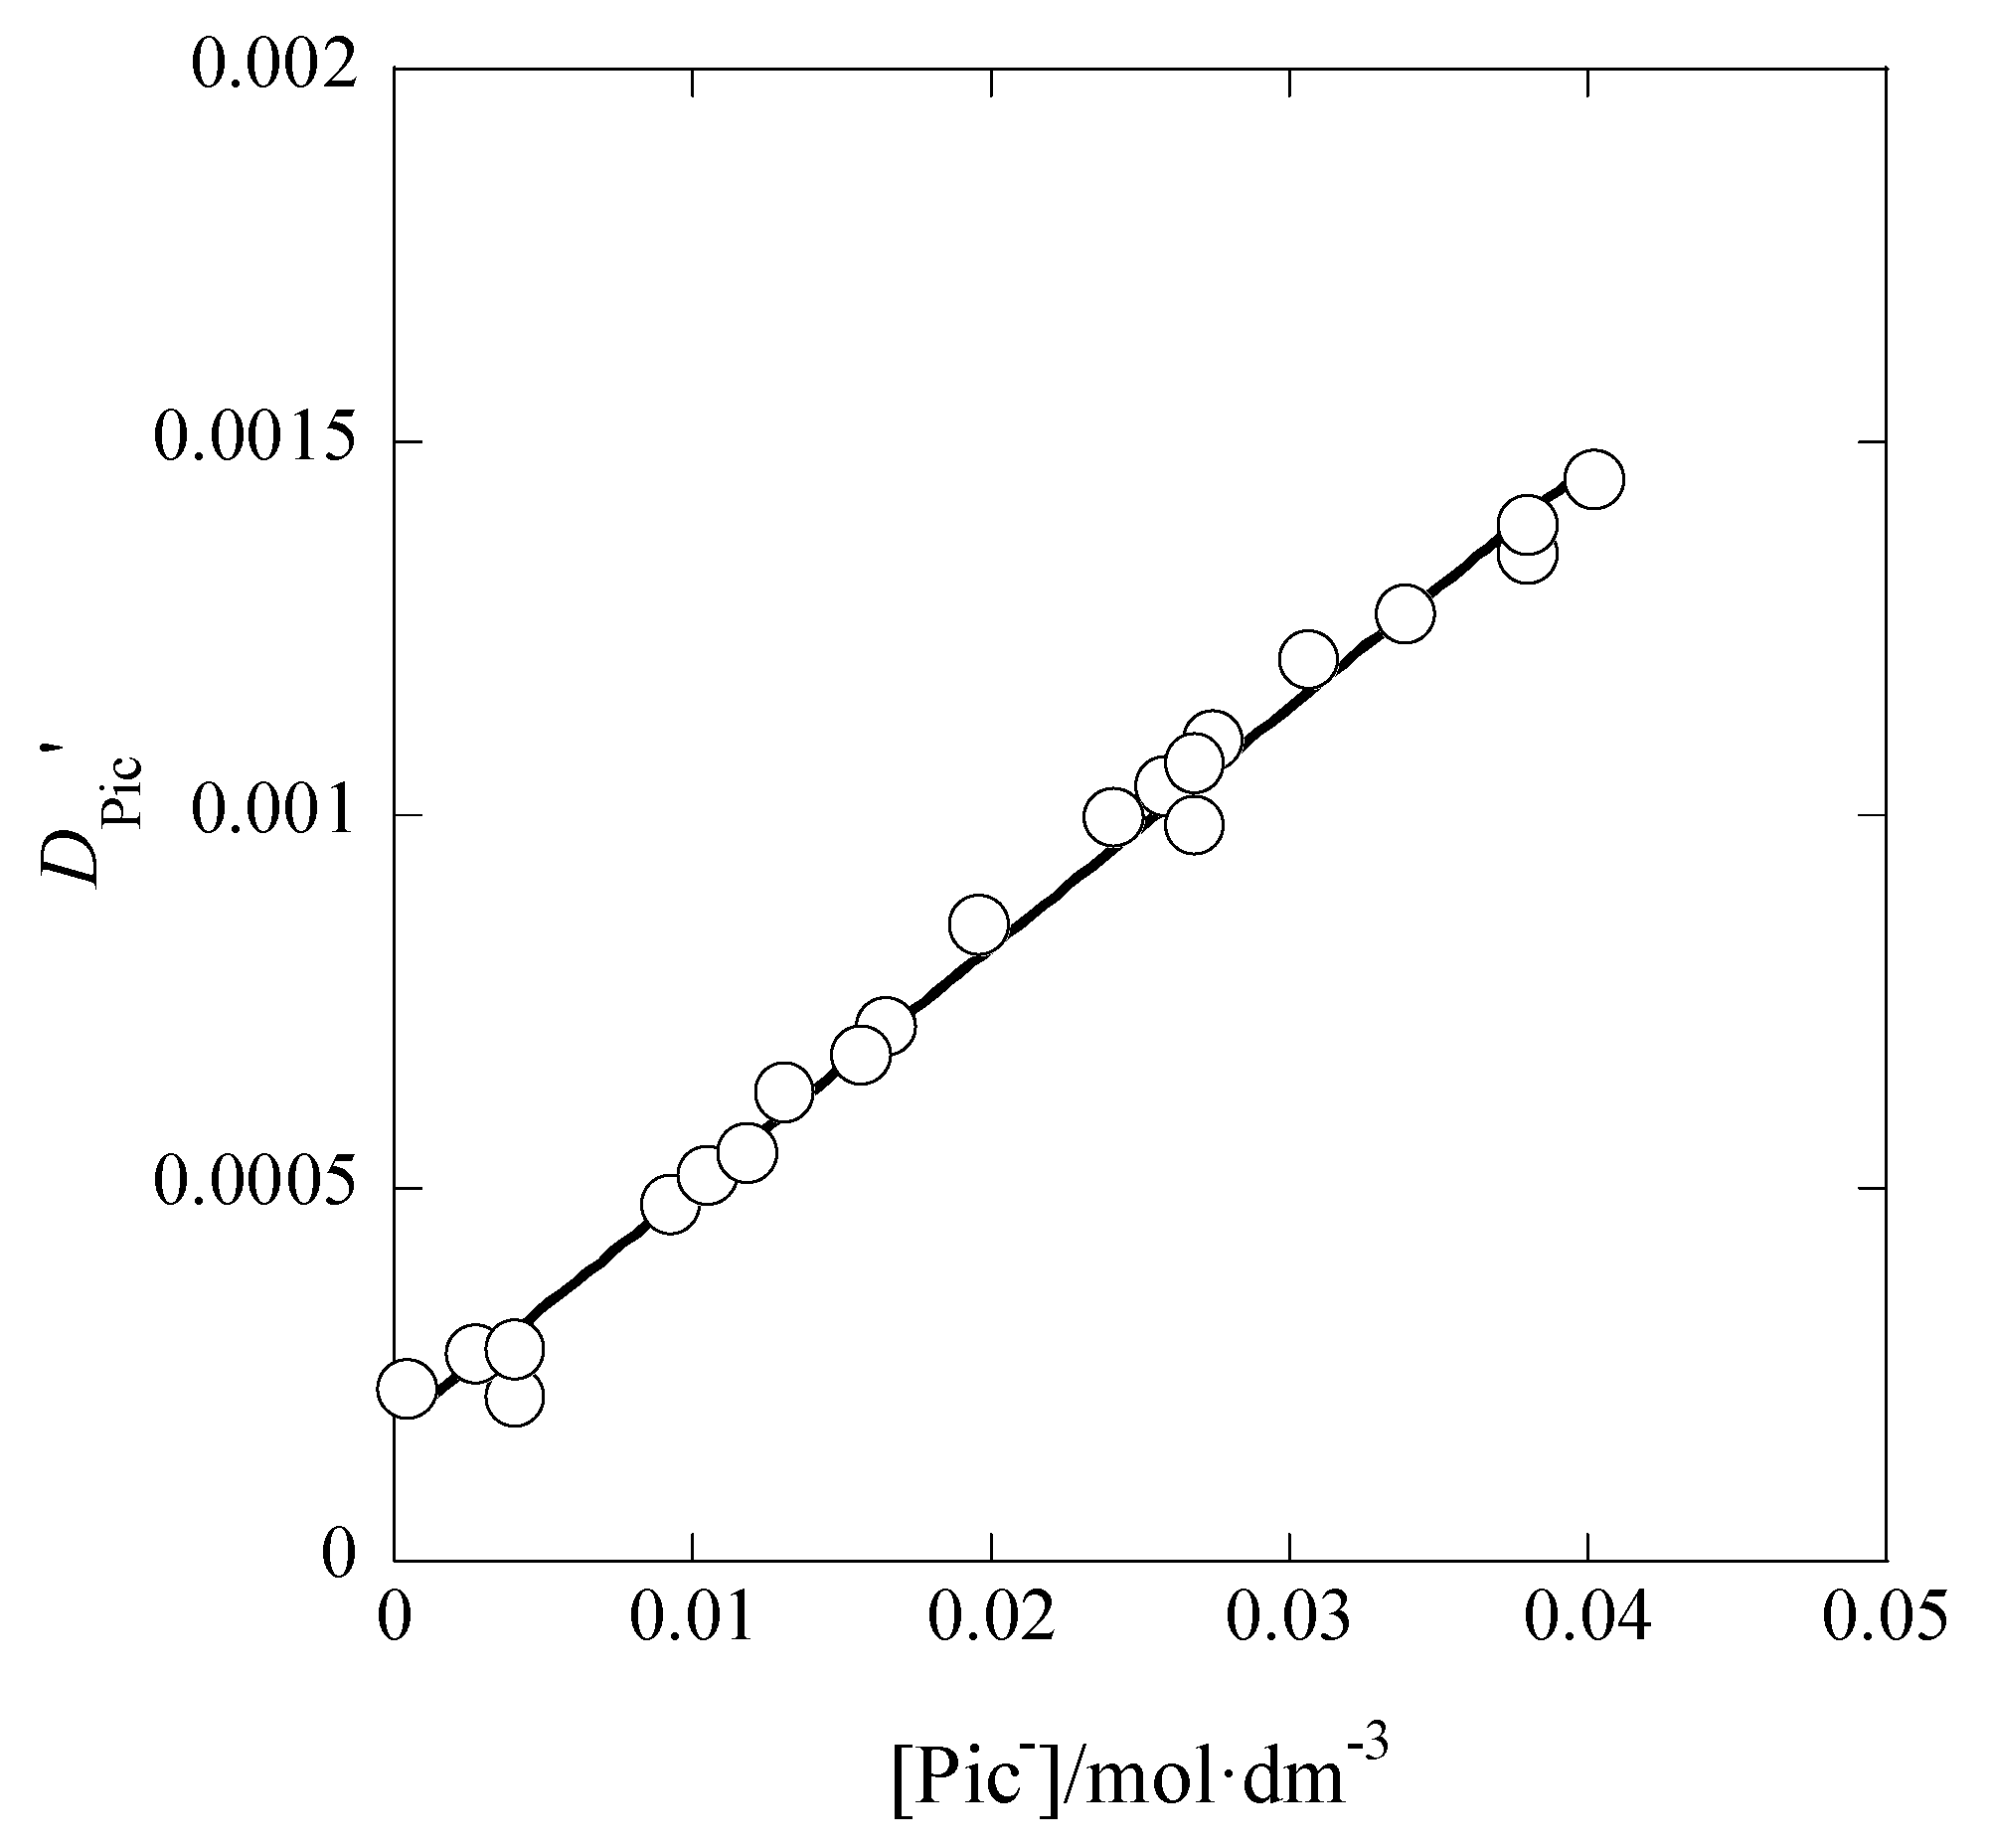
3 with HPic in the w phases. The total concentration range of Ag(I) was 0.00041 to 0.043 mol·dm−3 for the AgPic extraction and the ranges of AgNO3, HPic, and B18C6 were (1.5 or 5.0) × 10−4, (3.3 or 3.4) × 10−3, and (0.4–7.5) × 10−4 mol·dm−3, respectively, for the Ag(I) extraction with B18C6. The extraction of AgB18C6+ with NO3 or Ag(B18C6)NO3 was negligible, compared with that of AgB18C6+ with Pic or Ag(B18C6)Pic (see Figure 2 or the logKex± and logKex values in Table 1). After the extraction operations, the w phases were in the pH ranges of 2.68–2.74 at the system of I = 0.0025 mol·dm−3 and 2.70–3.37 at that of 0.0031 (see Table 1).
For the AgPic extraction by B18C6 into DCE in the presence of “excess HNO3“ in the w phases, the total concentrations of AgNO3 and HPic were fixed at 1.5 × 10⁻⁴ and 0.0033 or 0.0034 mol·dm−3, respectively. Under this condition, the total concentration, [HNO3]t, of HNO3 in the w phase was changed in the range of 0.025 to 0.25 mol·dm−3. After the extraction operations, the w phases were in the pH ranges of 1.64 and 1.65 at [HNO3]t = 0.025 mol·dm−3, 1.34–1.38 at 0.050, 1.06 at 0.10, and 0.62–0.68 at 0.25.
Used apparatus, such as the atomic absorption spectrophotometer, UV-V, centrifuge, mechanical shaker, and pH meter with the glass electrode, were the same as those [8,16] described previously.

5. Conclusions

The I or IDCE dependences of the logKex± and logKex values for the present extraction systems were clarified experimentally. Their experimental equations were logKex = 5.3 – 2×0.51 I / ( 1 + 44 I ) and logKex± = 0.6 − 2×2.0 { I / ( 1 + I ) 0.3 I } = −0.5 + 2×116 I DCE . However, the magnitudes of these changes in logKex± or logKex with I or IDCE were insignificant in practical separation. It was also suggested that the style of M(I) employed in the extraction experiments with L, either the simple salt MPic or the mixture of MX with HPic and excess HX, largely control whether the logKD,Pic values are dependent on the log(IDCE/I ) ones or not. The logKex±-versus-Δφeq plot for the Pic, ClO4, and NO3 systems yielded the good positive correlation. On the basis of the plot of logKAg/AgB18C6 versus Δφeq,Pic, it was indirectly proved that the Δφeq values obtained from the KD,Pic ones is common to those from the KD,Ag values. Moreover, the logKex± values were predicted from the sum of the logKD,AS and logKAg/AgB18C6S ones for given MB18C6+ and DCE at least. At the same time, the order in Kex± reflected that in KD,AS.

Author Contributions

Yoshihiro Kudo and Satoshi Ikeda conceived and designed the experiments; Saya Morioka, Shuntaro Tomokata, and Satoshi Ikeda performed the experiments; Yoshihiro Kudo and Satoshi Ikeda analyzed the data; Yoshihiro Kudo wrote the paper.

Conflicts of Interest

The authors declare no conflict of interest.

Appendix A

The extraction of AgX by L into the org phase was analyzed at X = ClO4 or NO3, L = B18C6, and org = DCE as follows. The component equilibria constituting the overall extraction equilibrium,
Ag+ + Lorg + X ⇌ AgLXorg or AgL+org + Xorg,
were considered to be
L ⇌ Lorg (the symbol of the equilibrium constant: KD,L),
Ag+ + L + X ⇌ AgL+ + X (KAgL),
Ag+org + Lorg ⇌ AgL+org (KAgL,org),
and
AgL+org + Xorg ⇌ AgLXorg (K1,org)
From the reactions (A2)–(A4), the following equilibria, Ag+ Ag+org (KD,Ag), X Xorg (KD,X), and AgL+ AgL+org (KD,AgL), necessarily appear in the component equilibria. Apparently, these three distribution constants are the conditional distribution ones (see the Introduction). The mass balance equations based on the processes (A1)–(A4) became
[Ag]t = [Ag+] + [AgL+] + [Ag+]org + [AgL+]org + [AgLX]org,
[L]t = [L] + [AgL+] + [L]org + [AgL+]org + [AgLX]org,
and
[X]t = [X] + [X]org + [AgLX]org
(= [X] + [Ag+]org + [AgL+]org + [AgLX]org, based on a charge balance equation).
Rearranging these three equations for [Ag]t, [L]t, and [X]t, we can obtain easily
[ Ag + ] = [ Ag ] t A b 1 + K AgL [ L ]  
[ L ] org K D , L ( [ L ] t A b ) 1 + K D , L + K AgL [ Ag + ]  
and
[X] (= I) = [X]tAb
Here, KAgL, Ab, and KD,L denote the complex formation constant (mol−1·dm3) for AgL+ in water, the analytical concentration (= [Ag+]org + [AgL+]org + [AgLX]org) of Ag(I) in the org phase, and the distribution constant of L into the org phase, respectively. Especially, the Ab values were directly determined in terms of AAS measurements. Also, the Iorg value can be expressed as ([Ag+]org + [AgL+]org + [X]org)/2 = [X]org. In Equation (A6), the Ab term was approximately expressed as [AgL+]org + [AgLX]org (>> [Ag+]org). Using Equations (A5) and (A6), we determined the [Ag+] and [L]org values by the successive approximation computation [2,13,21] and then obtained Kexmix values from the relation of
Kexmix = Ab/([Ag+][L]org[X])
After the above handlings, we determined the KD,A and Kex± values, together with the Kex value(s), by the plots (see Section 2.3) reported before [7,8,11,13]. The above extraction model can be essentially applied for systems with another diluent, M(I), or L.

References

  1. Danesi, P.R.; Meider-Gorican, H.; Chiarizia, R.; Scibona, G. Extraction selectivity of organic solutions of a cyclic polyether with respect to the alkali cations. J. Inorg. Nucl. Chem. 1975, 37, 1479–1483. [Google Scholar] [CrossRef]
  2. Takeda, Y. Extraction of alkali metal picrates with 18-crown-6, benzo-18-crown-6, and dibenzo-18-crown-6 into various organic solvents. Elucidation of fundamental equilibria governing the extraction-ability and -selectivity. Bunseki Kagaku 2002, 51, 515–525. [Google Scholar] [CrossRef]
  3. Jawaid, M.; Ingman, F. Ion-pair extraction of Na+, K+, and Ca2+ with some organic counter-ions and dicyclohexyl-18-crown-6 as adduct-forming reagents. Talanta 1978, 25, 91–95. [Google Scholar] [CrossRef]
  4. Kikuchi, Y.; Sakamoto, Y. Complex formation of alkali metal ions with 18-crown-6 and its derivatives in 1,2-dichloroethane. Anal. Chim. Acta 2000, 403, 325–332. [Google Scholar] [CrossRef]
  5. Kudo, Y.; Takeuchi, T. On the interfacial potential differences for the extraction of alkaline-earth metal picrates by 18-crown-6 ether derivatives into nitrobenzene. J. Thermodyn. Catal. 2014, 5. [Google Scholar] [CrossRef]
  6. Kudo, Y.; Katsuta, S. On an expression of extraction constants without the interfacial equilibrium-potential differences for the extraction of univalent and divalent metal picrates by crown ethers into 1,2-dichloroethane and nitrobenzene. Am. J. Anal. Chem. 2015, 6, 350–363. [Google Scholar] [CrossRef]
  7. Kudo, Y.; Nakamori, T.; Numako, C. Extraction of sodium picrate by 3m-crown-m ether and their monobenzo derivatives (m = 5, 6) into benzene: Estimation of their equilibrium-potential differences at the less-polar diluent/water interface by an extraction method. J. Chem. 2016, 2016. [Google Scholar] [CrossRef]
  8. Kudo, Y.; Ogihara, M.; Katsuta, S. An electrochemical understanding of extraction of silver picrate by benzo-3m-crown-m ethers (m = 5, 6) into 1,2-dichloroethane and nitrobenzene. Am. J. Anal. Chem. 2015, 5, 433–444. [Google Scholar] [CrossRef]
  9. Sladkov, V.; Guillou, V.; Peulon, S.; L′Her, M. Voltammerty of tetraalkylammonium picrates at water/nitrobenzene and water/dichloroethane microinterfaces; influences of distribution phenomena. J. Electroanal. Chem. 2004, 573, 129–138. [Google Scholar]
  10. Kakiuchi, T. Liquid-Liquid Interfaces: Theory and Methods; Volkov, A.G., Deamer, D.W., Eds.; CRC Press: Boca Raton, FL, USA, 1996; Chapter 1. [Google Scholar]
  11. Kudo, Y.; Kaminagayoshi, A.; Ikeda, S.; Yamada, H.; Katsuta, S. Brief determination of standard formal potentials for the transfer of several pairing anions across the nitrobenzene/water interface by Na(I) extraction with 18-crown-6 ether. J. Anal. Bioanal. Tech. 2016, 7. [Google Scholar] [CrossRef]
  12. Kudo, Y.; Harashima, K.; Hiyoshi, K.; Takagi, J.; Katsuta, S.; Takeda, Y. Extraction of some univalent salts into 1,2-dichloroethane and nitrobenzene: Analysis of overall extraction equilibrium based on elucidating ion-pair formation and evaluation of standard potentials for ion transfer at the interfaces between their diluents and water. Anal. Sci. 2011, 27, 913–919. [Google Scholar] [PubMed]
  13. Kudo, Y.; Harashima, K.; Katsuta, S.; Takeda, Y. Solvent extraction of sodium permanganate by mono-benzo 3m-crown-m ethers (m = 5, 6) into 1,2-dichloroethane and nitrobenzene: A method which analyzes the extraction system with the polar diluents. Inter. J. Chem. 2011, 3, 99–107. [Google Scholar] [CrossRef]
  14. De Levie, R. Oxford Chemistry Primers: Aqueous Acid-Base Equilibria and Titrations; Oxford University Press: Oxford, UK, 1999. [Google Scholar]
  15. Kielland, J. Individual activity coefficients of ions in aqueous solutions. J. Am. Chem. Soc. 1937, 59, 1675–1678. [Google Scholar] [CrossRef]
  16. Kudo, Y.; Takahashi, Y.; Numako, C.; Katsuta, S. Extraction of lead picrate by 18-crown-6 ether into various diluents: Examples of sub-analysis of overall extraction equilibrium based on component equilibria. J. Mol. Liq. 2014, 194, 121–129. [Google Scholar] [CrossRef]
  17. Czapkiewicz, J.; Czapkiewicz-Tutaj, B. Relative scale of free energy of transfer of anions from water to 1,2-dichloroethane. J. Chem. Soc. Faraday Trans. 1980, 76, 1663–1668. [Google Scholar] [CrossRef]
  18. Gristian, G.D. Analytical Chemistry, 5th ed.; John Wiley & Sons, Inc.: New York, NY, USA, 1994. [Google Scholar]
  19. Cotton, F.A.; Wilkinson, G. Advanced Inorganic Chemistry: A Comprehensive Text, 4th ed.; John Wiley & Sons, Inc.: New York, NY, USA, 1980. [Google Scholar]
  20. Kudo, Y.; Usami, J.; Katsuta, S.; Takeda, Y. Solvent extraction of silver picrate by 3m-crown-m ethers (m = 5, 6) and its mono-benzo-derivatives from water to benzene or chloroform: Elucidation of an extraction equilibrium using component equilibrium constants. Talanta 2004, 62, 701–706. [Google Scholar] [CrossRef] [PubMed]
  21. Takeda, Y.; Yasui, A.; Morita, M.; Katsuta, S. Extraction of sodium and potassium perchlorates with benzo-18-crown-6 into various organic solvents. Quantitative elucidation of anion effects on the extraction-ability and -selectivity for Na+ and K+. Talanta 2002, 56, 505–513. [Google Scholar] [CrossRef]
Figure 1. A plot of DPic′ vs. [Pic] for the AgPic extraction into 1,2-dichloroethane (DCE). The straight line was DPic′ = (1.81 × 10⁻⁴){1 + (1.81 × 10⁻⁴)(9.81 × 10⁵)[Pic]} at r (correlation coefficient) = 0.996.
Inorganics 05 00042 g001
Figure 2. Plots of 2logD vs. log[L]DCE for the AgPic (circle: without excess HNO3; diamond: 0.05 mol·dm−3 HNO3 in the w phase), AgClO4 (triangle), and AgNO3 (square) extraction with B18C6 (= L) into DCE.
Inorganics 05 00042 g002
Figure 3. A plot of logKexmix vs. −log([Ag+][L]DCE) for the AgClO4 extraction with B18C6 (= L) into DCE. The regression line was logKexmix = log{9.7 × 10² + (7.4 × 10⁻³)/([Ag+][L]DCE)} at r = 0.891.
Inorganics 05 00042 g003
Figure 4. A plot of logKexmix vs. −(1/2)logP for the AgClO4 extraction with B18C6 (= L) into DCE. The regression line was logKexmix = log(2.5 × 10² + 0.057 5 / P ) at r = 0.999.
Inorganics 05 00042 g004
Figure 5. A plot of logKex vs. I for the AgPic extraction with B18C6 into DCE. See the text for the regression line (broken line). Error bars were added for only the present experimental values in Figure 5, Figure 6, Figure 7, Figure 8, Figure 9 and Figure 10. There are some cases where the bars were smaller than the points, such as circle and square. Especially, all the bars were smaller than the size of the circles in Figure 5.
Inorganics 05 00042 g005
Figure 6. A plot of logKex± vs. I for the AgPic extraction with B18C6 into DCE. The regression line (broken line) based on the Davies equation was logKex± = 0.596 – 2 × 2.05 { I / ( 1 + I ) 0.3 I } at r = 0.884 and N = 10.
Inorganics 05 00042 g006
Figure 7. A plot of logKex± vs. IDCE for the AgPic extraction with B18C6 into DCE. See the text for the regression line (broken line).
Inorganics 05 00042 g007
Figure 8. A plot of logK1,DCE vs. IDCE for the AgPic extraction with B18C6 into DCE. The regression line was logK1,DCE = 5.89 − 2×(1.52 × 102) I DCE (broken line) at r = 0.821 and N = 10.
Inorganics 05 00042 g008
Figure 9. A plot of logKD,Pic vs. log(IDCE/I ) for the AgPic extraction with B18C6 into DCE. The broken line shows a theoretical one for the slope fixed at unity: see the text. The plots (square) were of the extraction with the excess addition of HNO3 in the w phases.
Inorganics 05 00042 g009
Figure 10. A plot of logKAg/AgL vs. Δφeq for the AgPic extraction with B18C6 (= L) into DCE. See the text for the regression line (broken line).
Inorganics 05 00042 g010
Table 1. Fundamental data for the extraction with AgPic, AgClO4, or AgNO3 (= AgA) and B18C6 (= L) into DCE at 298 K.
A (I 1/10−3)logKex±logKD,A
φeq/V]
logKexlogK1,DCE
(IDCE1/10−5)
logKAgL,DCE
Pic
(2.5)
0.33 ± 0.03−2.40 ± 0.03
[0.082]
5.31 ± 0.034.98 ± 0.05
(0.93)
7.81
(2.7)20.51−2.60 [0.094]5.3364.82 (1.1)7.99 3
(2.8)20.25−2.33 [0.078]5.174.92 (0.40)7.73 3
(3.1)0.40 ± 0.09−2.07 ± 0.05
[0.063]
4.93 ± 0.054.53 ± 0.10
(2.2)
7.88
(3.6) 20.17−2.70 [0.10]5.555.38 (0.64)7.65 3
ClO4
(2.8)
−1.24 ± 0.02−2.13 ± 0.11
[−0.032]
2.99 ± 0.114.23 ± 0.11
(2.1)
8.07
NO3
(3.1)
−4.40 ± 0.07−3.47 ± 0.04
[−0.14]
1.04 ± 0.035.44 ± 0.08
(0.11)
7.98
1 Unit: mol·dm−3; 2 Values in this line were cited from Ref. [6]; 3 Values re-calculated from the relation logKAgL,DCE = logKex± − logKD,AgS·KD,PicS = logKex± + 7.481, since the KD,AgS value was re-determined in this study.
Table 2. Fundamental data for the extraction with AgPic and B18C6 (= L) into DCE in the presence of excess HNO3 in the water phases at 298 K.
I/10−2 mol·dm−3logKex±logKD,Pic
φeq/V]
logKexlogK1,DCE
(IDCE 1/10−6)
logKAgL,DCE
2.40.38 ± 0.10−2.33 ± 0.05
[0.078]
5.35 ± 0.044.97 ± 0.11
(3.0)
7.87
5.00.00 ± 0.06−2.30 ± 0.03
[0.076]
5.41 ± 0.035.41 ± 0.07
(2.0)
7.49
9.7 2−0.13−1.68
[0.040]
5.075.20 (5.5)7.35 3
11−0.23 ± 0.06−2.26 ± 0.02
[0.074]
5.45 ± 0.025.68 ± 0.06
(0.97)
7.26
26−0.78 ± 0.06−1.88 ± 0.03
[0.051]
5.11 ± 0.025.89 ± 0.07
(1.3)
6.70
1 Unit: see I; 2 See the footer 2 in Table 1; 3 See the footer 3 in Table 1.
Table 3. Log Kex± values evaluated from the logKD,AS and logKAg/AgLS values at B18C6 (= L), DCE, and 298 K.
AlogKD,AS 1logKex±
Evaluated 2Experimental
Cl−7.99, −8.135 3−6.69- 4
Br−6.57, −6.74 3−5.27- 4
N3−6.42−5.12- 4
NO3−5.91, −5.94 3−4.61, −4.64 3−4.40
I−4.50, −4.62 3−3.20- 4
SCN−4.21, −4.47 3−2.91- 4
MnO4−3.33−2.03- 5
ClO4−2.84, −3.00 3−1.54, −1.70 3−1.24
Pic− 6−1.01 1- 70.35 ± 0.12 8
−0.36 ± 0.24 9
1 Ref. [12]; 2 Values calculated from logKex± = 1.30 + logKD,AS {see Equation (11)}. They have the error of 0.3 at least because of the standard deviation of logKAg/AgLS; 3 Ref. [17]; 4 Not determinable, probably because of precipitation etc. See the text; 5 Not determined here; 6 The KAg/AgLS value was determined, based on the data of the extraction experiments. See Table 1; 7 Not evaluated; 8 Average value in the I range of (2.5–3.6) × 10−3 mol·dm−3. See Table 1; 9 Value at IDCE → 0. See the text.

