Microstructure and Hydrogen Storage Properties of Ti1V0.9Cr1.1 Alloy with Addition of x wt % Zr (x = 0, 2, 4, 8, and 12)


Hydrogen Research Institute, Université du Québec à Trois-Rivières, 3351 des Forges, Trois-Rivières, QC G9A 5H7, Canada
*
Author to whom correspondence should be addressed.
Inorganics 2017, 5(4), 86; https://0-doi-org.brum.beds.ac.uk/10.3390/inorganics5040086
Submission received: 4 October 2017
/
Revised: 28 November 2017
/
Accepted: 28 November 2017
/
Published: 3 December 2017
(This article belongs to the Special Issue Functional Materials Based on Metal Hydrides)
Abstract
:The effect of adding Zr on microstructure and hydrogen storage properties of BCC Ti1V0.9Cr1.1 synthesized by arc melting was studied. The microstructures of samples with Zr were multiphase with a main BCC phase and secondary Laves phases C15 and C14. The abundance of secondary phases increased with increasing amount of zirconium. We found that addition of Zr greatly enhanced the first hydrogenation kinetics. The addition of 4 wt % of Zr produced fast kinetics and high hydrogen storage capacity. Addition of higher amount of Zr had for effect of decreasing the hydrogen capacity. The reduction in hydrogen capacity might be due to the increased secondary phase abundance. The effect of air exposure was also studied. It was found that, for the sample with 12 wt % of Zr, exposure to the air resulted in appearance of an incubation time in the first hydrogenation and a slight reduction of hydrogen capacity.
1. Introduction
Hydrogen is considered a possible alternative energy carrier in the future. One of the most challenging barriers of using hydrogen is to establish a safe, reliable, compact, and cost-effective means of storing hydrogen [1,2,3,4]. Because of their high volumetric hydrogen capacity, metal hydrides could potentially replace the conventional storage in gaseous or liquid state. Moreover, metal hydrides are, in many respects, safe and cost effective [5,6]. Among the many different metal hydride systems, the Ti-based body-centred cubic (BCC) solid solution alloys are considered to be good candidates for hydrogen storage tanks because of their tunable pressure plateau and safety [7,8,9,10]. However, these alloys suffer from slow and difficult first hydrogenation, the so-called activation step [11]. Different approaches have been taken to overcome this drawback. These include heat treatment [12], addition of Zr7Ni10 [12,13,14,15,16], or Zr [17,18] and by element substitution [19,20]. Another approach was made by Edalati K. et al. [21] who used high-pressure torsion to induce microstructural modification and so enhancing hydrogen storage properties of Ti–V BCC alloys. With respect to Zr7Ni10 addition, the ease of activation may be due to the two-phase microstructure consisting of a main BCC phase and a secondary phase. Recently, Banerjee et al. [22] found that with increasing secondary phase concentration, faster kinetics was obtained but the hydrogen storage capacity was reduced. Moreover, Shashikala et al. [19] noticed that Zr is the element responsible for producing the secondary phase that ensures a rapid reaction with hydrogen and observed that hydrogen absorption capacity was decreased as the Zr content increased due to a greater fraction of Laves phase. In addition, Martinez and Santos found that TiV0.9Cr1.1 alloy with addition of 4 wt % of Zr7Ni10 showed fast hydrogenation kinetics and high capacity (3.6 wt %) [14]. Lately, Bellon et al. showed that by substituting Zr for V in the alloy TiCrV resulted in a two-phase structure made up of a main BCC structure and a less abundant cubic-type Laves phase C15. They concluded that the Laves phase acts as a catalyst for the hydrogenation [17]. In this paper, we report our investigation on the effect of addition of Zr on the microstructure and hydrogen storage properties of Ti1V0.9Cr1.1. Contrary to the work of Bellon et al., in the present investigation zirconium was not substituting for vanadium but instead added to the TiV0.9Cr1.1 composition. By varying the Zr addition from 2 to 12 wt % we aimed to see how the amount of zirconium affect the relative abundance of BCC and Laves phases as well as their composition and the effect on hydrogen storage.
2. Results and Discussion
2.1. Microstructure Analysis
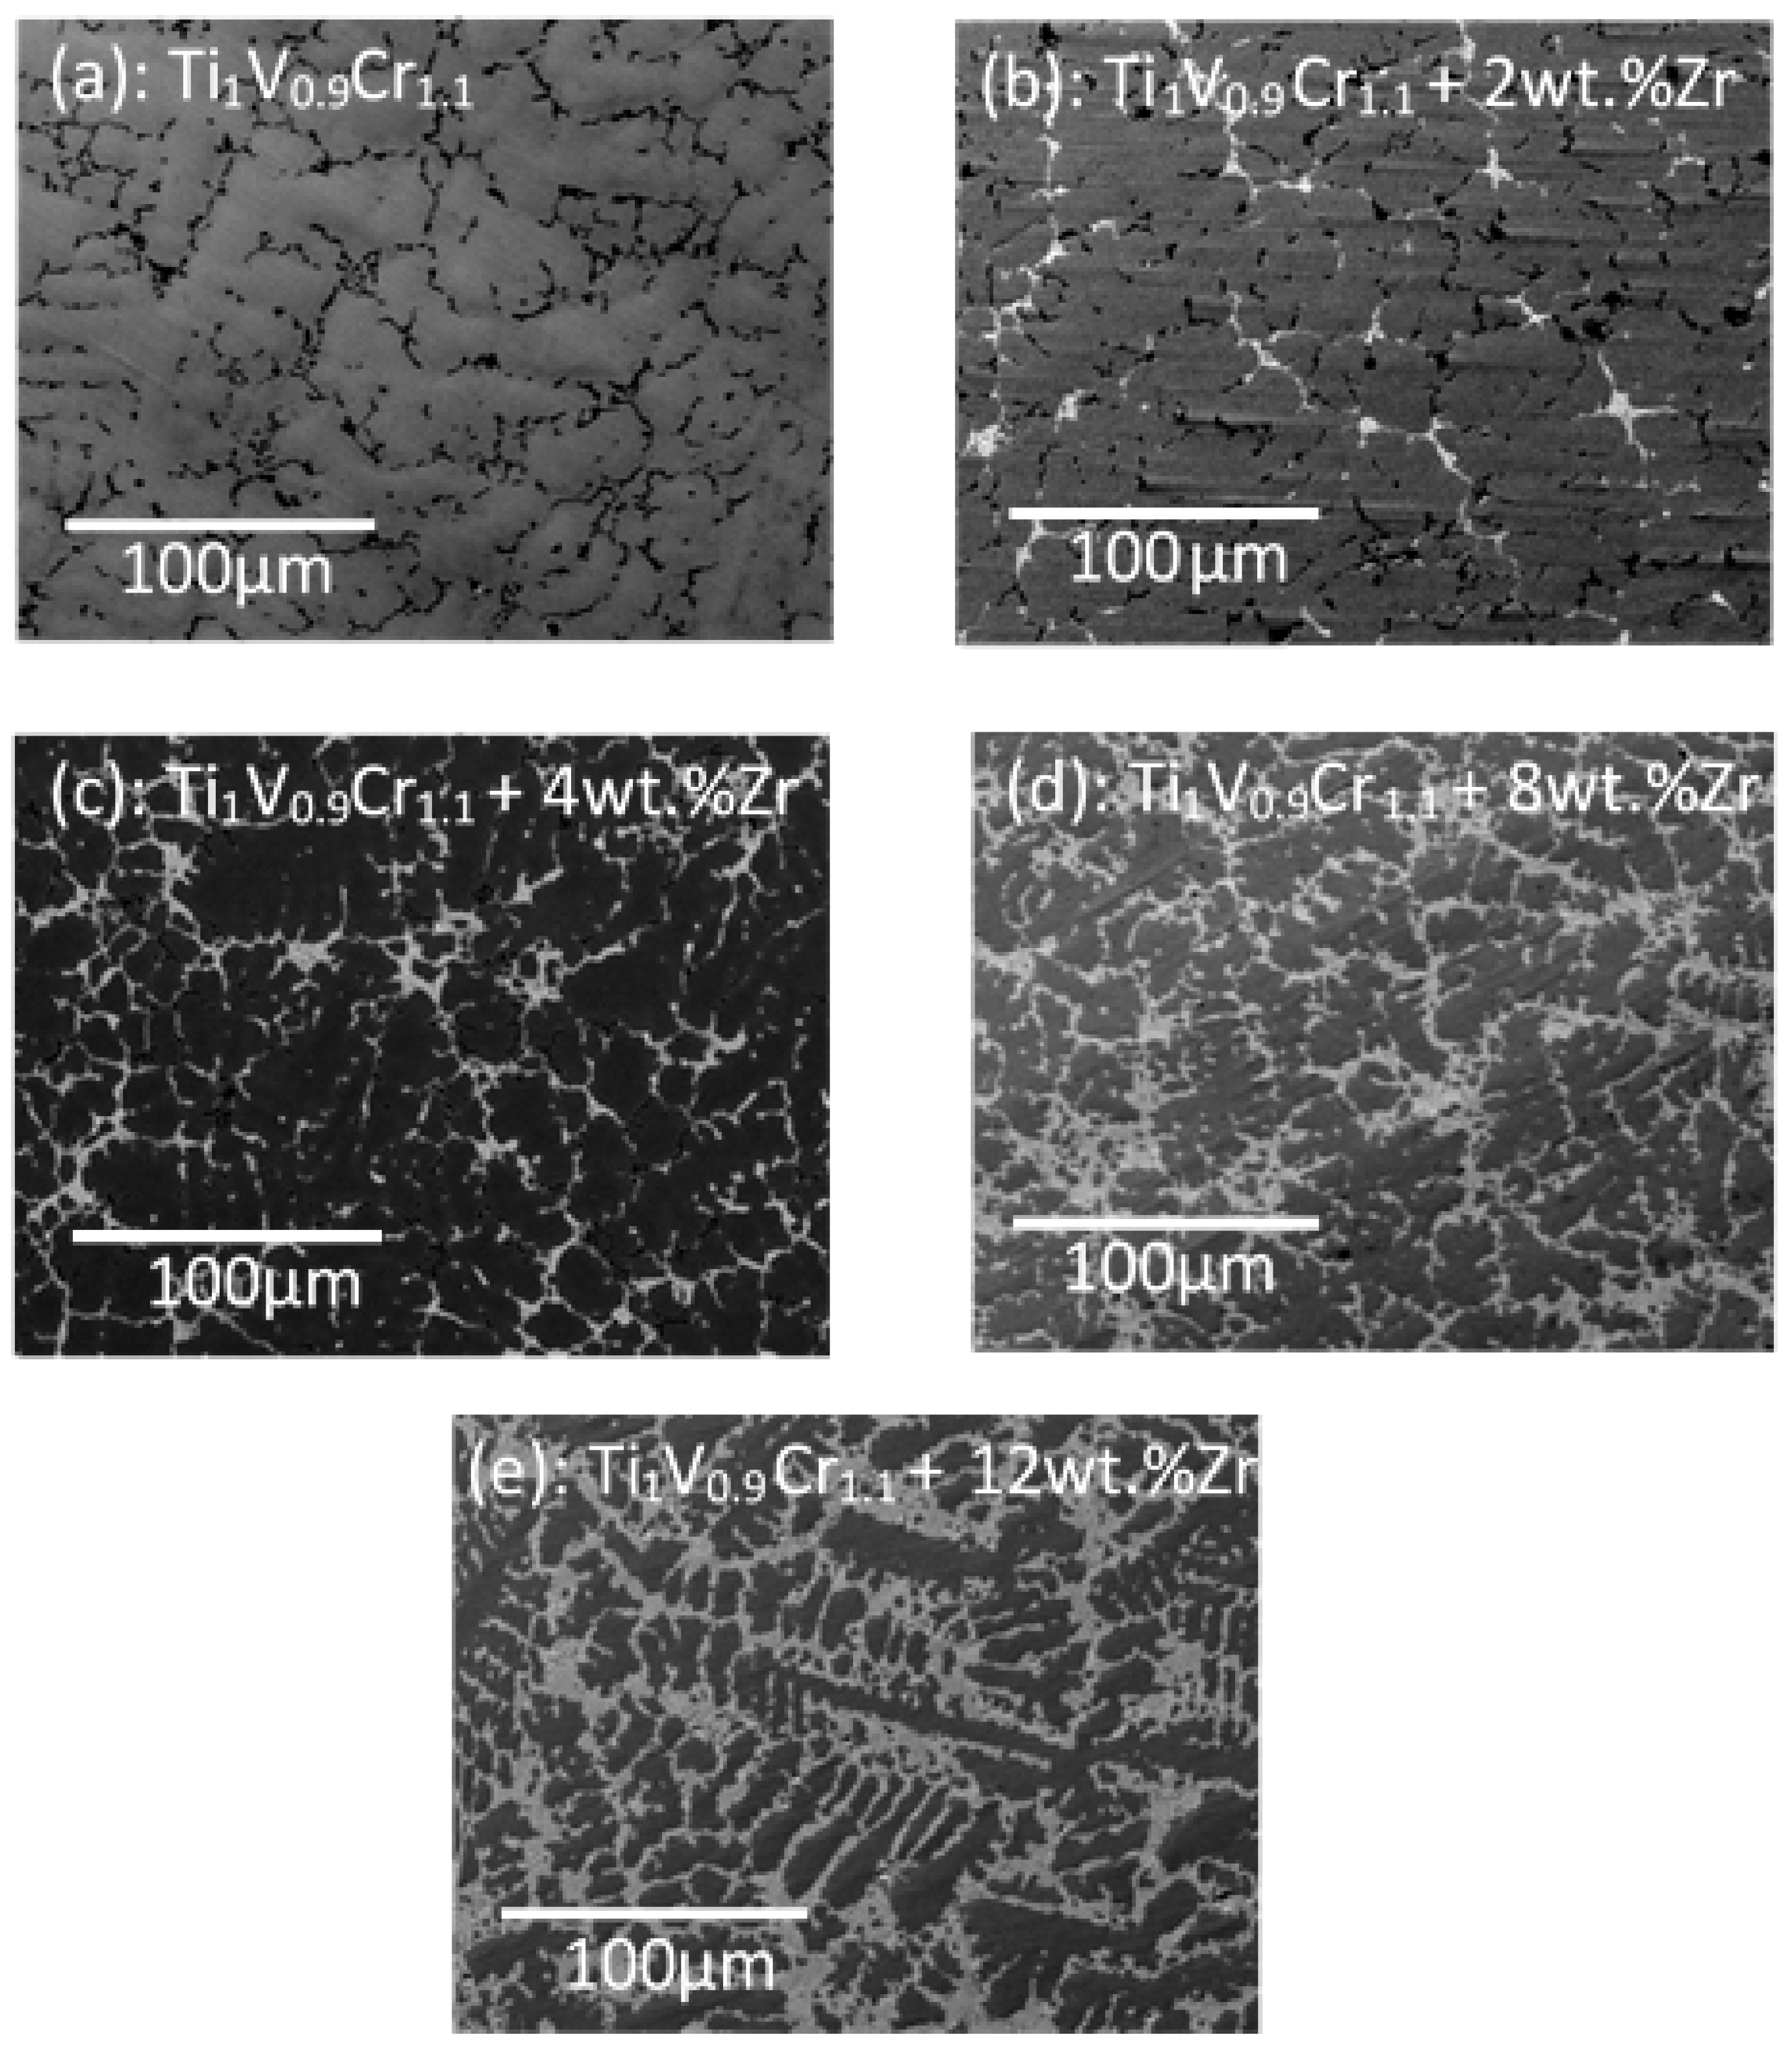
Figure 1 shows the backscattered electron micrographs of Ti1V0.9Cr1.1 + x wt % Zr alloys where x = 0, 2, 4, 8, and 12. It is clear that the microstructure changes with x content. Pure Ti1V0.9Cr1.1 (Figure 1a) shows a network of black areas structure. From EDX analysis these black areas were found to be titanium precipitates. Even with a slight doping of Zr (x = 2), a bright secondary phase appeared. All the modified alloys were found to be multi-phase: a matrix phase and a bright phase. Dendrites appeared from x = 8 and were clearly observed for x = 12. It is seen that more Zr leads to higher secondary phase abundance.
Using Image J software, the bright phase surface areas were measured. The percentage of the bright areas are 0, 4, 12, 26, and 35 respectively for x = 0, 2, 4, 8, and 12. It shows that, as the amount of doped Zr increases, the bright phase surface area is getting bigger. To determine the chemical composition, EDX measurement was performed on all alloys. Table 1 shows the bulk measured atomic abundance compared to the nominal composition for all alloys studied. We see that the bulk measured composition agrees with the nominal one in all cases. This was expected as all these elements have similar melting points.
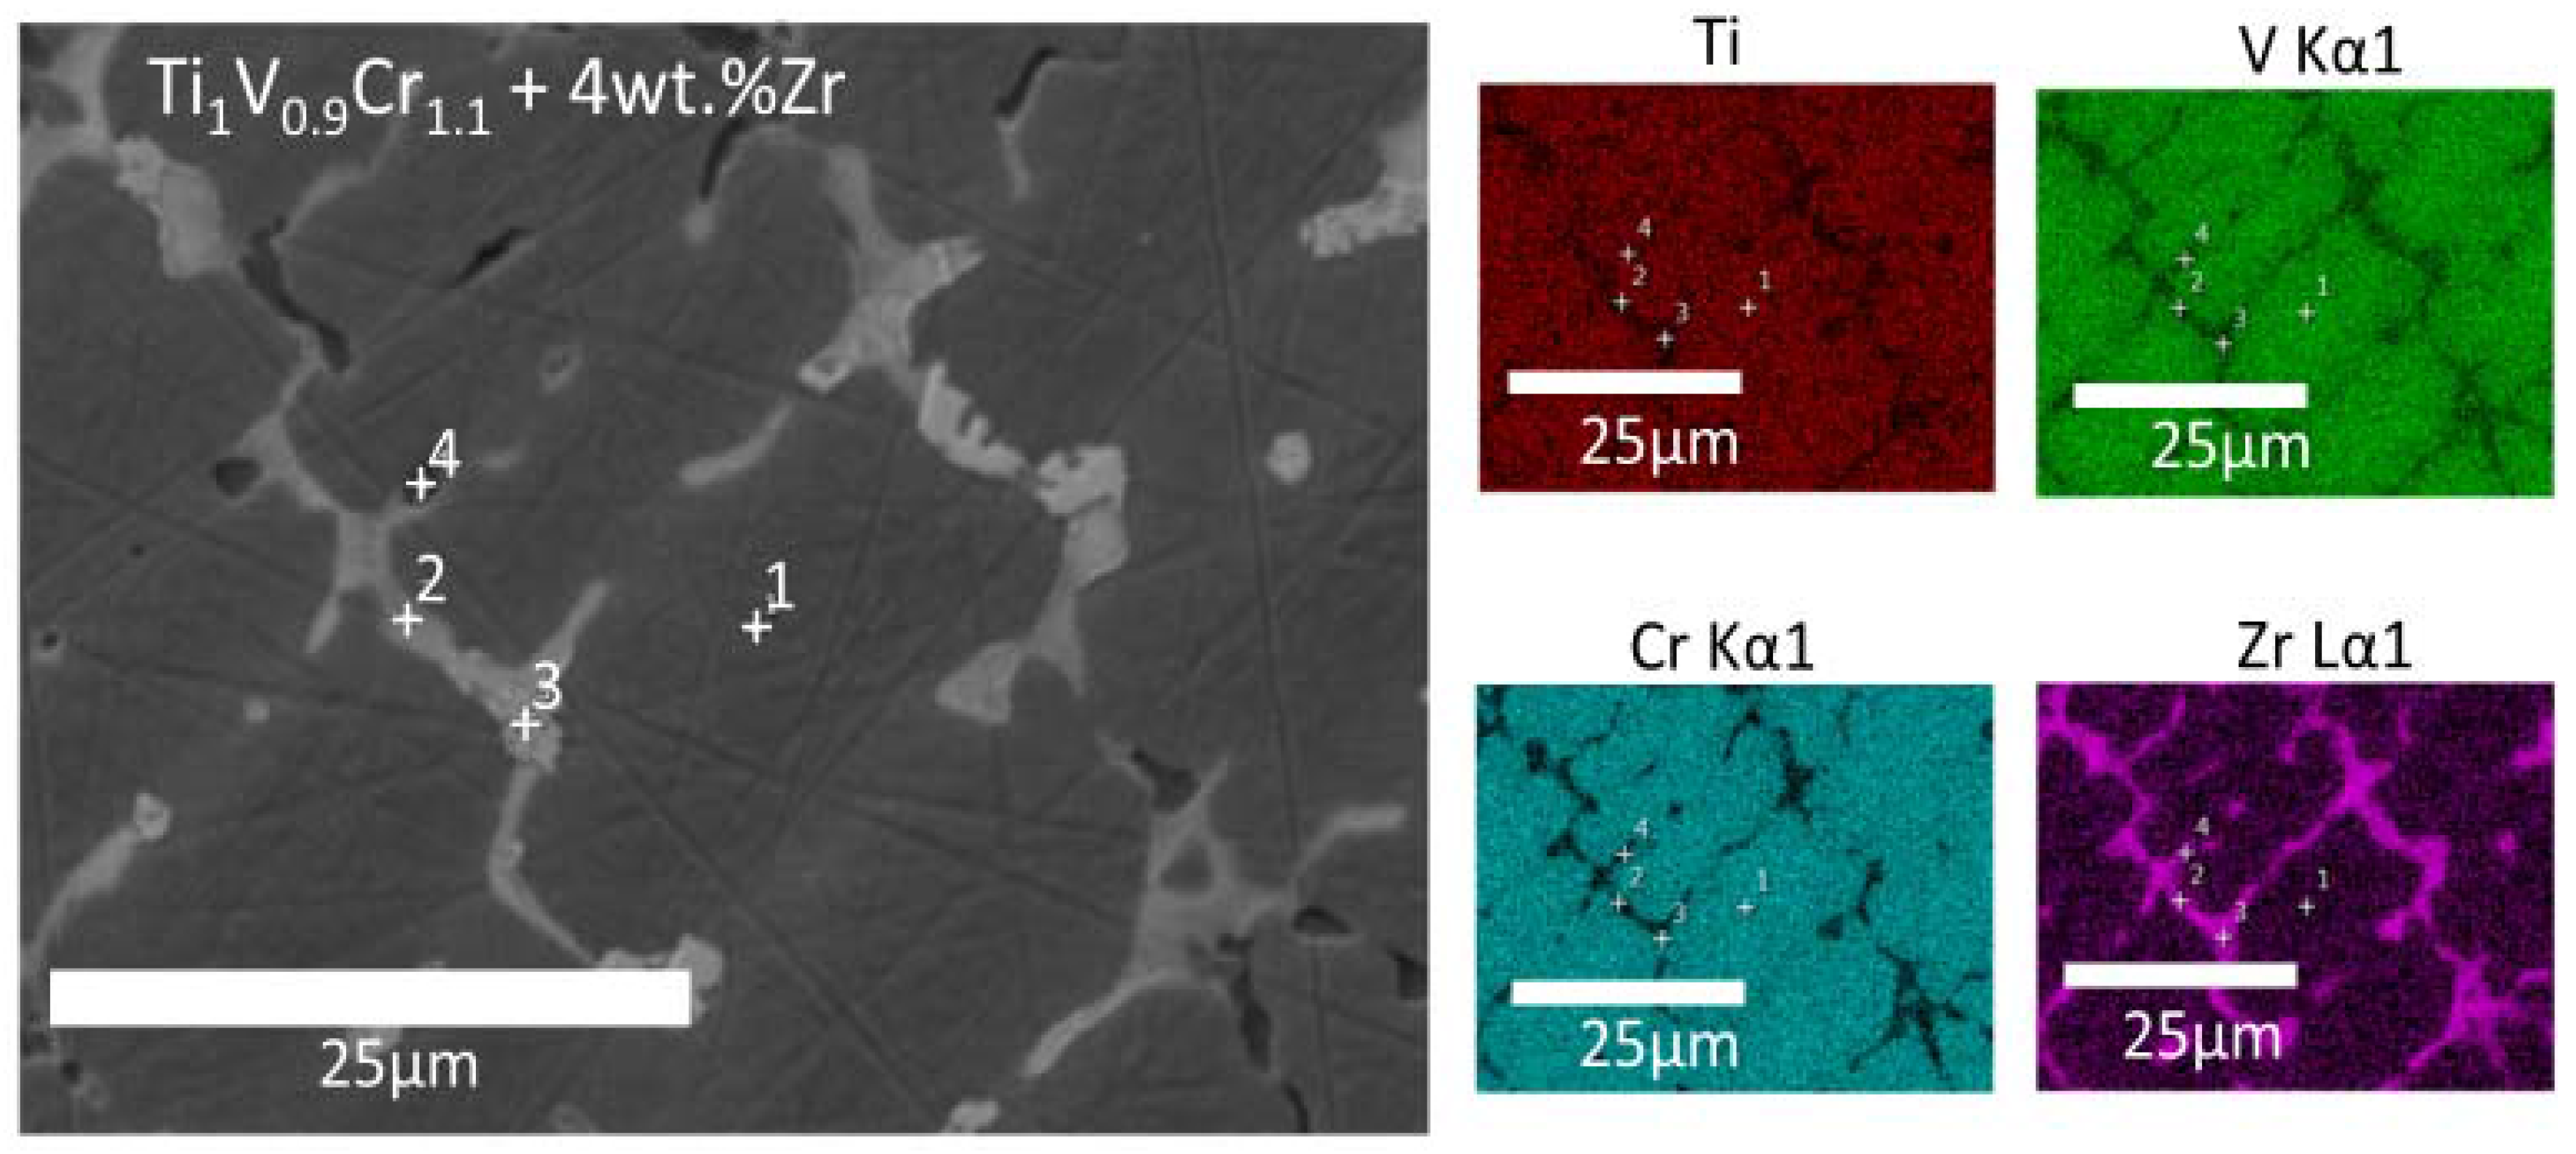
Using EDX, we also measured the atomic composition of each phase for all alloys. In Figure 2a representative of elemental mapping is shown for the compound Ti1V0.9 Cr1.1 + 4 wt % Zr alloy. Similar features were seen for the other alloys.
In these micrographs, specific locations are indicated by numbers. The matrix phase is numbered 1. Close inspection has shown that the bright secondary phase is in fact composed of two phases having different shades of white. Thus, two secondary phases were indexed. They are indicated by point 2 and point 3. Finally, the dark area is identified as point 4. The quantitative analysis at these specific locations are listed in the Table 2, Table 3, Table 4 and Table 5. Table 2 presents the composition of the matrix (point 1) for all alloys.
From Table 2, we see that the matrix is a Ti–V–Cr solid solution with inclusion of only a very small amount of Zr (<1 at %). The matrix composition does not significantly change when more zirconium is added. On average, the atomic composition of the matrix is Ti0.84V1Cr1.2Zr0.03 which is quite different than the nominal value. The main difference is that, compared to the nominal composition, the titanium proportion is reduced, the vanadium amount increased, and the chromium abundance stays almost the same. The zirconium abundance in the matrix is always less than 1 at % which is far from the nominal composition. As the amount of zirconium was very small in the matrix, we expect that zirconium will be mainly confined in the secondary phases. This could be seen in Table 3 and Table 4 which show the atomic composition of the two secondary phases. Secondary phase one (point 2) is rich in Ti and Zr while secondary phase two (point 3) has a relatively high content of the four elements.
From Table 3, we see that the secondary phase 1 (point 2) is close to composition Ti1.9V0.2Cr0.2Zr0.7 for x = 2 or 4 and to composition Ti1.7V0.2Cr0.2Zr0.9 for x = 8 and 12. To our knowledge, there are no quaternary alloys that have stoichiometry close to these. Therefore, this secondary phase may be metastable. It has to be mentioned that, when x is higher than 8 there is a higher proportion of zirconium and lower proportion of titanium while the abundances of the two other elements are constant.
Table 4 shows the composition of secondary phase 2 (point 3). This phase has an almost constant composition Ti1.0V0.4Cr1.1Zr0.5 and also has a high zirconium content but here chromium is the most abundant element. Contrary to secondary phase 1, the relative atomic abundance of this phase does not vary with increasing of x.
Close inspection of Figure 2 also indicates that secondary phase 2 is usually on the edge of the bright surfaces while secondary phase 1 is more in the centre of the bright areas. Thus, it seems that secondary phase 2 is bridging secondary phase 1 with the matrix. Close inspection of Table 3 and Table 4 demonstrates that the chemical composition of the secondary phases slightly changes when x increases. The main characteristics of these phases are however constant. When x increases, secondary phase 1 remains rich in titanium and zirconium with the proportion of titanium slightly decreasing and zirconium increasing. Regarding secondary phase 2, this phase is rich in chromium but also the proportions of zirconium and titanium relatively important. When x increase zirconium content increases, titanium abundance decreases and chromium only slightly decreases. Chemical composition of the black phase (point 4) was measured and the results are reported in Table 5.
It is evident that the black areas are titanium precipitates. The amount of precipitation tends to decrease with increasing Zr content and for 8 and 12 wt % of Zr there are no Ti-precipitates.
2.2. Structural Characterization
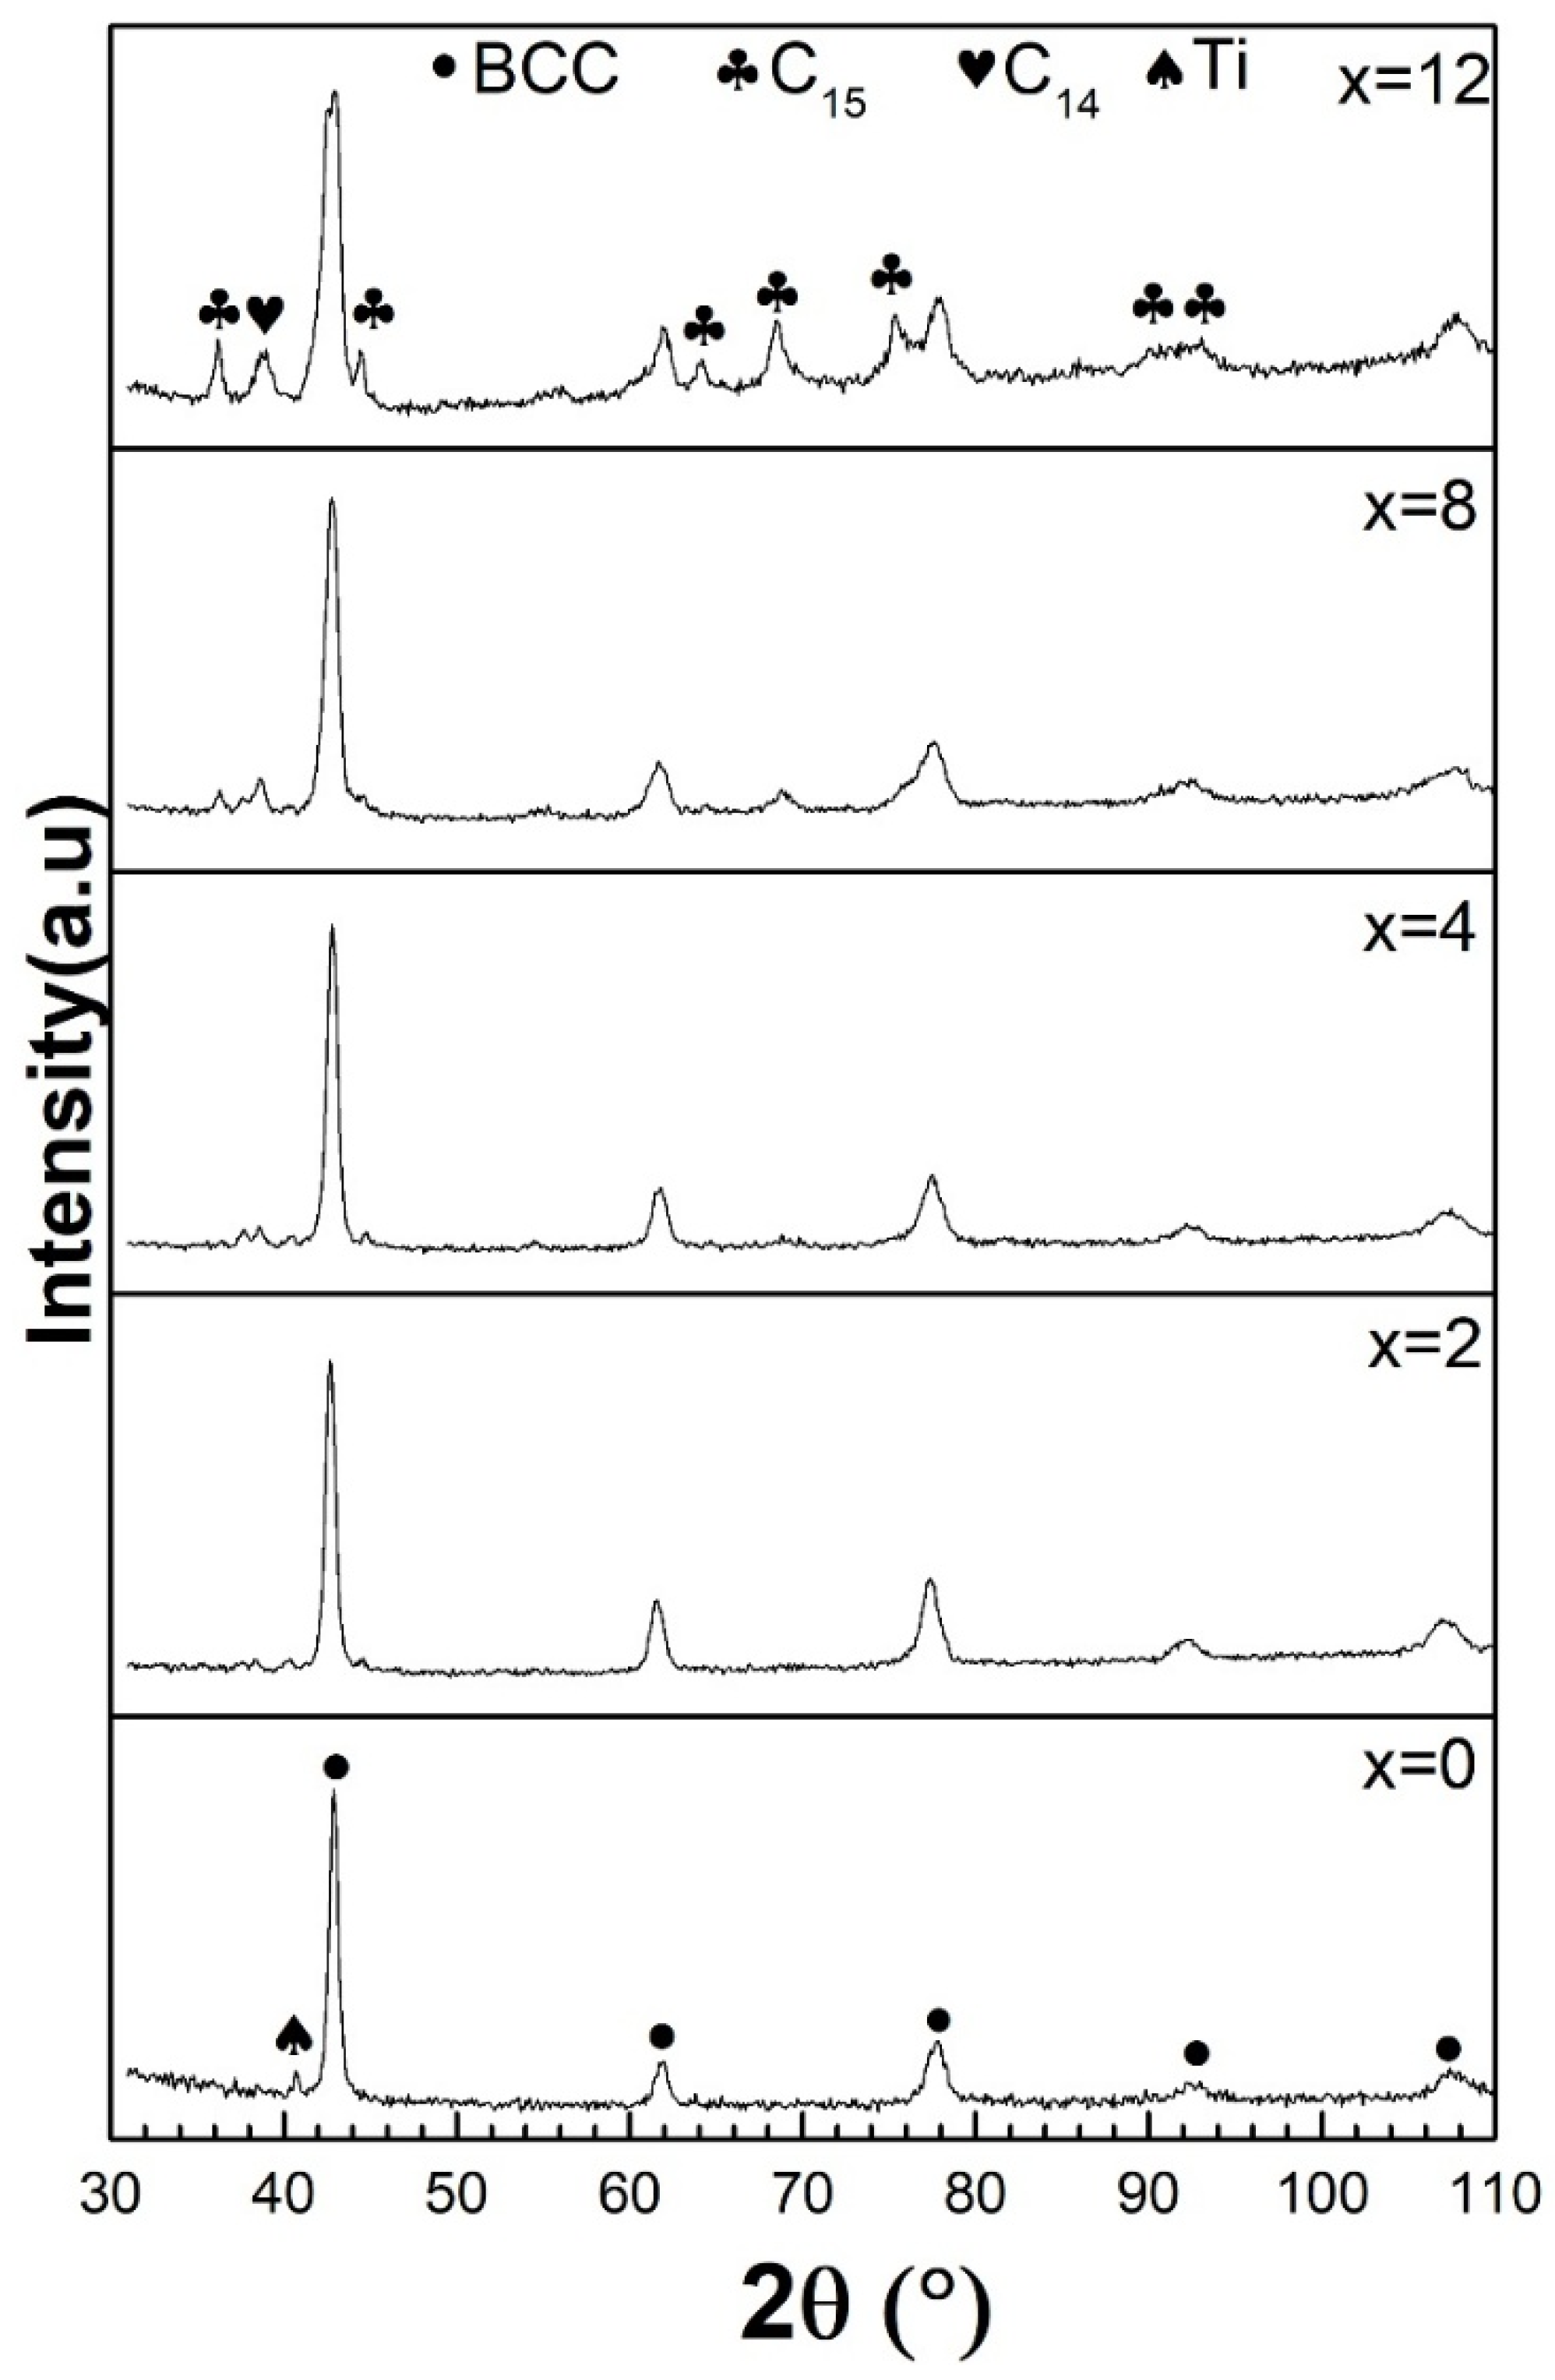
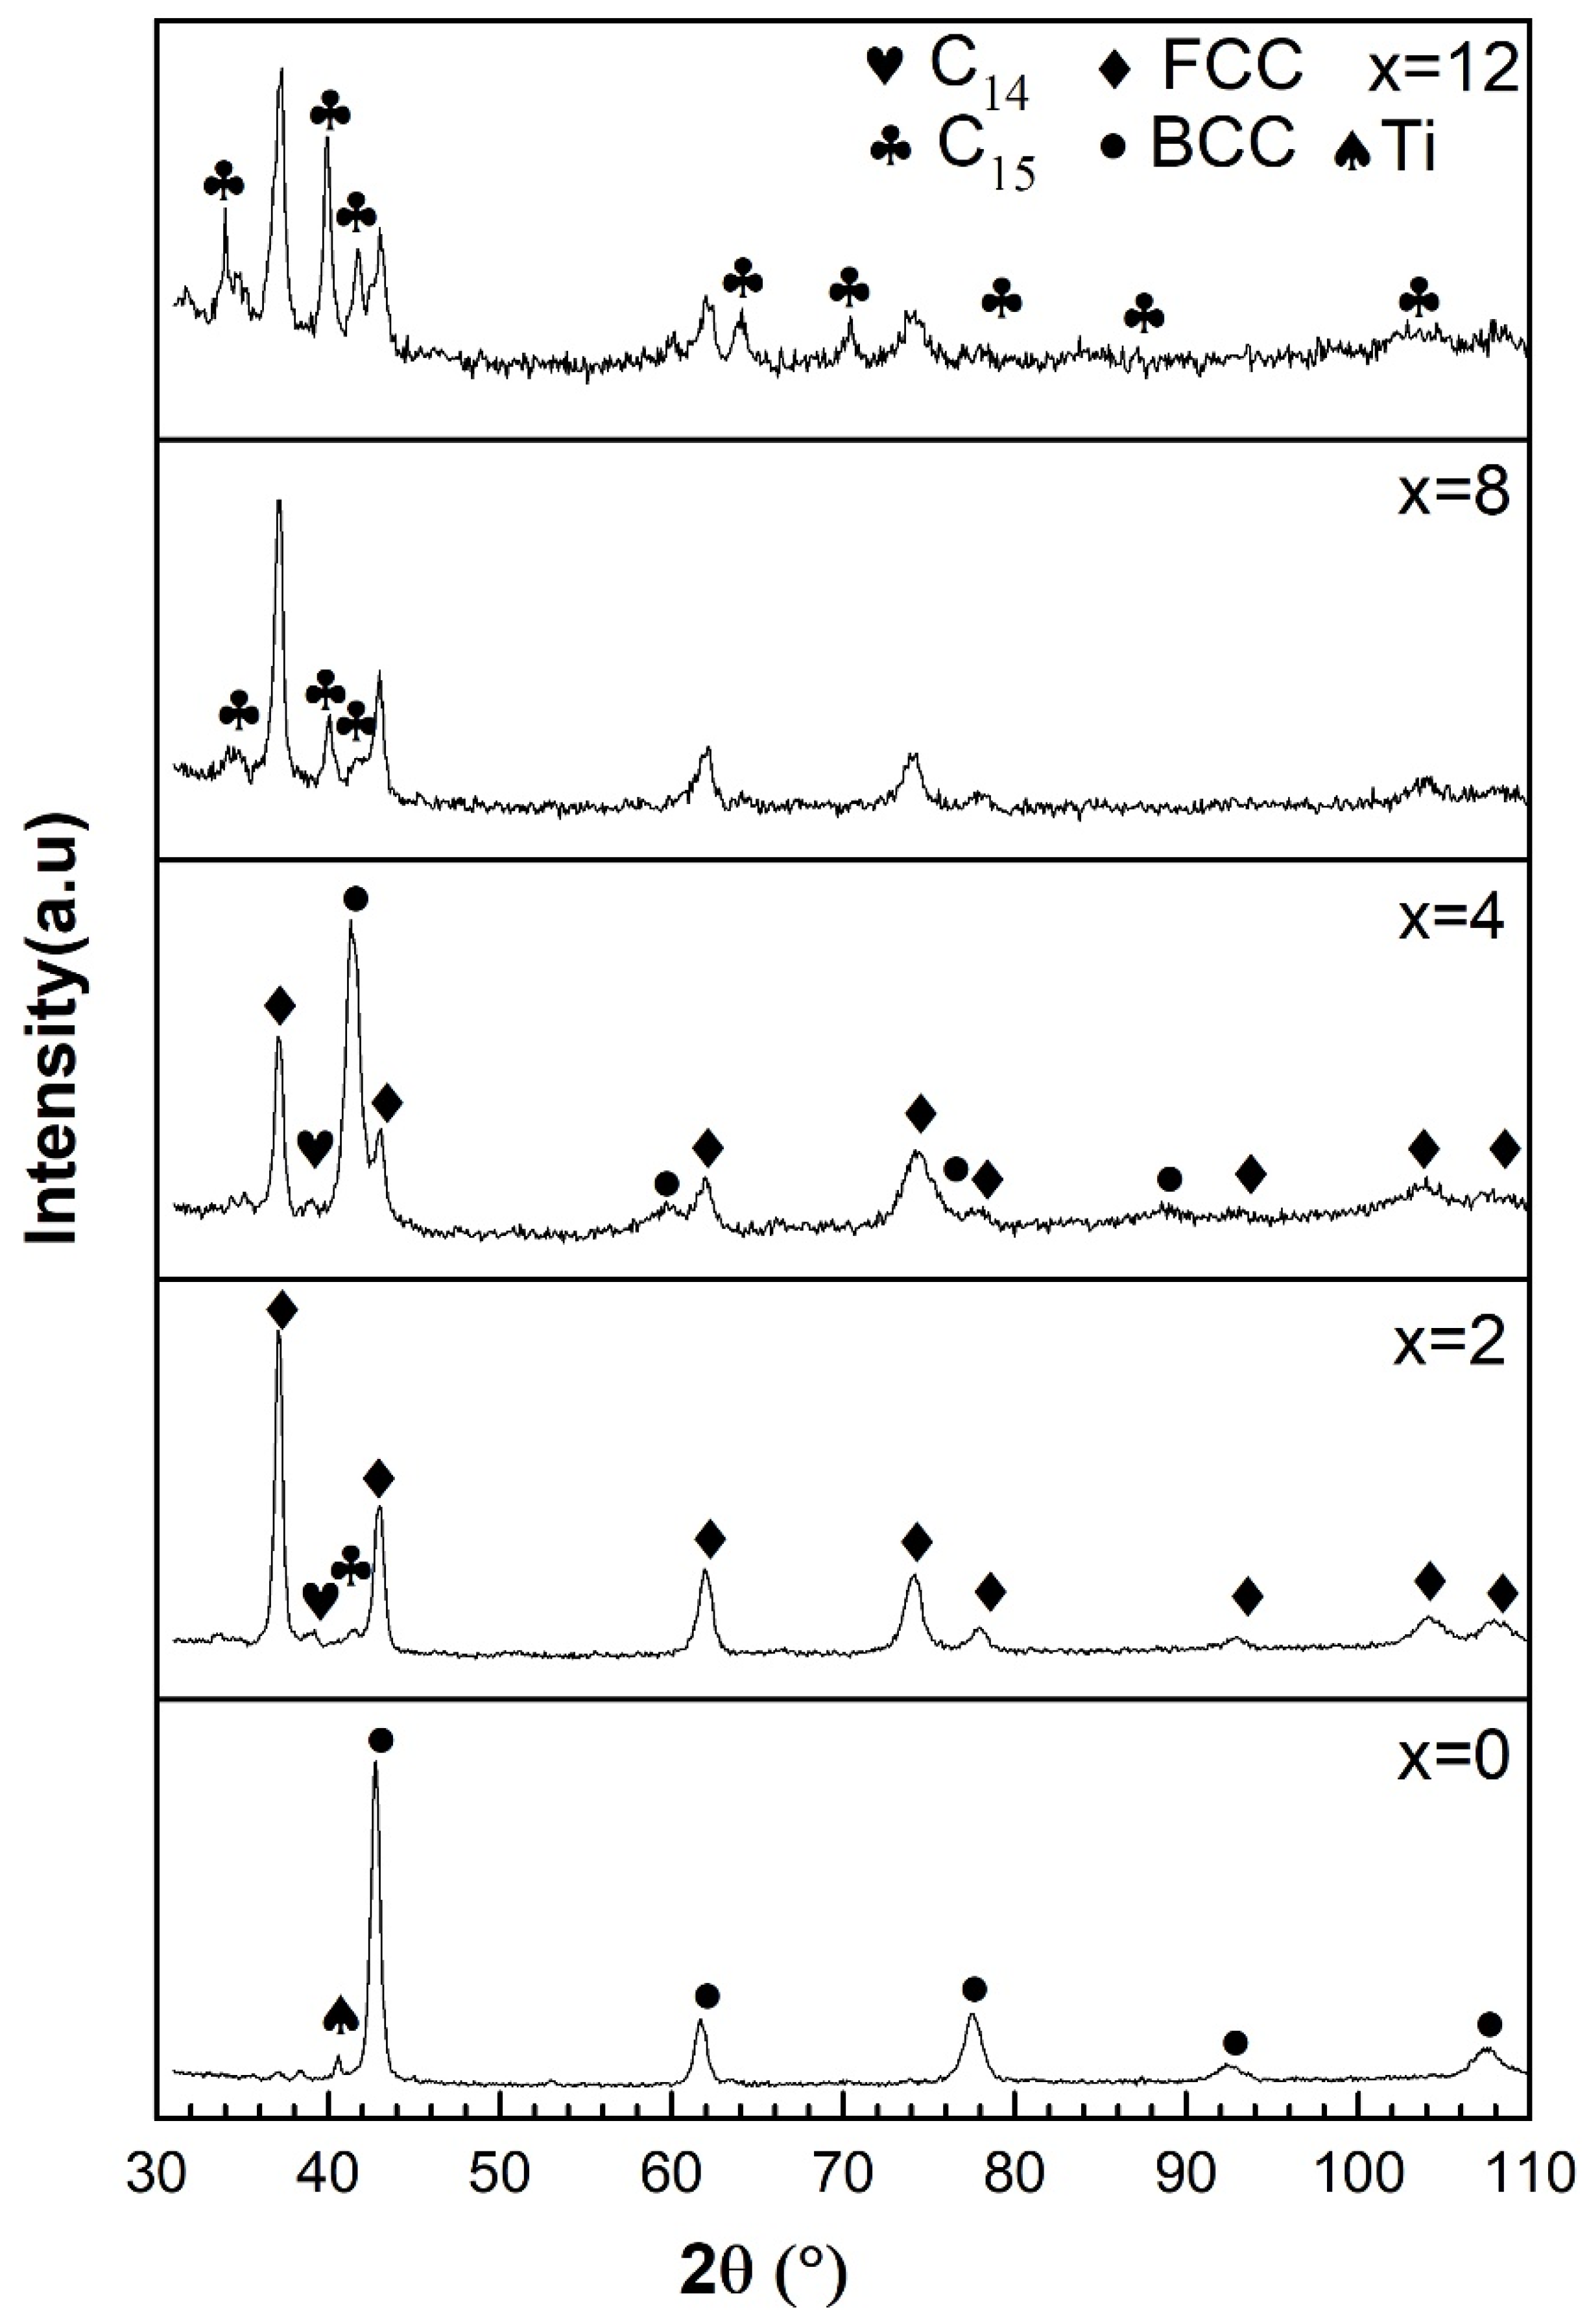
Figure 3 shows the XRD pattern of all the studied samples in the as-cast state. The major diffraction peaks of all as cast alloys can be identified as BCC phase (space group Im-3m). Small peaks appeared as the zirconium doping increases. These peaks are surely related to the secondary phases. Due to the smallness of the peaks and their relatively small numbers, indexing them is not obvious. However, as demonstrated by Akiba and Iba, Laves phases could be closely related to BCC alloys [7]. Laves phases are well known intermetallic phases that crystallize in three different structures: a cubic MgCu2-type (Space group Fd-3m), a hexagonal MgZn2-type (space group P63/mmc), or a hexagonal MgNi2-type (Space group P63/mmc). Following the Strukturbericht nomenclature, these phases will be thereafter respectively designated C15, C14, and C36. In the specific case of Ti–V–Cr BCC alloys, it was also shown by Bellon et al. [17] that when zirconium is substituted for vanadium in these alloys there is the appearance of a C15 Laves phase.
We analyzed our diffraction patterns by Rietveld’s refinement. The obtained crystal parameters and the abundance of each phase in all samples are shown in Table 6. In these refinements, we tried to index the secondary phases’ peaks with Laves phases. We found that the peaks could be indexed by using two Laves phases, namely the C15 and C14 phases. Tentatively, the C14 phase was assigned to the composition Ti1.9V0.2Cr0.2Zr0.7 (secondary phase 1) and the C15 phase to the composition Ti1.0V0.4Cr1.1Zr0.5 (secondary phase 2). However, as it is difficult to distinguish between Ti, V, and Cr by X-ray diffraction the exact assignment could be only done by using neutron diffraction. Also, the problem with these compositions is that the ratio A/B is not 2 as it should be. For these reasons, we should stress that the indexing of C14 and C15 is tentative and more experiments are needed in order to have the definitive crystal structure of the secondary phases. We are now undertaking neutron experiments and these will be reported in a future paper. In the present case, we could conclude that using two Laves phases for fitting the secondary phase peaks confirm the finding of electron microscopy where two different secondary phases were found. We should also point out that, on Figure 3 only the main peaks of C14 and C15 have been indexed. As these two phases have small abundances, only the main peaks are showing in the diffraction patterns and indexing all possible peaks will have confused the reader, especially for overlapping peaks that are so small that they are undistinguishable from the background. Referring to Table 6 at which the phase abundances are presented for all studied alloys, we see that the total abundance of C15 + C14 phases roughly matches the abundance measured from image J.
2.3. Activation Process
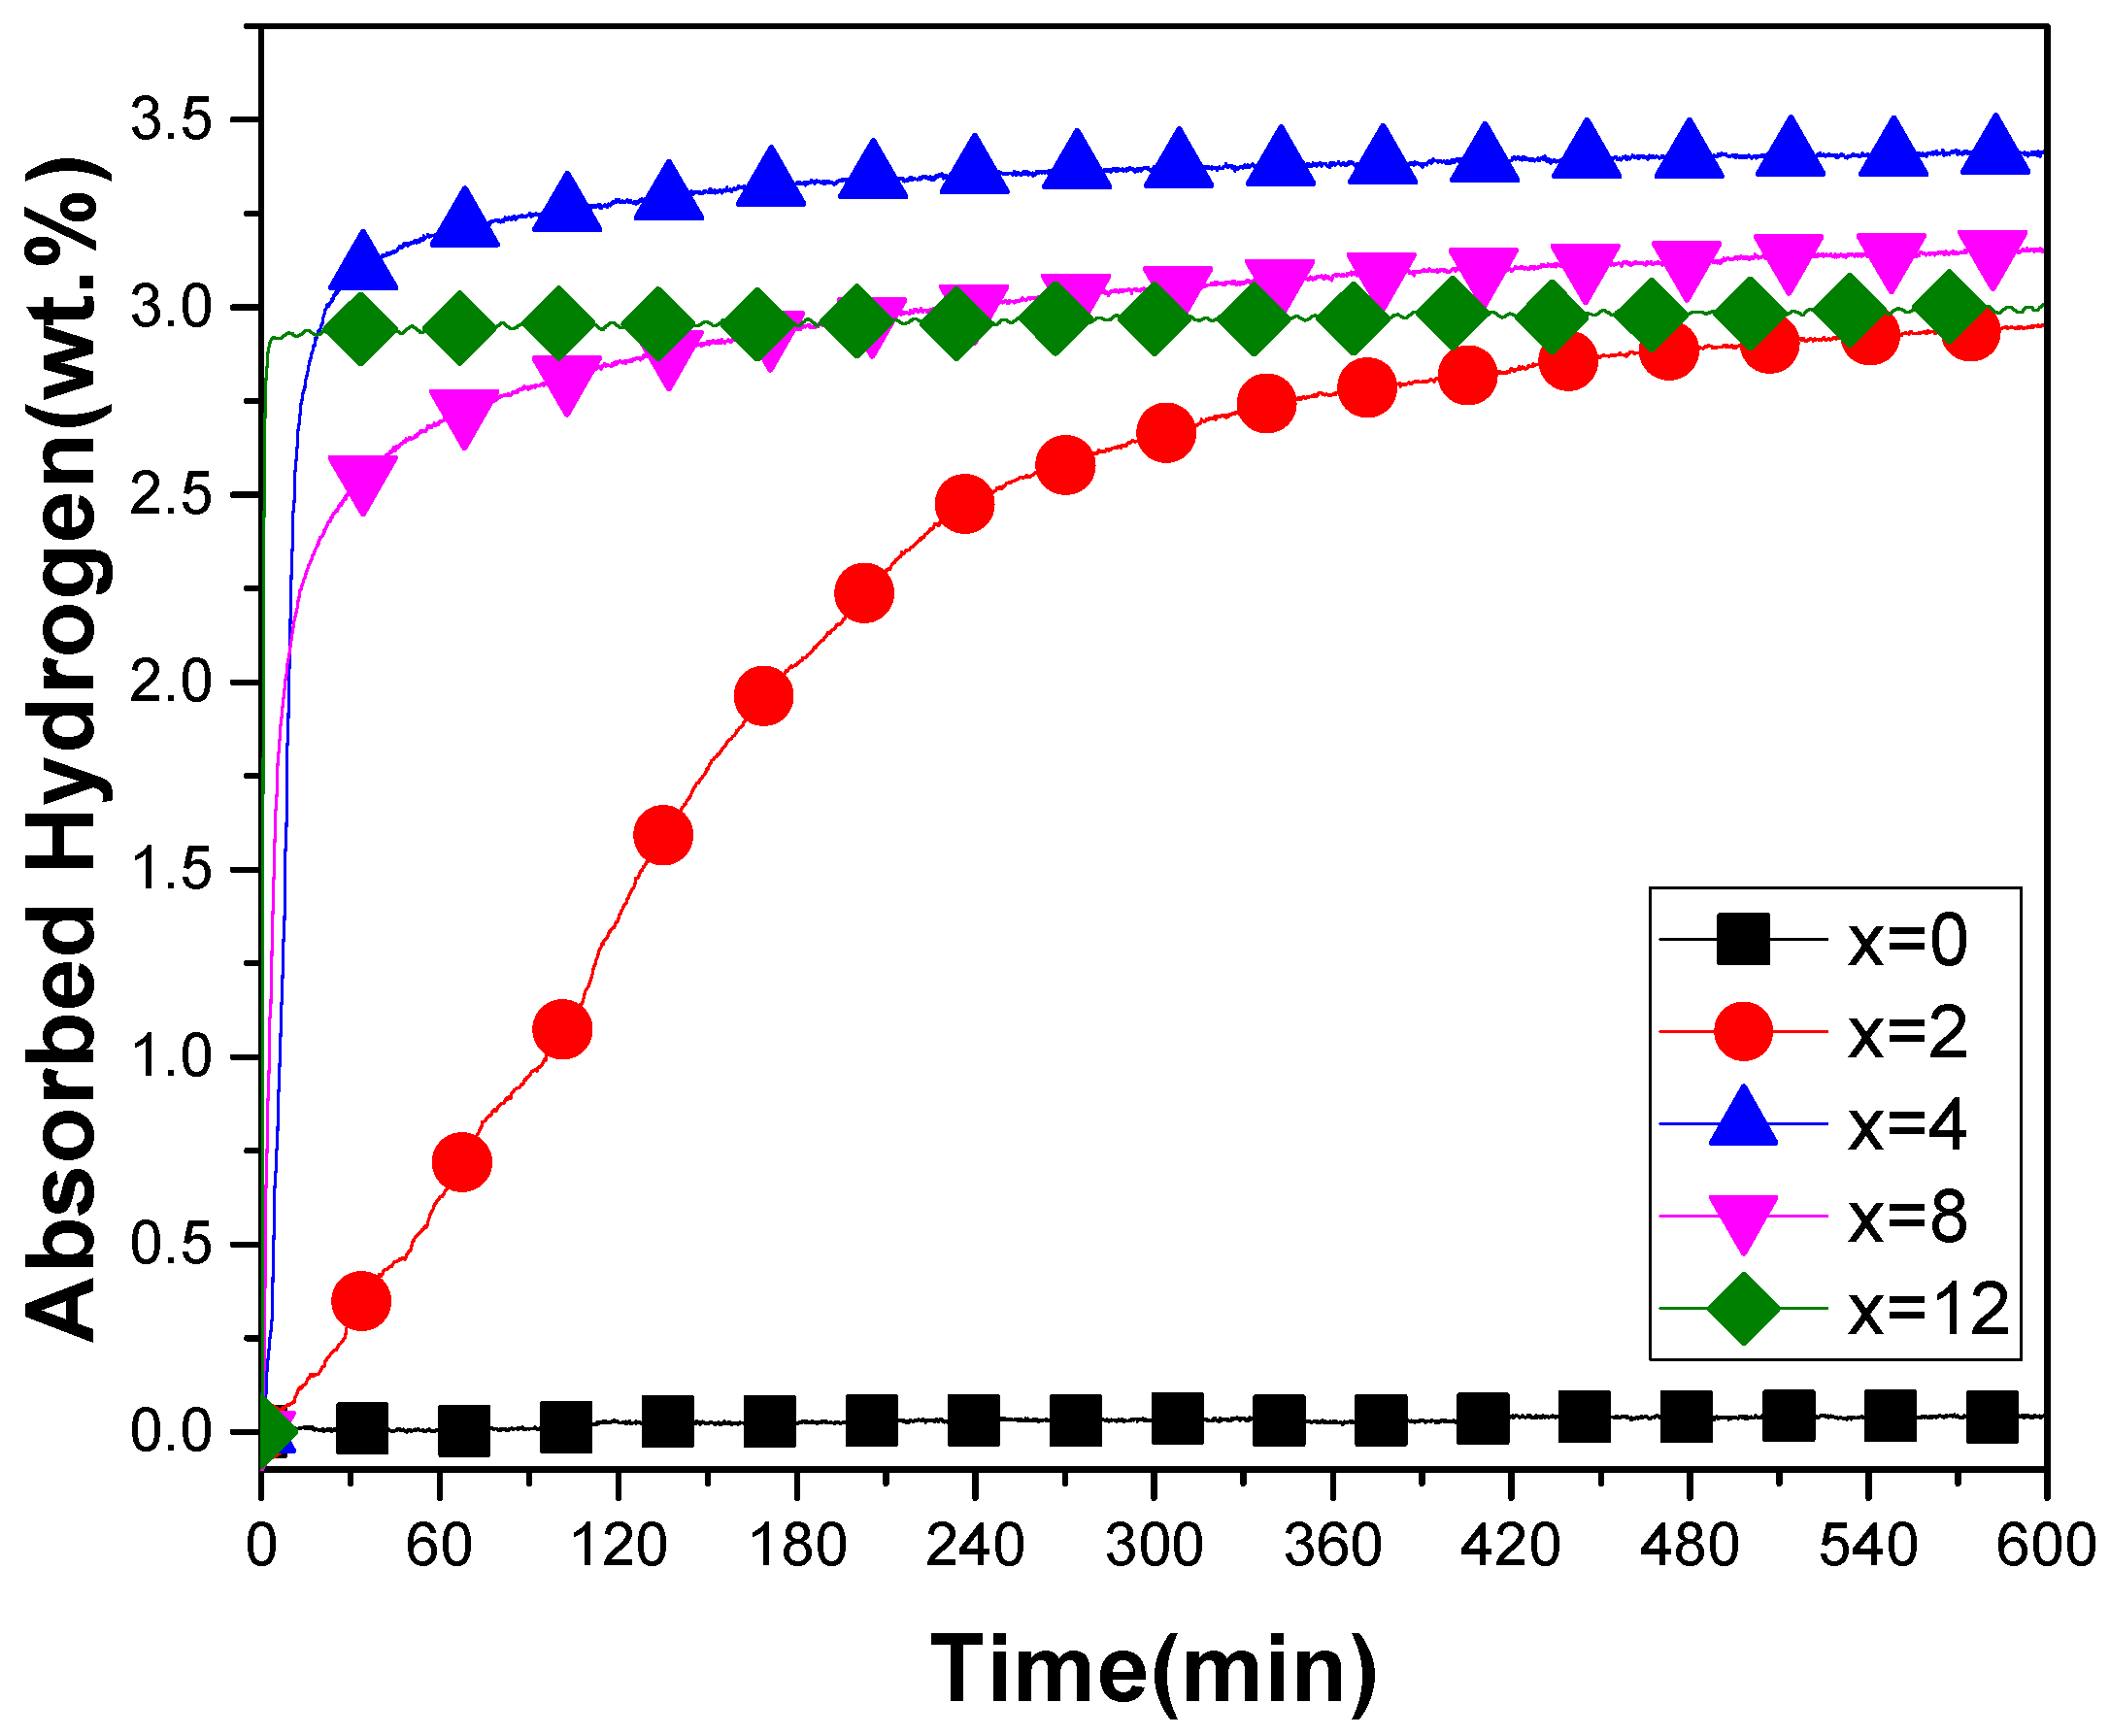
The first hydrogenation (activation) of as-cast Ti1V0.9Cr1.1 + x wt % Zr alloys was performed at room temperature under a hydrogen pressure 2MPa after the alloys were crushed in argon. Results are presented in Figure 4. The first hydrogenation for x = 0 is practically impossible. This sample did not absorb hydrogen even after 900 min of hydrogen exposure. Adding only 2 wt % of Zr to the alloy resulted in a good hydrogen uptake, but the full hydrogenation still takes about 10 h. Increasing x value to 4 wt % had the effect of greatly enhancing the kinetics and full hydrogenation was achieved after 150 min. Further increase of zirconium content slightly improved the kinetics but the total capacity decreased. Among all doped samples, the one with 12 wt % Zr has the fastest activation kinetics, reaching maximum capacity within 3 min. For hydrogen storage purposes, the optimum amount of zirconium seems to be 4 wt %. However, even if the capacity slightly decreases with addition of more zirconium, the fact is that even when the amount of secondary phases is high, the decrease in capacity is not very important. For example, in the alloy with 12 wt % of Zr the secondary phases comprise between 35 wt % (as measured from SEM images) and 34 wt % (as determined from Rietveld refinement). Taking the low estimation of 34 wt %, if these secondary phases do not absorb hydrogen, and assuming that pure BCC absorbs about 4 wt % of hydrogen, we should expect a capacity of about 2.7 wt % which is clearly not the case. The measured capacity could not be explained by the presence of the BCC alloy itself. Thus, we have evidence that, at least one of the secondary phases absorbs hydrogen. Nonetheless, this then raises the question of the kinetic curves. Except for the 2 wt % Zr alloy, all activation curves do not show any kinks or slope change. This is the signature of a single-phase alloy which is evidently not the case here. However, it has been shown by Akiba and Iba [7] that the BCC Laves phase related alloys could actually be formed by a BCC phase and a Laves phase and still display a single phase behaviour upon hydrogen absorption. It seems to be the case in the present system.
Interphase boundaries probably play a role in the activation. Similar investigation in other systems seems to point that way. Nanocrystallinity is also well known to enhance hydrogenation/dehydrogenation kinetics [6]. However, in the present case it is not the main factor as evidenced by Table 6. From this table, we see that the samples with x = 2 and x = 4 have almost the same crystallite size but their activation curve is drastically different. Moreover, the sample with x = 8 has a larger crystallite size but the hydrogenation is faster. Therefore, nanocrystallinity alone could not explain the behaviour of this system. Dislocations and defects could lead to a faster first hydrogenation in metal hydrides and was shown for cold rolled alloys [23,24].
Another explanation for the quick activation of alloys with zirconium addition may be stability of the FCC hydride. As the matrix of the Zr-containing alloys has a stoichiometry different than the nominal value and also, taking into account the fact that the BCC alloy contains some zirconium, it may well result in some change of the formation enthalpy of the FCC hydride phase. A more stable hydride may result in an easier activation but to have a definitive answer, the pressure-composition isotherms have to be registered. Such an investigation is planned for the near future.
2.4. XRD Patterns after Hydrogenation
In this set of experiments, in order to study the crystal structure of the hydride phase, the absorption experiment was stopped after reaching full hydrogenation and thereafter the pressure just lowered to one bar of hydrogen. No vacuum was applied to the sample to be sure that no desorption occurred during removal of the sample holder. In separated tests, we exposed the samples to a pressure of 10 kPa and no desorption was noticed.
Figure 5 shows X-ray diffraction patterns of all alloys after first exposure to hydrogen. We see that for x = 0, the structure is still BCC which confirms what was seen on Figure 4. For x = 2, the crystal structure is essentially FCC which is usually the crystal structure adopted by a fully hydrided BCC alloy. The FCC phase is also seen in the patterns for x = 4, 8, and 12 but there are clearly other phases present. Indexation of the supplementary peaks is helped by doing a Rietveld refinement. Even if, in a Rietveld refinement prior knowledge of the phase present is mandatory, we could use this technique to first fit the patterns by using the known phase such as FCC in the present case. The residue of the fit then shows the unindexed peaks more clearly and it is easier to figure out which crystal structure is possible for the remaining peaks. This is the procedure we performed for all patterns and by doing it we found that the supplementary peaks could be associated with a C14 and a C15 phases.
The crystal parameters and abundance of each phase in all hydrogenated samples as determined by Rietveld’s analysis are presented in Table 7. For x = 0, the sample did not absorb hydrogen and the crystal structure is still BCC. There is practically no change in the lattice parameter and crystallite size, which means that there was no reaction with hydrogen. In the case of x = 2, the FCC phase abundance in the hydrogenated sample is less than the BCC abundance in the as-cast alloy (80% vs. 92%) while both C14 and C15 phases are more abundant in the hydrogenated sample. The reason for this behaviour is unclear but a premature conclusion should be avoided because the abundance values are associated with relatively high experimental errors. For x = 4, there is a presence of both BCC and FCC phases in the hydrogenated alloy. This is surprising, considering that the hydrogen capacity is slightly higher than for x = 2. It is well known that the monohydride of the BCC phase is a BCT (Body Centred Tetragonal) but, as the lattices parameters are very close to each other it is practically impossible to distinguish between the BCC and BCT phases. However, the lattice parameter of the BCC phase in the hydrogenated state is much bigger than in the as-cast state. From the difference in volume of the unit cells and assuming that, on average, a hydrogen atom occupies a volume of 2.5 Å3, we could estimate that the BCC phase in the hydrogenated state has a ratio of H/M of about 0.56. When x = 8, we see that the hydrogenated alloy has 72 wt % of FCC phase which corresponds closely to the abundance of BCC phase in the as-cast alloy (68 wt %). Only the C15 phase is present in the hydrogenated sample and the abundance is almost the total of the C14 and C15 phases in the as-cast alloy. Thus, it seems that, upon hydrogenation, the C14 phase turns into a C15 phase. Finally, for x = 12, the FCC phase has an abundance of 56 wt % which is lower than the abundance of the BCC phase in the as-cast alloy (66 wt %). As for x = 8, there is no C14 phase in the hydrogenated pattern.
For high addition of zirconium x > 8, the C14 phase was not detected by X-ray diffraction. This may be due to the fact that, upon hydrogenation, the crystallite size is reduced thus, broadening the peaks of this phase. As C14 phase is already present in relatively small amount (less than 12 wt %) this makes that phase practically undetectable by X-ray diffraction as the peaks are merged into the background.
2.5. Air Exposure Effect
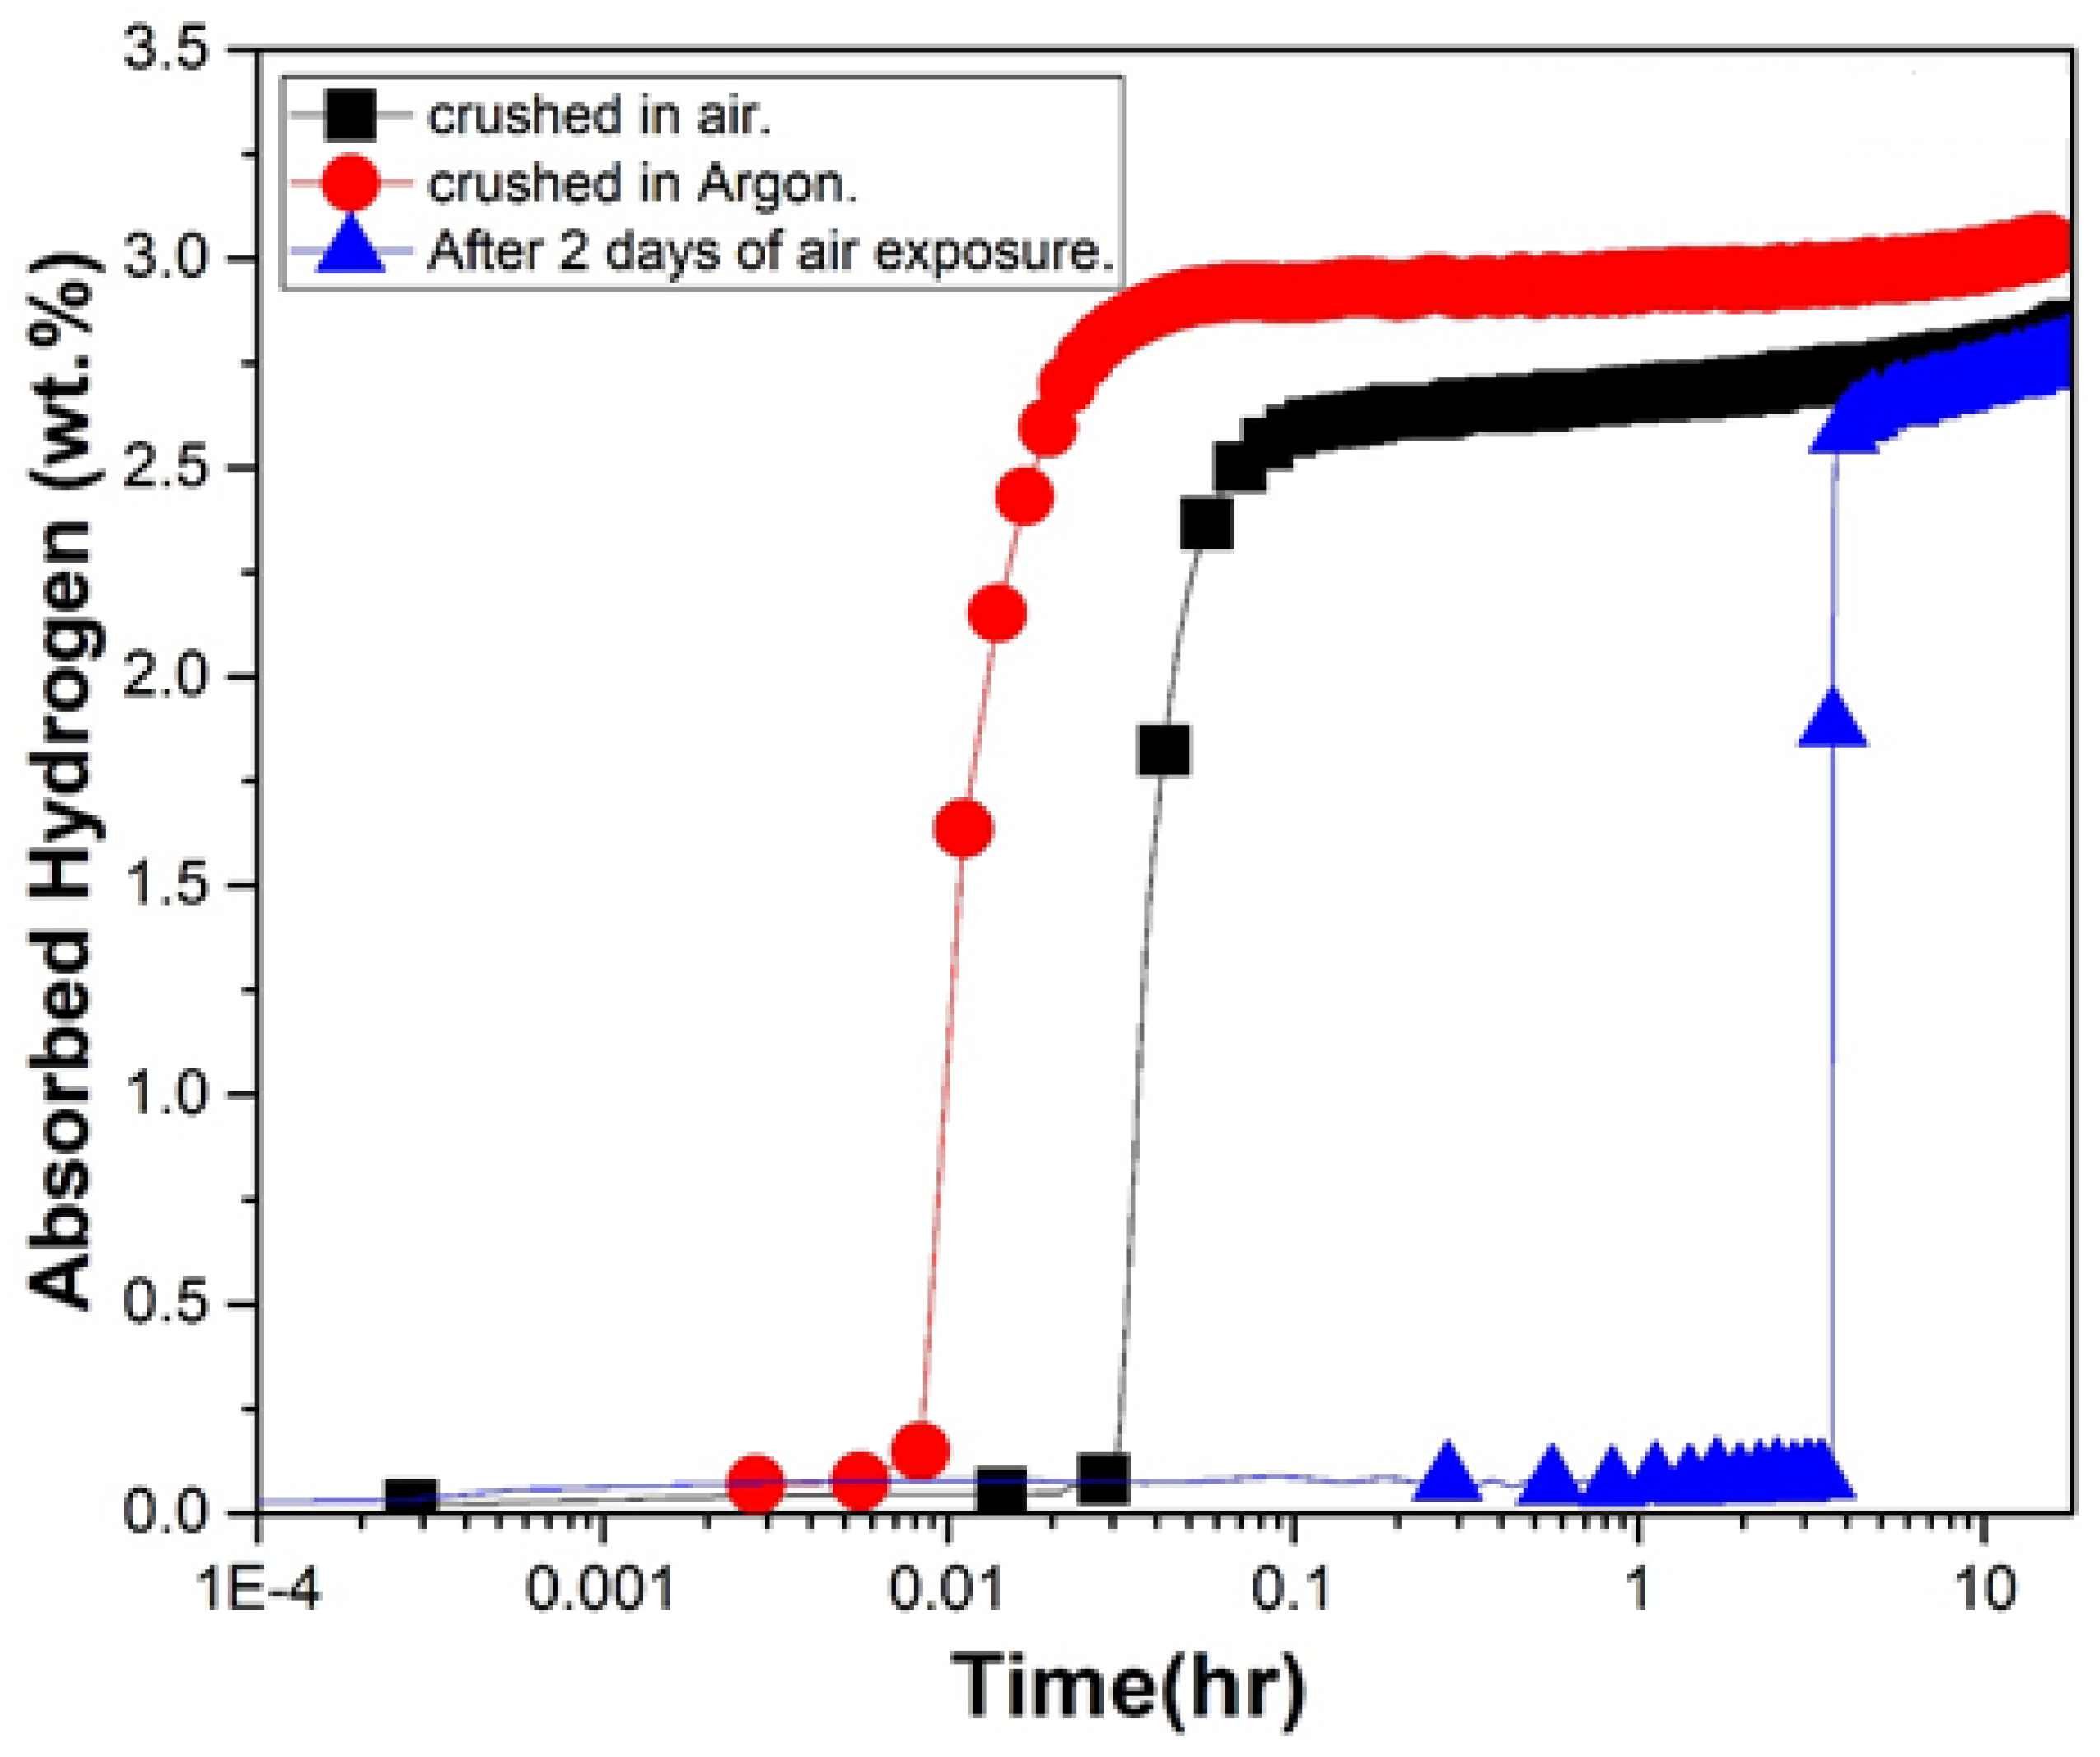
For industrial production, it could be beneficial to be able to handle the cast alloys in air. This motivated us to investigate the air resistance of the alloy with 12 wt % of zirconium. Figure 6 shows the activation curves for this alloy crushed in air, in argon and after two days of air exposure. The sample crushed in air has a very short incubation time of 1.76 min while the sample after two days of air exposure presents a longer incubation time of 3.75 h. However, after incubation time the intrinsic kinetic is as fast for the sample exposed to the air two days as for the samples only crushed in air or in argon. The longer incubation time shown by the sample stored in air for two days is most probably due to the presence of surface oxide.
3. Materials and Methods
Synthesis of Ti1V0.9Cr1.1 + x wt % Zr alloys were performed using an arc melting apparatus. The raw materials were purchased from Alfa-Aesar (Ward Hill, MA, USA) and had the following purity: Ti sponge (99.95%), V pieces (99%), Cr pieces (99%), and Zr sponge (99.95%). They were mixed at the desired stoichiometry and melted together under argon atmosphere. To ensure homogeneity, each pellet was melted, turned over, and remelted three times. Each pellet was then hand crushed using a steel mortar and pestle under argon atmosphere. Crushing in air was performed only for the air exposed sample. The material was filled into a sample holder and kept under vacuum for one hour at room temperature before exposing it to hydrogen. The hydrogen sorption properties were measured using a homemade Sievert’s type apparatus. The measurements were done at room temperature under a hydrogen pressure of 20 MPa for absorption. The crystal structure was determined by X-ray powder diffraction on a Bruker D8 focus apparatus with Cu Kα radiation (Bruker AXS INC, Madison, WI, USA). Lattice parameters were evaluated by Rietveld's refinement of the X-ray patterns using Topas software [25]. Microstructure and chemical analysis were performed using a JEOL-JSM 5500 scanning electron microscopy (Ebay, Carson, CA, USA) equipped with an EDX (energy dispersive X-ray) apparatus from Oxford Instruments. The percentage of different phases was analyzed by image J software [26,27].
4. Conclusions
The first hydrogenation kinetics of Ti1V0.9Cr1.1 + x wt % Zr (x = 2, 4, 8, and 12) alloys was found to be increased with the amount of Zr. Doping with Zr generated a multiphase microstructure made of a main BCC phase and secondary phases. The secondary phases abundance increased with Zr content. The two secondary phases were found to be Laves phases: a hexagonal C14 phase and a cubic C15 phase. Upon hydrogenation, most of the BCC phase transforms to the dihydride FCC phase but a small fraction of the BCC phase also seems to transform to a C15 phase with bigger lattice parameter, indicating that this phase also absorbed hydrogen. For high zirconium loading (x > 8), only C15 phase is present in the hydride pattern beside the FCC phase. Therefore, hydrogenation seems to promote the transformation of C14 and some fraction of BCC phase into C15 phase. The faster first hydrogenation of the alloys containing zirconium could be explained by the presence of the C14 and C15 secondary phases. This made the first hydrogenation at room temperature much faster. Addition of 4 wt % of Zr produced fast kinetics and the highest hydrogen storage capacity while higher abundance of zirconium (x > 4) leads to decrease in hydrogen storage capacity. We also found that air exposure has a relatively small impact on the activation of Ti1V0.9Cr1.1 + 12 wt % Zr alloy.
Acknowledgments
This investigation was supported by a NSERC (Natural Sciences and Engineering Research Council of Canada) discovery grant which also covered the cost of publishing in open access. We would like to thank A. Lejeune for electron microscopy experiments.
Author Contributions
All experiments, except electron microscopy, were performed by Salma Sleiman under the supervision of Jacques Huot.
Conflicts of Interest
The authors declare no conflict of interest.
References
- Jena, P. Materials for hydrogen storage: Past, present, and future. J. Phys. Chem. Lett. 2011, 2, 206–211. [Google Scholar] [CrossRef]
- Schlapbach, L.; Züttel, A. Hydrogen-storage materials for mobile applications. Nature 2001, 414, 353–358. [Google Scholar] [CrossRef] [PubMed]
- Züttel, A. Materials for hydrogen storage. Mater. Today 2003, 6, 24–33. [Google Scholar] [CrossRef]
- Züttel, A. Hydrogen storage and distribution systems. Mitig. Adapt. Strateg. Glob. Chang. 2007, 12, 343–365. [Google Scholar] [CrossRef]
- Gambini, M.; Manno, M.; Vellini, M. Numerical analysis and performance assessment of metal hydride-based hydrogen storage systems. Int. J. Hydrog. Energy 2008, 33, 6178–6187. [Google Scholar] [CrossRef]
- Sakintuna, B.; Lamari-Darkrim, F.; Hirscher, M. Metal hydride materials for solid hydrogen storage: A review. Int. J. Hydrog. Energy 2007, 32, 1121–1140. [Google Scholar] [CrossRef]
- Akiba, E.; Iba, H. Hydrogen absorption by laves phase related BCC solid solution. Intermetallics 1998, 6, 461–470. [Google Scholar] [CrossRef]
- Kuriiwa, T.; Tamura, T.; Amemiya, T.; Fuda, T.; Kamegawa, A.; Takamura, H.; Okada, M. New V-based alloys with high protium absorption and desorption capacity. J. Alloys Compd. 1999, 293, 433–436. [Google Scholar] [CrossRef]
- Okada, M.; Kuriiwa, T.; Tamura, T.; Takamura, H.; Kamegawa, A. Ti–V–Cr BCC Alloys with high protium content. J. Alloys Compd. 2002, 330, 511–516. [Google Scholar] [CrossRef]
- Tamura, T.; Kazumi, T.; Kamegawa, A.; Takamura, H.; Okada, M. Protium absorption properties and protide formations of Ti–Cr–V alloys. J. Alloys Compd. 2003, 356, 505–509. [Google Scholar] [CrossRef]
- Itoh, H.; Arashima, H.; Kubo, K.; Kabutomori, T. The influence of microstructure on hydrogen absorption properties of Ti–Cr–V alloys. J. Alloys Compd. 2002, 330, 287–291. [Google Scholar] [CrossRef]
- Fruchart, D.; De Rango, P.; Charbonnier, J.; Miraglia, S.; Rivoirard, S.; Skryabina, N.; Jehan, M. Nanocrystalline Composite for Storage of Hydrogen. U.S. Patent No. 8,012,452, 6 September 2011. [Google Scholar]
- Bibienne, T.; Bobet, J.-L.; Huot, J. Crystal structure and hydrogen storage properties of body centered cubic 52Ti–12V–36Cr alloy doped with Zr7Ni10. J. Alloys Compd. 2014, 607, 251–257. [Google Scholar] [CrossRef]
- Martínez, A.; dos Santos, D.S. Hydrogen absorption/desorption properties in the TiCrV based alloys. Mater. Res. 2012, 15, 809–812. [Google Scholar] [CrossRef]
- Miraglia, S.; de Rango, P.; Rivoirard, S.; Fruchart, D.; Charbonnier, J.; Skryabina, N. Hydrogen sorption properties of compounds based on BCC Ti1 − xV1 − yCr1 + x + y alloys. J. Alloys Compd. 2012, 536, 1–6. [Google Scholar] [CrossRef]
- Skryabina, N.; Fruchart, D.; Medvedeva, N.A.; de Rango, P.; Mironova, A.A. Correlation between the hydrogen absorption properties and the vanadium concentration of Ti–V–Cr based alloys. Solid State Phenom. 2017, 257, 165–172. [Google Scholar] [CrossRef]
- Bellon, D.; Martinez, A.; Barreneche, D.; dos Santos, D. A structural study of the hydrogen absorption properties by replacing vanadium with zirconium in metal alloys. J. Phys. Conf. Ser. 2016, 687, 012057. [Google Scholar] [CrossRef]
- Kamble, A.; Sharma, P.; Huot, J. Effect of doping and particle size on hydrogen absorption properties of BCC solid solution 52Ti-12V-36Cr. Int. J. Hydrog. Energy 2017, 42, 11523–11527. [Google Scholar] [CrossRef]
- Shashikala, K.; Banerjee, S.; Kumar, A.; Pai, M.; Pillai, C. Improvement of hydrogen storage properties of TiCrV alloy by Zr substitution for Ti. Int. J. Hydrog. Energy 2009, 34, 6684–6689. [Google Scholar] [CrossRef]
- Yoo, J.-H.; Shim, G.; Yoon, J.-S.; Cho, S.-W. Effects of substituting Al for Cr in the Ti0.32Cr0.43V0.25 alloy on its microstructure and hydrogen storage properties. Int. J. Hydrog. Energy 2009, 34, 1463–1467. [Google Scholar] [CrossRef]
- Edalati, K.; Shao, H.; Emami, H.; Iwaoka, H.; Akiba, E.; Horita, Z. Activation of titanium–vanadium alloy for hydrogen storage by introduction of nanograins and edge dislocations using high-pressure torsion. Int. J. Hydrog. Energy 2016, 41, 8917–8924. [Google Scholar] [CrossRef]
- Banerjee, S.; Kumar, A.; Ruz, P.; Sengupta, P. Influence of laves phase on microstructure and hydrogen storage properties of Ti–Cr–V based alloy. Int. J. Hydrog. Energy 2016, 41, 18130–18140. [Google Scholar] [CrossRef]
- Huot, J.; Tousignant, M. Hydrogen sorption enhancement in cold-rolled and ball-milled CaNi5. J. Mater. Sci. 2017, 52, 11911–11918. [Google Scholar] [CrossRef]
- Tousignant, M.; Huot, J. Hydrogen sorption enhancement in cold rolled LaNi5. J. Alloys Compd. 2014, 595, 22–27. [Google Scholar] [CrossRef]
- Bruker, A.X.S. TOPAS V3: General profile and structure analysis software for powder diffraction data. In User’s Manual; Bruker AXS: Karlsruhe, Germany, 2005. [Google Scholar]
- Abramoff, M.D.; Magalhaes, P.J.; Ram, S.J. Image processing with imageJ. Biophotonics Int. 2004, 11, 36–42. [Google Scholar]
- Collins, T.J. ImageJ for microscopy. Biotechniques 2007, 43, 25–30. [Google Scholar] [CrossRef] [PubMed]
Figure 1.
Backscattered electrons (BSE) micrographs of: Ti1V0.9Cr1.1 + x wt % Zr with x = 0 (a); 2 (b); 4 (c); 8 (d); and 12 (e).
Figure 1.
Backscattered electrons (BSE) micrographs of: Ti1V0.9Cr1.1 + x wt % Zr with x = 0 (a); 2 (b); 4 (c); 8 (d); and 12 (e).

Figure 2.
Backscattered electron micrograph of: Ti1V0.9Cr1.1 + 4 wt % Zr alloy with elements mapping.
Figure 2.
Backscattered electron micrograph of: Ti1V0.9Cr1.1 + 4 wt % Zr alloy with elements mapping.

Figure 3.
X-ray diffraction patterns of as cast: Ti1V0.9Cr1.1 + x wt % Zr alloys with x = 0, 2, 4, 8, and 12.
Figure 3.
X-ray diffraction patterns of as cast: Ti1V0.9Cr1.1 + x wt % Zr alloys with x = 0, 2, 4, 8, and 12.

Figure 4.
Activation curves of: Ti1V0.9Cr1.1 + x wt % Zr for x = 0, 2, 4, 8, and 12 at room temperature under 2MPa of hydrogen.
Figure 4.
Activation curves of: Ti1V0.9Cr1.1 + x wt % Zr for x = 0, 2, 4, 8, and 12 at room temperature under 2MPa of hydrogen.

Figure 5.
X-ray diffraction patterns of: Ti1V0.9Cr1.1 + x wt % Zr alloys in the hydrogenated state for x = 0, 2, 4, 8, and 12.
Figure 5.
X-ray diffraction patterns of: Ti1V0.9Cr1.1 + x wt % Zr alloys in the hydrogenated state for x = 0, 2, 4, 8, and 12.

Figure 6.
First hydrogenation curves of Ti1V0.9Cr1.1 + 12 wt % Zr crushed under argon and under air and after two days of air exposure at room temperature and under 2MPa of hydrogen.
Figure 6.
First hydrogenation curves of Ti1V0.9Cr1.1 + 12 wt % Zr crushed under argon and under air and after two days of air exposure at room temperature and under 2MPa of hydrogen.


Table 1.
Bulk atomic abundance: nominal and as measured by EDX of: Ti1V0.9Cr1.1 + x wt % Zr alloys for x = 0, 2, 4, 8, and 12. Error on the last significant digit is indicated in parentheses.
Table 1.
Bulk atomic abundance: nominal and as measured by EDX of: Ti1V0.9Cr1.1 + x wt % Zr alloys for x = 0, 2, 4, 8, and 12. Error on the last significant digit is indicated in parentheses.
| Sample | Ti (at %) | V (at %) | Cr (at %) | Zr (at %) | |
|---|---|---|---|---|---|
| x = 0 | Nominal composition | 33 | 30 | 37 | 0 |
| Measurement | 34.0(2) | 29.8 (3) | 36.2 (3) | 0.0 | |
| x = 2 | Nominal composition | 32.6 | 29.7 | 36.6 | 1.1 |
| Measurement | 32.8 (2) | 29.4 (2) | 36.4 (3) | 1.4 (1) | |
| x = 4 | Nominal composition | 32.3 | 29.3 | 36.2 | 2.2 |
| Measurement | 34.0 (3) | 28.2 (1) | 35.2 (3) | 2.6 (1) | |
| x = 8 | Nominal composition | 31.6 | 28.7 | 35.4 | 4.3 |
| Measurement | 32.3 (2) | 27.7 (2) | 34.5(3) | 5.5 (1) | |
| x = 12 | Nominal composition | 30.9 | 28.1 | 34.7 | 6.3 |
| Measurement | 31.7 (2) | 26.2 (2) | 33.9 (2) | 8.2 (1) |
Table 2.
EDX analysis showing the elemental composition of the matrix (point 1) of: Ti1V0.9Cr1.1 + x wt % Zr alloys for x = 0, 2, 4, 8, and 12.
Table 2.
EDX analysis showing the elemental composition of the matrix (point 1) of: Ti1V0.9Cr1.1 + x wt % Zr alloys for x = 0, 2, 4, 8, and 12.
| Sample | Ti (at %) | V (at %) | Cr (at %) | Zr (at %) |
|---|---|---|---|---|
| x = 0 | 27.8 | 33.8 | 38.4 | 0.0 |
| x = 2 | 27.4 | 33.4 | 38.9 | 0.3 |
| x = 4 | 25.8 | 35.0 | 38.9 | 0.3 |
| x = 8 | 29.3 | 31.6 | 38.2 | 0.9 |
| x = 12 | 28.5 | 31.7 | 38.9 | 0.9 |
Table 3.
EDX analysis showing the elemental composition of the secondary phase 1 (point 2) of Ti1V0.9Cr1.1 + x wt % Zr alloys for x = 0, 2, 4, 8, and 12.
Table 3.
EDX analysis showing the elemental composition of the secondary phase 1 (point 2) of Ti1V0.9Cr1.1 + x wt % Zr alloys for x = 0, 2, 4, 8, and 12.
| Sample | Ti (at %) | V (at %) | Cr (at %) | Zr (at %) |
|---|---|---|---|---|
| x = 2 | 64.0 | 7.0 | 6.2 | 22.8 |
| x = 4 | 64.0 | 6.7 | 6.2 | 23.1 |
| x = 8 | 58.3 | 6.8 | 4.6 | 30.3 |
| x = 12 | 55.8 | 7.2 | 5.1 | 32.0 |
Table 4.
EDX analysis showing the elemental composition of secondary phase 2 (point 3) of: Ti1V0.9Cr1.1 + x wt % Zr alloys for x = 0, 2, 4, 8, and 12.
Table 4.
EDX analysis showing the elemental composition of secondary phase 2 (point 3) of: Ti1V0.9Cr1.1 + x wt % Zr alloys for x = 0, 2, 4, 8, and 12.
| Sample | Ti (at %) | V (at %) | Cr (at %) | Zr (at %) |
|---|---|---|---|---|
| x = 2 | 33.7 | 12.3 | 38.0 | 16.0 |
| x = 4 | 32.8 | 12.3 | 37.9 | 17.0 |
| x = 8 | 32.8 | 15.5 | 33.6 | 18.1 |
| x = 12 | 28.5 | 14.8 | 36.5 | 20.2 |
Table 5.
EDX analysis showing the elemental composition at point 4 of: Ti1V0.9Cr1.1 + x wt % Zr alloys for x = 0, 2, and 4.
Table 5.
EDX analysis showing the elemental composition at point 4 of: Ti1V0.9Cr1.1 + x wt % Zr alloys for x = 0, 2, and 4.
| Sample | Ti (at %) | V (at %) | Cr (at %) | Zr (at %) |
|---|---|---|---|---|
| x = 0 | 87.7 | 7.0 | 5.3 | 0.0 |
| x = 2 | 88.2 | 3.3 | 2.0 | 6.5 |
| x = 4 | 79.6 | 6.8 | 5.6 | 8.0 |
Table 6.
Crystal parameters and abundance of each phase in as cast: Ti1V0.9Cr1.1 + x wt % Zr alloys for x = 0, 2, 4, 8, and 12. Error on the last significant digit is indicated in parentheses.
Table 6.
Crystal parameters and abundance of each phase in as cast: Ti1V0.9Cr1.1 + x wt % Zr alloys for x = 0, 2, 4, 8, and 12. Error on the last significant digit is indicated in parentheses.
| Sample | Phase | Lattice Parameter (Å) | Crystallite Size (nm) | Phase Abundance (%) | Bright Area Abundance (%) |
|---|---|---|---|---|---|
| x = 0 | BCC Ti | 3.0379 (9) a = 2.961 (4) c = 4.773 (1) | 24 (2) 13 (2) | 97 (3) 3 (3) | 0 |
| x = 2 | BCC C15 C14 | 3.0479 (5) 7.172 (7) a = 5.903 (9) c = 7.26 (2) | 22 (1) 14 (7) 8 (2) | 92 (2) 2 (1) 6 (2) | 4 |
| x = 4 | BCC C15 C14 | 3.0470 (7) 7.153 (5) a = 5.935 (1) c = 8.09 (4) | 23 (2) 20 (8) 5 (1) | 89 (3) 3 (1) 8 (3) | 12 |
| x = 8 | BCC C15 C14 | 3.0452 (1) 7.180 (5) a = 5.849 (7) c = 8.109 (2) | 38 (9) 6 (1) 6 (1) | 68 (5) 21(4) 11 (2) | 26 |
| x = 12 | BCC C15 C14 | 3.0310 (1) 6.099 (7) a = 5.815 (2) c = 8.01 (1) | 8 (3) 10 (1) 3 (1) | 66 (4) 22 (2) 12 (2) | 35 |
Table 7.
Crystal parameters and abundance of each phase in hydrogenated: Ti1V0.9Cr1.1 + x wt % Zr alloys for x = 0, 2, 4, 8, and 12. Error on the last significant digit is indicated in parentheses.
Table 7.
Crystal parameters and abundance of each phase in hydrogenated: Ti1V0.9Cr1.1 + x wt % Zr alloys for x = 0, 2, 4, 8, and 12. Error on the last significant digit is indicated in parentheses.
| Sample | Phase | Lattice Parameter (Å) | Crystallite Size (nm) | Phase Abundance (%) |
|---|---|---|---|---|
| x = 0 | BCC Ti | 3.0375 (4) a = 2.9622 (2) c = 4.773 (6) | 20 (5) 11 (3) | 93 (8) 7 (3) |
| x = 2 | FCC C15 C14 | 4.2856 (6) 7.413 (1) a = 6.141 (7) c = 7.262 (2) | 34 (3) 4 (2) 6 (3) | 80 (2) 10 (2) 10 (1) |
| x = 4 | BCC FCC C14 | 3.1443 (1) 4.2912 (2) a = 5.809 (2) c = 8.03 (4) | 25 (5) 42 (2) 11 (3) | 56 (4) 41 (4) 3 (1) |
| x = 8 | FCC C15 | 4.2875(2) 7.605(7) | 16 (2) 8 (3) | 72 (6) 28 (3) |
| x = 12 | FCC C15 | 4.289 (2) 7.646 (4) | 12 (2) 12 (1) | 56 (6) 44 (6) |
© 2017 by the authors. Licensee MDPI, Basel, Switzerland. This article is an open access article distributed under the terms and conditions of the Creative Commons Attribution (CC BY) license (http://creativecommons.org/licenses/by/4.0/).
Share and Cite
MDPI and ACS Style
Sleiman, S.; Huot, J. Microstructure and Hydrogen Storage Properties of Ti1V0.9Cr1.1 Alloy with Addition of x wt % Zr (x = 0, 2, 4, 8, and 12). Inorganics 2017, 5, 86. https://0-doi-org.brum.beds.ac.uk/10.3390/inorganics5040086
AMA Style
Sleiman S, Huot J. Microstructure and Hydrogen Storage Properties of Ti1V0.9Cr1.1 Alloy with Addition of x wt % Zr (x = 0, 2, 4, 8, and 12). Inorganics. 2017; 5(4):86. https://0-doi-org.brum.beds.ac.uk/10.3390/inorganics5040086
Chicago/Turabian StyleSleiman, Salma, and Jacques Huot. 2017. "Microstructure and Hydrogen Storage Properties of Ti1V0.9Cr1.1 Alloy with Addition of x wt % Zr (x = 0, 2, 4, 8, and 12)" Inorganics 5, no. 4: 86. https://0-doi-org.brum.beds.ac.uk/10.3390/inorganics5040086
Note that from the first issue of 2016, this journal uses article numbers instead of page numbers. See further details here.