Article

Homoleptic Lanthanide Complexes Containing a Redox-Active Ligand and the Investigation of Their Electronic and Photophysical Properties

1
Department of Chemistry, University of Manitoba, Winnipeg, MB R3T 2N2, Canada
2
Department of Chemistry, Brock University, St. Catharines, ON L2S 3A1, Canada
3
Department of Chemistry, Université de Montreal, Montreal, QC H3C 3J7, Canada
4
Department of Chemistry, University of Winnipeg, Winnipeg, MB R3B 2G3, Canada
5
Canadian Institute for Advanced Research, Quantum Materials, MaRS Centre, West Tower, 661 University Ave., Suite 505, Toronto, ON M5G 1M1, Canada
6
Department of Chemistry, University of Toronto, 80 St. George Street, Toronto, ON M5S 3H6, Canada
7
Department of Chemistry, Brandon University, Brandon, MB R7A 6A9, Canada
*
Author to whom correspondence should be addressed.
Submission received: 19 March 2018 / Revised: 17 May 2018 / Accepted: 18 May 2018 / Published: 25 May 2018
(This article belongs to the Special Issue Redox-Active Ligand in Coordination Chemistry)

Abstract

:
Herein, we describe the preparation, characterization and photophysical properties of neutral lanthanide complexes containing a redox-active ligand 1-(2-pyridylazo)-2-phenanthrol (papl). The complexes likely share similar structural features and bear the formulation Ln(papl)3 (Ln(III) = Gd, Dy, Tb), which is supported by electrospray ionization mass spectrometry, CHN analysis, FT-IR and UV–Vis spectroscopy. The synthesis and structural properties of a related complex, Ho(qapl)3 (where qapl = 10-(8-quinolylazo)-9-phenanthrol), is also reported. The complexes feature ligand-centered redox activity, similar to other reported transition metal complexes with papl. Variable temperature magnetic susceptibility measurements (DC and AC) suggest typical free-ion magnetism without any slow-relaxation dynamics. The photophysical properties of the ligand and complexes were investigated and the results of emission spectroscopy indicate ligand-centered processes.

1. Introduction

Lanthanide ion complexes are of interest for the production of luminescent and magnetic materials, including as diagnostic agents in magnetic resonance imaging (MRI) [1,2,3], biosensors [4,5], and single molecule (or ion) magnets (SMMs and SIMs, respectively) [6,7]. The contracted nature of the 4fn valence orbitals of lanthanide ions results in little to no perturbation of the electronic structure within the lanthanide ion upon ligand binding. Very often, the observed luminescence in these complexes is the result of transitions within the energy level manifold of the lanthanide ion and this generally results in the characteristic sharp emission spectra observed for these complexes. Another result of the isolation of the f-orbitals from the ligand field is that lanthanide ion complexes often exhibit unique magnetic properties generally easy to interpret as free ion magnetism by consideration of the total angular momentum of the ion in the form of the free ion term symbol. Depending on the energy level structure and depopulation of higher lying J states, a temperature dependence of the magnetic moment is observed. Under the right set of conditions that include symmetry, coordination number, geometry and ligand field electrostatics, strong magnetoanisotropy is observed resulting in barriers to magnetization relaxation and the observation of single ion magnetism [8].
We have been interested in the coordination chemistry of redox-active ligands, including those in the arylazo family [9]. Arylazo ligands feature low-lying π* azo-centered molecular orbitals and often exhibit intense visible absorption bands resulting from electronic transitions into these orbitals. The tridentate 1-(2-pyridylazo)-2-phenanthrol (papl) ligand has been investigated since the 1960s [10] and we have recently taken another look at the coordination chemistry of this structurally diverse ligand and other derivatives. The papl structure (Chart 1) contains pyridyl, azo, and phenanthrol fragments and is susceptible to either reduction or oxidation. Of note, first row transition metal complexes containing papl exhibit very intense ligand-centered absorption bands in the visible region, reversible cathodic electrochemistry and we have recently observed thermally induced spin-crossover in Co(papl)2 [11,12]. Iron complexes containing other arylazo substituted ligands have also recently been shown to exhibit spin-crossover and there is the potential to create multifunctional materials using these ligands with interesting magnetic, optical and electronic properties [13]. To date, there are no reported lanthanide ion complexes containing papl. However, given the interest in both redox-active ligands and lanthanide ion complexes, we believe the coordination chemistry of papl with lanthanide ions potentially has much to offer multifunctional materials research. Herein, we present the preparation and characterization of three lanthanide complexes containing papl in an effort to unearth the details regarding the electronic structures and photophysical properties in these interesting complexes. We also report on the structural properties of a holmium complex with the related ligand qapl. To our knowledge, this is the first report focused on the emission properties of homoleptic lanthanide complexes containing arylazo ligands and also the first reported lanthanide complexes with papl.

2. Results and Discussion

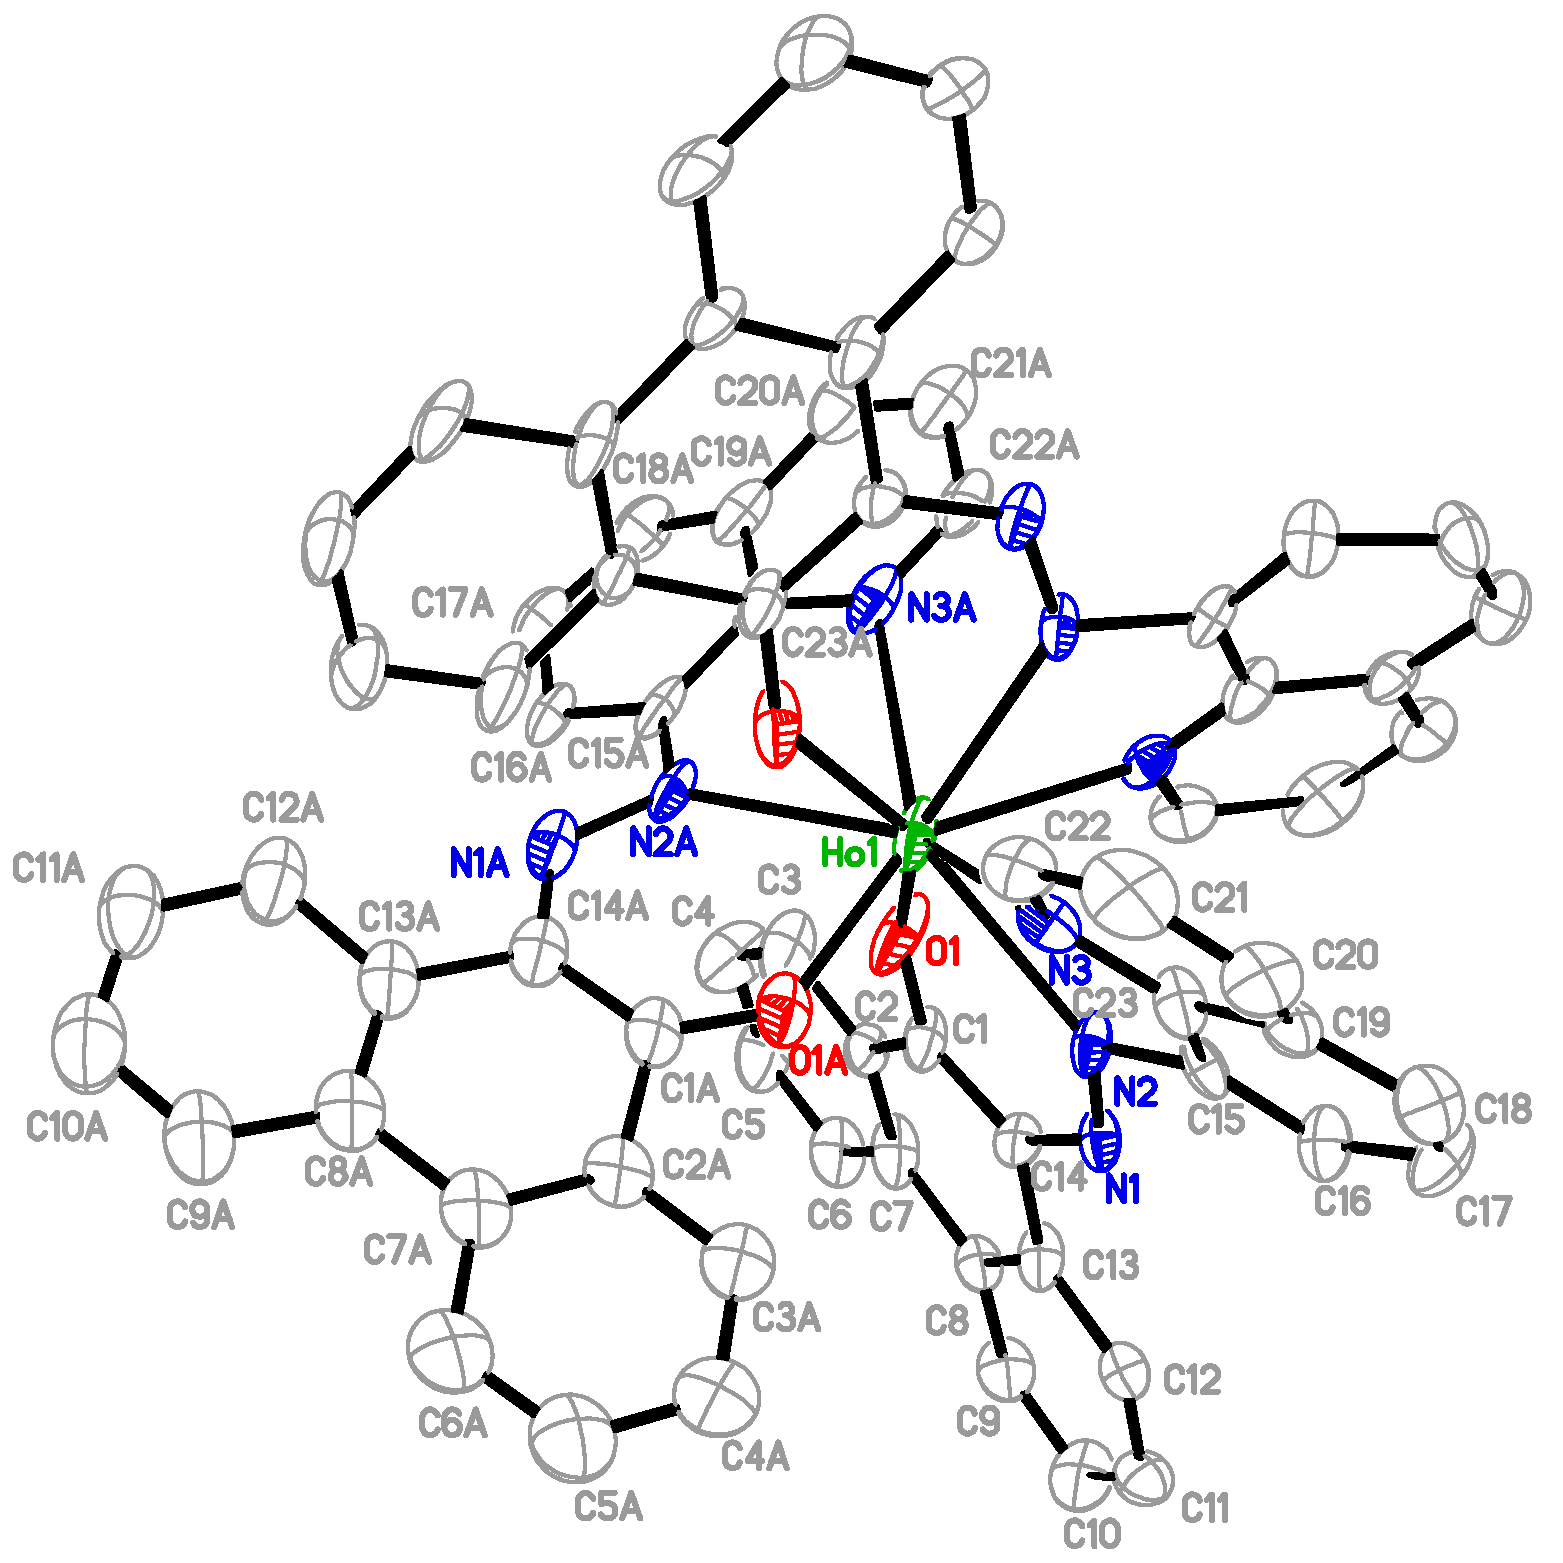
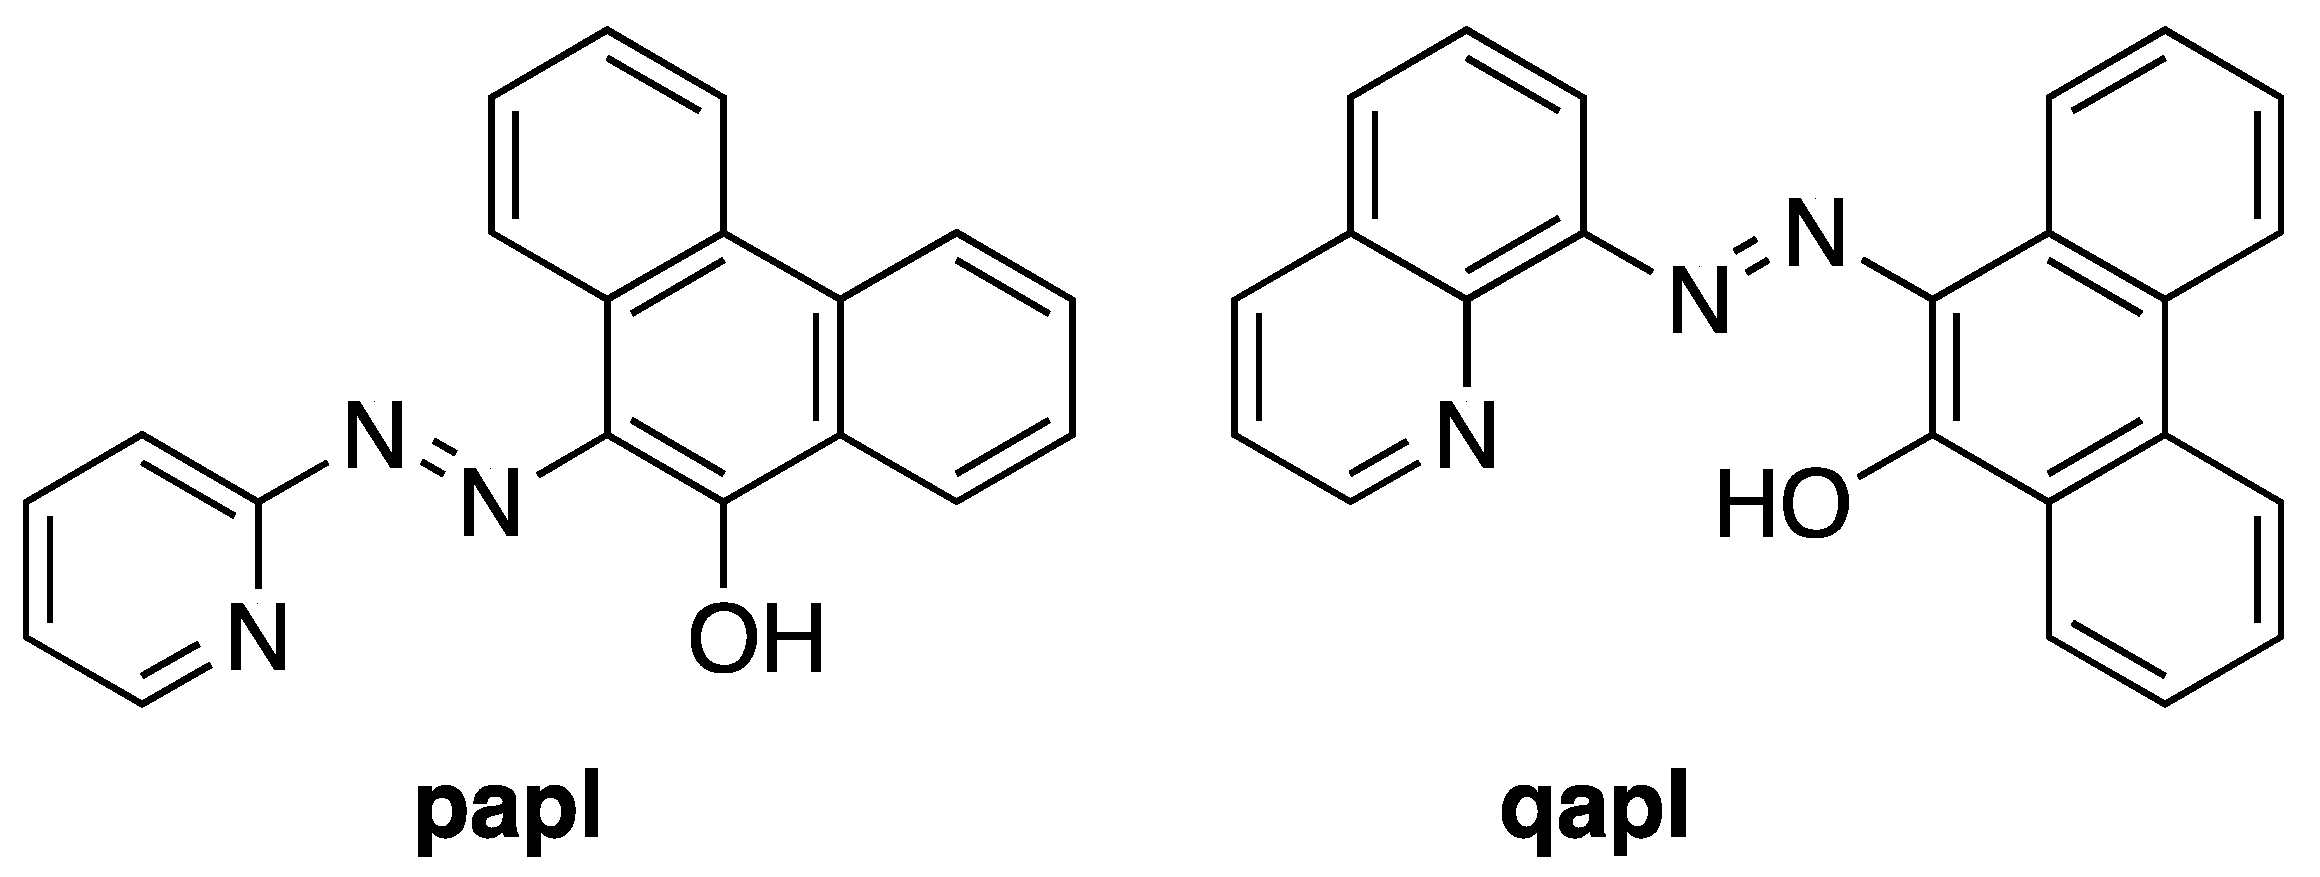
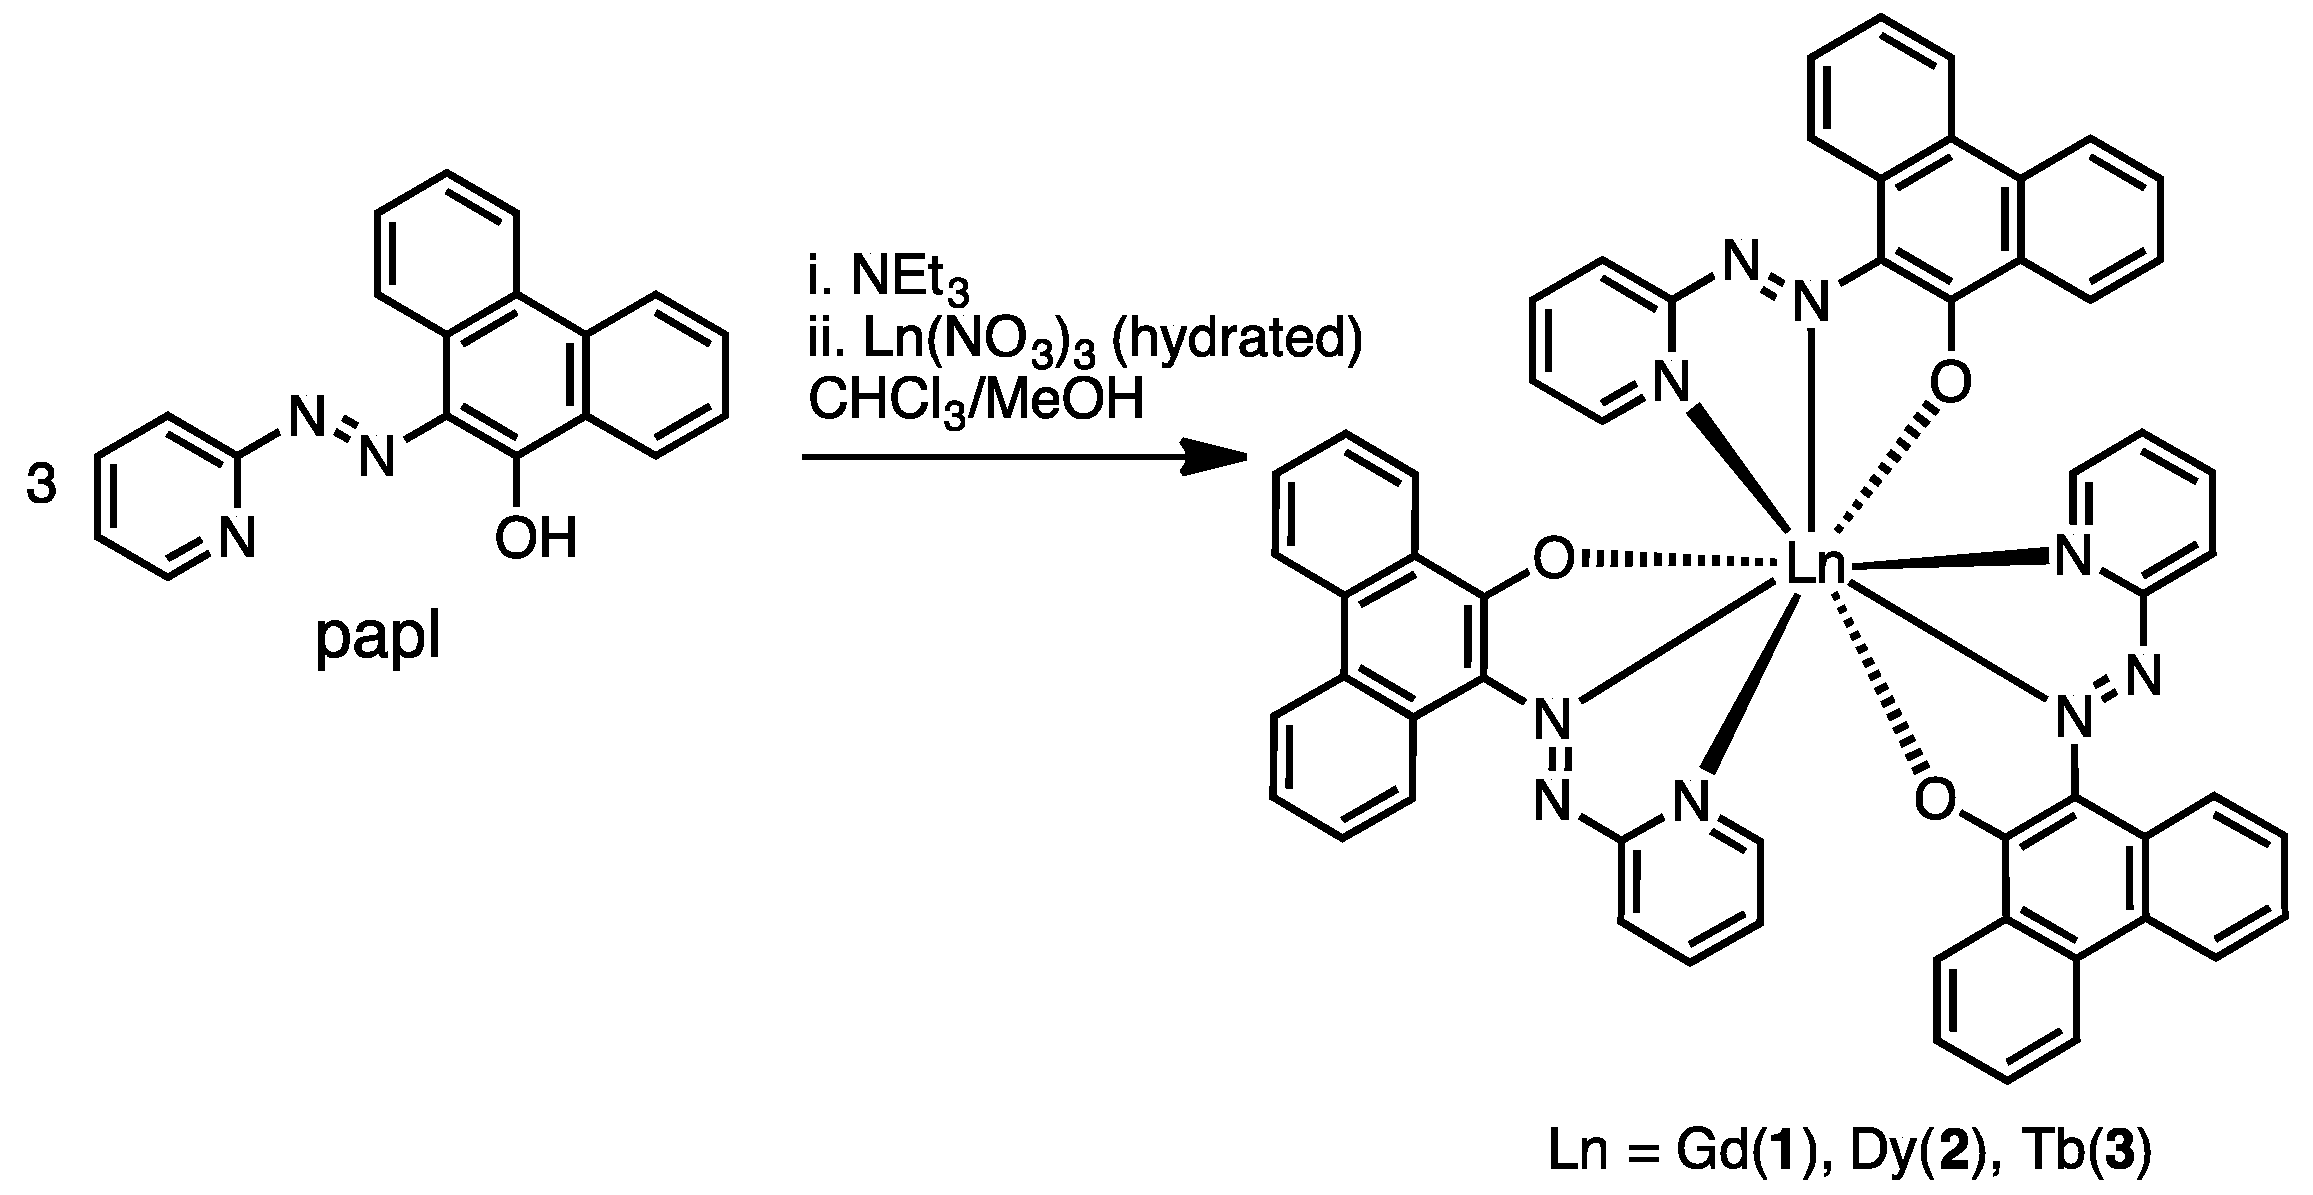
2.1. Preparation and Characterization of Ln(papl)3 Ln = Gd, Tb, Dy and Ho(qapl)3 Complexes

The Ln(papl)3 complexes were easily prepared by combination of the appropriate amount of lanthanide nitrate salt in methanol with a chloroform solution containing three equivalents of papl and triethylamine (Scheme 1). Stirring at room temperature precipitated out dark microcrystalline materials that are air/moisture stable. Unfortunately, multiple attempts to grow single crystals of the complexes for X-ray diffraction experiments were unsuccessful. Often, microcrystalline clusters or microspherical particles were formed by slow evaporation or diffusion experiments. However, it is clear from the results of combustion analysis and ESI mass spectrometry that complexes 13 bear the formulation Ln(papl)3. Dominant peaks are observed by ESI (Figures S1–S6) in all cases at high m/z that represent [Ln(papl)3H]+ with isotope distributions that match the theoretical calculated isotopic patterns; combustion analysis results are also consistent with this formulation (with the addition of chloroform for Tb3+ complex only). The FT-IR and UV–Vis spectra of 13 are identical, and similar electrochemical data are observed (vide infra), strongly suggesting that 13 share similar structural properties. It is likely that the molecular structure of complexes 13 consist of nine-coordinate Ln3+ ions in tricapped trigonal prismatic geometries, which have been observed previously for other tridentate NNO ligands, where each papl ligand is binding the lanthanide ion through pyridyl N, azo N and anionic phenanthrol O atoms [14]. Using a related ligand, qapl (Chart 1) [15], we prepared an analogous holmium complex Ho(qapl)3 4, which provided spectroscopic data that was similar to 13, including an ESI mass spectrum that indicated m/z corresponding to [Ho(qapl)3H]+. Single crystals of 4 were obtained by slow evaporation of DCM/CH3CN solutions of the precipitated powder. The molecular structure of 4 is shown in Figure 1 (crystallographic parameters can be found in Table S1). There is substantial disorder in the structure that was modeled using geometric constraints. One of the ligands is disordered over the twofold crystallographic axis and is essentially superimposed upon itself. While R1 is a little high (0.1087), we are confident in the overall atom connectivity and the coordinate bond features in the ordered parts of the molecule. The structural data confirms the nine-coordinate structure we suggested for Ln(papl)3 complexes and given the spectroscopic similarities between complexes 14 it is likely that the structures of complexes 13 are similar to 4. The coordinate bonds in 4 are shortest to the O donor atoms and longer to the Nazo and Nquin donors (Figure 1). The bond distances in the ligand are similar to those in [Co(qapl)2]Cl reported earlier and indicate a bound qapl phenolate anion [15].
The electronic spectra of the uncoordinated papl ligand and complexes 13 are illustrated in Figure 2. For the uncoordinated papl ligand, a keto-enol tautomerization exists (Scheme 2), with the iminoquinone tautomer being the major component, as found for related compounds [16]. In its absorption spectrum, ligand centered π–π* transitions (225–350 nm) are observed, together with a broad band (350–525 nm) with a higher energy shoulder (~400 nm) in the visible region. The latter feature is assigned to the n-π* transitions of the azo moiety [11]. The three Ln(papl)3 complexes present nearly identical UV-vis spectra, which feature ligand centered π–π* transitions (225–360 nm), and two overlapping broad bands with a higher energy shoulder (375–600 nm) in the visible region, assigned as intraligand charge transfer transitions (ILCT) [11,17]. The red shift observed for the transitions in the visible region upon the complexation of the lanthanide ions is in line with what has been reported for other papl complexes with divalent transition metal ions [11], as well as for lanthanide complexes with similar azo-type ligands [18]. This effect arises upon coordination, as only the enolate form of the ligand with the azo-type moiety exists with extended conjugation and a characteristic low lying azo-centered π*-orbital, which is also supported by the intense color of the complexes [9,11,16,18].

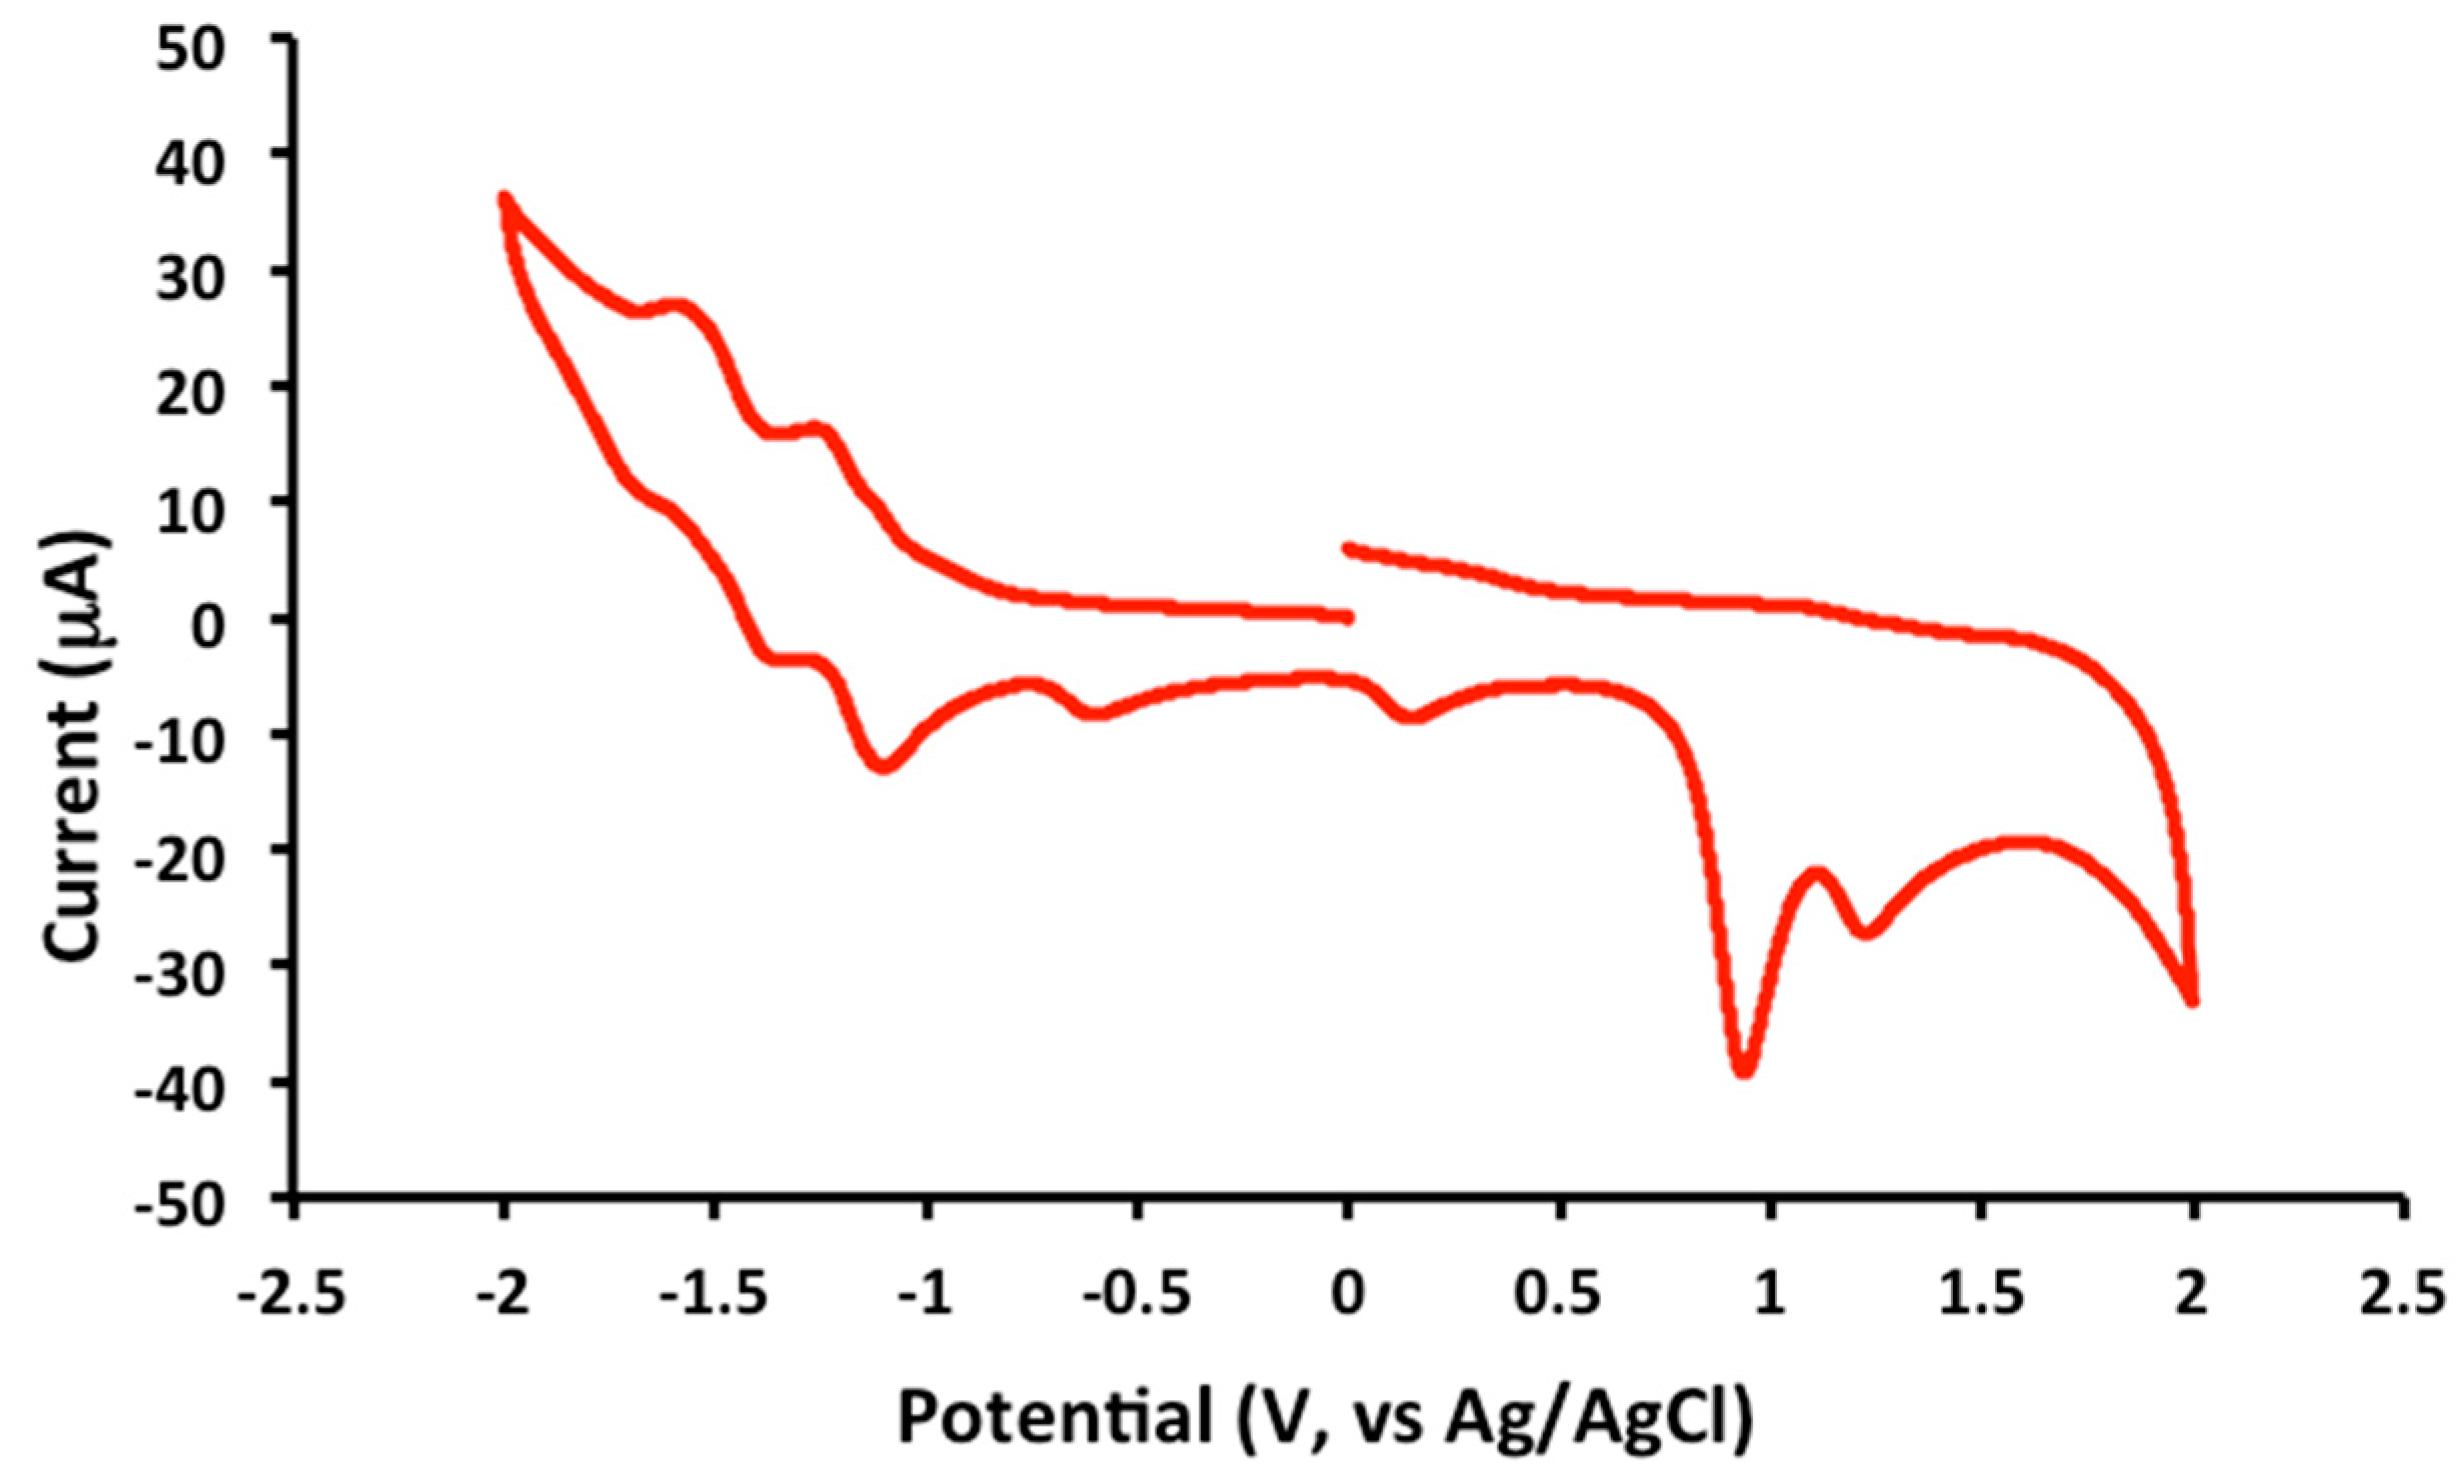
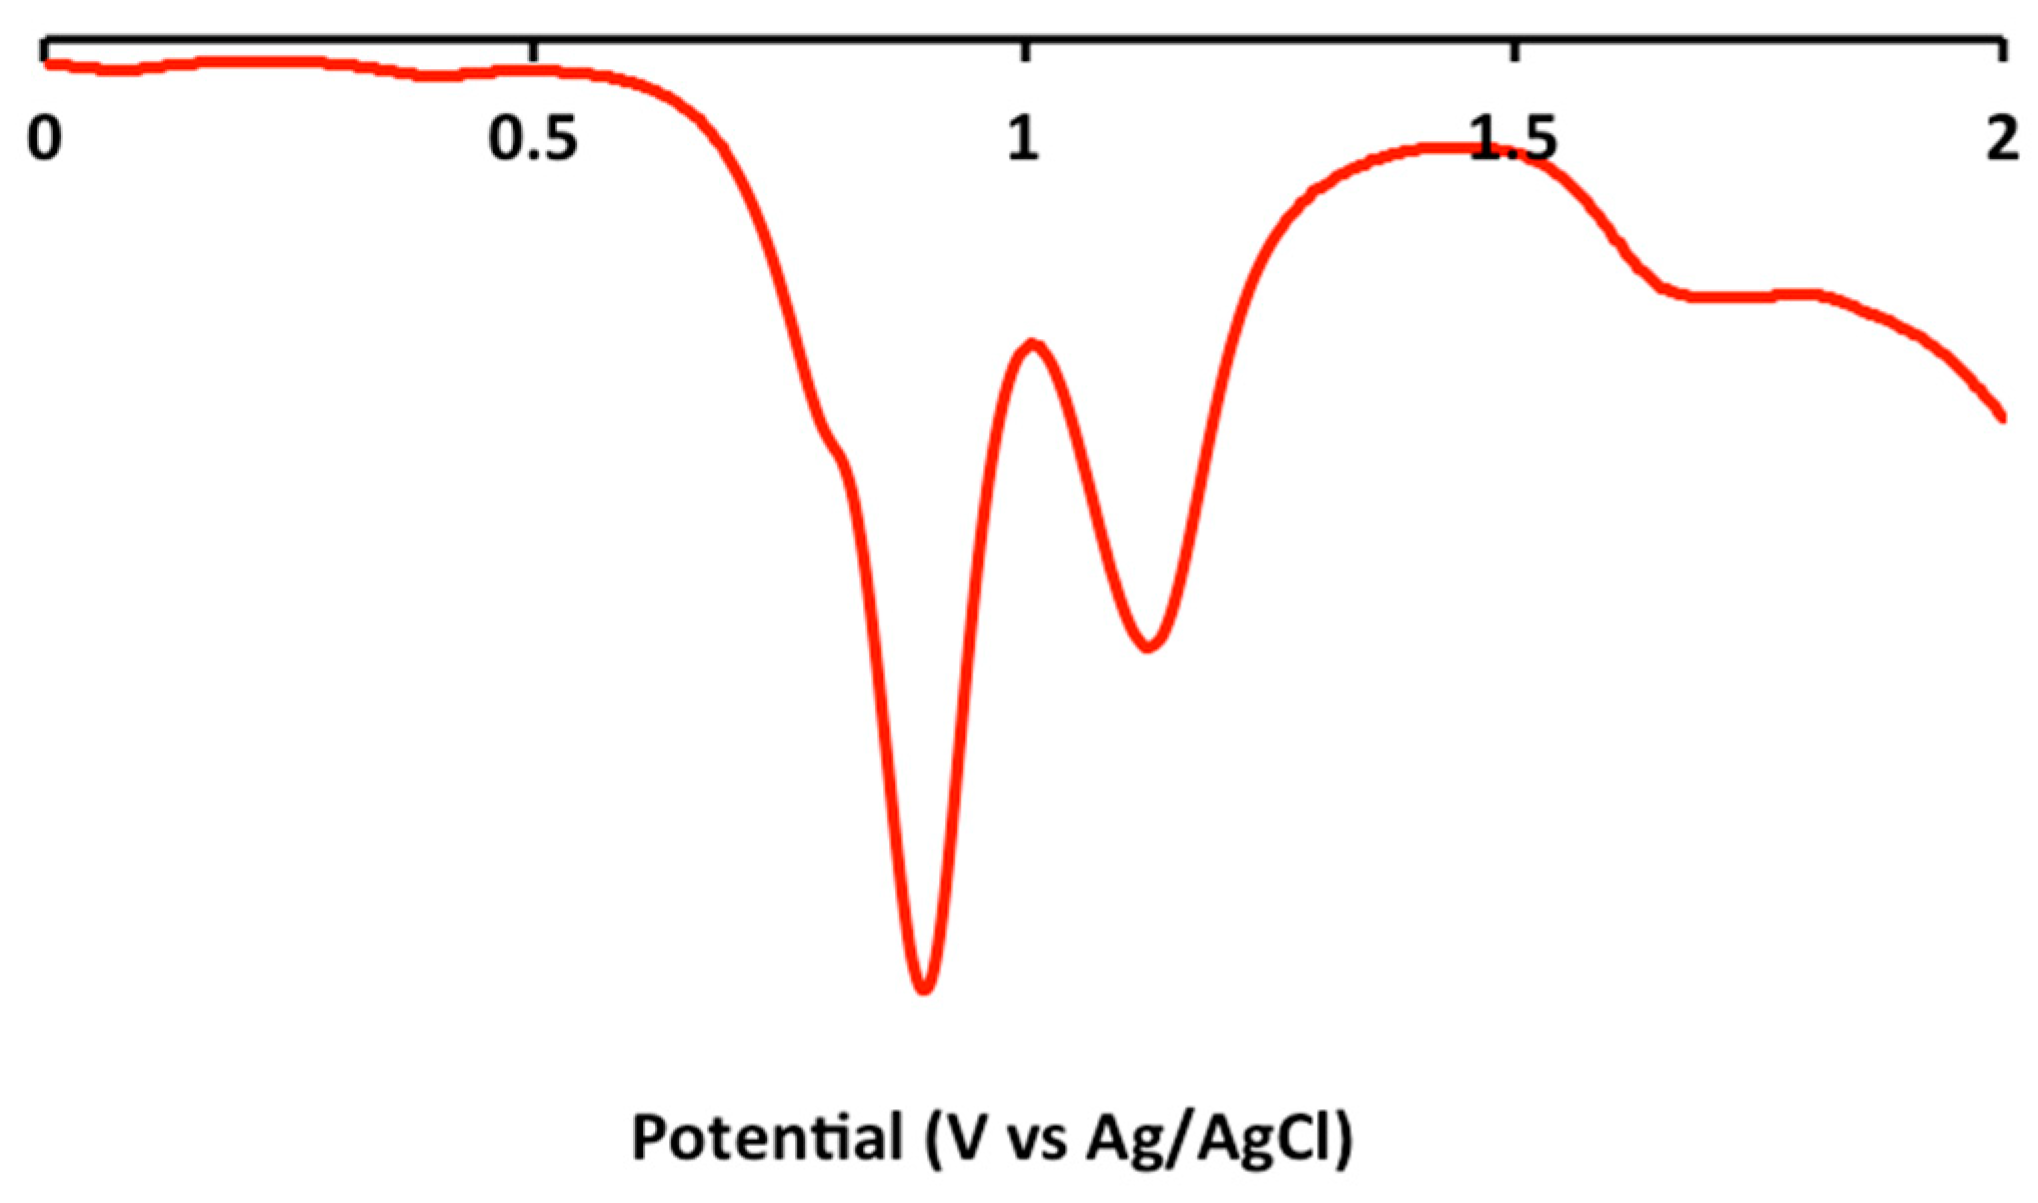
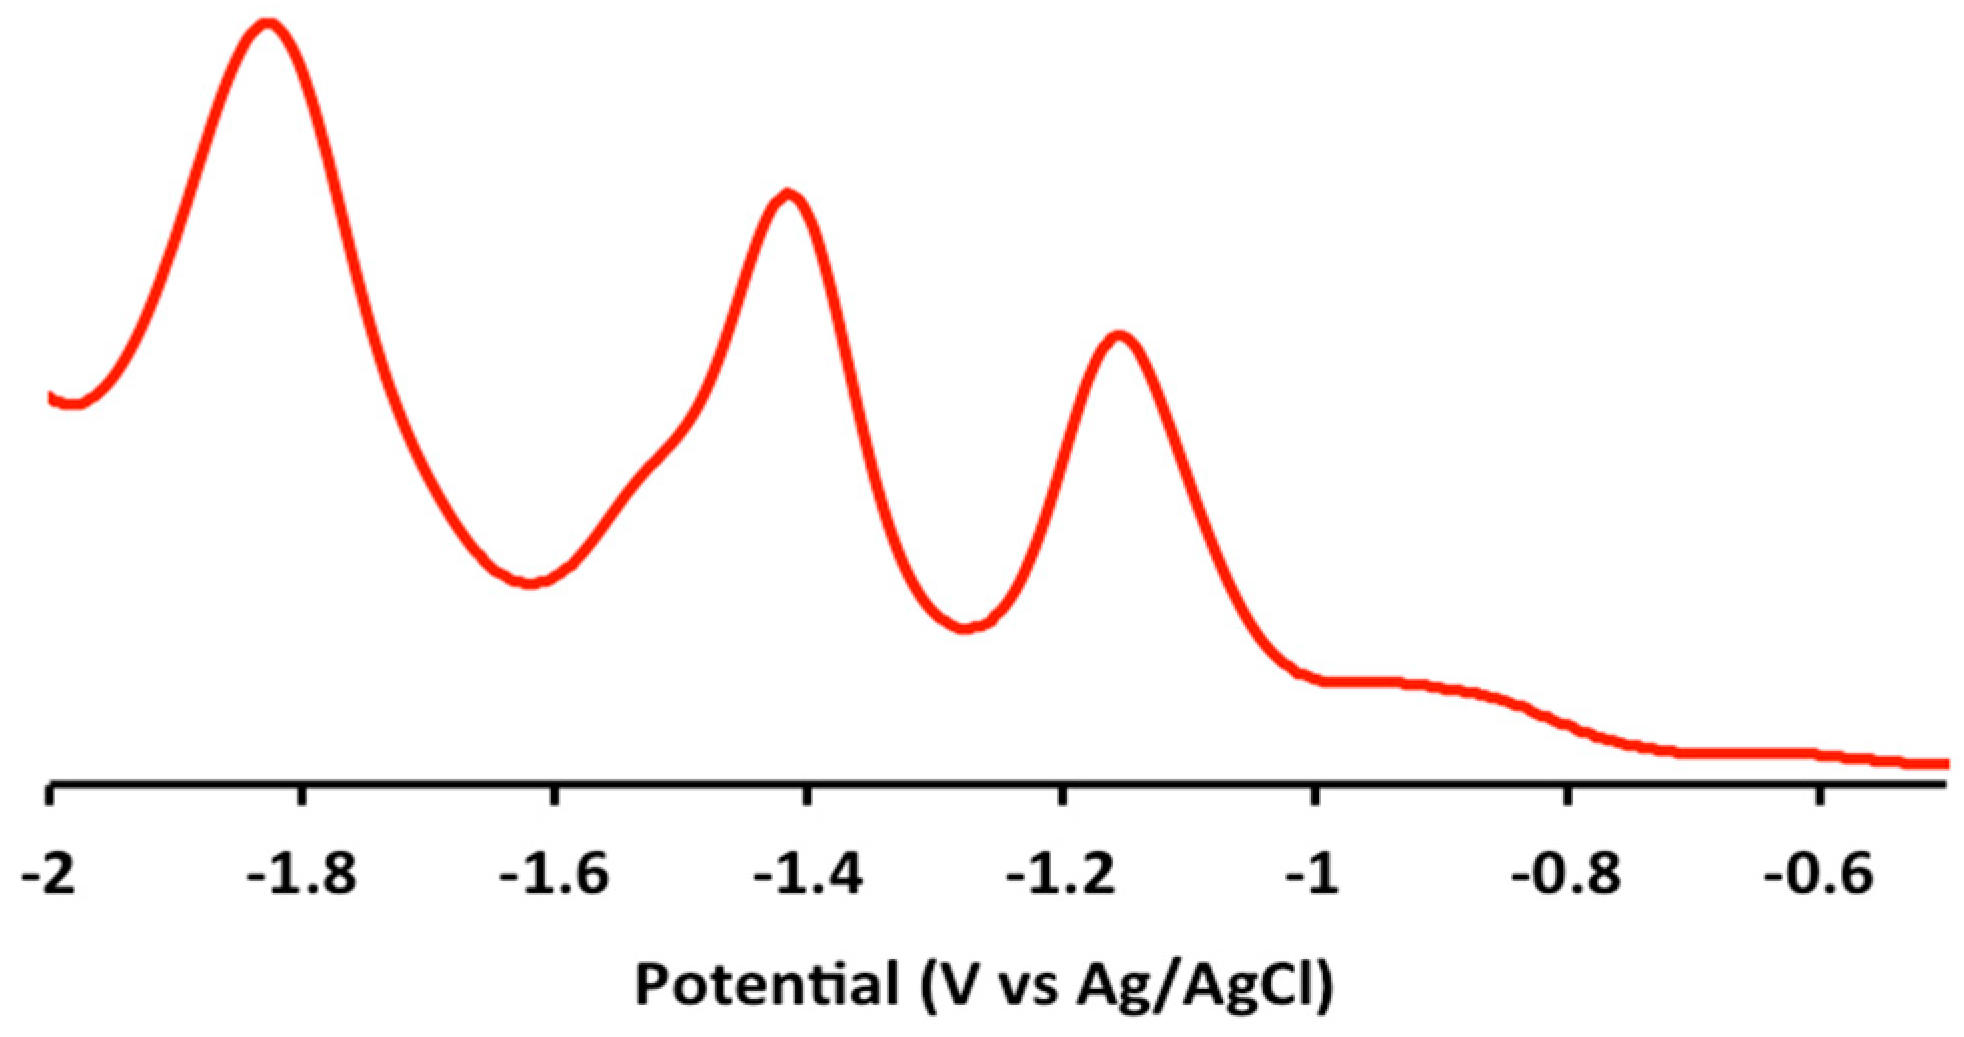
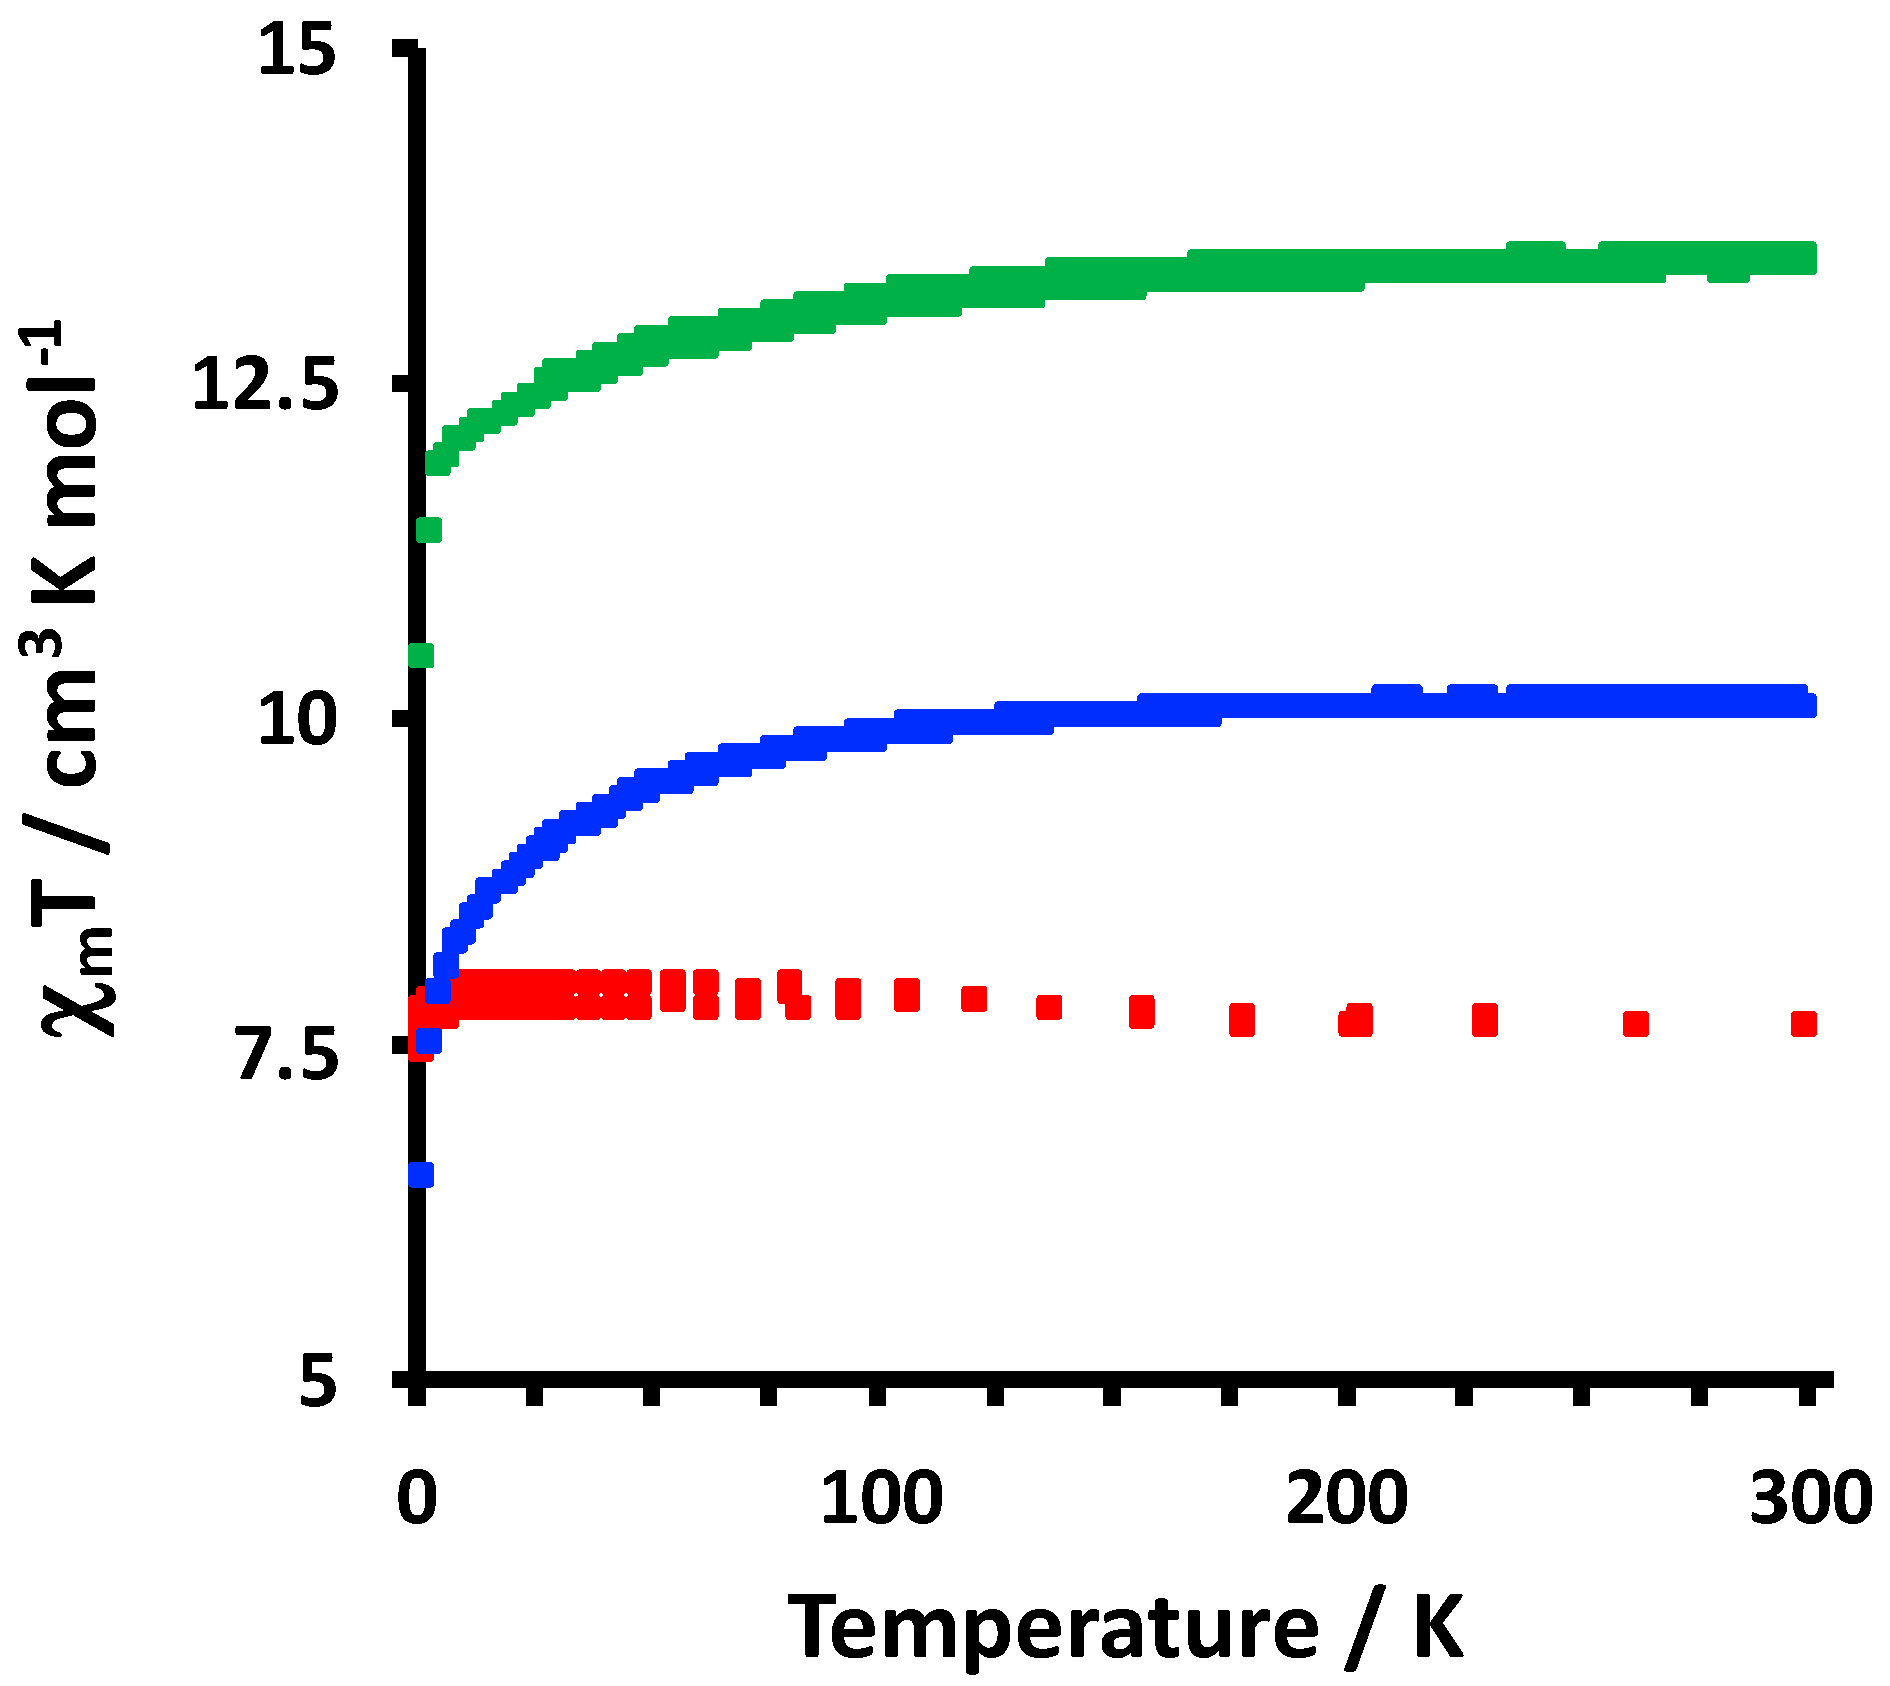
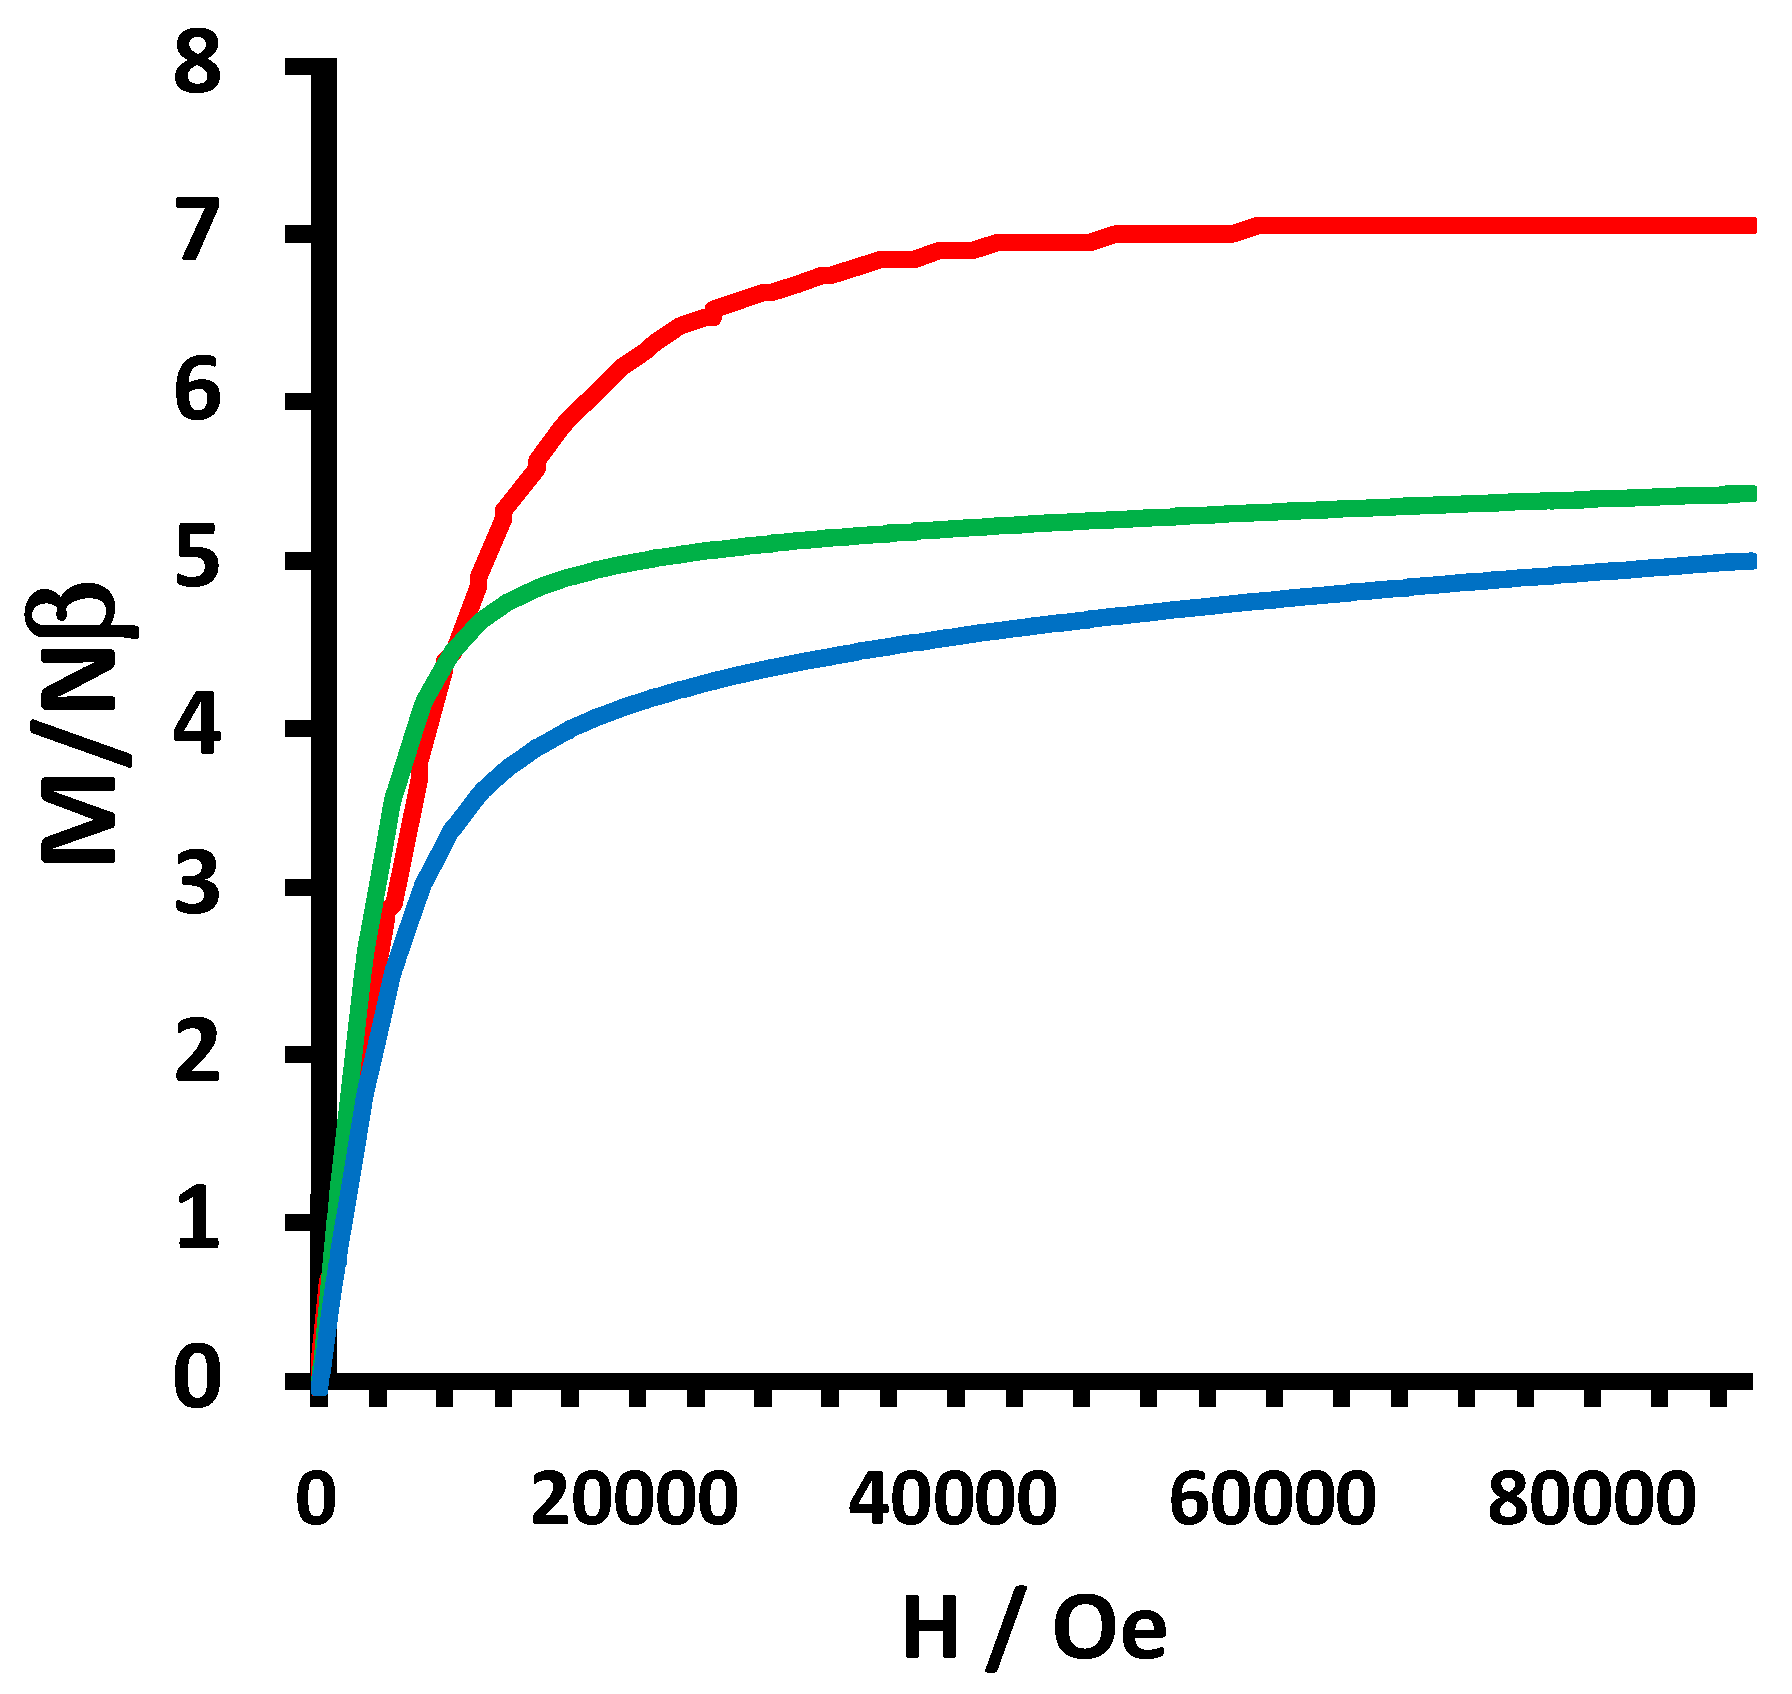
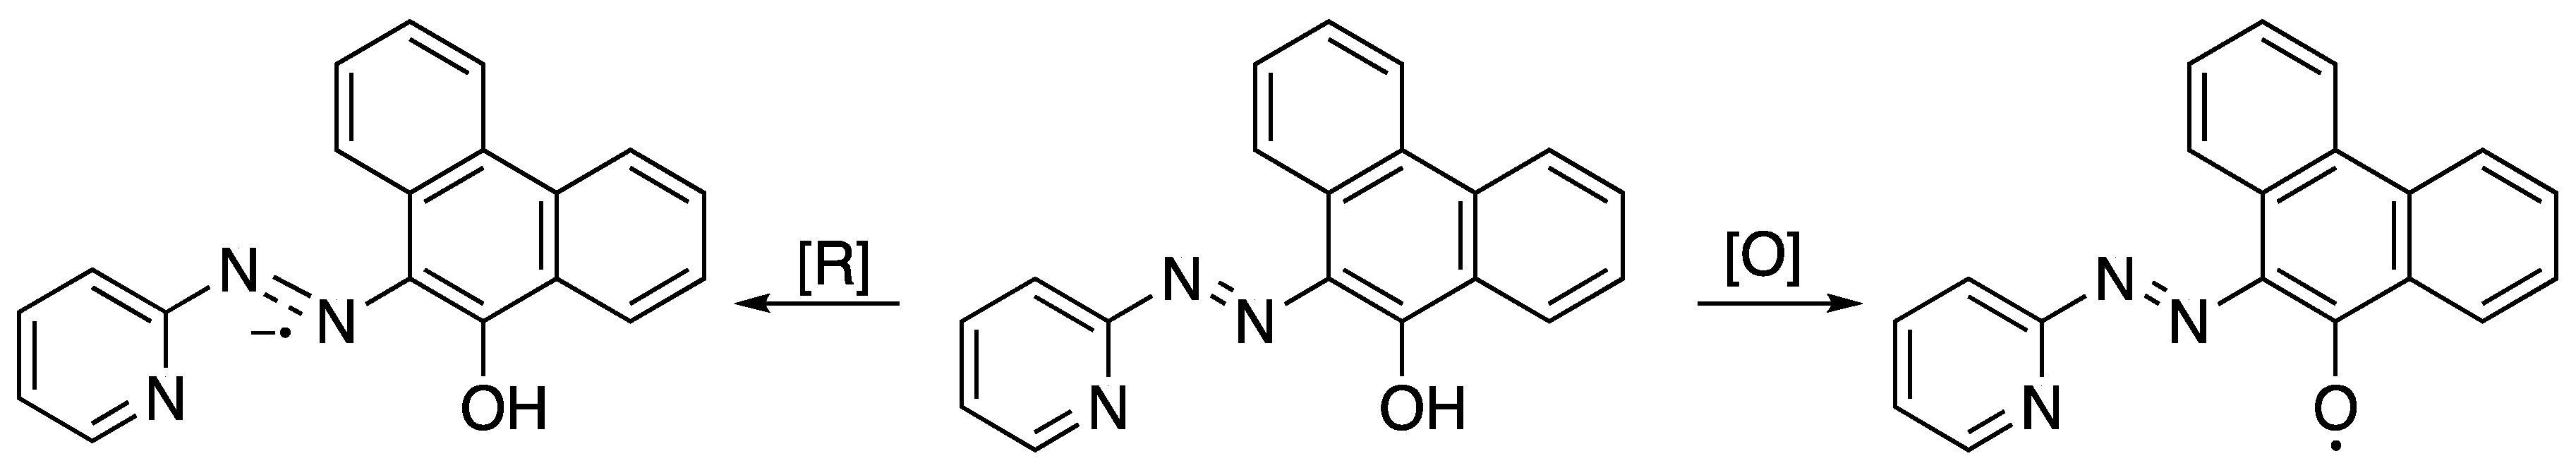
2.2. Electrochemical and Variable Temperature Magnetic Susceptibility Data

We have previously described the redox-activity of papl, in the uncoordinated form and when coordinated to transition metal ions [11]. The anticipated redox behavior of papl is summarized in Scheme 3. The electrochemical properties of 13 were investigated by CV and DPV and the results are shown in Figure 3, Figure 4 and Figure 5 for 1 and all data for 13 is summarized in Table 1 (cyclic and differential pulse voltammograms for 2 and 3 are provided in Figures S7–S12). All three complexes share very similar electrochemical properties, which result from ligand-centered redox processes. Over anodic potentials, irreversible waves are found at high potentials (>+0.9 V, vs. Ag/AgCl), likely resulting from papl oxidation, as observed in related M(papl)2 complexes [11]. Two quasi-reversible cathodic waves are observed at potentials beyond −1.0 V (vs. Ag/AgCl) for each of the complexes, which are assigned to ligand centered reduction processes. Complexes 1 and 3 exhibit a third irreversible process at very negative potentials (>−1.8 V) that is only observed in the differential pulse voltammogram. In M(papl)2 complexes the frontier molecular orbital structure is nearly exclusively papl in character, and similar behavior is anticipated for 13.
Variable temperature magnetic susceptibility experiments were conducted for all three complexes over a temperature range of 300-2 K at an external field of 2000 Oe on a Quantum Design PPMS (vibrating sample magnetometer option) for 1 and on a Quantum Design MPMS squid magnetometer for 2 and 3. The data obtained from samples of 13 (Figure 6) support the formulation as Ln(papl)3, with free-ion type magnetism characteristic of the Gd(III), Dy(III), or Tb(III) terms (8S7/2, 6H15/2, or 7F6) exhibiting typical χmT values at 300 K of 7.6, 13.3, and 10.0 cm3 K mol−1 for 13, respectively. At low temperatures, there are observed minor deviations from the above χmT values, primarily 2 and 3, indicating depopulation of Stark sublevels at these lower temperatures. Magnetization versus field experiments (Figure 7) at low temperature (2K) were also performed on all three complexes. Preliminary AC SQUID experiments indicated no out-of-phase peaks at zero external field or in an external DC field; therefore, 13 do not exhibit slow relaxation of the magnetization, which is a characteristic feature of lanthanide single ion magnets (SIMs).

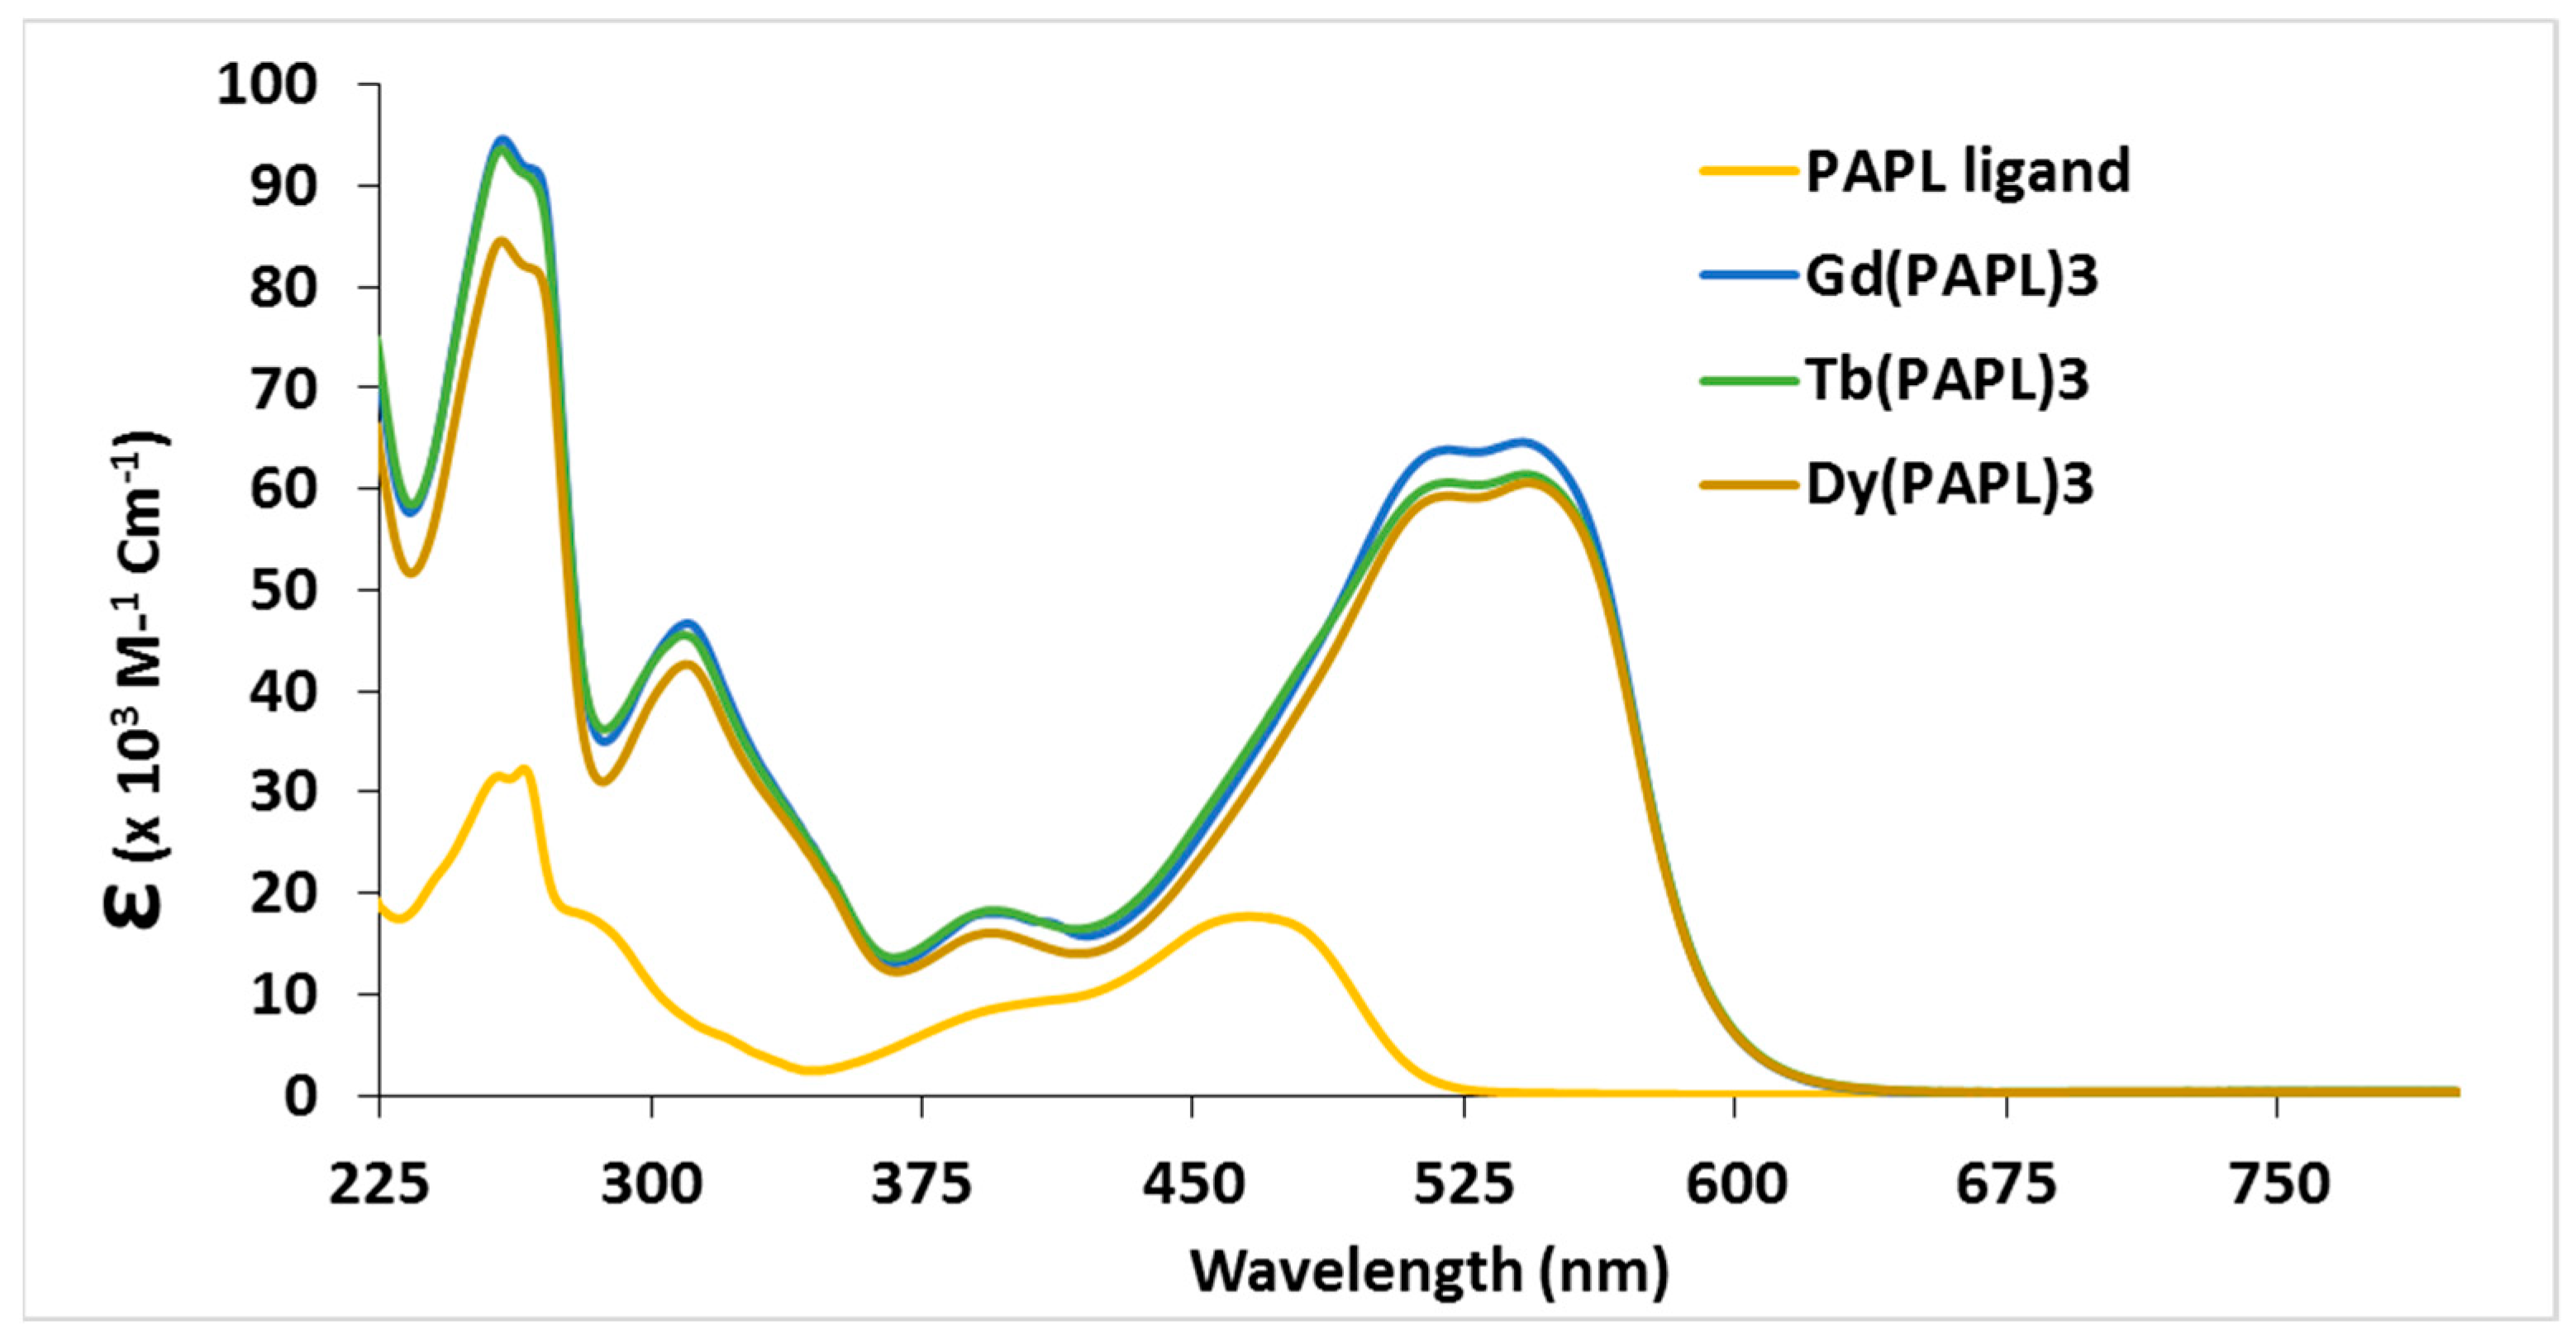
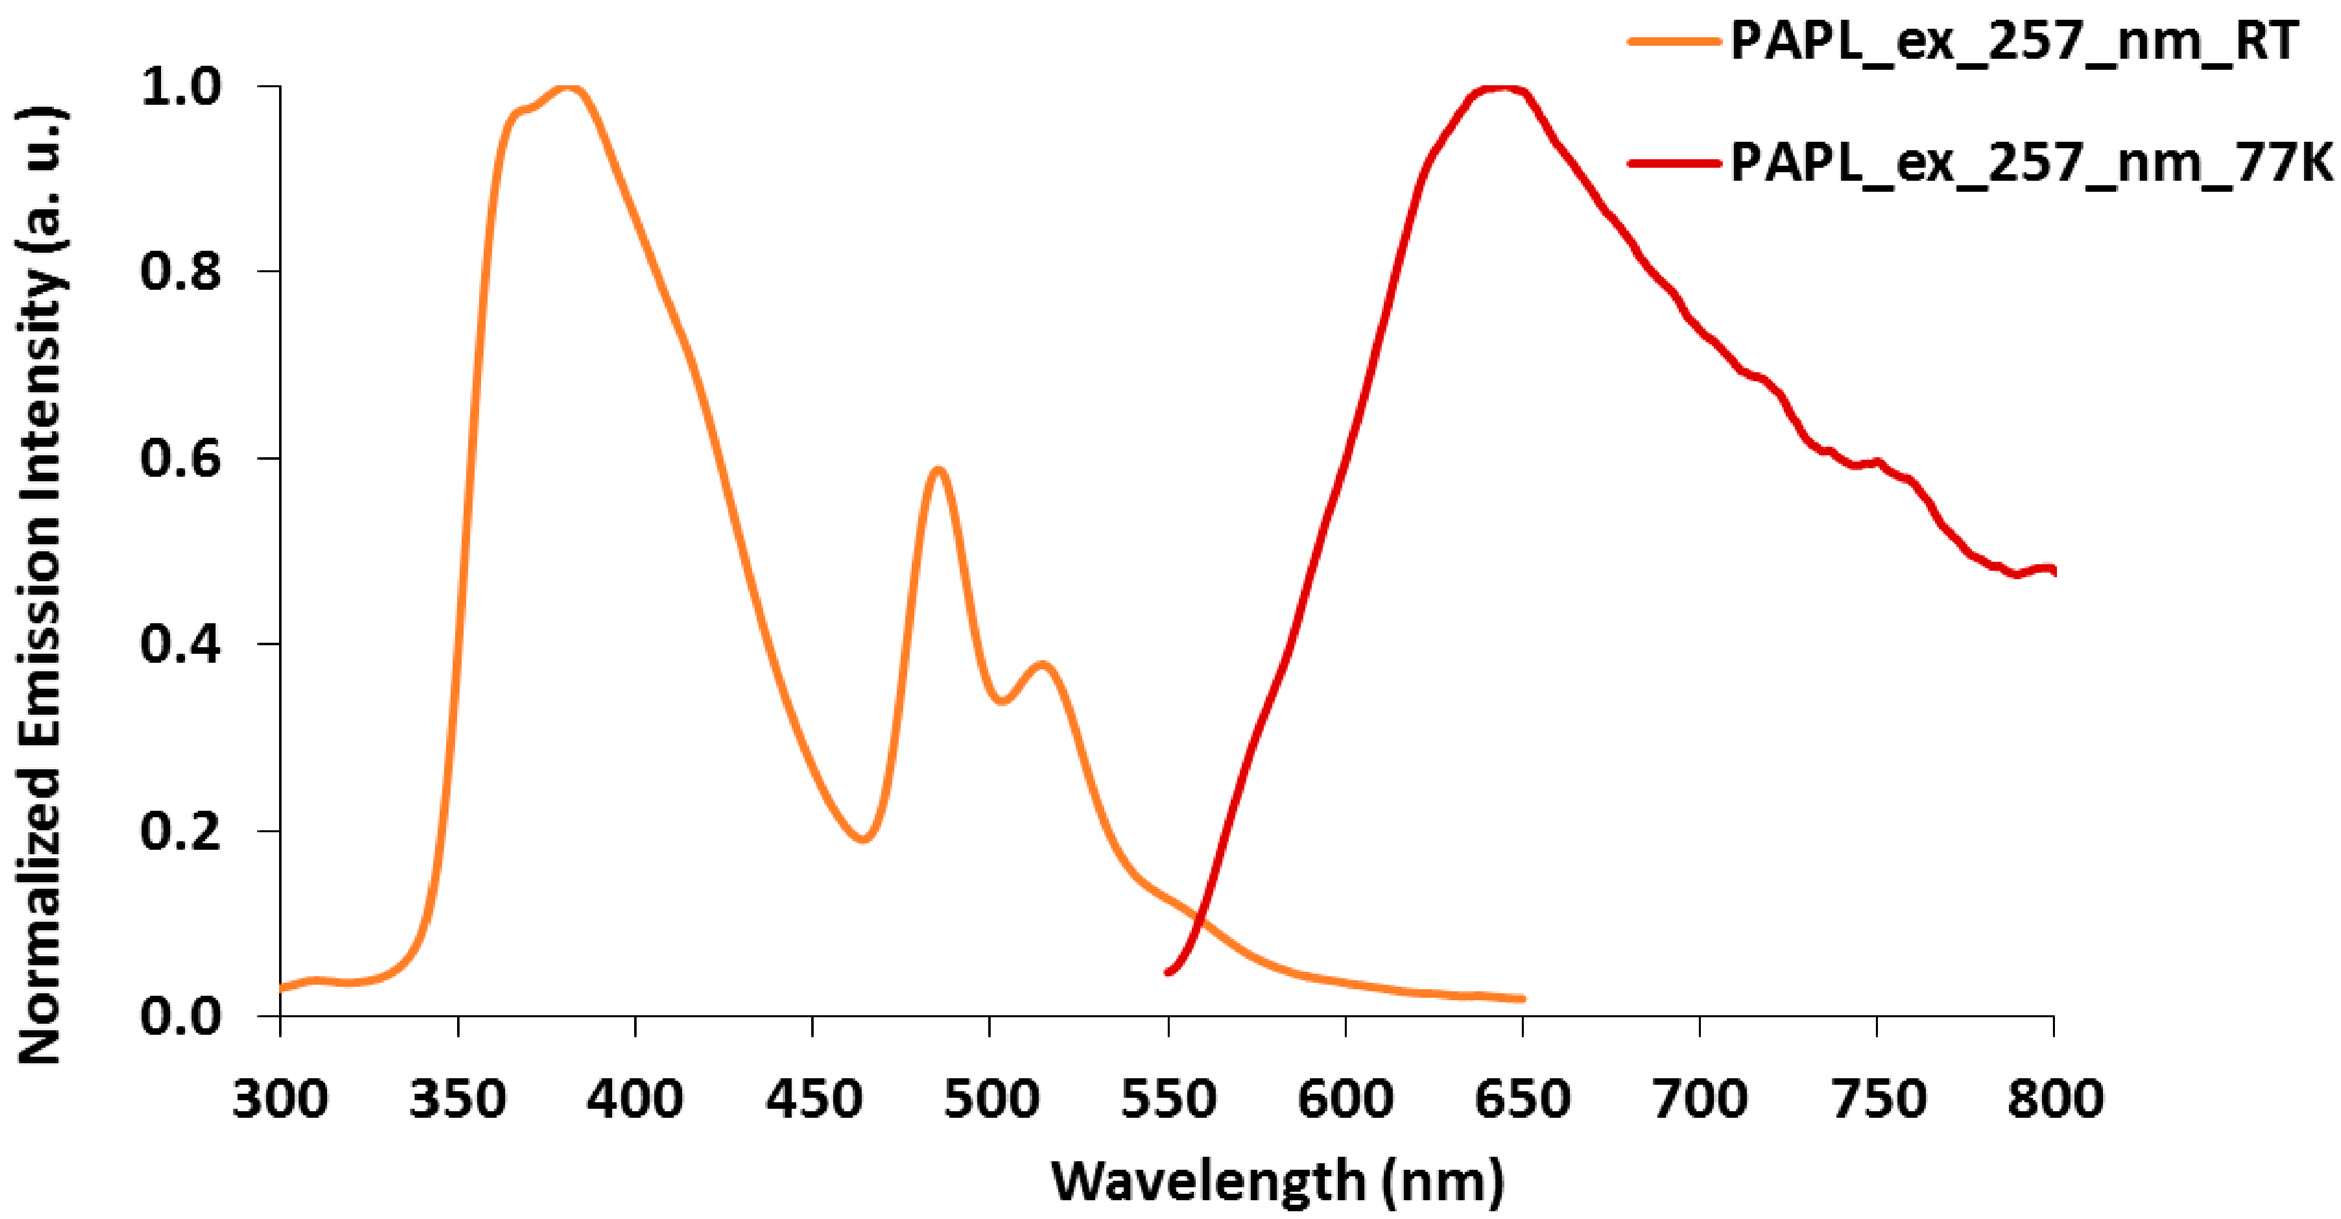
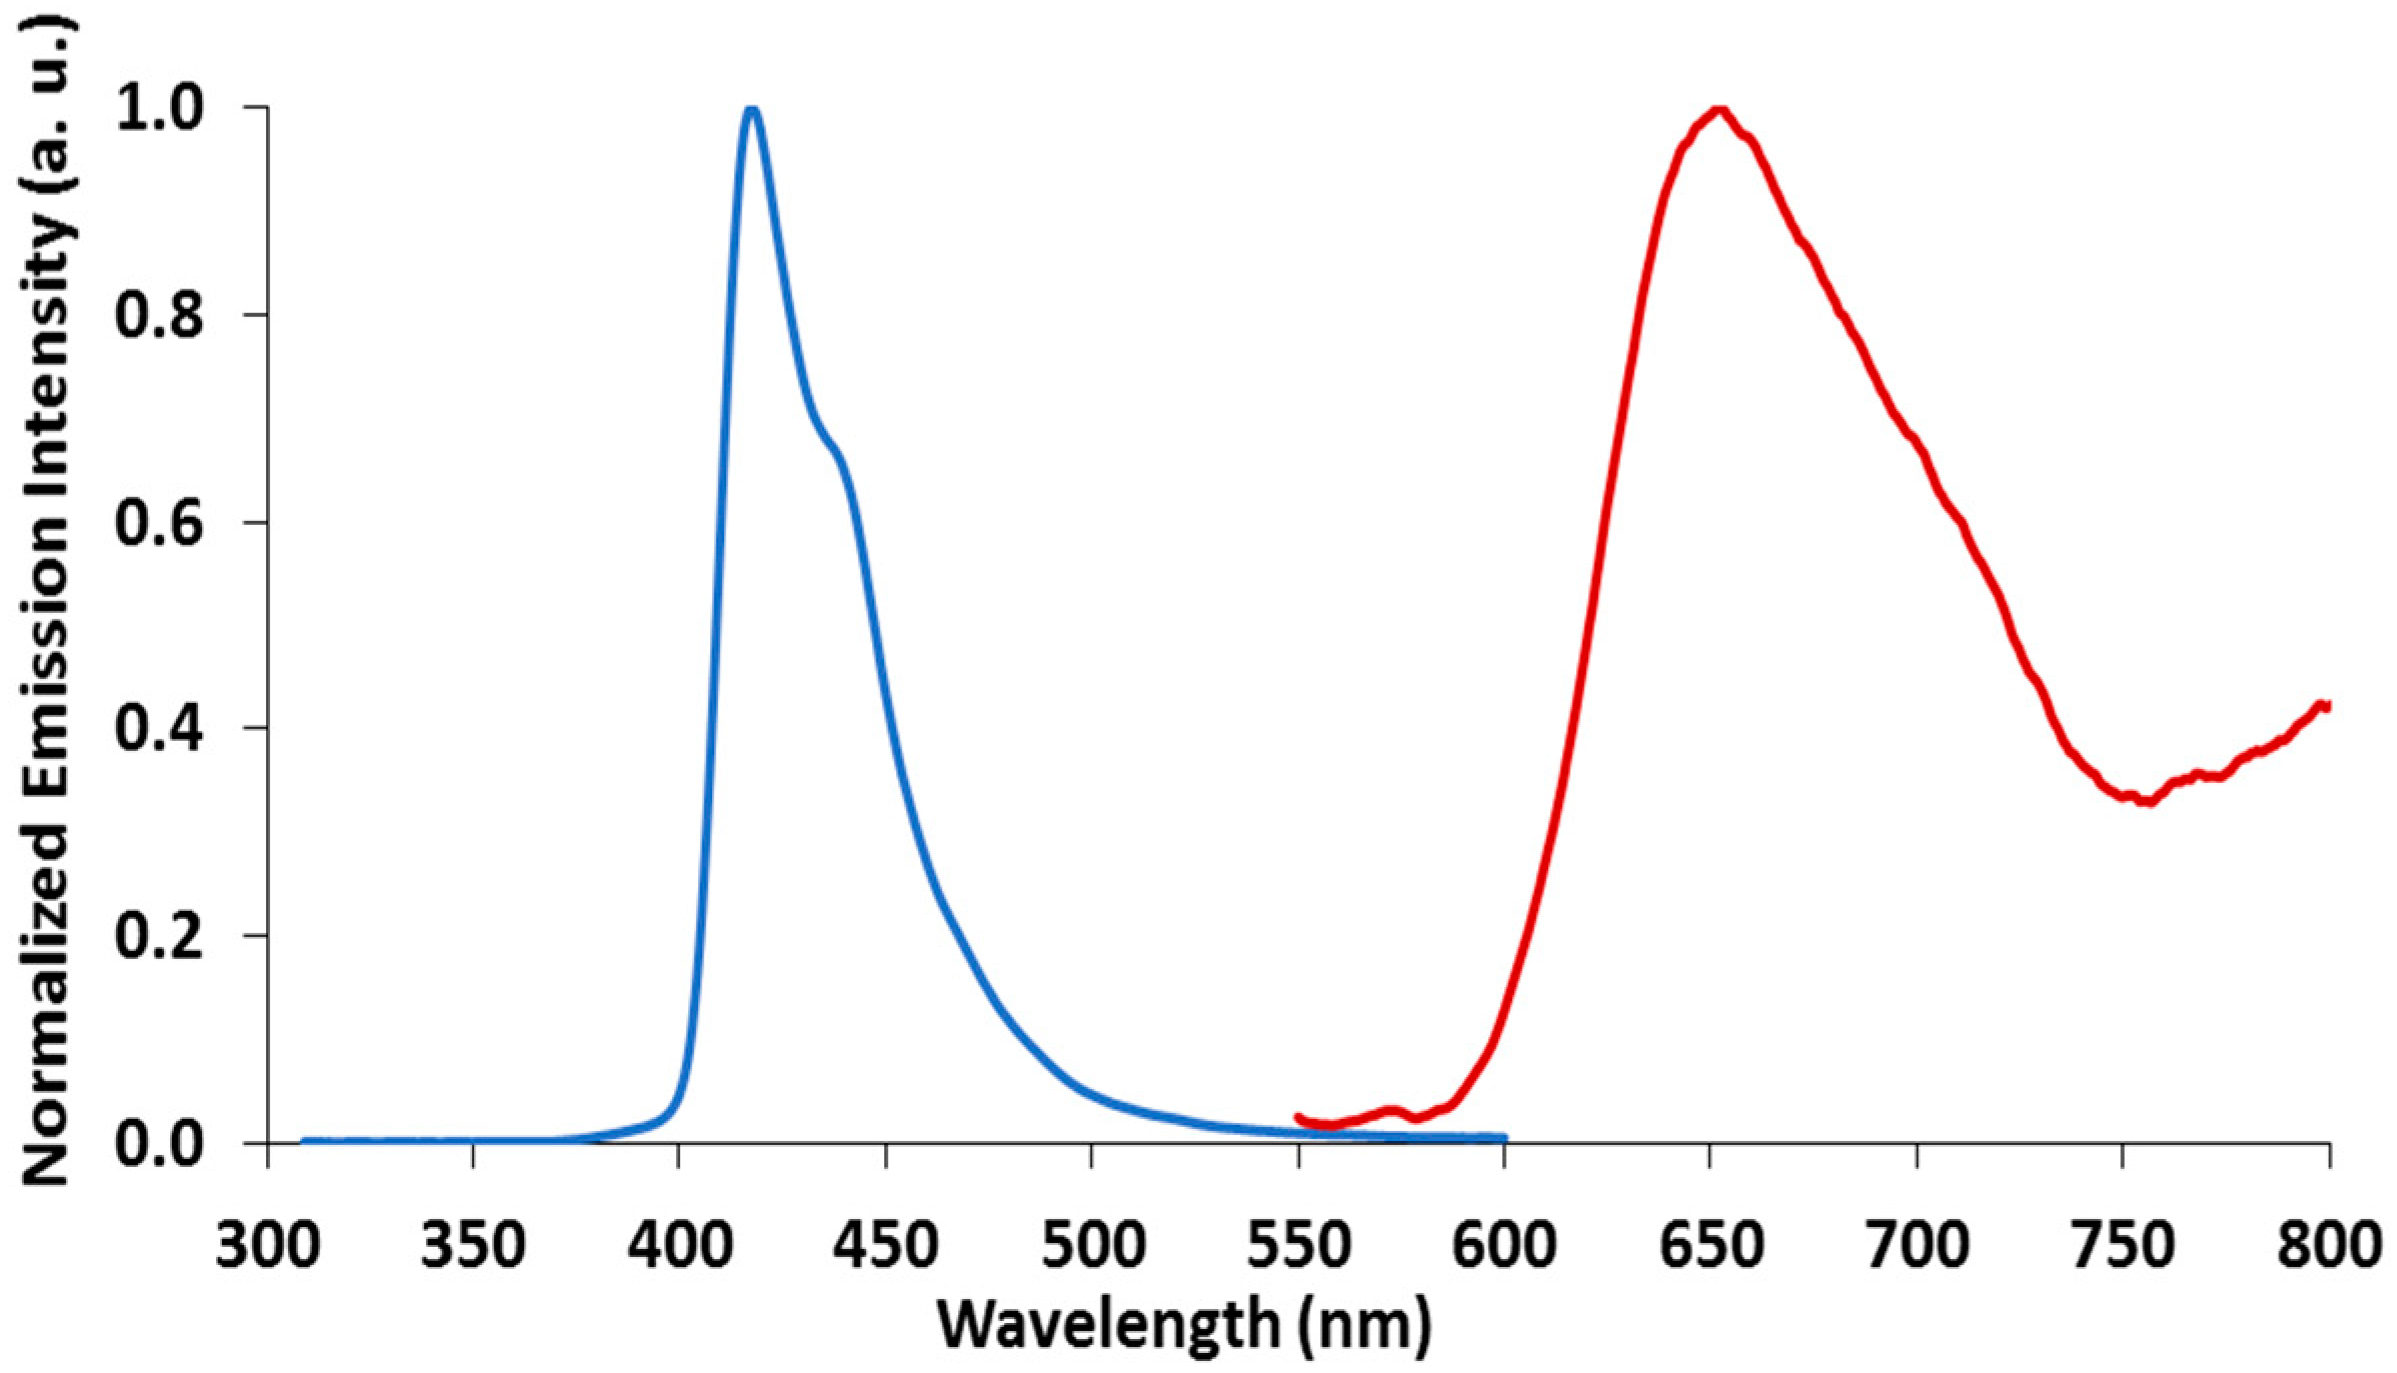
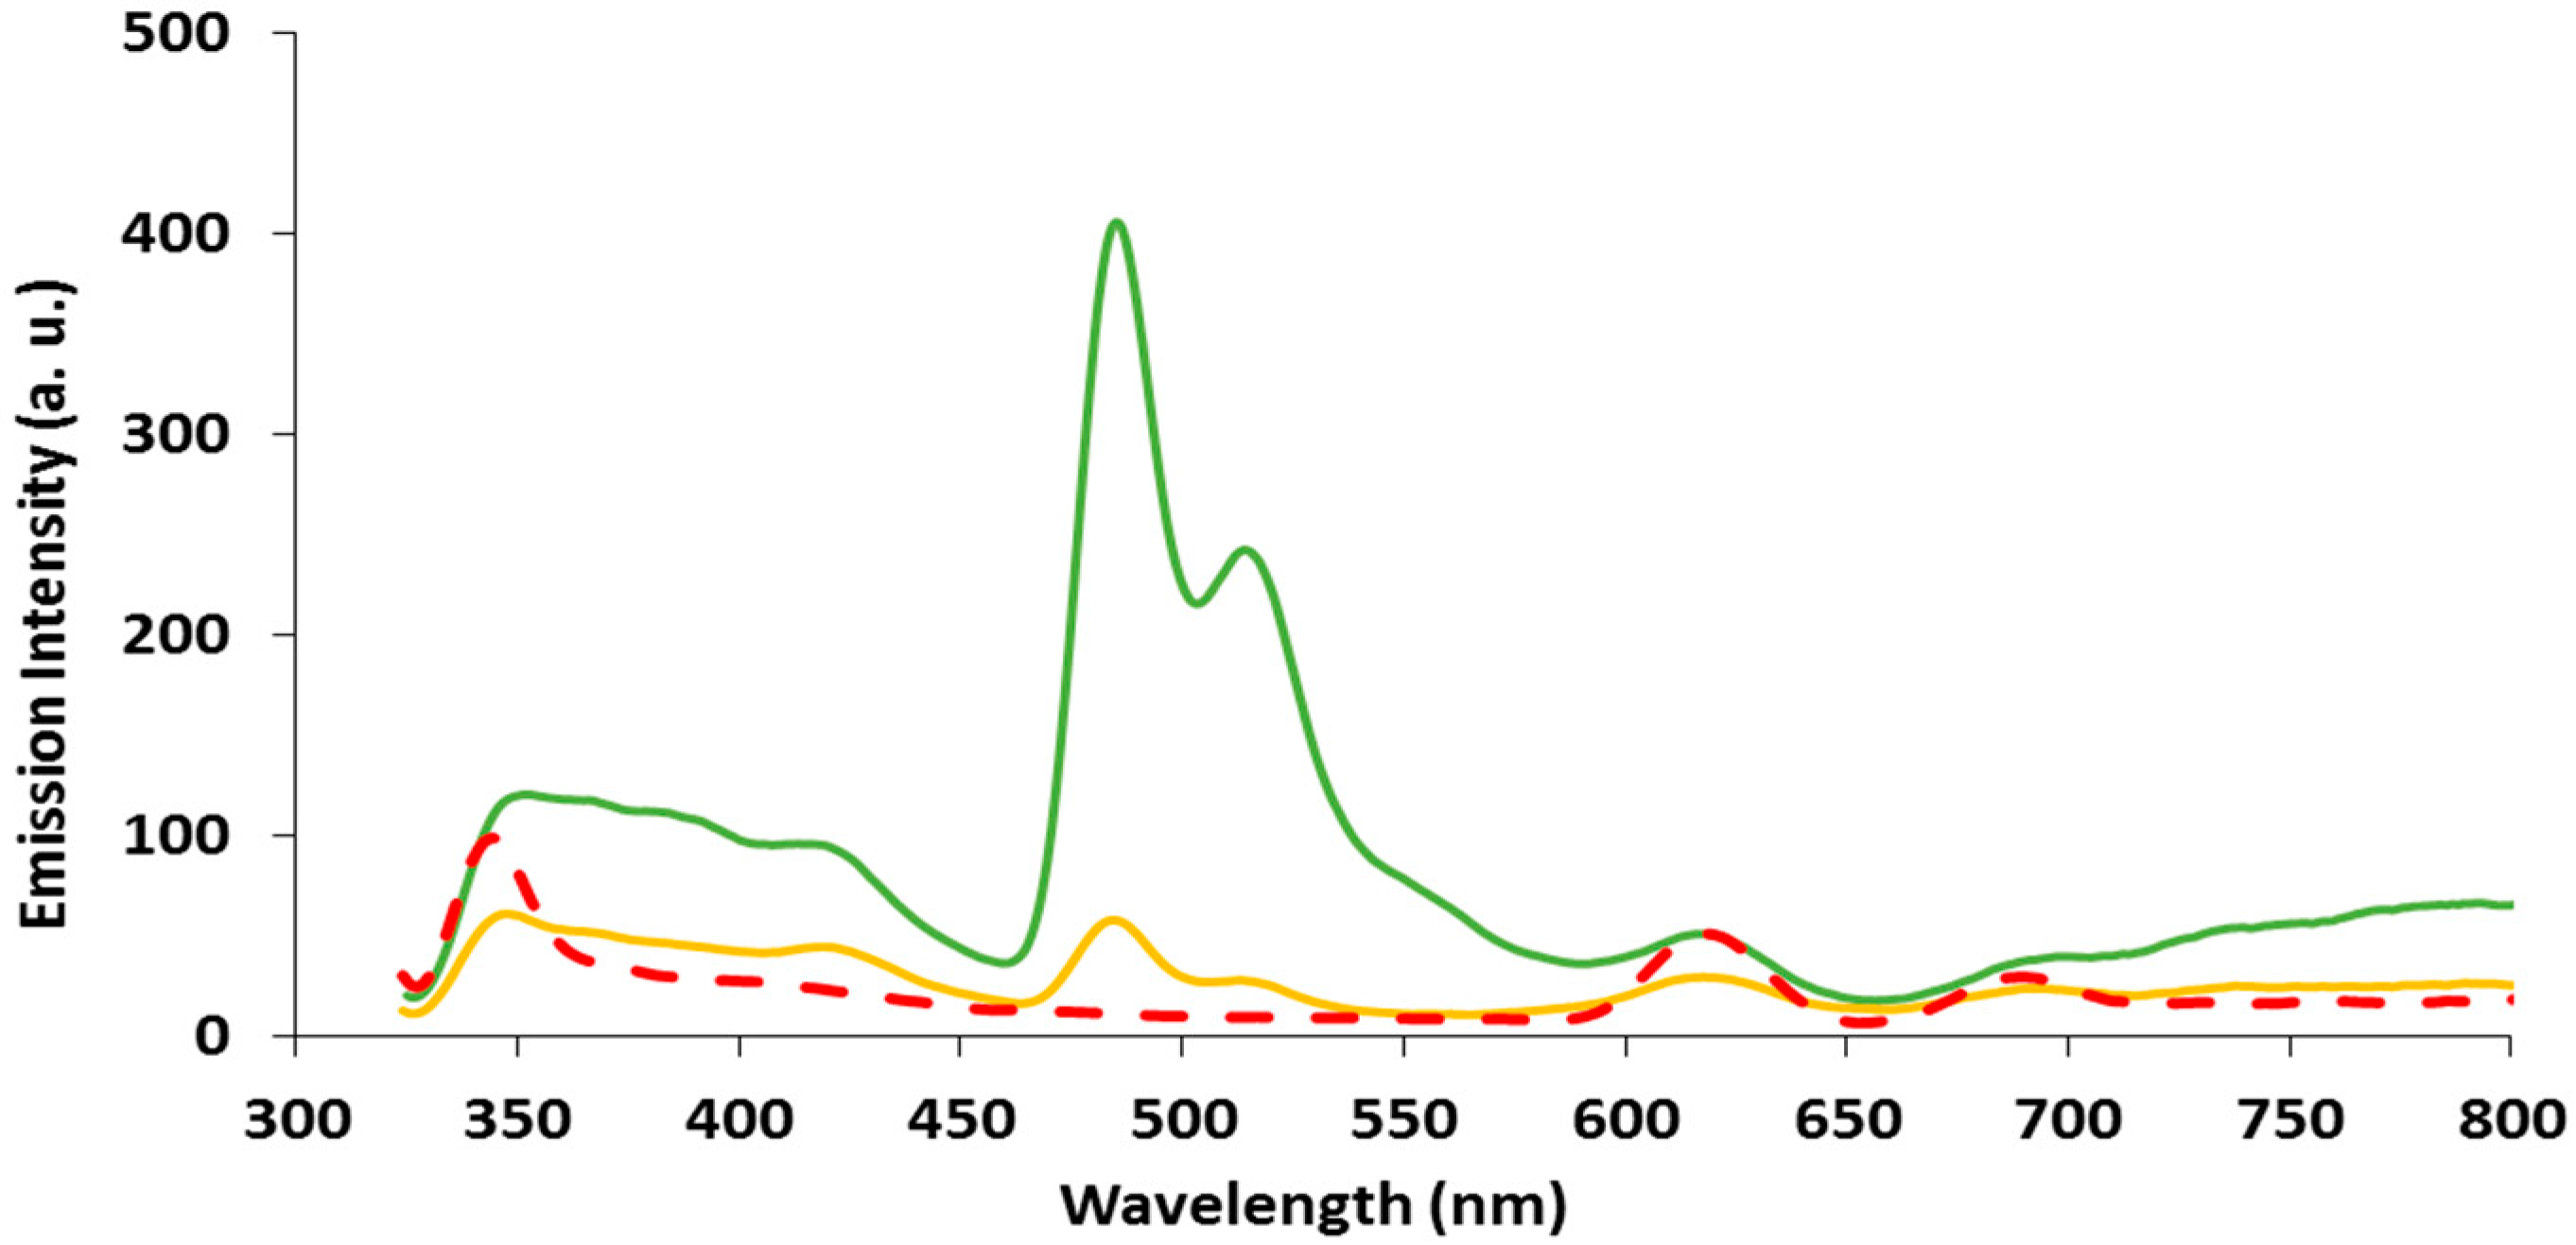
2.3. Emission Spectroscopy of papl and 1–3

Figure 8 shows the emission profiles of the papl ligand in CH2Cl2 at room temperature and at 77 K. The emission spectra of the papl ligand obtained while screening different excitation wavelengths (λexc = 257 to 600 nm) are presented in Figures S13–S15. Emission is not observed upon excitation of the free papl ligand in the lowest energy absorption band (Figure S14). This observation was previously reported for azo-type compounds and it was explained by the generation of a very polar excited state relaxing non-radiatively, associated with photochemical isomerization [19]. However, excitation at higher energy leads to dual emission at room temperature (Figure 8 (orange line) and Figures S13 and S14): a high energy band (325–425 nm) (with vibronic structure of similar energy (λmax = 365, 384, 419, and 442 nm), and a lower energy band (425–600 nm) also featuring vibronic structure of similar energy (λmax = 490, 517, and 560 nm). At low temperature (77 K), the emission profile of the papl ligand consists of a broad band (550 nm–750 nm) without vibronic structure with λmax = 645 nm. This very interesting and very complex emission profile of the free ligand results from a combination of multiple functionalities in its structure (e.g., azoaryl, phenanthrol and pyridyl moieties, including keto-enol forms), each of which may display a specific characteristic behavior upon excitation. Based on related systems [19], the high energy band (325–425 nm) is a locally excited (LE) state together with radiative relaxation from a mixing of higher S and T. The emission of complex 1 confirms the triplet emission energy (see below). The lower energy band (425–600 nm) is assigned to intramolecular change transfer states.
Figure 9 displays the emission profiles of 1 in CH2Cl2 at room temperature and at 77 K. The emission spectra of 1 obtained while screening different excitation wavelengths (λexc = 257 to 600 nm) are presented in Figure S16. The emission profiles for 2 and 3 are shown in Figure 10 and Figures S18–S26. In complexes of Gd(III), the high energy of the excited level of Gd(III) ion (6P7/2, 32,200 cm−1) renders energy transfer from the ligand triplet state to the metal state impossible, while the heavy ion effect promotes the phosphorescence of the ligand. Therefore, these complexes are usually used to estimate the triplet energies of ligands [20]. Thus, the lowest triplet energy of the papl ligand (17,000 cm−1 or 590 nm) was determined from the short-wavelength band edge of the phosphorescence spectrum of complex 1 at 77 K. As is the case for the uncoordinated papl ligand, no emission is observed in complexes 13 when excited in the lowest energy absorption band (Figures S16, S18 and S19). When excited at higher energies, complexes 13 show only ligand-based emission at both room temperature and 77 K (Figure 9 and Figure 10 and Figures S16, S18 and S19). The characteristic narrow-line emission from the excited levels of Tb(III) and Dy(III) ions [21] is not observed. The triplet energy of the papl ligand (17,000 cm−1) is lower than the excited levels of Tb(III) (5D4, 20,400 cm−1) and Dy(III) (4F9/2, 20,600 cm−1) [20], therefore, these lanthanide ions are not sensitized by the papl ligand.
Complex 1 in CH2Cl2 solution at room temperature (Figure 9, blue line) exhibits ligand-based emission at 419 nm when excited at higher energies (257 nm to 394 nm)—this state could be a higher triplet level of the ligand or a mixing between a higher singlet and a higher triplet (in the case of incomplete intersystem crossing at room temperature) or another type of excited state (e.g., intramolecular charge transfer) capable of relaxing radiatively. The energy of this level is estimated at 24,200 cm−1 (Figure S17). An enhancement of the emission intensity of this band with respect to the ligand is also observed for [Gd(papl)3], as well as the disappearance of the emission band at 425–600 nm. The Tb(III) and Dy(III) complexes exhibit very weak ligand-based emission: the high-energy band decreases with respect to the Gd(III) analog and the papl free ligand, while the low-energy band is the main feature of their emission spectra. However, the emission from this state(s) is partially quenched in the Tb(III) analog, and almost totally quenched in the Dy(III) analog, vs. the papl ligand and its Gd(III) complex. As mentioned before, the energy gap between the lowest energy excited (emissive) state of the metal ion and the ground state for Gd(III) ions (6P7/28S7/2) equals 32,200 cm−1, which is much higher than the energy of the excited state exhibiting emission at room temperature in 1 (24,200 cm−1), thus explaining the absence of the quenching of the emission for this state [20]. In the case of Dy(III) and Tb(III) complexes 2 and 3, the quenching mechanism is not clear. The presence of Dy(III) or Tb(III) ions could contribute to the quenching of the ligand-based emission through the enhancement of inter-system crossing (ISC) to the lowest triplet state of the papl ligand, as expected based on the heavy ion effect. This latter state is thermally deactivated at room temperature, presumably by vibrational quenching, but it is emissive at 77 K, as proven by the emission profile of the Gd(III) complex (Figure 9 and Figure S26). The absence of the same type of emission profile for Dy(III) and Tb(III) complexes at 77 K strongly suggests that other quenching pathway(s) are also involved in 2 and 3 (Figure S26). Considering the excitation at 309 nm (32,360 cm−1, 4.0 eV), energy transfer could take place from ligand-based higher excited states (e.g., the state(s) at 325–425 nm and 425–600 nm) to suitably positioned higher excited states of Ln(III) ions, followed exclusively by non-radiative relaxation (through the Ln(III) ion manifold or (back-)transfer to other non-emissive lower energy ligand-centered excited states). Bearing again in mind the excitation at 309 nm, in case of 2, the possibility of Dy(III/II) reduction by a ligand excited state with generation of a non-radiatively decaying LMCT state could also be considered [20,22]. However, even though very interesting from the fundamental science perspective, identifying the exact nature of the ligand-based emission quenching pathways in 2 and 3 (especially considering that emission from the Dy(III) and Tb(III) ions was not identified below 800 nm) would require more in-depth spectroscopic studies and it is beyond the scope of the present work. The effect of concentration of the sample on the emission intensity was also tested for complexes 2 and 3 reported in this work. The increase in complex concentration (10−6 to 10−4 M) results in the quenching of the emission at 425–600 nm in CH2Cl2 solution at both room temperature, and 77 K (Figures S24 and S25). In addition, no emission is detected in the solid state at room temperature. For both 2 and 3, a large emission band centered at 600–650 nm is observed, at high concentration, indicating that aggregation phenomena are (at least) partially implicated in generating the respective emissive state.

3. Materials and Methods

3.1. General Procedures

All reagents were commercially available and used as received. Ligands papl and qapl were prepared according to the literature procedures [10,11,15]. Anhydrous solvents were obtained from a Puresolve MD-4 solvent purification system. The electronic spectra were recorded in CH2Cl2 solutions on a Cary UV–Vis–NIR spectrophotometer 6000i (Agilent Technologies, Santa Clara, CA, USA) (concentration range of 10−4–10−6 M). Luminescence spectra were obtained using a Perkin Elmer LS55 Luminescence Spectrometer (PerkinElmer, Waltham, MA, USA) equipped with a low temperature accessory. The measurements were performed in CH2Cl2 solutions (concentration range 10−4–10−6 M), at room temperature, and at liquid nitrogen temperature (77 K). Wavelength accuracy is ±1.0 nm. FT-IR spectra were recorded on a Shimadzu IRAffinity spectrometer (Shimadzu America Inc., Columbia, MD, USA) as KBr discs. ESI mass spectra were obtained on a Bruker HCT Plus Proteineer LC-MS (Bruker Ltd., Milton, ON, Canada) with electrospray and a syringe pump was used for direct sample infusion. Elemental analyses were carried out by Canadian Microanalytical Services, LTD., Delta, BC, Canada.
CCDC 1844759 contains the supplementary crystallographic data for this paper. These data can be obtained free of charge via http://www.ccdc.cam.ac.uk/conts/retrieving.html (or from the CCDC, 12 Union Road, Cambridge CB2 1EZ, UK; Fax: +44 1223 336033; E-mail: [email protected])

3.2. Electrochemical Measurements

Cyclic voltammetry (CV) and differential pulse voltammetry (DPV) experiments were performed with a Bioanalytical Systems Inc. Epsilon electrochemical workstation. Compounds were dissolved in anhydrous solvent (CH2Cl2), and then deoxygenated by sparging with N2 gas for 20 min. Solution concentrations were approximately 10−3 M in analyte containing 0.5 M supporting electrolyte (Bu4NPF6). A three-electrode set-up was used including a glassy carbon working electrode, Ag/AgCl reference electrode, and a platinum wire auxiliary electrode. The scan rate for CV experiments was 200 mV/s. Parameters for the DPV experiments included a pulse amplitude of 50 mV, pulse width of 50 ms, and pulse period of 100 ms; scan rates were 40 mV/s.

3.3. DC Variable Temperature Magnetic Susceptibility Measurements

DC Magnetic susceptibility and magnetization measurements for complex 1 were made with a 9 T DynaCool Physical Property Measurement System (Quantum Design) using the vibrating sample magnetometer option. The magnetic properties of complexes 2 and 3 were studied with a Quantum Design Magnetic Property Measurement System using a Superconducting Quantum Interference Device (SQUID). All samples were individually pelleted, weighed, tightly packed into plastic capsules and loaded into brass holders. The signal from an empty capsule and the brass holder were measured prior to filling and were found to be at least three orders of magnitude lower than the signal from the samples.

3.4. Preparation of Complexes

Gd(papl)3 (1). 1-(2-pyridylazo)-2-phenanthrol (papl) (0.117 g, 0.391 mmol) was dissolved in chloroform (5 mL) and 5 drops of triethylamine were added to the solution. A solution of Gd(NO3)3·6H2O (0.061 g, 0.135 mmol) in methanol (5 mL) was added quickly drop-wise to the ligand solution and then allowed to stir for 2 h. A purple precipitate was produced, which was collected by vacuum filtration, washed with water, methanol and dried. Yield (0.088 g, 64%). MS (ESI+): 1053.2 (MH+). Anal. Calc’d for (%) C57H36N9O3Gd (found%): C, 65.06 (65.34); H, 3.45 (3.39); N, 11.98 (11.87). FT-IR (KBr, cm−1): 3063 (w), 1597 (m), 1584 (m), 1559 (m) 1510 (s) 1493 (s), 1437 (m), 1389 (w), 1319 (s), 1291 (m), 1275 (s), 1225 (s), 1208 (m), 1177 (m), 1161 (m), 1140 (s), 1101 (m), 1034 (m), 999 (m), 928 (w), 754 (m), 725 (m), 637 (w), 517 (w).
Dy(papl)3 (2). Papl (0.122 g, 0.407 mmol) was dissolved in chloroform (5 mL) and 5 drops of triethylamine were added to the solution. A solution of Dy(NO3)3·xH2O (0.051 g) in methanol (5 mL was added quickly drop-wise to the ligand solution and stirred for 2 h. A purple precipitate was produced that was collected by vacuum filtration, washed with water, methanol and dried. Yield (0.086 g, 59%). MS (ESI+): 1059.2 (MH+). Anal. Calc’d for (%) C57H36N9O3Dy (found%): C, 64.74 (65.19); H, 3.43 (3.25); N, 11.92 (12.00). FT-IR (KBr, cm−1): 3062 (w), 1597 (m), 1584 (m), 1559 (m), 1512 (s), 1493 (s), 1437 (m), 1389 (w), 1341 (m), 1319 (s), 1294 (m), 1277 (s), 1227 (s), 1207 (m), 1179 (s), 1161 (m), 1140 (s), 1126 (m), 1101 (m), 1034 (m) 999 (m), 928 (w), 872 (w), 754 (m), 725 (m), 654 (w).
Tb(papl)3·0.4CHCl3 (3). Papl (0.10 g, 0.33 mmol) was dissolved in chloroform (5 mL) and 5 drops of triethylamine were added to the solution. A solution of Tb(NO3)3·5H2O (0.049 g, 0.113 mmol) in methanol (5 mL) was added drop-wise to the ligand solution and allowed to stir for 2 h. A purple precipitate was produced, which was collected by vacuum filtration, washed with water, methanol and dried. Yield (0.074 g, 62%). MS (ESI+): 1054.2 (MH+). Anal. Calc’d for (%) C57H36N9O3Tb·0.4CHCl3 (found%): C, 62.58 (62.60); H, 3.33 (3.21); N, 11.44 (11.50). FT-IR (KBr, cm−1): 3065 (w), 1597 (m), 1584 (m), 1559 (m), 1510 (m), 1491 (m), 1437 (m), 1387 (w), 1341 (m), 1319 (s), 1292 (m), 1277 (s), 1227 (s), 1207 (m), 1179 (m), 1161 (m), 1140 (s), 1101 (m), 1034 (w), 999 (m), 871 (w), 756 (m), 725 (m).
Ho(qapl)3·1.1CH2Cl2 (4). Qapl (0.075 g, 0.23 mmol) was dissolved in chloroform (15 mL) and 10 drops of triethylamine were added to the solution. A solution of HoCl3·6H2O (0.029 g, 0.077 mmol) in methanol (15 mL) was added drop-wise to the ligand solution and allowed to stir for 12 h at approximately 35 °C. A red-purple precipitate was produced, which was collected by vacuum filtration, washed with water, methanol and dried. Yield (0.068 g, 75%). Single crystals of 4 were grown by slow evaporation of DCM/CH3CN solutions (approximately 2 mg in 11 mL DCM and 2 mL CH3CN). MS (ESI+): 1210.2 (MH+). Anal. Calc’d for (%) C69H42N9O3Ho·1.1CH2Cl2 (found%): C, 64.59 (64.68); H, 3.42 (3.59); N, 9.67 (9.49). FT-IR (KBr, cm−1): 3447 (m), 3061 (w), 3019 (w), 1605 (m), 1582 (m), 1558 (m), 1510 (m), 1487 (m), 1379 (m), 1341 (s), 1325 (s), 1300 (s), 1222 (s), 1204 (m), 1155 (w), 1105 (w), 1087 (w), 1051 (w), 1037 (w), 968 (w), 874 (w), 831 (w), 810 (w), 785 (w), 752 (m), 727 (m), 692 (w). λmax (THF) = 506 nm.

4. Conclusions

Herein, we have reported the first lanthanide ion complexes 13 with the arylazo ligand papl. In these complexes, three equivalents of the deprotonated ligand bind to the metal ion to produce nine coordinate species with a likely tricapped trigonal prismatic geometry at the lanthanide ion, analogous to the Ho(qapl)3 complex also reported in this work. As anticipated, complexes 13 exhibit similar spectroscopic and electrochemical features to transition metal complexes containing papl, including intense visible absorption bands and rich cathodic electrochemical behavior. Of note, we investigated the luminescent properties of 13 and the uncoordinated papl ligand since there are very few reports of the emission properties of lanthanide complexes coordinated to arylazo ligands. In all cases, the typical sharp lanthanide ion centered luminescence is not observed and the emission profiles of 13 all resembled that obtained from the uncoordinated papl ligand. The emission intensities are dependent on the ion with Gd the most intense and very weak emission observed from the Tb/Dy complexes. While no slow relaxation of the magnetization was observed for the Tb or Dy complexes described in this work, we are pursuing other heteroleptic lanthanide complexes containing papl using [Ln(tta)3] (tta = 2-thenoyltrifluoroacetonate) or [Ln(hfac)3] (hfac = hexafluoroacethylacetonate) salts, which have been shown to produce multifunctional luminescent SIMs with other redox active ligand types [23].

Supplementary Materials

Supplementary Materials can be found at https://0-www-mdpi-com.brum.beds.ac.uk/2304-6740/6/2/56/s1. Figures S1–S26: ESI, CIF, electrochemical, variable temperature magnetic susceptibility and luminescence data for 13. Table S1: Crystal data and structure refinement for 4, Cif and checkcif file of 4.

Author Contributions

M.T.L. conceived and designed the experiments; R.A.T. synthesized and characterized the papl ligand and complexes 13; M.C. and J.Y. performed the photophysical experiments; N.M.B. prepared qapl, complex 4 and grew single crystals; A.J.L. solved the crystal structure of 4; C.R.W., H.J.S. and C.M. designed and completed the variable temperature magnetic susceptibility experiments; and M.T.L. wrote the paper with contributions from all co-authors.

Acknowledgments

M.T.L. acknowledges funding from NSERC, CFI, Canada Research Chairs Program, Brandon and Brock University and the University of Manitoba for providing an adjunct position. M.C. thanks NSERC and the FRQNT and Université de Montréal for graduate fellowships. Y.J. thanks MITACS for a student fellowship. C.R.W. acknowledges funding from NSERC, CFI, the Canada Research Chairs Program (Tier II), CIFAR, and the University of Manitoba for providing an adjunct position.

Conflicts of Interest

The authors declare no conflict of interest.

References

  1. Bottrill, M.; Kwok, L.; Long, N.J. Lanthanides in magnetic resonance imaging. Chem. Soc. Rev. 2006, 35, 557–571. [Google Scholar] [CrossRef] [PubMed]
  2. Harvey, P.; Kuprov, I.; Parker, D. Lanthanide complexes as paramagnetic probes for 19F magnetic resonance. Eur. J. Inorg. Chem. 2012, 2015–2022. [Google Scholar] [CrossRef]
  3. Tsitovich, P.B.; Burns, P.J.; McKay, A.M.; Morrow, J.R. Redox-activated MRI contrast agents based on lanthanide and transition metal ions. J. Inorg. Biochem. 2014, 133, 143–154. [Google Scholar] [CrossRef] [PubMed]
  4. Zhang, M.; Qu, Z.B.; Han, C.M.; Lu, L.F.; Li, Y.Y.; Zhou, T.; Shi, G. Time-resolved probes and oxidase-based biosensors using terbium(III)-guanosine monophosphate-mercury(II) coordination polymer nanoparticles. Chem. Commun. 2014, 50, 12855–12858. [Google Scholar] [CrossRef] [PubMed]
  5. Bünzli, J.-C.G. Lanthanide Luminescence for Biomedical Analyses and Imaging. Chem. Rev. 2010, 110, 2729–2755. [Google Scholar] [CrossRef] [PubMed]
  6. Woodruff, D.N.; Winpenny, R.E.P.; Layfield, R.A. Lanthanide single-molecule magnets. Chem. Rev. 2013, 113, 5110–5148. [Google Scholar] [CrossRef] [PubMed]
  7. Sorace, L.; Benelli, C.; Gatteschi, D. Lanthanides in molecular magnetism: Old tools in a new field. Chem. Soc. Rev. 2011, 40, 3092–3104. [Google Scholar] [CrossRef] [PubMed]
  8. Rinehart, J.; Long, J. Exploiting single-ion anisotropy in the design of f-element single-molecule magnets. Chem. Sci. 2011, 2, 2078–2085. [Google Scholar] [CrossRef]
  9. Samanta, S.; Ghosh, P.; Goswami, S. Recent advances on the chemistry of transition metal complexes of 2-(arylazo)pyridines and its arylamino derivatives. Dalton Trans. 2012, 41, 2213–2226. [Google Scholar] [CrossRef] [PubMed]
  10. Chiswell, B.; Lions, F.; Tomlinson, M.L. Tridentate Chelate Compounds. IV. Metal Complexes from a-Diketone Mono-a-pyridylhydrazone Type Ligands. Inorg. Chem. 1961, 611, 322–327. [Google Scholar] [CrossRef]
  11. Van Damme, N.; Lough, A.J.; Gorelsky, S.I.; Lemaire, M.T. Molecular and electronic structures of complexes containing 1-(2-pyridylazo)-2-phenanthrol (PAPL): Revisiting a redox-active ligand. Inorg. Chem. 2013, 52, 13021–13028. [Google Scholar] [CrossRef] [PubMed]
  12. Taylor, R.A.; Lough, A.J.; Lemaire, M.T. Spin-crossover in a homoleptic cobalt(II) complex containing a redox-active NNO ligand. J. Mater. Chem. C 2016, 4, 455–459. [Google Scholar] [CrossRef]
  13. Takahashi, K.; Kawamukai, K.; Okai, M.; Mochida, T.; Sakurai, T.; Ohta, H.; Yamamoto, T.; Einaga, Y.; Shiota, Y.; Yoshizawa, K. A New Family of Anionic FeIII Spin Crossover Complexes Featuring a Weak-Field N2O4 Coordination Octahedron. Chem. A Eur. J. 2016, 22, 1253–1257. [Google Scholar] [CrossRef] [PubMed]
  14. Andreiadis, E.S.; Imbert, D.; Pécaut, J.; Demadrille, R.; Mazzanti, M. Self-assembly of highly luminescent lanthanide complexes promoted by pyridine-tetrazolate ligands. Dalton Trans. 2012, 41, 1268. [Google Scholar] [CrossRef] [PubMed]
  15. Taylor, R.A.; Bonanno, N.M.; Mirza, D.; Lough, A.J.; Lemaire, M.T. A trivalent cobalt complex with the new redox-active ligand 10-(8-quinolylazo)-9-phenanthrol (qapl). Polyhedron 2017, 131, 34–39. [Google Scholar] [CrossRef]
  16. Bonanno, N.M.; van Damme, N.; Lough, A.J.; Lemaire, M.T. Transition metal complexes containing a ditopic redox active ligand featuring very intense visible absorption bands. Dyes Pigment. 2015, 123, 212–217. [Google Scholar] [CrossRef]
  17. Zhou, J.L.; Xu, Y.H.; Jin, X.X.; Xiao, S.; Yi, H.B.; Yan, J. Synthesis and characterization of luminescent zinc complexes containing redox-active 1-(2-pyridylazo)-2-acenaphthequinol ligands with nonlinear optical property. Inorg. Chem. Commun. 2016, 64, 67–70. [Google Scholar] [CrossRef]
  18. Wu, Y.; Wang, J.; Kong, X.; Sheng, C.; Wang, R.; Peyghambarian, N.; Norwood, R.A.; Zheng, Z. A dinuclear europium(III) complex with thenoyltrifluoroacetonato and 1-(2-pyridylzao)-2-naphtholato ligands and its optical properties. Inorg. Chim. Acta 2011, 370, 346–352. [Google Scholar] [CrossRef]
  19. Santos, F.D.S.; Descalzo, R.R.; Gonçalves, P.F.B.; Benvenutti, E.V.; Rodembusch, F.S. Evidence for excited state intramolecular charge transfer in benzazole-based pseudo-stilbenes. Phys. Chem. Chem. Phys. 2012, 14, 10994–11001. [Google Scholar] [CrossRef] [PubMed]
  20. Shuvaev, S.; Utochnikova, V.; Marciniak, Ł.; Freidzon, A.; Sinev, I.; Van Deun, R.; Freire, R.O.; Zubavichus, Y.; Grünert, W.; Kuzmina, N. Lanthanide complexes with aromatic o-phosphorylated ligands: Synthesis, structure elucidation and photophysical properties. Dalton Trans. 2014, 43, 3121–3136. [Google Scholar] [CrossRef] [PubMed]
  21. Bünzli, J.-C.G.; Piguet, C. Taking advantage of luminescent lanthanide ions. Chem. Soc. Rev. 2005, 34, 1048–1077. [Google Scholar] [CrossRef] [PubMed]
  22. Meyer, A.U.; Slanina, T.; Heckel, A.; König, B. Lanthanide Ions Coupled with Photoinduced Electron Transfer Generate Strong Reduction Potentials from Visible Light. Chem. Eur. J. 2017, 23, 7900–7904. [Google Scholar] [CrossRef] [PubMed]
  23. Pointillart, F.; le Guennic, B.; Cador, O.; Maury, O.; Ouahab, L. Lanthanide Ion and Tetrathiafulvalene-Based Ligand as a “magic” Couple toward Luminescence, Single Molecule Magnets, and Magnetostructural Correlations. Acc. Chem. Res. 2015, 48, 2834–2842. [Google Scholar] [CrossRef] [PubMed]
Chart 1. Arylazo ligands used in the present study.
Inorganics 06 00056 ch001
Scheme 1. Preparation of Ln(papl)3 complexes. Ho(qapl)3 (4) was prepared analogously using HoCl3 hexahydrate and qapl (Chart 1).
Inorganics 06 00056 sch001
Figure 1. Molecular structure of 4 (displacement ellipsoids at 30% probability). H atoms removed for clarity. Complex 4 lies on a crystallographic twofold rotation axis and one of the qapl ligands is disordered about a twofold rotation axis over two sites with equal occupancy. In Figure 1, only one site is shown for the disordered ligand and the atom labels are denoted with suffix “A”. Unlabeled atoms in the figure and those in list below which are denoted by suffix “#” are related by the symmetry operator (−x + 1, y, −z + 3/2). Relevant bond distances (Å) and angles (°) [with standard uncertainties (su) in brackets]: Ho(1)–O(1A), 2.122(11); Ho(1)–O(1)#1, 2.273(6); H(1)–O(1), 2.273(6); Ho(1)–N(2A), 2.555(10); Ho(1)–N(2)#1, 2.557(7); Ho(1)–N(2), 2.557(7); Ho(1)–N(3)#1, 2.596(8); Ho(1)–N(3), 2.596(8); Ho(1)–N(3A), 2.737(12); N(1)–N(2), 1.308(8); C(1)–O(1), 1.283(10); N(1A)–N(2A), 1.303(11); C(1A)–O(1A), 1.276(12). O(1A)–Ho(1)–O(1)#1, 84.3(4); O(1A)–Ho(1)–O(1), 78.1(4); O(1)#1–Ho(1)–O(1), 142.8(3); O(1A)–Ho(1)–N(2A), 74.9(4); O(1)–Ho(1)–N(2A), 68.6(4); O(1A)–Ho(1)–N(2)#1, 143.5(4); O(1)#1–Ho(1)–N(2)#1, 68.8(2); O(1)–Ho(1)–N(2)#1, 137.8(3); N(2A)–Ho(1)–N(2)#1, 121.2(4); O(1A)–Ho(1)–N(2), 76.6(4); O(1)#1–Ho(1)–N(2), 137.8(3); O(1)–Ho(1)–N(2), 68.8(2); N(2A)–Ho(1)–N(2), 130.6(4); N(2)#1–Ho(1)–N(2), 106.9(4); O(1A)–Ho(1)–N(3)#1, 142.5(4); O(1)#1–Ho(1)–N(3)#1, 131.2(2); O(1)–Ho(1)–N(3)#1, 77.3(3); N(2A)–Ho(1)–N(3)#1, 123.4; N(2)#1–Ho(1)–N(3)#1, 63.3(2); N(2)–Ho(1)–N(3)#1, 68.3(2); O(1A)–Ho(1)–N(3), 82.4(4); O(1)#1–Ho91)–N(3), 77.3(3); O(1)–Ho(1)–N(3), 131.2(2); N(2A)–Ho(1)–N(3), 143.2(3); N(2)#1–Ho(1)–N(3), 68.3(2); N(2)–Ho(1)–N(3), 63.2(2); N(3)#1–Ho(1)–N(3), 93.1(3); O(1A)–Ho(1)–N(3A), 131.6(4); O(1)#1–Ho(1)–N(3A), 89.8(5); O(1)–Ho(1)–N(3A), 78.4(4); N(2A)–Ho(1)–N(3A), 60.8(3); N(2)#1–Ho(1)–N(3A), 74.3(4); N(2)–Ho(1)–N(3A), 130.7(4); N(3)#1–Ho(1)–N(3A), 69.3(4); N(3)–Ho(1)–N(3A), 142.6(4).
Inorganics 06 00056 g001
Figure 2. Electronic spectra of papl, Gd(papl)3 (1), Dy(papl)3 (2), Tb(papl)3 (3) in CH2Cl2 at room temperature.
Inorganics 06 00056 g002
Scheme 2. Keto-enol tautomerization for the papl ligand showing intramolecular proton transfer.
Inorganics 06 00056 sch002
Scheme 3. Potential redox-activity anticipated for papl.
Inorganics 06 00056 sch003
Figure 3. CV of 1 in CH2Cl2 (containing ca. 0.5 M Bu4NPF6; scan rate 200 mV/s).
Inorganics 06 00056 g003
Figure 4. Anodic DPV of 1 in CH2Cl2 with a scan rate of 50 mV/s.
Inorganics 06 00056 g004
Figure 5. Cathodic DPV of 1 in CH2Cl2 with a scan rate of 50 mV/s.
Inorganics 06 00056 g005
Figure 6. Variable temperature magnetic susceptibility data (ZFC/FC) for 1 (red), 2 (green), and 3 (blue) (external field 2000 Oe).
Inorganics 06 00056 g006
Figure 7. Magnetization versus field (0–9000 Oe) for 1 (red line), 2 (green line) and 3 (blue line) at 2 K.
Inorganics 06 00056 g007
Figure 8. Emission profile of the papl ligand in CH2Cl2 at room temperature (orange line, λmax = 365 (sh), 384, 419 (sh), 490 (sh), 517, 544, and 560 (sh) nm; sh = shoulder) and at 77 K (red line, λmax = 645 nm) (λexc = 257 nm; concentration 1 × 10⁻⁵ M).
Inorganics 06 00056 g008
Figure 9. Emission profile of 1 in CH2Cl2 at room temperature (blue line, λmax = 419 nm) and at 77 K (red line, λmax = 652 nm) (λexc = 309 nm) (concentration 4 × 10⁻⁵ M).
Inorganics 06 00056 g009
Figure 10. Emission profile of 2 (yellow line) and 3 (green line) in CH2Cl2 at RT; λexc = 309 nm. Dashed red line is CH2Cl2.
Inorganics 06 00056 g010
Table 1. Electrochemical properties of 13 (vs. Ag/AgCl).
CompoundE1/2 (Anodic)E1/2 (Cathodic)
11.2 (irr), 0.9 (irr)−1.2 (qr), −1.5 (qr), −1.8 (irr)
21.2 (irr), 0.9 (irr)−1.2 (qr), −1.4 (qr)
31.2 (irr), 1.0 (irr)−1.2 (qr), −1.5 (qr), −1.9 (irr)

