A Semi-Empirical Method for the Estimation of the Hydration Number of Mn(II)-Complexes


1
Laboratory of Biocatalysis, Delft University of Technology, Van der Maasweg 9, 2629 HZ Delft, The Netherlands
2
Department of Life Sciences and Coimbra Chemistry Centre, Faculty of Science and Technology, University of Coimbra, Calçada Martim de Freitas, 3000-456 Coimbra, Portugal
*
Authors to whom correspondence should be addressed.
Inorganics 2018, 6(4), 116; https://0-doi-org.brum.beds.ac.uk/10.3390/inorganics6040116
Submission received: 13 September 2018
/
Revised: 23 October 2018
/
Accepted: 24 October 2018
/
Published: 26 October 2018
(This article belongs to the Special Issue MRI Contrast Agents)
Abstract
:A semi-empirical equation to estimate the hydration number of Mn(II) complexes was derived from a database of 49 previously published 1H longitudinal Nuclear Magnetic Relaxation Dispersion profiles. This equation has the longitudinal 1H relaxivity and the molecular weight of the Mn(II) complex under consideration as parameters.
1. Introduction
During the last decades, Gd3+-chelates, such as Gd-DTPA (DTPA = diethylenetriamine-N,N,N’,N’’,N’’,N’’’-pentaacetate) and Gd-DOTA (DOTA = 1,4,7,10-tetraazacyclododecane-N,N’,N’’,N’’’-tetraacetate), have become indispensable tools for the contrast enhancement of magnetic resonance images [1,2,3]. These contrast agents (CAs) have proven to be generally extremely safe; only 0.03% of all administrations (about 100 million worldwide) gave rise to serious adverse effects. However, during recent years, some concerns have arisen because of (i) incidents of nephrogenic systemic fibrosis (NSF) associated with Gd3+-complexes of linear DTPA derivates and (ii) observation of Gd-accumulation in the brains of patients with normal renal function, after repeated administrations of DTPA-type of CAs [4,5,6,7,8]. Both effects may be ascribed to the relative kinetic instability of Gd3+ complexes of linear polyaminocarboxylates. The concerns about Gd-based CAs have led to an increased interest in application of Gd3+-free CAs. High spin d5 Mn2+ is an attractive alternative for f7 Gd3+, because it has only two less unpaired electrons, whereas a high electronic symmetry is favorable for high relaxivities. Moreover, Mn2+ is less toxic than Gd3+, as reflected in its important role as a cofactor in many enzymatic reactions, including the anti-oxidant enzyme superoxide dismutase, as well as in enzymes involved in neurotransmitter synthesis and metabolism in the brain. However, the concentration of free Mn2+ in organisms is very low, for instance 0.3–1 μg·L−1 in human blood [9]. High concentrations are neurotoxic, and therefore, Mn2+ preferably needs to be sequestered for safe application as CA in humans. Due to its lower charge, complexes are usually less stable than their Gd3+-counterparts. It is important to assure that the dissociation of Mn2+-based CAs is minimized in order to avoid any neurotoxic side effects. On the other hand, the relaxation rate enhancing efficacy should be as high as possible in view of the inherently low sensitivity of magnetic resonance imaging (MRI) CAs. Finding a balance between kinetic stability and optimal sensitivity is a challenge during the design of novel Mn2+-based CAs.
The efficacy of a CA is usually expressed by its relaxivity, the longitudinal, or transverse relaxation rate enhancement normalized for a solution containing 1 mM of paramagnetic metal ions (r1 and r2, respectively). One of the most important parameters governing the longitudinal relaxivity (r1) of paramagnetic CAs is the number of water molecules in the first coordination sphere of the metal ion (q), since the inner sphere contribution to r1 is linearly proportional to it. Several good methods are available to evaluate q for Gd3+-based CAs, including measurements of lanthanide induced 17O NMR shifts (NMR = Nuclear Magnetic Resonance) of water [1,10,11], determination of the 17O scalar coupling constant (AO/ħ) from simultaneous fitting of 17O shift and/or relaxation data and 1H NMRD data (NMRD = Nuclear Magnetic Relaxation Dispersion), and comparison of the luminescence decay rates of Eu3+ or Tb3+ complexes in H2O and D2O [12]. The determination of q for Mn2+-complexes is more challenging. The luminescence decay method is impossible, because the complexes are not luminescent. 17O NMR methods are more ambiguous since they rely on the assumption that AO/ħ is almost independent on the coordination environment of Mn2+, which appears not to be case: values in the range −(26–73) × 106 rad·s−1 have been evaluated from 17O NMR measurements on Mn2+ complexes (see below, Table 1). Esteban-Gómez et al. have estimated by DFT calculations that variations of Mn–O distances and dihedral angles among these complexes may lead to AO/ħ values ranging between 30 and 58 × 106 rad·s−1 [13]. By contrast, the range of AO/ħ values observed for Gd3+-complexes observed is narrower (−(3.6–4.2) × 106 rad·s−1) [11], allowing reasonable accurate estimations of q using a 17O NMR shift and/or relaxation rates. Moreover, accurate Mn2+-induced shift measurements are difficult because of the very large line broadenings and relatively small induced shifts.
X-ray crystallography may provide structures of Mn2+ complexes in the solid state, but these structures are not necessarily the same in solution. Frequently dimeric or oligomeric assemblies occur in crystal structures, which will dissociate upon dissolution in water. Often, a value of q is estimated based on the denticity of the organic ligand and assuming a total Mn2+-coordination number of 6. However, high spin Mn2+-complexes have almost no ligand stabilization energy, and consequently, do not show a clear preference for a specific coordination number. Others use the magnitudes of the longitudinal relaxivities to estimate q, which is ambiguous as well, as will be demonstrated below. Recently, Póta et al. suggested that DFT calculations (at the M062X/TZVP level) may provide reliable q-values [14]; however, these calculations require excessive amounts of computing time with supercomputers.
Here, we will demonstrate that reliable q values for Mn2+-complexes can be obtained from experimental r1 values at low Larmor frequencies (LF) and the formula weight (FW) of the complexes.
2. Results and Discussion
A database of 49 previously published 1H longitudinal Nuclear Magnetic Relaxation Dispersion profiles (plots of r1 versus LF) was constructed (see Table 1 and Figure 1). The relaxivity has an inner-sphere contribution by water molecules exchanging between the first coordination sphere of the metal ion and the bulk (ri,IS) and an outer-sphere contribution due to water molecules in the bulk that diffuse in the surroundings of the metal ion without being bound to it (r1,OS) (see Equation (1)). The amount of a Mn2+-based CA needed is always very small (in the mM range) and the Mn2+-induced chemical shifts of the water protons are negligible. Under those conditions, r1,IS was related to the longitudinal relaxation time of a Mn2+-bound water molecule (T1M), according to Equation (2) [15,16]:
r1 = r1,IS + r1,OS
Here, τM is the residence time of a water molecule in the first coordination sphere of Mn2+. Since the electronic relaxation time (T1e) for Mn2+-complexes was generally larger than the rotational correlation time (τR), the contribution of the Curie relaxation mechanism to the longitudinal relaxation was negligible; only the dipolar and the scalar mechanisms needed to be taken into consideration. These contributions (T1M,DD−1 and T1M,SC−1, respectively) may be estimated by using the Solomon-Bloembergen-Morgan (SBM) equations (Equations (3)–(7)) [17,18]:
Here, (μ0/4π) is the magnetic permeability in vacuum, rMnH is the distance between Mn2+ and the H-atom of a bound water molecule, S is the electron spin (S = 5/2 for Mn2+), γI is the 1H nuclear gyromagnetic ratio, γS is the electron gyromagnetic ratio, and ωI and ωS are the Larmor frequencies of the proton and electron spin, respectively, AH/ħ is the hyperfine coupling constant between Mn2+ and the bound water proton, τdi−1 = τM−1 + τR−1+ Tie−1, and τs2−1 = τM−1 + T2e−1. The electronic relaxation times are often interpreted in terms of the zero-field splitting (ZFS) interaction using Equations (6) and (7) [19]:
In these equations, Δ2 represents the mean-squared fluctuation of the ZFS, and τv is the correlation time for the instantaneous distortion of the coordination polyhedron of Mn2+. From these equations, it can be derived that the low field limiting value of the longitudinal and transverse electronic relaxation rates (τS0−1) were equal, given by Equation (8):
The outer-sphere contribution to the relaxivity (r1,OS) is described by Equations (9) and (10) [20]:
Here, NA is Avogadro’s number, aMnH is the distance of closest approach of a diffusing water molecule to Mn2+, DMnH stands for the diffusion coefficient, and Jos(ω, Tje) (j = 1, 2) are spin density functions. The diffusion correlation time (τMnH) is given by aMnH2/DMnH.
An inspection of Equations (4) and (5) indicates that in an NMRD profile, two inflection points may be expected: one originating from 1/T1,DD when ωτd2 = 1 (at LF ≈ 10 MHz), and another one due to 1/T1,SC when ωτS2 = 1 (at LF ≈ 0.06 MHz) [21,22]. Until now, only two MnII-based CAs have been observed that have NMRD profiles showing these two inflection points: [MnII(H2O)6]2+ [21,22] and [MnII2(ENOTA)(H2O)2] [23]. All other reported NMRD profiles display only the high field dispersion at LF ≈ 10 MHz, indicating that for these compounds the contribution of the scalar interaction to the relaxivity is negligible.
It should be noted that the SBM equations, particularly Equations (6) and (7), only hold under certain conditions, such as (i) the Redfield condition of extreme narrowing (ΔsτRH << 1, Δs is the static ZFS), (ii) the ZFS energy should be much larger than the Zeeman energy (EZFS >> EZeeman), (iii) the electronic decay should be mono-exponential [24,25]. Outside these limits, a proper description of the electronic relaxation requires more complicated calculations that also take the static ZFS into account. Although the conditions for applying the SBM theory for the modeling of NMRD profiles are not always valid for Mn2+ complexes, this theory has been applied in almost all studies on the complexes mentioned in Table 1. It may be justified if the Redfield condition applies and if only data for LF > 10 MHz were considered [26], because then the influence of the electronic relaxation can be neglected. Otherwise, the SBM model can be applied for a qualitative description of structure relaxivity relationships when the best fit parameters obtained, particularly those concerning the electronic relaxation, are considered as effective rather than physically relevant [27]. The most relevant parameters governing the relaxivity as determined by fitting of NMRD profiles with the SBM equations are included in Table 1.
For the evaluation of q, we focused our attention to the low field parts of the NMRD profiles. Below the dispersion at LF ≈ 10 MHz, the profiles always had a plateau, where r1 was rather large and almost independent of LF, which allows an accurate measurement of r1. At low field, r1 was dominated by q and the electronic relaxation, whereas at higher field strengths the nuclear relaxation dominated, which in turn was dominated by q, τR, and τM. This might lead to local maxima in the profile for high molecular weight compounds and relatively low relaxivities for low molecular compounds [2].
Values of r1 at 0.01 MHz were measured in the profiles with a single dispersion. In the profiles for [Mn(H2O)6]2+ and [Mn2(ENOTA)(H2O)2], the r1 was measured at about 1 MHz (at the plateau behind the first dispersion), where the scalar contribution may be neglected.
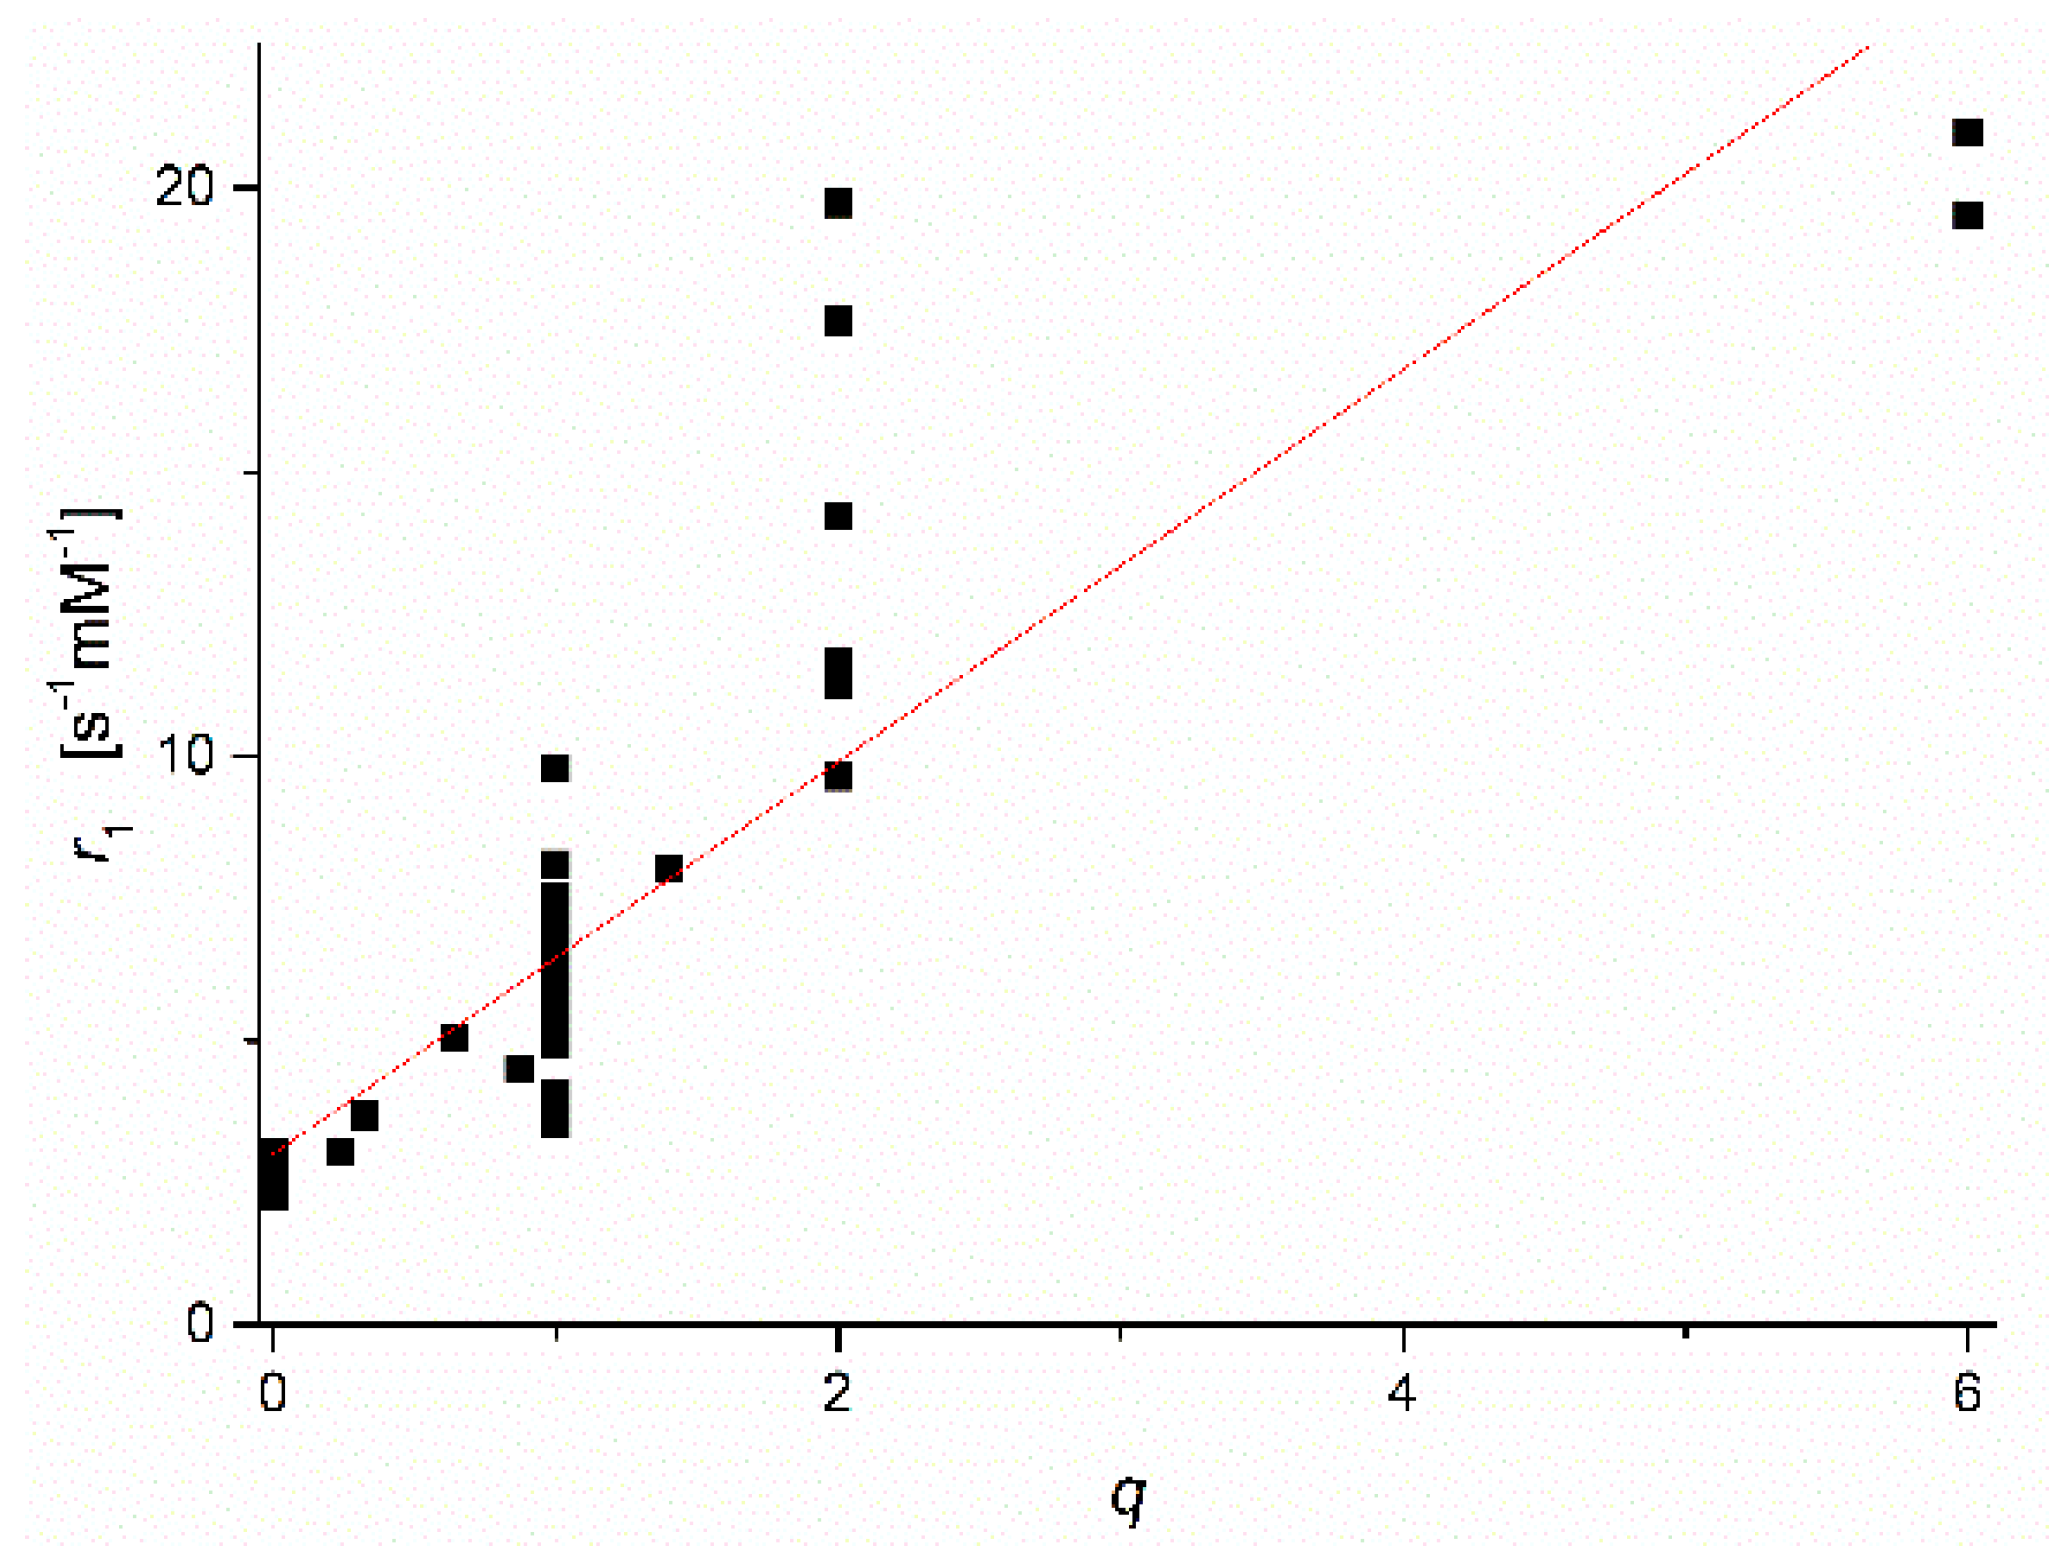
Figure 2 displays a plot of the collected low field r1-values versus the reported q values for the Mn2+ complexes concerned (qlit). Many of the qlit values were obtained by applying a combination of several of the methods described above. For q = 0, the datapoints are in a narrow range of r1-values around an average of 2.4 ± 0.2 s−1·mM−1. This value can therefore be applied as a good estimate of the outer sphere contribution of all Mn2+ complexes. For q > 0, Figure 2 clearly shows that the ranges of r1 values for various q-values overlap. Hence r1 ranges alone cannot be applied for the evaluation of q.
A closer inspection of the structures corresponding with datapoints at q = 1 and q = 2 indicates that r1 increased with the molecular volume of the Mn2+-complexes at each q, which suggests that the r1 at low field also depended on the rotational correlation time (τR). Therefore, we next considered the datapoints for q ≠ 0. For these data, r1/q appeared not to be linearly proportional to the molecular weight (FW). Regression of r1/q as a function of FW with the computer program CurveExpert 1.4 using all in-built models afforded a good fit with Equation (11):
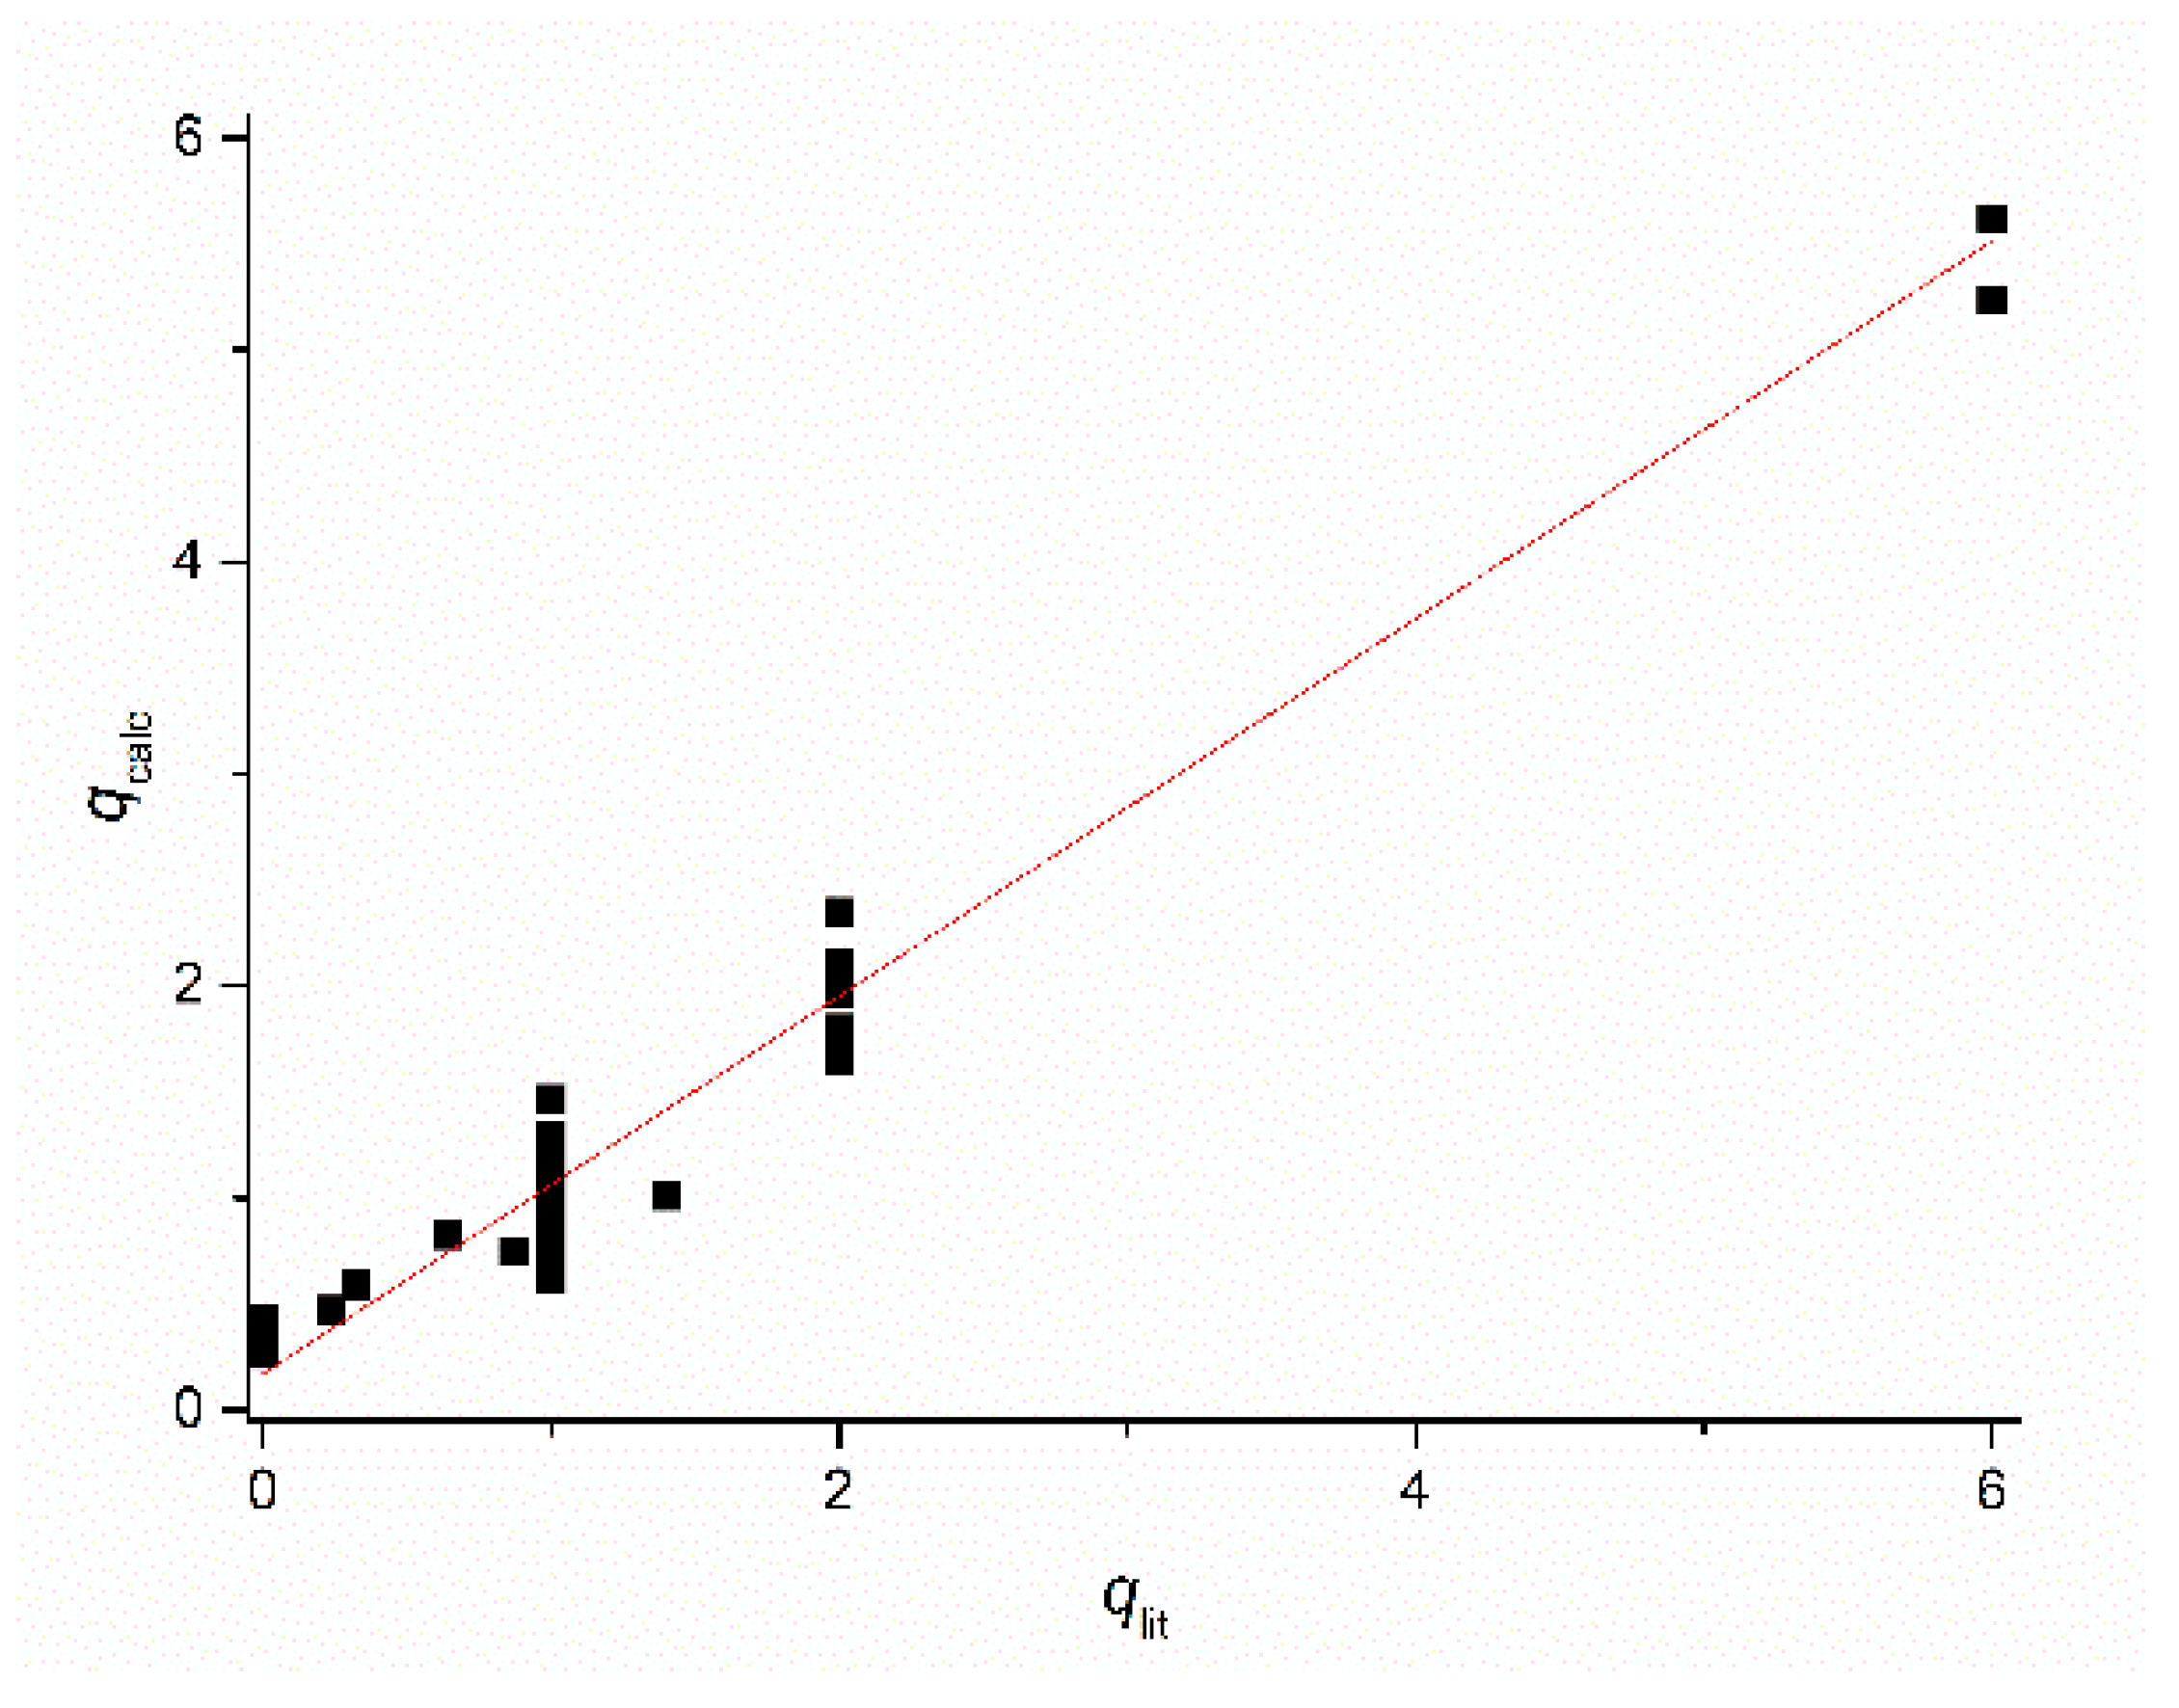
The hydration number can be calculated with Equation (12):
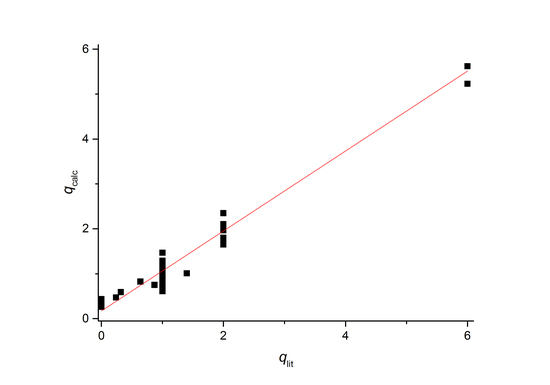
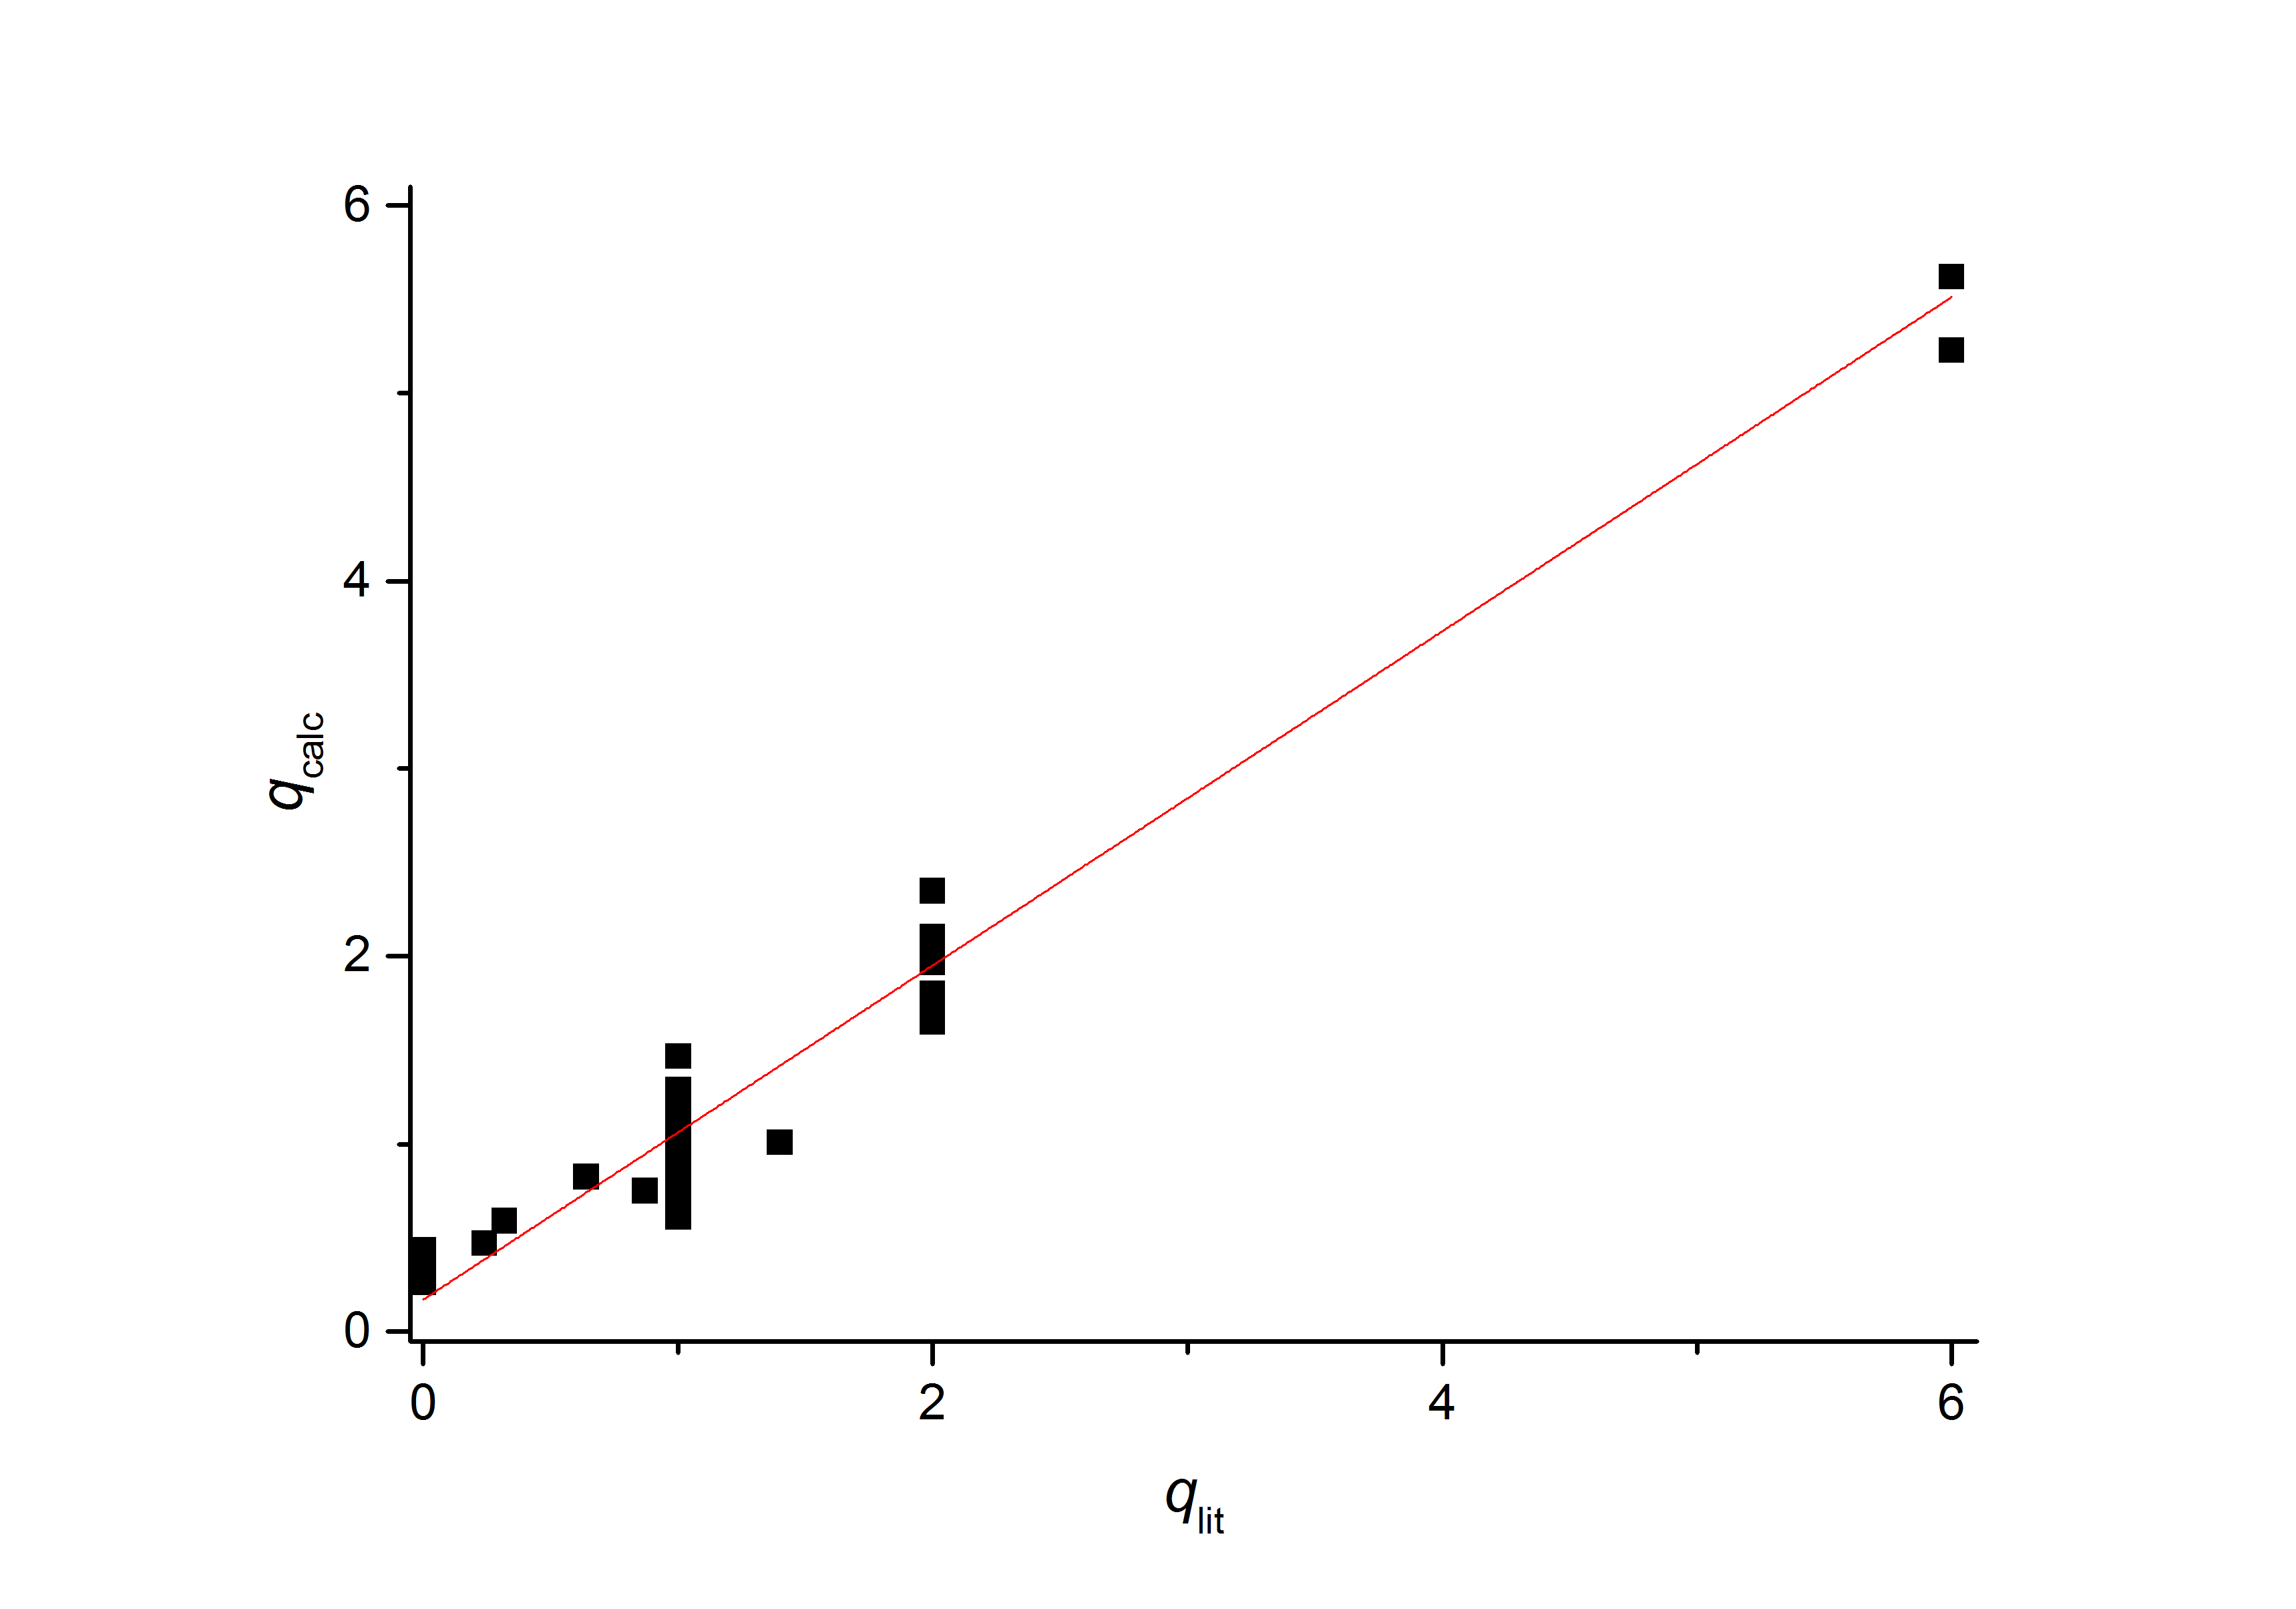
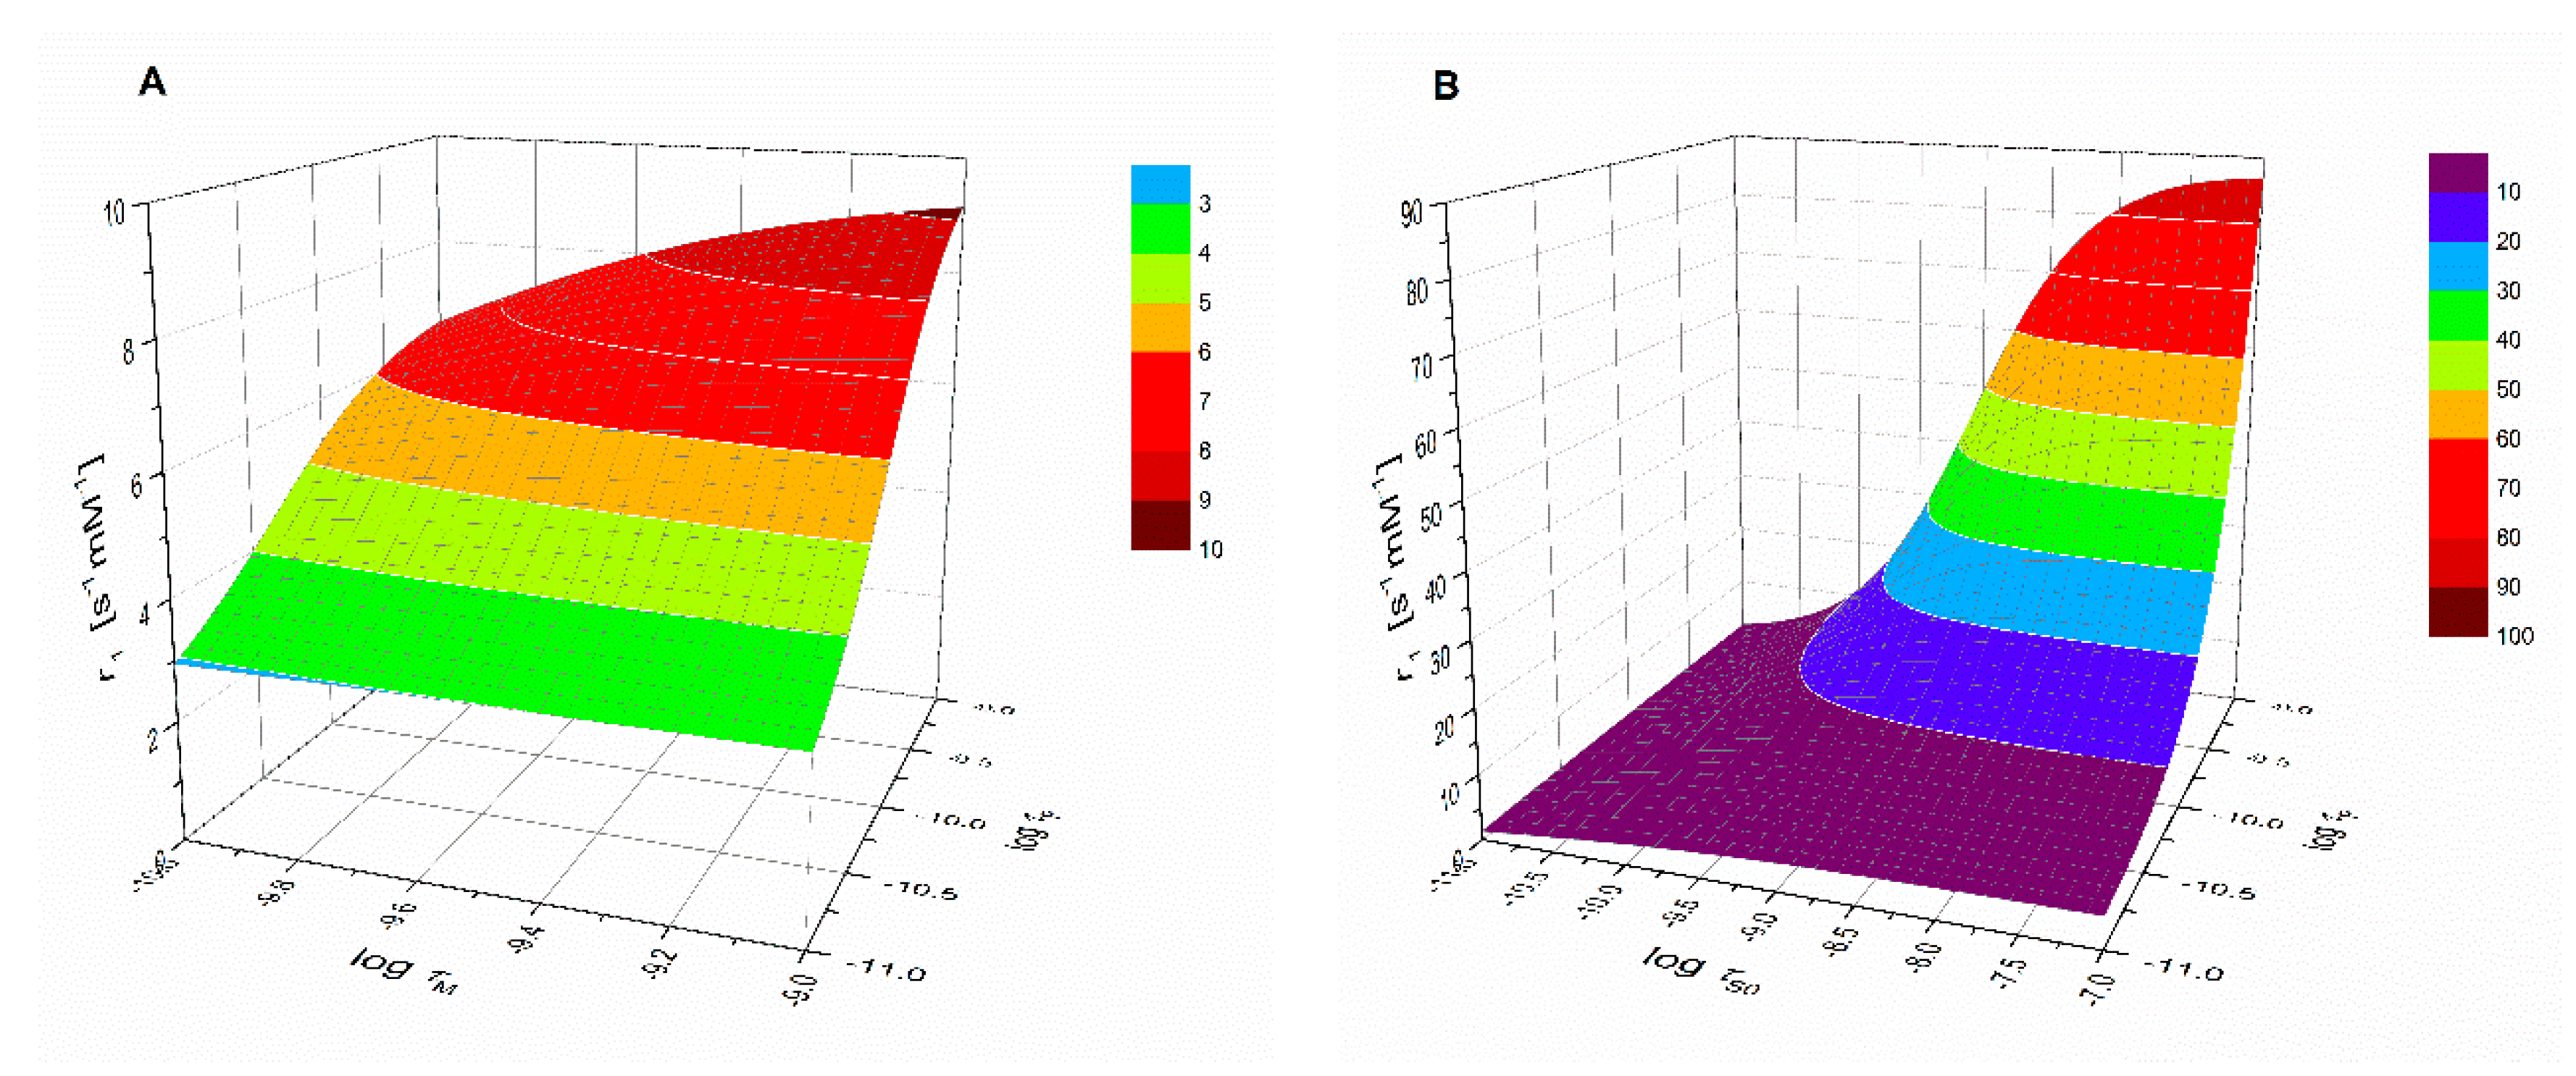
Figure 3 shows the good agreement between the calculated hydration numbers (qcalc) and the values mentioned in the publications from which the r1 values were taken (qlit). Fractional q numbers are also correctly predicted. From Figure 3, the accuracy of qcalc is estimated to be ±0.4. The good agreement between all calculated and reported q values indicates that the applied previously reported q values are correct. Moreover, it indicates that q and FW are the main parameters that determined the relaxivity; apparently, the influence of other parameters was rather small. This is surprising, since r1 at low LF was expected to be dominated by the electronic relaxation. Even the q-values of complexes with relatively large τS0-values (Mn2(ENOTA)(H2O)2, [Mn(15pyN5)(H2O)]2+, [Mn(15pyN3O2)(H2O)2]2+, and [Mn(H2O)6]2+, see Table 1) seem to be predicted correctly. To explain this, simulations of r1 at LF = 0.01 MHz as a function of τM, τR, and τS0 were made using the SBM equations. Figure 4 shows, for example, the simulations for typical q = 1 Mn2+ complexes. Figure 4A shows that r1 is unsensitive to variations in τM; however, it is strongly dependent on τR, and Figure 4B shows that r1 was only very sensitive to variations of τS0 for complexes for which τR > 150 ps. The complexes in the database used to deduce Equations (11) and (12) are exclusively of low and medium molecular weight compounds (FW < 1250). The simulations in Figure 4 confirmed that for those complexes, r1 can be expected to be insensitive to variations in electronic relaxation rates and τM. However, it may be expected that these Equations are no longer valid for high molecular weight Mn2+ complexes. However, in those cases, q can generally be estimated from low molecular analogs.
An attempt to apply a similar procedure for the evaluation of q from r1 values at LF = 60 MHz resulted in unreasonable qcalc values that deviated substantially from qlit.
3. Methods
4. Conclusions
An inspection of published 1H NMRD profiles of Mn2+-complexes of low and medium molecular weights (FW < 1250) shows that the magnitudes of r1 at LF ≤ 0.1 MHz is dominated by the parameters q and τR. Using a dataset of 49 published NMRD profiles as learning set, Equations (11) and (12) were evaluated for a quick and reliable estimation of q from r1 values at LF ≤ 0.1 MHz and the molecular weight of the complex.
Author Contributions
Conceptualization, J.A.P. and C.F.G.C.G.; validation, J.A.P. and C.F.G.C.G.; formal analysis, J.A.P.; writing—review and editing, J.A.P. and C.F.G.C.G.
Funding
This research received no external funding.
Conflicts of Interest
The authors declare no conflict of interest.
References
- Merbach, A.E.; Helm, L.; Tóth, É. The Chemistry of Contrast Agents in Medical Magnetic Resonance Imaging, 2nd ed.; John Wiley & Sons, Ltd.: Chichester, UK, 2013; ISBN 0-471-60778-9. [Google Scholar]
- Caravan, P.; Ellison, J.J.; McMurry, T.J.; Lauffer, R.B. Gadolinium(III) chelates as MRI contrast agents: Structure, dynamics, and applications. Chem. Rev. 1999, 99, 2293–2352. [Google Scholar] [CrossRef] [PubMed]
- Caravan, P.; Farrar, C.T.; Frullano, L.; Uppal, R. Influence of molecular parameters and increasing magnetic field strength on relaxivity of gadolinium- and manganese-based T1 contrast agents. Contrast Media Mol. Imaging 2009, 4, 89–100. [Google Scholar] [CrossRef] [PubMed]
- Baranyai, Z.; Brücher, E.; Uggeri, F.; Maiocchi, A.; Tóth, I.; Andrási, M.; Gáspár, A.; Zékány, L.; Aime, S. The role of equilibrium and kinetic properties in the dissociation of Gd[DTPA-bis(methylamide)] (omniscan) at near to physiological conditions. Chem. Eur. J. 2015, 21, 4789–4799. [Google Scholar] [CrossRef] [PubMed]
- Brücher, E.; Tircsó, G.; Baranyai, Z.; Kovács, Z.; Sherry, A.D. Stability and toxicity of contrast agents. In The Chemistry of Contrast Agents in Medical Magnetic Resonance Imaging; Merbach, A.E., Helm, L., Tóth, É., Eds.; John Wiley & Sons Ltd.: Chichester, UK, 2013; pp. 157–208. [Google Scholar]
- Kanal, E.; Tweedle, M.F. Residual or retained gadolinium: Practical implications for radiologists and our patients. Radiology 2015, 275, 630–634. [Google Scholar] [CrossRef] [PubMed]
- Kanda, T.; Fukusato, T.; Matsuda, M.; Toyoda, K.; Oba, H.; Kotoku, J.I.; Haruyama, T.; Kitajima, K.; Furui, S. Gadolinium-based contrast agent accumulates in the brain even in subjects without severe renal dysfunction: Evaluation of autopsy brain specimens with inductively coupled plasma mass spectroscopy. Radiology 2015, 276, 228–232. [Google Scholar] [CrossRef] [PubMed]
- Pullicino, R.; Radon, M.; Biswas, S.; Bhojak, M.; Das, K. A review of the current evidence on gadolinium deposition in the brain. Clin. Neuroradiol. 2018, 128, 159–169. [Google Scholar] [CrossRef] [PubMed]
- Haynes, W.M. CRC Handbook of Chemistry and Physics; CRC Press: Boca Raton, FL, USA, 2014; ISBN 9781498754286. [Google Scholar]
- Alpoim, M.C.; Urbano, A.M.; Geraldes, C.F.G.C.; Peters, J.A. Determination of the number of inner-sphere water-molecules in lanthanide(III) polyaminocarboxylate complexes. J. Chem. Soc. Dalton Trans. 1992, 463–467. [Google Scholar] [CrossRef]
- Djanashvili, K.; Peters, J.A. How to determine the number of inner-sphere water molecules in lanthanide(III) complexes by 17O NMR spectroscopy. A technical note. Contrast Media Mol. Imaging 2007, 2, 67–71. [Google Scholar] [CrossRef] [PubMed]
- Beeby, A.; Clarkson, I.M.; Dickins, R.S.; Faulkner, S.; Parker, D.; Royle, L.; de Sousa, A.S.; Williams, J.A.G.; Woods, M. Non-radiative deactivation of the excited states of europium, terbium and ytterbium complexes by proximate energy-matched OH, NH and CH oscillators: An improved luminescence method for establishing solution hydration states. J. Chem. Soc. Perkin Trans. 1999, 2, 493–504. [Google Scholar] [CrossRef]
- Esteban-Gómez, D.; Cassino, C.; Botta, M.; Platas-Iglesias, C. 17O and 1H relaxometric and DFT study of hyperfine coupling constants in [Mn(H2O)6]2+. RSC Adv. 2014, 4, 7094–7103. [Google Scholar] [CrossRef]
- Póta, K.; Garda, Z.; Kálmán, F.K.; Barriada Pereira, J.L.; Esteban-Gómez, D.; Platas-Iglesias, C.; Tóth, I.; Brücher, E.; Tircsó, G. Making a next step toward inert Mn2+ complexes of open-chain ligands: The case of the rigid PhDTA ligand. New J. Chem. 2018, 42, 8001–8011. [Google Scholar] [CrossRef]
- Leigh, J.S., Jr. Relaxation times in systems with chemical exchange. Exact solutions. J. Magn. Reson. 1971, 4, 308–311. [Google Scholar] [CrossRef]
- Swift, T.J.; Connick, R.E. NMR (nuclear magnetic resonance)-relaxation mechanisms of O17 in aqueous solutions of paramagnetic cations and the lifetime of water molecules in the first coordination sphere. J. Chem. Phys. 1962, 37, 307–320. [Google Scholar] [CrossRef]
- Solomon, I. Relaxation processes in a system of two spins. Phys. Rev. 1955, 99, 559–565. [Google Scholar] [CrossRef]
- Bloembergen, N. Proton relaxation times in paramagnetic solutions. J. Chem. Phys. 1957, 27, 572–573. [Google Scholar] [CrossRef]
- Bloembergen, N.; Morgan, L.O. Proton relaxation times in paramagnetic solutions. Effects of electron spin relaxation. J. Chem. Phys. 1961, 34, 842–850. [Google Scholar] [CrossRef]
- Freed, J.H. Dynamic effects of pair correlation functions on spin relaxation by translational diffusion in liquids. II. Finite jumps and independent T1 processes. J. Chem. Phys. 1978, 68, 4034–4037. [Google Scholar] [CrossRef]
- Bertini, I.; Briganti, F.; Xia, Z.; Luchinat, C. Nuclear magnetic relaxation dispersion studies of hexaaquo manganese(II) ions in water-glycerol mixtures. J. Magn. Reson. 1993, 101, 198–201. [Google Scholar] [CrossRef]
- Koenig, S.H.; Brown, R.D.; Studebaker, J. On the interpretation of solvent proton magnetic relaxation data with particular application to the structure of the active site of Mn-carboxypeptidase A. In Cold Spring Harbor Symposia on Quantitative Biology; Cold Spring Harbor Laboratory Press: Cold Spring Harbor, New York, NY, USA, 1971; Volume 36, pp. 551–559. [Google Scholar]
- Balogh, E.; He, Z.; Hsieh, W.; Liu, S.; Tóth, É. Dinuclear complexes formed with the triazacyclononane derivative ENOTA4−: High-pressure 17O NMR evidence of an associative water exchange on [MnII2(ENOTA)(H2O)2]. Inorg. Chem. 2007, 46, 238–250. [Google Scholar] [CrossRef] [PubMed]
- Helm, L. Relaxivity in paramagnetic systems: Theory and mechanism. Prog. Nucl. Magn. Reson. Spectrosc. 2006, 49, 45–64. [Google Scholar] [CrossRef]
- Belorizky, E.; Fries, P.H.; Helm, L.; Kowalewski, J.; Kruk, D.; Sharp, R.R.; Westlund, P.O. Comparison of different methods for calculating the paramagnetic relaxation enhancement of nuclear spins as a function of the magnetic field. J. Chem. Phys. 2008, 128, 052315. [Google Scholar] [CrossRef] [PubMed]
- Troughton, J.S.; Greenfield, M.T.; Greenwood, J.M.; Dumas, S.; Wiethoff, A.J.; Wang, J.; Spiller, M.; McMurry, T.J.; Caravan, P. Synthesis and evaluation of a high relaxivity manganese(II)-based MRI contrast agent. Inorg. Chem. 2004, 43, 6313–6323. [Google Scholar] [CrossRef] [PubMed]
- Belorizky, E.; Fries, P.H. Simple analytical approximation of the longitudinal electronic relaxation rate of Gd(III) complexes in solutions. Phys. Chem. Chem. Phys. 2004, 6, 2341–2351. [Google Scholar] [CrossRef]
- Geraldes, C.F.G.C.; Sherry, A.D.; Brown, R.D., III; Koenig, S.H. Magnetic field dependence of solvent proton relaxation rates induced by gadolinium(3+) and manganese(2+) complexes of various polyaza macrocyclic ligands: Implications for NMR imaging. Magn. Reson. Med. 1986, 3, 242–250. [Google Scholar] [CrossRef] [PubMed]
- Koenig, S.H.; Brown, R.D., III. Relaxometry of magnetic resonance imaging contrast agents. Magn. Reson. Annu. 1987, 263–286. [Google Scholar]
- Jackels, S.C.; Durham, M.M.; Newton, J.E.; Henninger, T.C. Aqueous proton NMR relaxation enhancement by manganese(II) macrocyclic complexes: Structure-relaxivity relationships. Inorg. Chem. 1992, 31, 234–239. [Google Scholar] [CrossRef]
- Rolla, G.A.; Platas-Iglesias, C.; Botta, M.; Tei, L.; Helm, L. 1H and 17O NMR relaxometric and computational study on macrocyclic Mn(II) complexes. Inorg. Chem. 2013, 52, 3268–3279. [Google Scholar] [CrossRef] [PubMed]
- Forgács, A.; Botta, M.; Regueiro-Figueroa, M.; Barriada, J.L.; Esteban-Gómez, D.; de Blas, A.; Rodríguez-Blas, T.; Platas-Iglesias, C. Mono-, bi-, and trinuclear bis-hydrated Mn(2+) complexes as potential MRI contrast agents. Inorg. Chem. 2015, 54, 9576–9587. [Google Scholar] [CrossRef] [PubMed]
- Tei, L.; Gugliotta, G.; Fekete, M.; Kalman, F.K.; Botta, M. Mn(II) complexes of novel hexadentate AAZTA-like chelators: A solution thermodynamics and relaxometric study. Dalton Trans. 2011, 40, 2025–2032. [Google Scholar] [CrossRef] [PubMed]
- Rolla, G.A.; Tei, L.; Fekete, M.; Arena, F.; Gianolio, E.; Botta, M. Responsive Mn(II) complexes for potential applications in diagnostic magnetic resonance imaging. Bioorg. Med. Chem. 2011, 19, 1115–1122. [Google Scholar] [CrossRef] [PubMed]
- Aime, S.; Anelli, L.; Botta, M.; Brocchetta, M.; Canton, S.; Fedeli, F.; Gianolio, E.; Terreno, E. Relaxometric evaluation of novel manganese(II) complexes for application as contrast agents in magnetic resonance imaging. J. Biol. Inorg. Chem. 2002, 7, 58–67. [Google Scholar] [CrossRef] [PubMed]
- Artali, R.; Baranyai, Z.; Botta, M.; Giovenzana, G.B.; Maspero, A.; Negri, R.; Palmisano, G.; Sisti, M.; Tollari, S. Solution thermodynamics, computational and relaxometric studies of ditopic DO3A-based Mn(II) complexes. New J. Chem. 2015, 39, 539–547. [Google Scholar] [CrossRef]
- Patinec, V.; Rolla, G.A.; Botta, M.; Tripier, R.; Esteban-Gómez, D.; Platas-Iglesias, C. Hyperfine coupling constants on inner-sphere water molecules of a triazacyclononane-based Mn(II) complex and related systems relevant as mri contrast agents. Inorg. Chem. 2013, 52, 11173–11184. [Google Scholar] [CrossRef] [PubMed]
- Drahoš, B.; Kotek, J.; Císařová, I.; Hermann, P.; Helm, L.; Lukeš, I.; Tóth, É. Mn2+ complexes with 12-membered pyridine based macrocycles bearing carboxylate or phosphonate pendant arm: Crystallographic, thermodynamic, kinetic, redox, and 1H/17O relaxation studies. Inorg. Chem. 2011, 50, 12785–12801. [Google Scholar] [CrossRef] [PubMed]
- Molnár, E.; Camus, N.; Patinec, V.; Rolla, G.A.; Botta, M.; Tircsó, G.; Kálmán, F.K.; Fodor, T.; Tripier, R.; Platas-Iglesias, C. Picolinate-containing macrocyclic Mn2+ complexes as potential MRI contrast agents. Inorg. Chem. 2014, 53, 5136–5149. [Google Scholar] [CrossRef] [PubMed]
- Drahoš, B.; Pniok, M.; Havlíčková, J.; Kotek, J.; Císařová, I.; Hermann, P.; Lukeš, I.; Tóth, É. Mn2+ complexes of 1-oxa-4,7-diazacyclononane based ligands with acetic, phosphonic and phosphinic acid pendant arms: Stability and relaxation studies. Dalton Trans. 2011, 40, 10131–10146. [Google Scholar] [CrossRef] [PubMed]
- Laine, S.; Bonnet, C.S.; Kálmán, F.K.; Garda, Z.; Pallier, A.; Caillé, F.; Suzenet, F.; Tircsó, G.; Tóth, É. Mn2+ complexes of open-chain ligands with a pyridine backbone: Less donor atoms lead to higher kinetic inertness. New J. Chem. 2018, 42, 8012–8020. [Google Scholar] [CrossRef]
- De Sá, A.; Bonnet, C.S.; Geraldes, C.F.G.C.; Tóth, É.; Ferreira, P.M.T.; André, J.P. Thermodynamic stability and relaxation studies of small, triaza-macrocyclic Mn(II) chelates. Dalton Trans. 2013, 42, 4522–4532. [Google Scholar] [CrossRef] [PubMed] [Green Version]
- Forgács, A.; Pujales-Paradela, R.; Regueiro-Figueroa, M.; Valencia, L.; Esteban-Gómez, D.; Botta, M.; Platas-Iglesias, C. Developing the family of picolinate ligands for Mn2+ complexation. Dalton Trans. 2017, 1546–1558. [Google Scholar] [CrossRef] [PubMed]
- Molnár, E.; Váradi, B.; Garda, Z.; Botár, R.; Kálmán, F.K.; Tóth, É.; Platas-Iglesias, C.; Tóth, I.; Brücher, E.; Tircsó, G. Remarkable differences and similarities between the isomeric Mn(II)-cis- and trans-1,2-diaminocyclohexane-N,N,N′,N′-tetraacetate complexes. Inorg. Chim. Acta 2018, 472, 254–263. [Google Scholar] [CrossRef]
- Forgács, A.; Tei, L.; Baranyai, Z.; Esteban-Gómez, D.; Platas-Iglesias, C.; Botta, M. Optimising the relaxivities of Mn2+ complexes by targeting human serum albumin (HSA). Dalton Trans. 2017, 8494–8504. [Google Scholar] [CrossRef] [PubMed]
- Vanasschen, C.; Molnár, E.; Tircsó, G.; Kálmán, F.K.; Tóth, É.; Brandt, M.; Coenen, H.H.; Neumaier, B. Novel cdta-based, bifunctional chelators for stable and inert MnII complexation: Synthesis and physicochemical characterization. Inorg. Chem. 2017, 56, 7746–7760. [Google Scholar] [CrossRef] [PubMed]
- Drahoš, B.; Kotek, J.; Hermann, P.; Lukeš, I.; Tóth, É. Mn2+ complexes with pyridine-containing 15-membered macrocycles: Thermodynamic, kinetic, crystallographic, and 1H/17O relaxation studies. Inorg. Chem. 2010, 49, 3224–3238. [Google Scholar] [CrossRef] [PubMed]
- Webplotdigitizer. Available online: https://automeris.io/WebPlotDigitizer/ (accessed on 10 August 2018).
- Curveexpert Basic, Version 2.1.0. Available online: http://www.curveexpert.net (accessed on 10 August 2018).
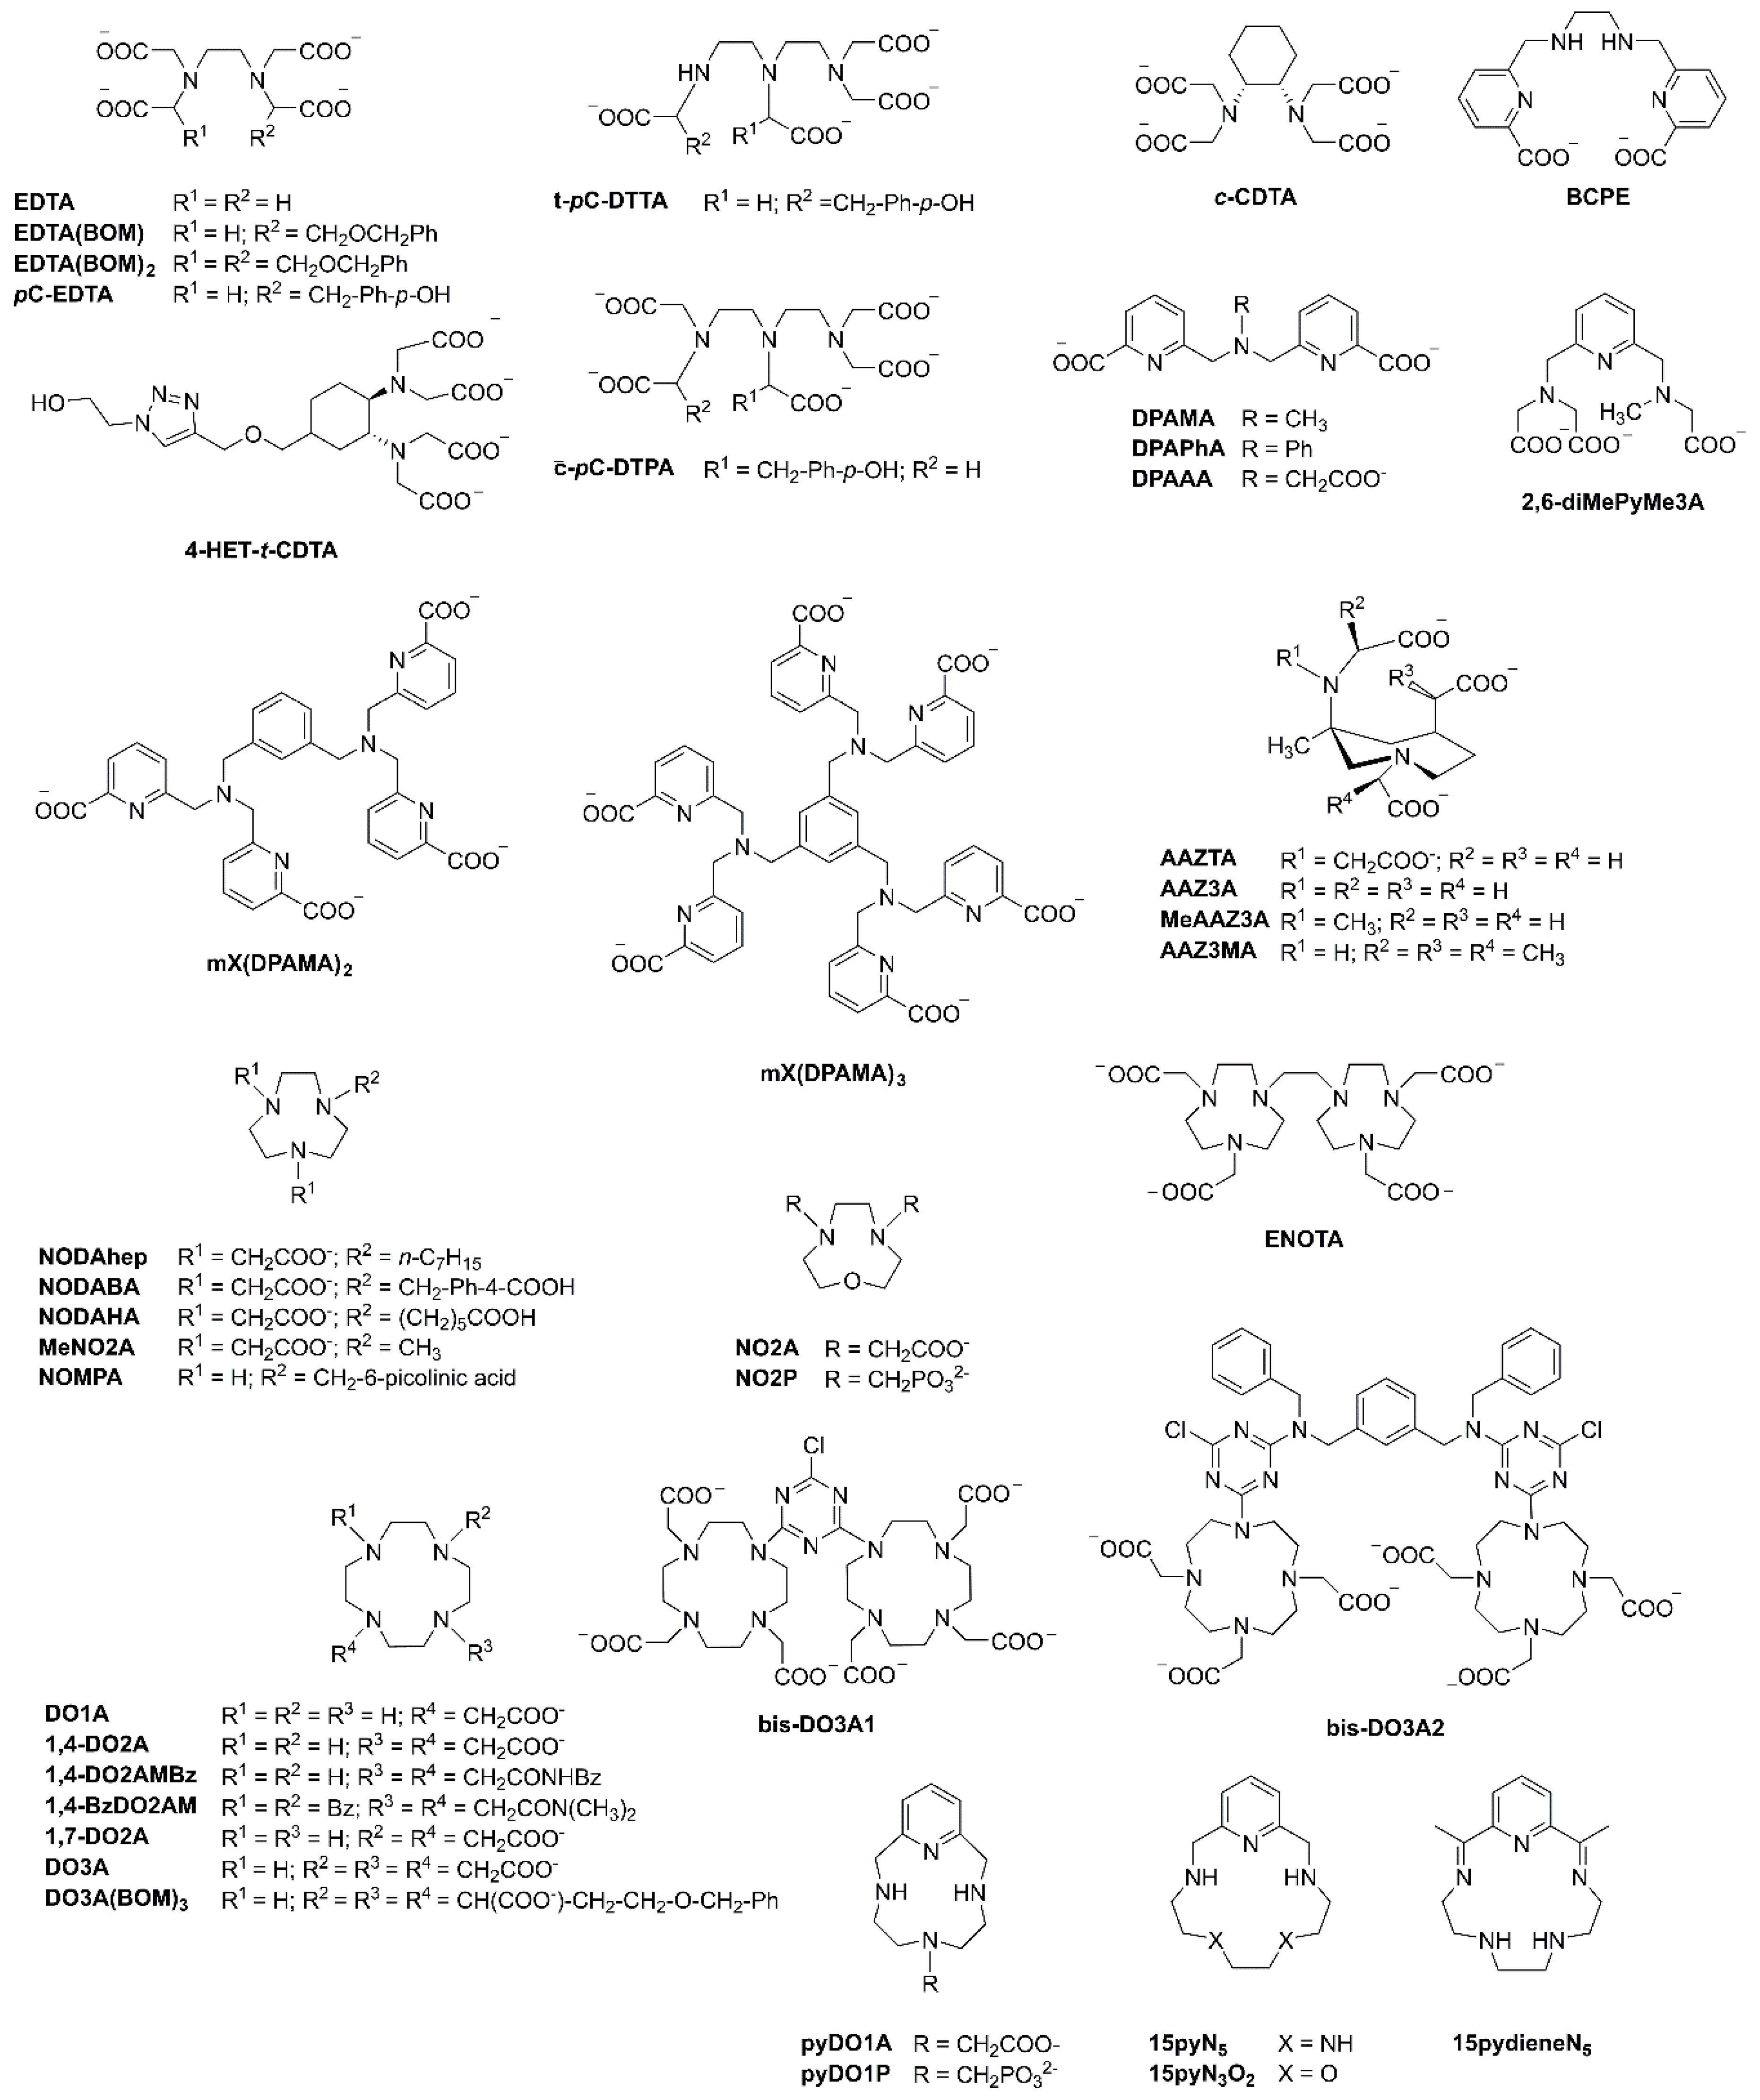
Figure 1.
Structures of the organic ligands of the Mn2+ complexes mentioned in Table 1.
Figure 1.
Structures of the organic ligands of the Mn2+ complexes mentioned in Table 1.

Figure 2.
Plot of low field r1 versus q-values collected from previously reported publications on Mn2+-complexes.
Figure 2.
Plot of low field r1 versus q-values collected from previously reported publications on Mn2+-complexes.

Figure 3.
Plot of the hydration number for the Mn2+-complexes mentioned in Table 1 calculated with Equations (1) and (2) (qcalc) versus the corresponding values reported in the literature (qlit).
Figure 3.
Plot of the hydration number for the Mn2+-complexes mentioned in Table 1 calculated with Equations (1) and (2) (qcalc) versus the corresponding values reported in the literature (qlit).

Figure 4.
Representations of simulations of r1 at LF = 0.01 MHz (A) as function of τM and τR and (B) as function of τS0 and τR. Solomon-Bloembergen-Morgan (SBM) Equations (1)–(10) were applied using the following parameters: q = 1, rMnH = 2.83 Å, DMnH = 2.31 × 10⁻⁹ m2·s−1, aMnH = 3.6 Å.
Figure 4.
Representations of simulations of r1 at LF = 0.01 MHz (A) as function of τM and τR and (B) as function of τS0 and τR. Solomon-Bloembergen-Morgan (SBM) Equations (1)–(10) were applied using the following parameters: q = 1, rMnH = 2.83 Å, DMnH = 2.31 × 10⁻⁹ m2·s−1, aMnH = 3.6 Å.


Table 1.
Comparison of qlit with qref as calculated with Equations (11) and (12) for the database of Mn2+ complexes. Other parameters of relevance for the relaxivity at 298 K and hyperfine coupling constants reported in the literature are included.
Table 1.
Comparison of qlit with qref as calculated with Equations (11) and (12) for the database of Mn2+ complexes. Other parameters of relevance for the relaxivity at 298 K and hyperfine coupling constants reported in the literature are included.
| Organic Ligand | qlita | r1b (s−1·mM−1) | FW | qcalcc | τRd (ps) | τS0d (ps) | τMd (ns) | RMnHd (Å) | |AO/ħ| d (106 rad/s) | Ref. |
|---|---|---|---|---|---|---|---|---|---|---|
| DOTA | 0.0 | 2.76 | 455.3 | 0.4 | - | - | - | - | - | [28] |
| DTPA | 0.0 | 2.40 | 390.2 | 0.4 | - | - | - | - | - | [29] |
| DTPA | 0.0 | 2.30 | 390.2 | 0.4 | - | - | - | - | - | [30] |
| 1,7-DO2A | 0.0 | 2.53 | 341.3 | 0.4 | - | 152 | - | - | - | [31] |
| NOTA | 0.0 | 2.30 | 356.2 | 0.4 | - | - | - | - | - | [28] |
| BCPE | 0.0 | 2.23 | 383.3 | 0.4 | - | 87 | - | - | - | [32] |
| DO3A | 0.0 | 2.27 | 398.3 | 0.4 | - | 117 | - | - | - | [31] |
| AAZTA | 0.0 | 2.53 | 412.3 | 0.4 | - | 148 | - | - | - | [33] |
| c-pC-DTPA | 0.0 | 3.02 | 492.4 | 0.4 | - | 161 | - | - | - | [34] |
| t-pC-DTTA | 0.0 | 2.55 | 510.4 | 0.4 | - | 108 | - | - | - | [34] |
| DO3A(BOM)3 | 0.0 | 2.55 | 758.7 | 0.3 | - | 135 | - | - | - | [35] |
| bis-DO3A1 | 0.0 | 2.27 | 837.8 | 0.3 | - | 93 | - | - | - | [36] |
| bis-DO3A2 | 0.0 | 2.48 | 1340.3 | 0.3 | - | 137 | - | - | - | [36] |
| AAZ3MA | 0.2 | 3.04 | 415.3 | 0.5 | 51.0 | 96 | 7.52 | 2.81 | 8.7 | [33] |
| MeAAZ3A | 0.3 | 3.68 | 387.3 | 0.6 | 50.0 | 140 | 7.94 | 2.81 | 7.9 | [33] |
| AAZ3A | 0.6 | 5.05 | 373.3 | 0.8 | 50.0 | 158 | 21.3 | 2.81 | 7.2 | [33] |
| 1,4-DO2A | 0.9 | 4.50 | 359.3 | 0.7 | 46.0 | 74 | 88.2 | 2.83 | 43.0 | [31] |
| DO1A | 1.0 | 4.04 | 302.3 | 0.7 | 22.0 | 88 | 0.168 | 2.83 | 39.4 | [31] |
| MeNO2A | 1.0 | 4.96 | 330.2 | 0.9 | 36.0 | 101 | 1.60 | 2.77 | 46.0 | [37] |
| pyDO1A | 1.0 | 3.54 | 336.3 | 0.6 | 23.0 | 449 | 0.330 | - | - | [38] |
| NOMPA | 1.0 | 6.21 | 336.3 | 1.1 | 51.2 | 129 | 0.361 | 2.77 | −73.3 | [39] |
| EDTA | 1.0 | 5.41 | 361.2 | 0.9 | 56.0 | 81 | 2.12 | 2.83 | 40.5 | [31] |
| EDTA | 1.0 | 5.41 | 361.2 | 0.9 | 57.0 | 81 | 2.12 | 2.83 | 40.5 | [31] |
| EDTA | 1.0 | 5.81 | 361.2 | 1.0 | - | - | - | - | - | [30] |
| EDTA | 1.0 | 5.60 | 361.2 | 0.9 | - | - | - | - | - | [29] |
| pyDO1P | 1.0 | 3.84 | 371.2 | 0.6 | 38.6 | 36 | 0.565 | - | 39.9 | [38] |
| NO2P | 1.0 | 8.03 | 387.1 | 1.3 | 103.0 | 87 | 83.333 | 2.75 | 33.3 | [40] |
| 2,6-diMePyMe3A | 1.0 | 5.23 | 395.2 | 0.8 | 46.0 | 52 | 0.357 | 2.83 | 26.4 | [41] |
| NODAHep | 1.0 | 8.10 g | 414.4 | 1.3 | 84.0 | 37 | 370 | 2.75 | 30.0 | [42] |
| DPAAA | 1.0 | 6.75 | 415.2 | 1.0 | 47.6 | 146 | 7.94 | 2.76 | 31.5 | [43] |
| c-CDTA | 1.0 | 6.12 | 415.3 | 0.9 | 74.0 | 78 | 4.44 | 2.83 | 42.7 | [44] |
| NODAHA | 1.0 | 7.51 g | 429.3 | 1.1 | 80.0 | 32 | 370 | 2.75 | 30.0 | [42] |
| NODABA | 1.0 | 9.80 g | 449.3 | 1.5 | 121.0 | 37 | 769 | 2.75 | 30.0 | [42] |
| t-pC-EDTA | 1.0 | 5.93 | 467.3 | 0.9 | 75.4 | 80 | - | 2.92 | - | [34] |
| EDTA(BOM) | 1.0 | 5.61 e | 495.3 | 0.8 | 83.7 | 87 | 10.7 | 2.90 | - | [35] |
| 1,4-DO2AMBz | 1.0 | 5.67 | 539.6 | 0.8 | 85.0 | 71 | 5.71 | 2.83 | 33.0 | [45] |
| 4-HET-t-CDTA | 1.0 | 6.72 | 570.4 | 0.9 | 104.9 | 56 | 5.68 | 2.83 | 40.0 | [46] |
| 1,4-BzDO2AM | 1.0 | 5.89 | 595.7 | 0.8 | 96.0 | 60 | 3.95 | 2.83 | 31.0 | [45] |
| EDTA(BOM)2 | 1.0 | 7.25 e | 629.5 | 0.9 | 110.8 | 84 | 7.60 | 2.90 | - | [35] |
| ENOTA | 1.0 | 6.46 f | 658.5 | 0.8 | 85.0 | 4317 | 18.2 | 2.75 | 5.2 | [23] |
| NO2A | 1.4 | 5.67 | 317.2 | 1.0 | 22.0 | 160 | 0.840 | 2.75 | 33.3 | [40] |
| 15pyN5 | 2.0 | 9.64 | 340.3 | 1.7 | 28.3 | 8710 | 14.5 | 2.81 | 38.6 | [47] |
| 15pyN3O2 | 2.0 | 11.52 | 342.3 | 2.0 | 40.3 | 7174 | 263 | 2.81 | 38.6 | [47] |
| 15pydieneN5 | 2.0 | 14.20 | 364.3 | 2.3 | - | - | - | - | - | [30] |
| DPAMA | 2.0 | 11.25 | 390.3 | 1.8 | 47.8 | 167 | 3.27 | 2.74 | - | [32] |
| DPAPhA | 2.0 | 11.65 | 452.3 | 1.7 | 81.0 | 87 | 17.9 | 2.78 | 25.0 | [43] |
| mX(DPAMA)2 | 2.0 | 17.65 | 854.6 | 2.1 | 95.8 | 183 | 32.7 | 2.74 | - | [32] |
| mX(DPAMA)3 | 2.0 | 19.72 | 1243.8 | 2.2 | 136.0 | 173 | 32.7 | 2.74 | - | [32] |
| none | 6.0 | 19.52 h | 163.0 | 5.6 | 30.0 | 26042 | 35.5 | 2.83 | 34.6 | [13] |
| none | 6.0 | 20.98 i | 163.0 | 6.0 | - | - | - | - | - | [30] |
a As reported in reference. b Measured in reported NMRD profile at Larmor frequency (LF) = 0.01 MHz, unless stated otherwise. c As calculated with Equations (11) and (12). d Reported values evaluated from analysis of Nuclear Magnetic Relaxation Dispersion (NMRD) and 17O NMRD data. e LF = 0.03 MHz. f LF =1.14 MHz. g LF = 0.02 MHz. h LF = 1.00 MHz. I LF = 1.35 MHz.
© 2018 by the authors. Licensee MDPI, Basel, Switzerland. This article is an open access article distributed under the terms and conditions of the Creative Commons Attribution (CC BY) license (http://creativecommons.org/licenses/by/4.0/).
Share and Cite
MDPI and ACS Style
Peters, J.A.; Geraldes, C.F.G.C. A Semi-Empirical Method for the Estimation of the Hydration Number of Mn(II)-Complexes. Inorganics 2018, 6, 116. https://0-doi-org.brum.beds.ac.uk/10.3390/inorganics6040116
AMA Style
Peters JA, Geraldes CFGC. A Semi-Empirical Method for the Estimation of the Hydration Number of Mn(II)-Complexes. Inorganics. 2018; 6(4):116. https://0-doi-org.brum.beds.ac.uk/10.3390/inorganics6040116
Chicago/Turabian StylePeters, Joop A., and Carlos F. G. C. Geraldes. 2018. "A Semi-Empirical Method for the Estimation of the Hydration Number of Mn(II)-Complexes" Inorganics 6, no. 4: 116. https://0-doi-org.brum.beds.ac.uk/10.3390/inorganics6040116
Note that from the first issue of 2016, this journal uses article numbers instead of page numbers. See further details here.