1H NMR Relaxometric Analysis of Paramagnetic Gd2O3:Yb Nanoparticles Functionalized with Citrate Groups


Department of Sciences and Technological Innovation, University of Eastern Piedmont, V. le T. Michel 11, 15121 Alessandria, Italy
*
Author to whom correspondence should be addressed.
Inorganics 2019, 7(3), 34; https://0-doi-org.brum.beds.ac.uk/10.3390/inorganics7030034
Submission received: 31 January 2019
/
Revised: 26 February 2019
/
Accepted: 27 February 2019
/
Published: 4 March 2019
(This article belongs to the Special Issue Smart Tools for Smart Applications: New Insights into Inorganic Magnetic Systems and Materials)
Abstract
:Gd2O3 nanoparticles doped with different amount of Yb3+ ions and coated with citrate molecules were prepared by a cheap and fast co-precipitation procedure and proposed as potential “positive” contrast agents in magnetic resonance imaging. The citrate was used to improve the aqueous suspension, limiting particles precipitation. The relaxometric properties of the samples were studied in aqueous solution as a function of the magnetic field strength in order to evaluate the interaction of the paramagnetic ions exposed on the surface with the water molecules in proximity. The nanoparticles showed high relaxivity values at a high magnetic field with respect to the clinically used Gd3+-chelates and comparable to those of similar nanosytems. Special attention was also addressed to the investigation of the chemical stability of the nanoparticles in biological fluid (reconstructed human serum) and in the presence of a chelating agent.

1. Introduction
The magnetic resonance imaging is currently one of the best diagnostic solutions adopted in clinic to identify different kinds of pathologies, due to the intrinsic high spatial resolution associated to the use of low energy radiation. More than 40% of the clinical practices require the administration to the patients of specific contrast agents. These probes are paramagnetic or super-paramagnetic compounds able to reduce the longitudinal (T1) and/or the transversal relaxation time (T2) of the water protons in tissues, thus increasing the sensitivity of the analysis, reducing possible artefacts, and improving the quality of the collected images [1,2,3]. Currently, the T1-MRI probes used in clinics are mainly based on linear and cyclic Gd3+-chelates, because they are characterized by good thermodynamic stability and kinetic inertness and often well tolerated by the patients [1]. Nevertheless, the amount of contrast agents required for the analysis is very high (from mM to M) and recently some studies reported on the accumulation of these probes in the cerebral membrane. To overcome these problems, three different strategies may be followed: (i) the design of novel paramagnetic probes based on less toxic metals (e.g., Mn2+, Fe3+, ….), (ii) the optimization of the Gd(III)-chelates to enhance the relaxivity performances; and (iii) the development of nanoparticles containing a large amount of paramagnetic sites, with high relaxivity at magnetic fields used in clinic (1.5–3 Tesla). This last strategy is particularly interesting because it favors a lowering of the detection limit of the MRI technique and a reduction of the contrast agent amount to administrate [4].
The paramagnetic nanoparticles proposed in the literature are composed using a diamagnetic inorganic support functionalized with Gd(III)-chelates, opportunely modified to promote their chemical attachment on the surface [5,6,7,8,9,10]; or they are completely inorganic [11,12]. In the last case, the particles contain directly in the framework paramagnetic Gd3+ ions, often combined with other lanthanides with specific properties [11]. Recently, GdF3, NaGdF4, and Gd2O3 systems were synthesized and proposed for diagnostic applications [11]. These nanoparticles typically require a careful design, aiming to reduce the particles size and to increase the surface hydrophilicity. For instance, Van Veggel et al, recently demonstrated that the best relaxometric performances could be achieved by decreasing the particles size to below 5 nm, with a consequent increase of the surface to volume ratio [13]. The selection of the capping agents to confine on the particles surface is another important topic. Particles with different anions and polymer groups were synthesized in order to increase the water suspendibility [14,15,16].
Gd2O3 nanoparticles doped with luminescent lanthanides (Eu3+, Tb3+, Tm3+, and Er3+) [17,18,19,20,21] have been extensively studied as potential optical imaging and MRI probes. Furthermore, because of the largest atomic number of Yb3+ among the lanthanides, mixed oxide nanoparticles containing Yb3+ and Gd3+ ions were proposed as a potential dual CT (computed tomography) and MRI probes, obtaining interesting results [22].
On the base of these considerations, we adopted in this work a low cost one-pot procedure for the preparation of Gd2O3 nanoparticles, in order to reduce the reactions time and to eliminate the calcination steps that typically require high temperatures. Their surface was functionalized with citrate molecules able to stabilize the particles when dispersed in aqueous solution [23]. The idea to select citrate as chelating agent is motivated by the interesting results obtained for GdF3 nanoparticles [23]. It was demonstrated that citrate molecules confer both high hydrophilicity to the particles surface, thus improving the interaction of the metal ions exposed on the surface with the water molecules and high negative charge density, favoring the stability of the final aqueous suspensions over the time. In parallel, Gd2O3 NPs were also doped with two different Yb3+ loading (5 and 10 mol %). The co-presence of Gd3+ and Yb3+ ions in the same particle can open the way to their possible use as dual MRI and CT contrast agents, as previously demonstrated for parent samples [22]. Specific attention was devoted to the investigation of their relaxometric properties as a function of the magnetic field and of their chemical stability in different conditions. These two aspects unfortunately are often missed in the literature and they require a deep comprehension to opportunely design very efficient MRI probes.
2. Results and Discussion
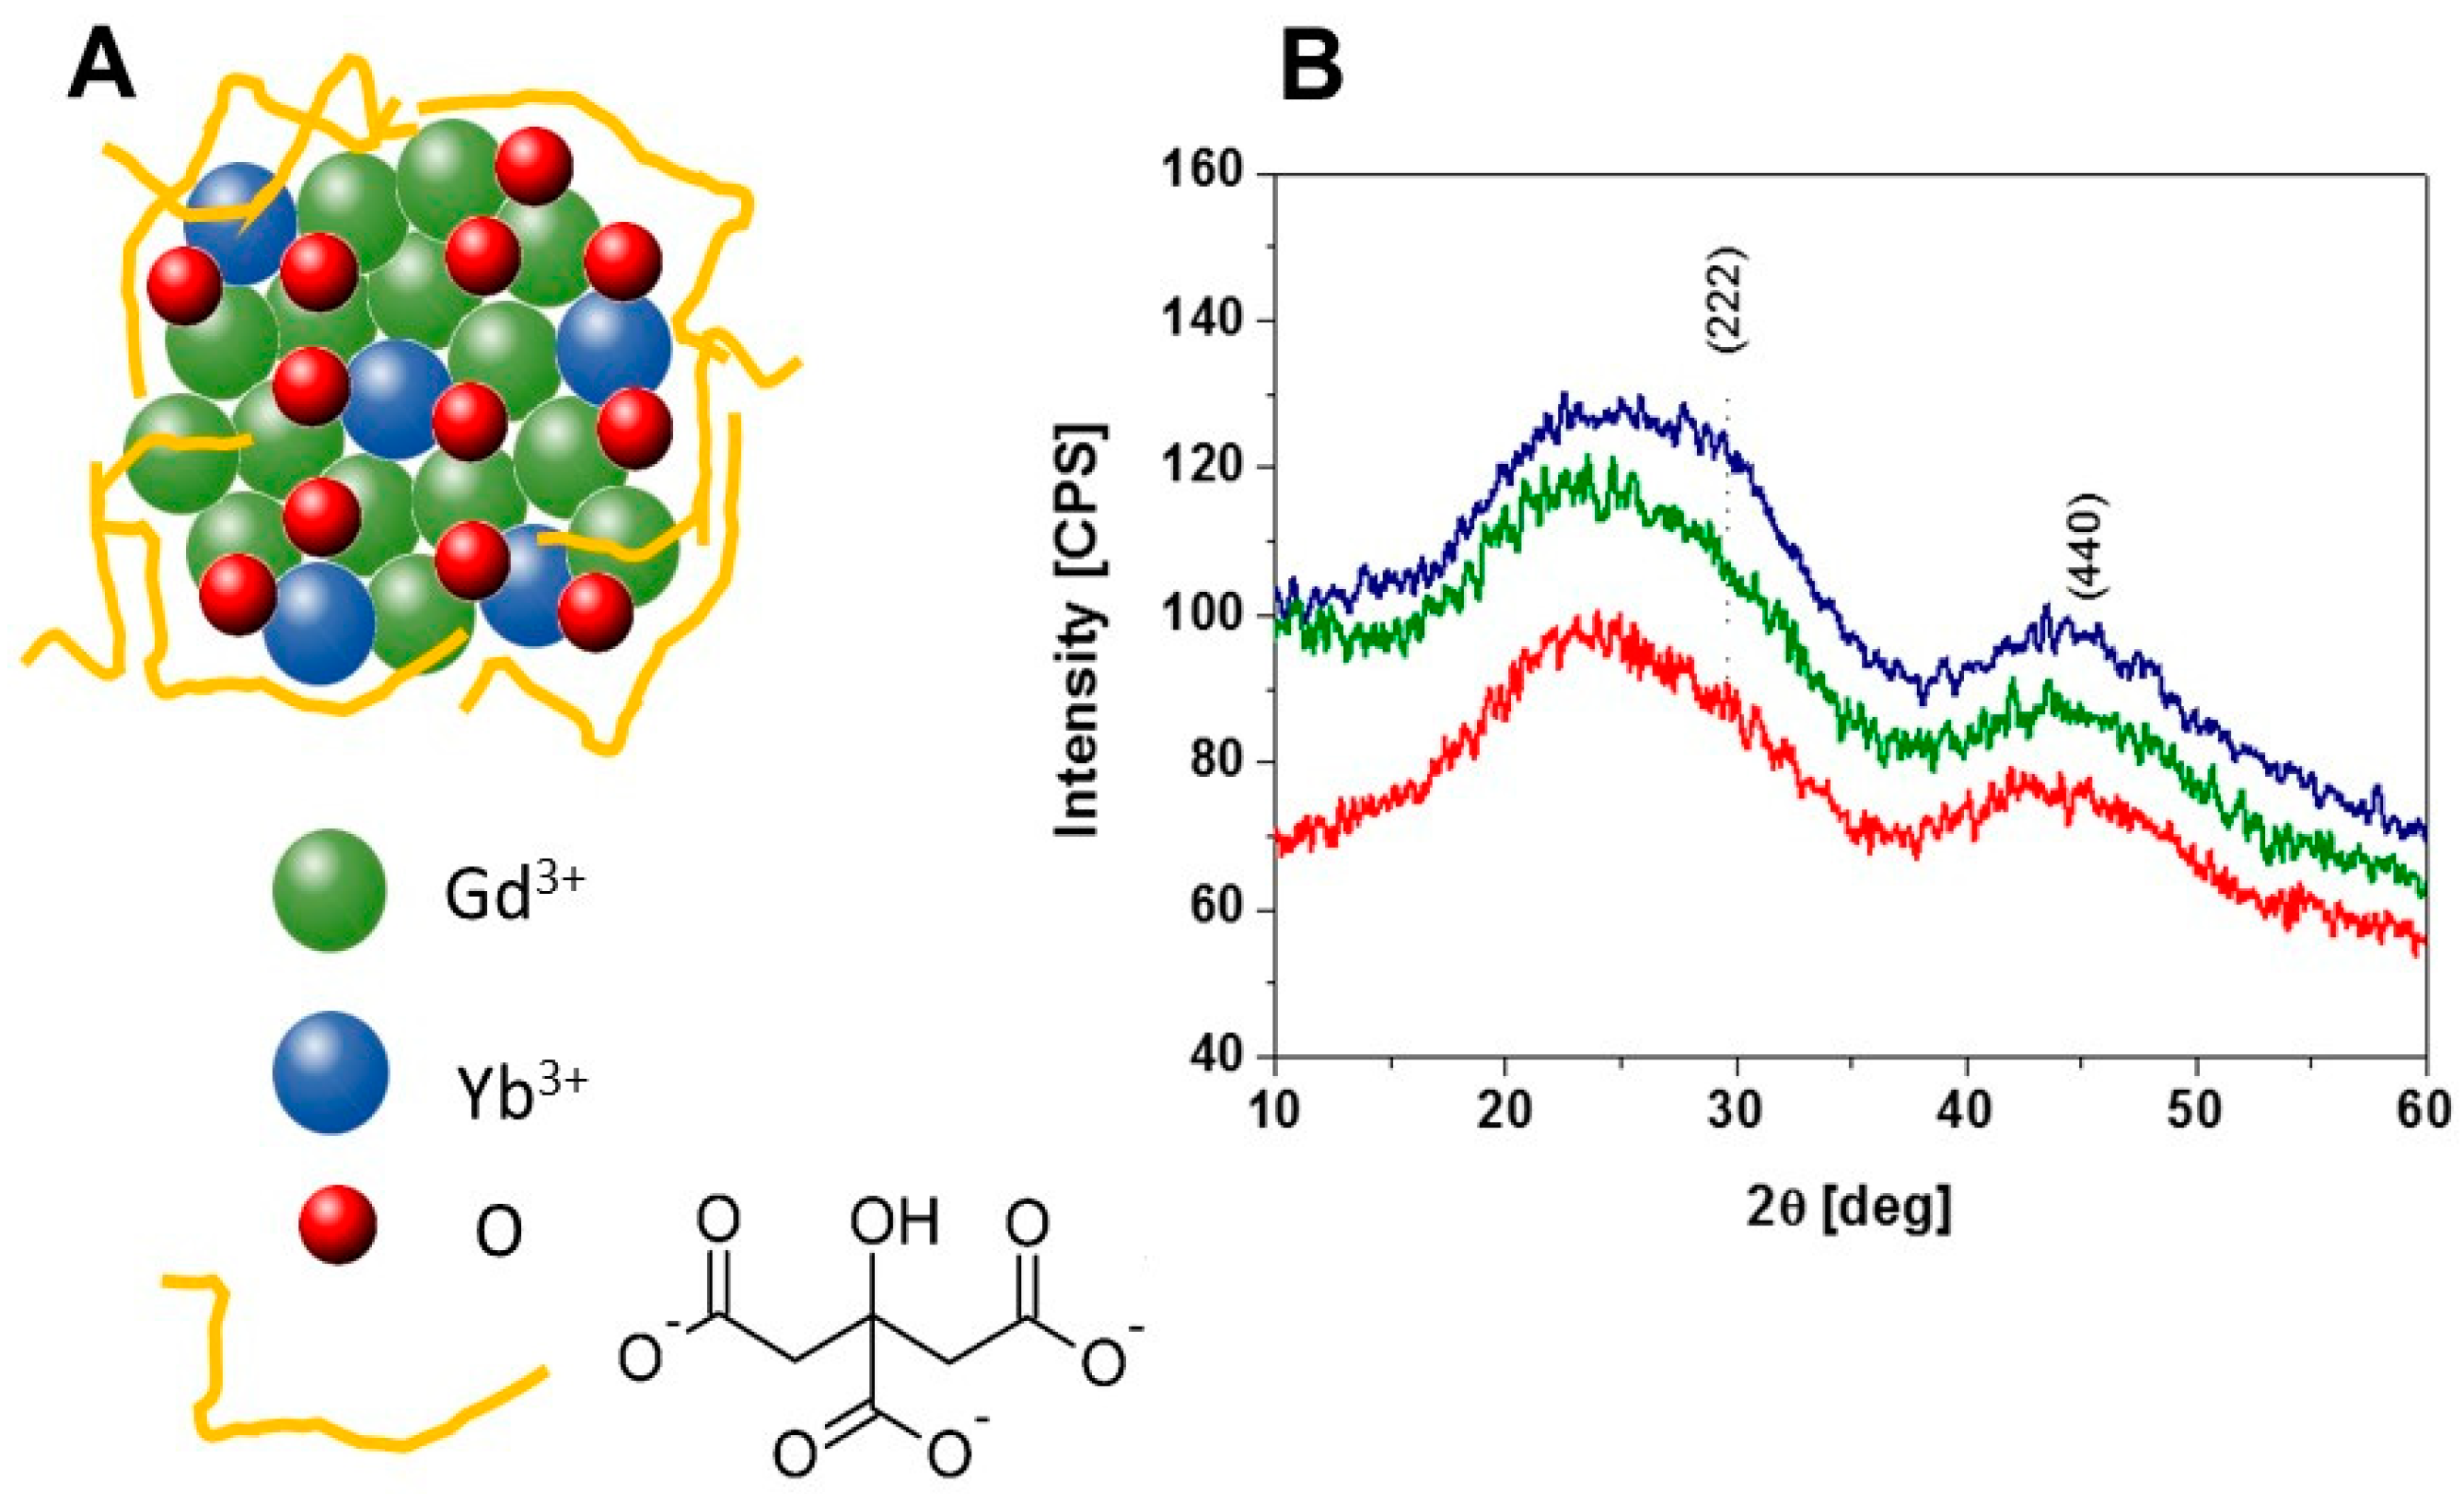
Gd2O3 nanoparticles and the derivative materials containing different Yb3+ loading were prepared by adapting a synthetic precipitation procedure reported in the literature [24]. In detail, Gd3+ and Yb3+ precursors were dissolved in a few mL of triethylene glycol (TEG) that contained sodium hydroxide. TEG molecules work as chelating agent for the metal ions, thus limiting the particle growth [25]. The reaction was carried at 210 °C for 1.30 h in the presence of citric acid in low molar amount, in respect to Gd3+ salt (more details are reported in the experimental section). As clearly demonstrated in the literature, the citric acid plays two specific roles: (i) it limits the particles size by replacing the TEG molecules on the particles surface and (ii) it improves the hydrophilic character of the particles surface and the aqueous dispersion [23]. Nanoparticles with low (hereafter named Gd2O3:Yb LL) and high Yb3+ loading (Gd2O3:Yb HL) were also prepared by introducing a solution of 5 and 10 mol % of Yb3+ salt along with the Gd3+ precursor in the reaction. A schematic view of the Gd2O3:Yb nanoparticles functionalized with citrate groups are reported in Figure 1A.
The structural properties of the samples were evaluated by an X-ray diffraction technique. The diffractogram of Gd2O3 NPs shows two wide bands centered at 29° and 44° 2θ (θ indicates the diffraction angle), attributed to the crystallographic planes 222 e 440, respectively (Figure 1B). This is typical of the body centered cubic structure, which has already been defined for these materials [26]. An additional component at low angles (ca. 22° 2θ) may be attributed to the organic fraction on the particles surface, which is in agreement with the literature data collected for parent samples. The X-ray profiles of the samples containing Yb3+ ions are completely comparable to that of Gd2O3, thus indicating that the incorporation in the structure of Yb3+ ions did not modify the structural features of these nanoparticles (Figure 1B). Furthermore, it is important to note that the presence of a wide band in the diffractogram of crystalline materials is typically associated to the nanometer nature of such samples. In light of these considerations, the average particles diameter (d) of all the samples was evaluated by applying the Debye–Scherrer equation (1) to the (222) reflection peak.
In the Debye–Scherrer equation, Bd is the full width at half the maximum intensity (FWHM) of the deconvoluted peak, λ is the X-ray wavelength, θ represents the diffraction angle and k is the Scherrer’s constant that is 0.89 for spherical particles. The particle size estimated by X-ray diffraction (XRD) analysis for the Gd2O3 and derivative materials is approximately below 2.0 nm.
The chemical composition of the nanoparticles was estimated using elemental analysis (ICP-MS). The samples prior to the analysis were mineralized with concentrated nitric acid at a high temperature. Considering a density of 28.24 Gd/nm3 [27], the amount of Gd3+ ions into Gd2O3 was estimated to be around 400 per particle. This number decreases to 378 and 349 when increasing the Yb3+ loading in Gd2O3:Yb LL and Gd2O3:Yb HL, respectively. Further, 22 and 51 Yb3+ ions per particle that corresponded to 5.5 and 12.7 mol % were determined in the two samples at low and high Yb3+ loading. The amount of citrate molecules exposed on the nanoparticles surface was quantified by CHN analysis, resulting to 2.38 mmol/g for Gd2O3 sample and 2.25 and 2.08 mmol/g for Gd2O3:Yb LL and Gd2O3:Yb HL, respectively.
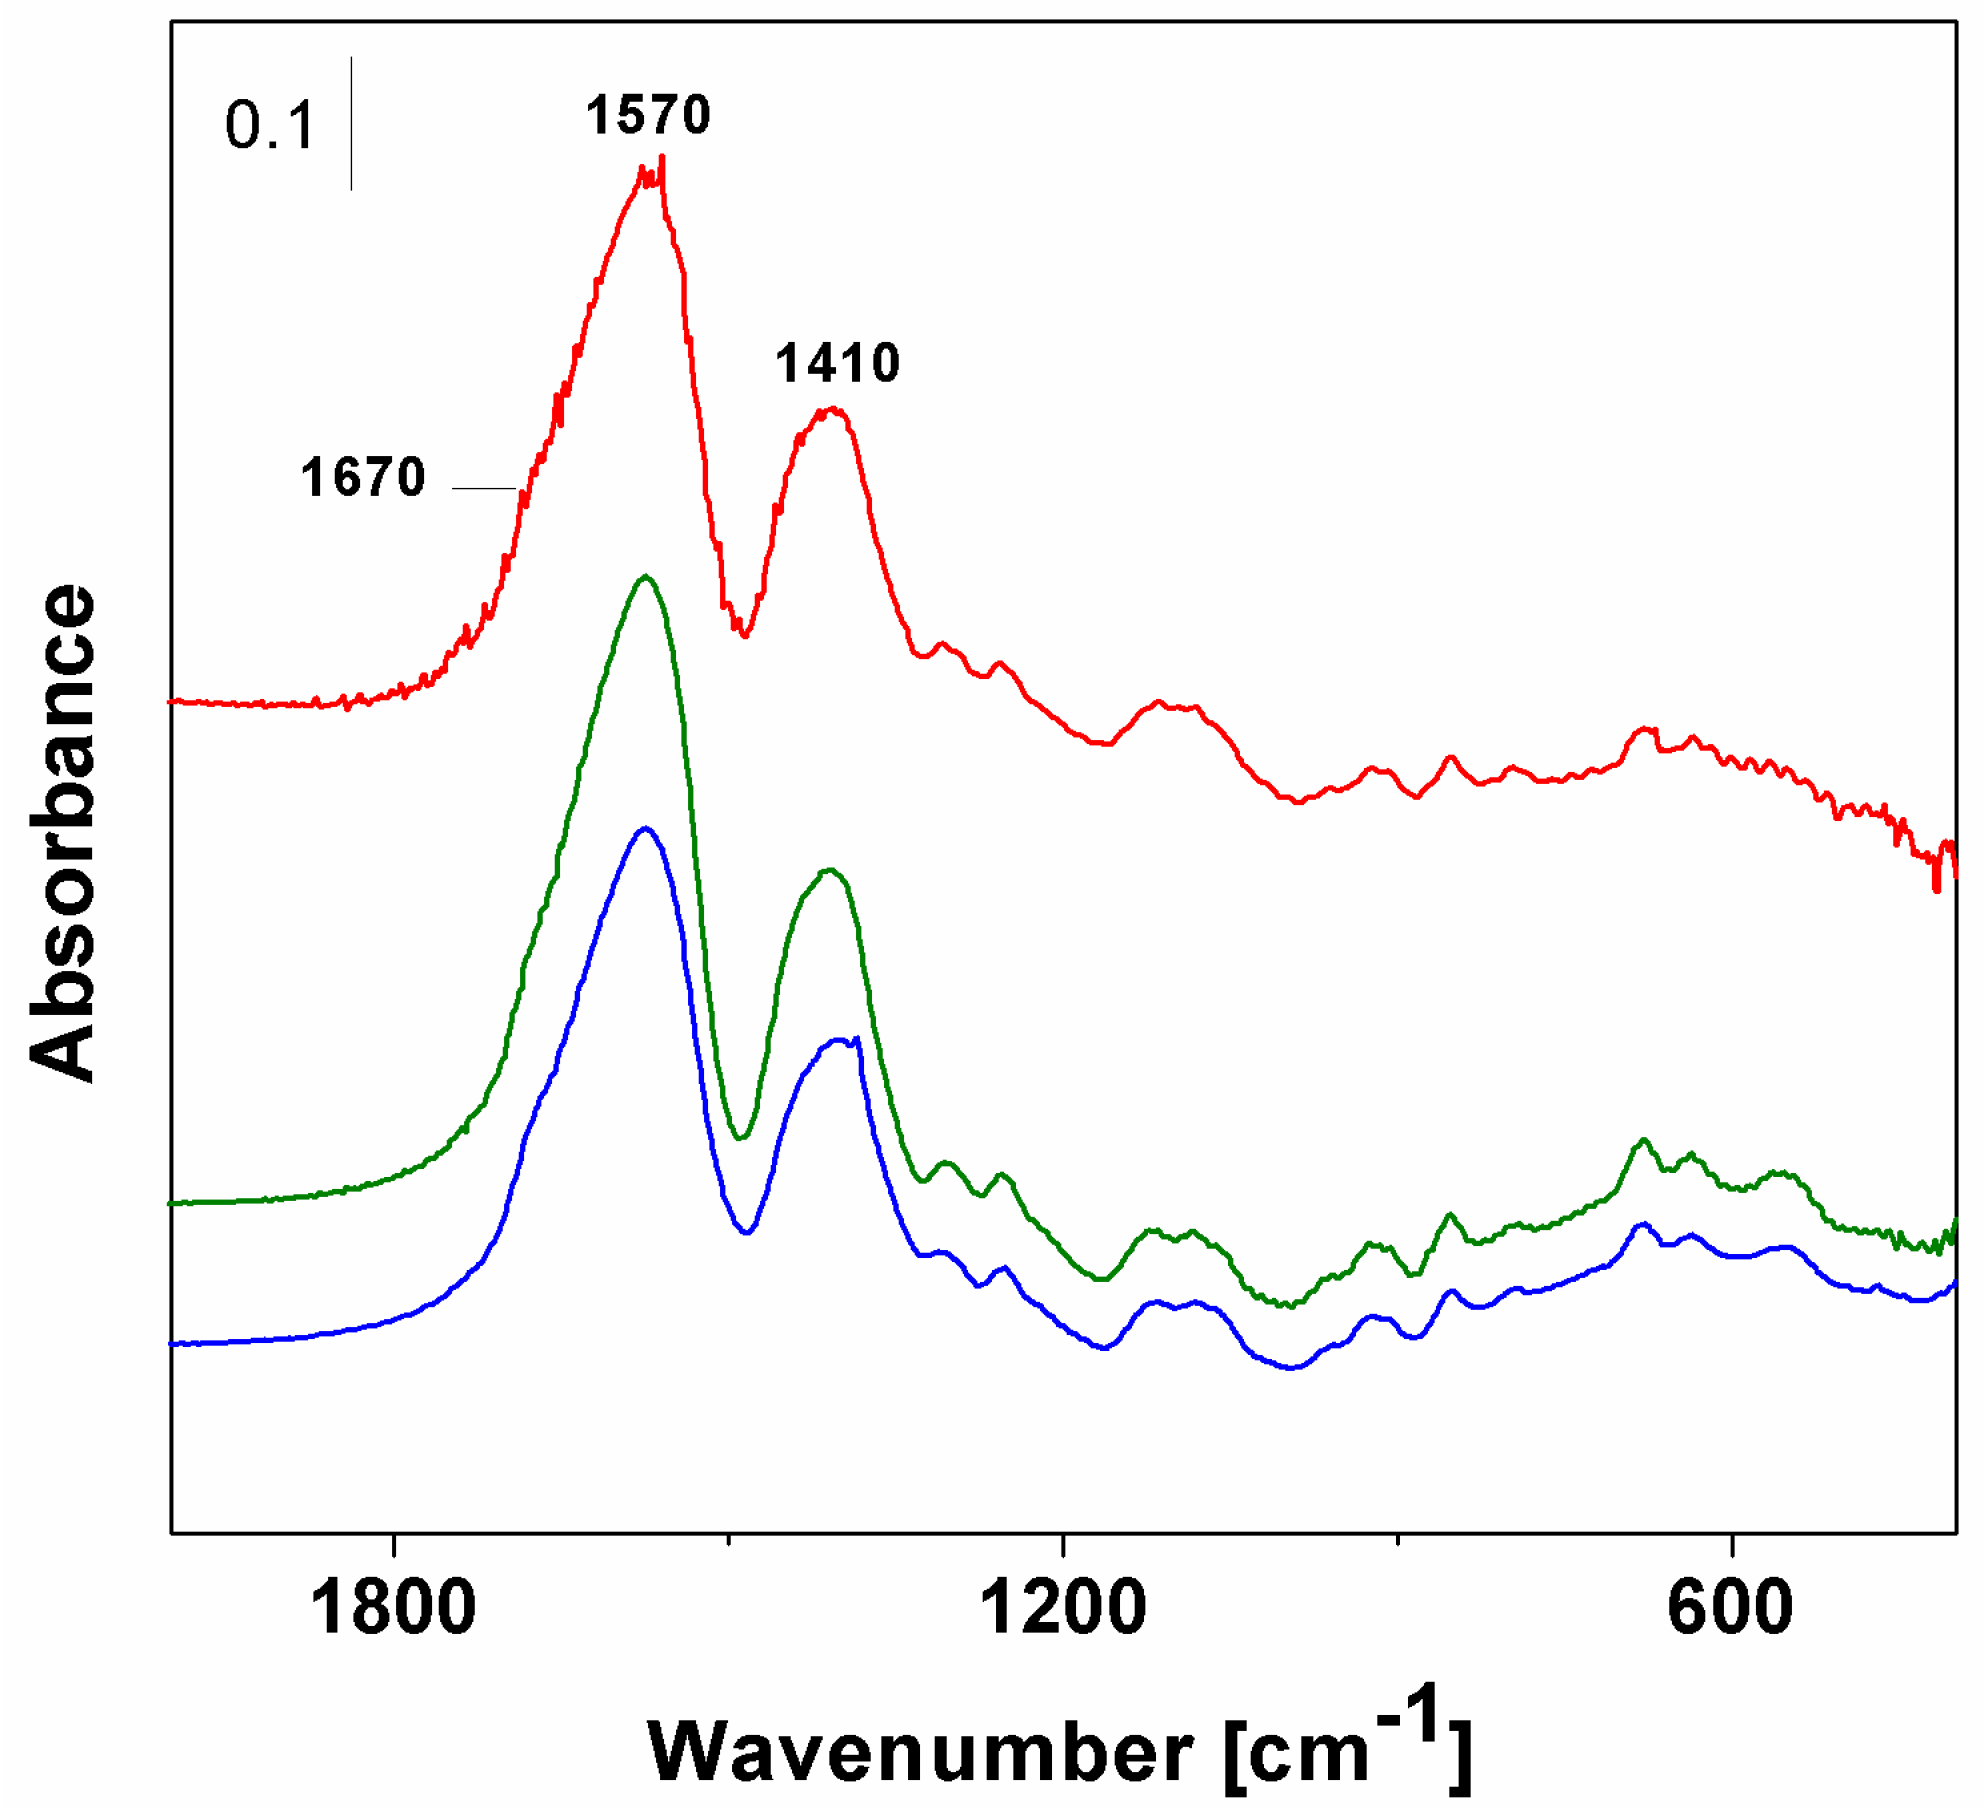
The presence of citrate on the nanoparticles surface was also confirmed through infrared spectroscopy (IR). IR spectra of Gd2O3 and the samples such as Yb3+ ions were collected at room temperature and appeared very similar (Figure 2).
The two main peaks at 1570 cm−1 and 1410 cm−1 are clearly detectable and assigned to the asymmetric and symmetric stretching modes of the deprotonated COO− groups of citrate units. However, we must consider the band at 1570 cm−1 as a shoulder less intense at high wavenumbers, visible in all spectra that may be ascribed to the stretching vibrational mode of protonated COOH groups. The presence of this band suggests that a faction of pH-dependent protonated citric acid is also present on the particles surface.
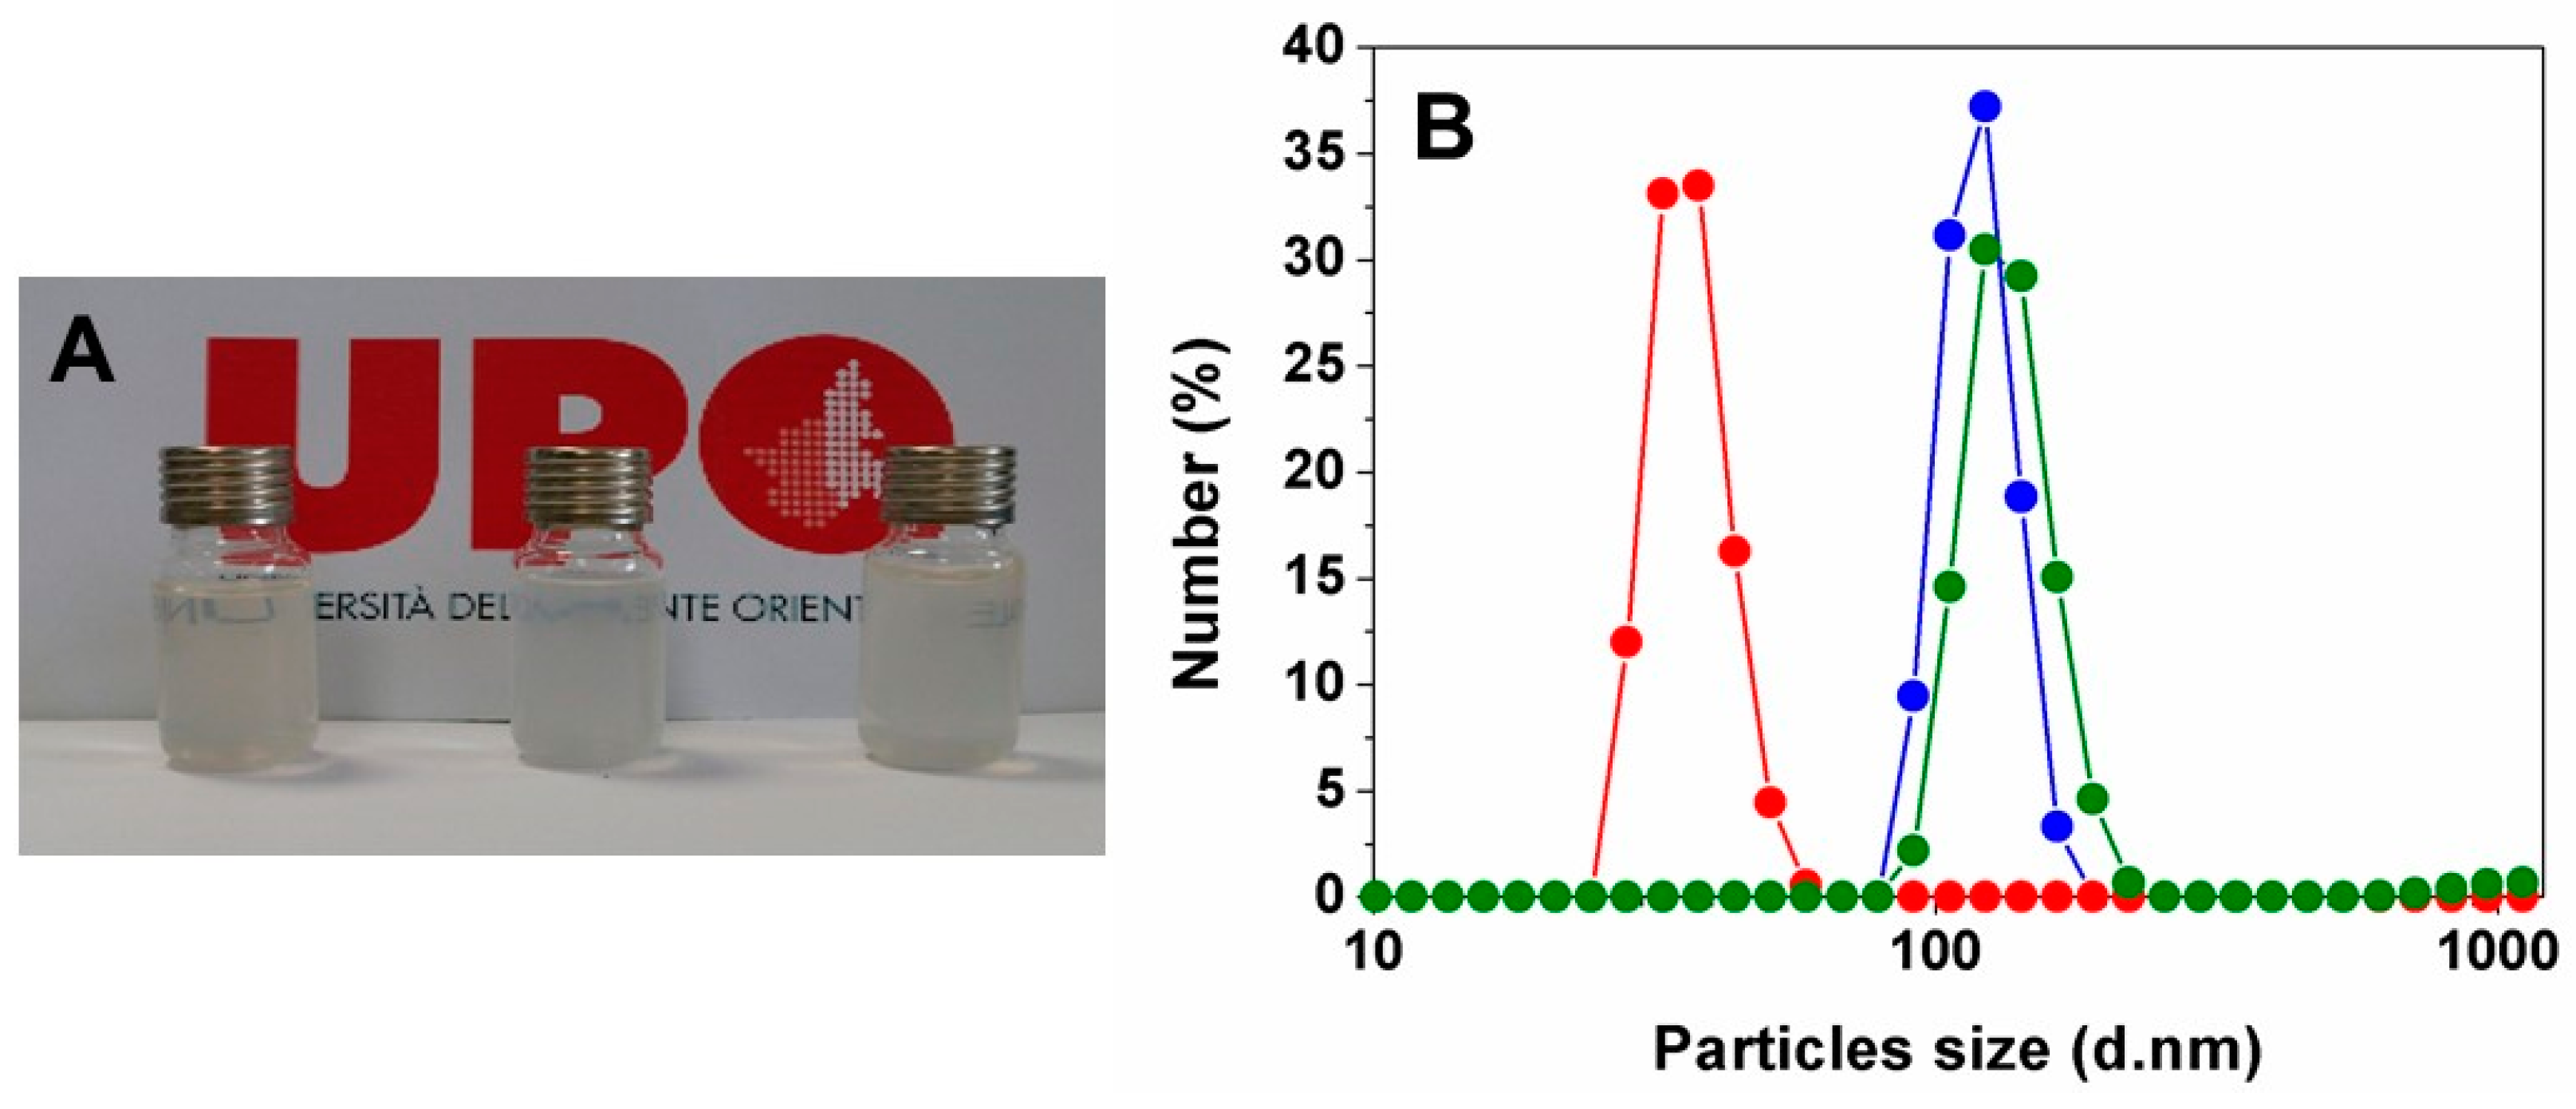
The aqueous suspensions of the nanoparticles obtained directly by the synthesis procedure, without further modifications, were monitored by dynamic light scattering (DLS) analysis. The suspensions were visibly homogenous, as indicated in the digital photographs reported in Figure 3A. They appeared stable for ca, in which 1h without particles sedimentation did not require the use of surfactant or stabilizing agents to improve the particles suspension. Gd2O3 suspension shows hydrodynamic diameter of ca. 40 nm because of a partial particles aggregation. The aggregation state was more pronounced for Gd2O3:Yb LL and Gd2O3:Yb HL suspension, with hydrodynamic radius of ca. 120 nm. A possible explanation of these differences in the aggregates size may be related to the different charge density exposed on the surface.
To have more insights about this aspect, Z-potential analysis was performed on all samples in aqueous solutions, using the same experimental conditions as the DLS experiments. All nanoparticles showed a negative charge density with values of −14.0 mV for Gd2O3 and −7.0 and −10.7 mV for Gd2O3:Yb LL and Gd2O3:Yb HL suspensions. These values are likely to be associated with the presence of the citrate carboxylate groups that are not involved in the coordination with Gd3+ and/or Yb3+ ions, which agrees with IR data. Differences in the amount of protonated and deprotonated citrate groups can be responsible for the different charge density on the surface of the samples and their aggregation behavior.
Finally, a preliminary relaxometric study was carried out in aqueous solution as a function of the magnetic field applied, in order to evaluate the mechanisms responsible of the magnetic interaction with water molecules. The longitudinal (r1) and transverse (r2) proton relaxivities defined the efficacy of 1 mM concentration of paramagnetic center to enhance the relaxation rates of the water protons. The relaxivity values for all the samples were measured at 40 MHz and 60 MHz at 310 K and neutral pH, along with the derivative r2/r1 ratio (Table 1). The Gd3+ concentration in aqueous solutions was estimated by ICP-MS analysis.
For all samples, the r2/r1 values do not change dramatically in the 20–60 MHz frequency range; they result to be below 2. This behavior suggests that these nanoparticles can be considered as positive MRI contrast agents [28,29]. The longitudinal relaxivity values calculated at high magnetic fields are in the 13–14 mM−1 s−1 range at 40 and 60 MHz, which is also the case for particles containing different Yb3+ loading. Moreover, these values are in line with those calculated for parent Gd2O3 samples with comparable size [30] and much higher than those observed for commercial Gd3+-chelates contrast agents [28]. The enhancement of the relaxivity value is governed by the dipolar coupling occurring between the paramagnetic ions and the protons of water molecules. This process involves two mechanisms: a short-range interaction with the water molecules directly coordinated to the metal ions (inner sphere contribution (IS)) or involved in H-bond with polar groups in close proximity to the paramagnetic ions (second sphere mechanism (SS)) and a long-range interaction with the bulk water molecules in proximity to the particles surface (outer sphere process (OS)) [31]. The contribution of each mechanism interaction is related to the position of the paramagnetic ions in the final nanoparticle. Metal ions distributed inside the particles core contributes to the relaxivity enhancement trough OS mechanism, whereas the paramagnetic centers confined in the surface are accessible to the water molecules and then they contribute to SS and/or IS mechanisms. It is known that when the inner sphere contribution is active, its effect is markedly high and it determines the final relaxivity value. Considering this in terms of Gd2O3 nanoparticles, the Gd3+ ions are statistically distributed both inside and on the surface of the nanoparticles where the calculated relaxivity value is an average of conditions in which different mechanisms (IS, SS, and OS) are involved, which was additionally observed for GdF3 and its parent materials [32].
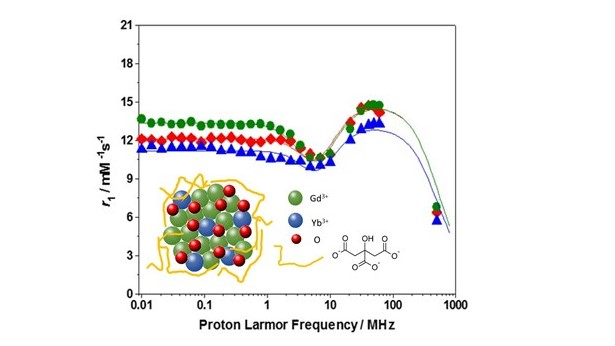
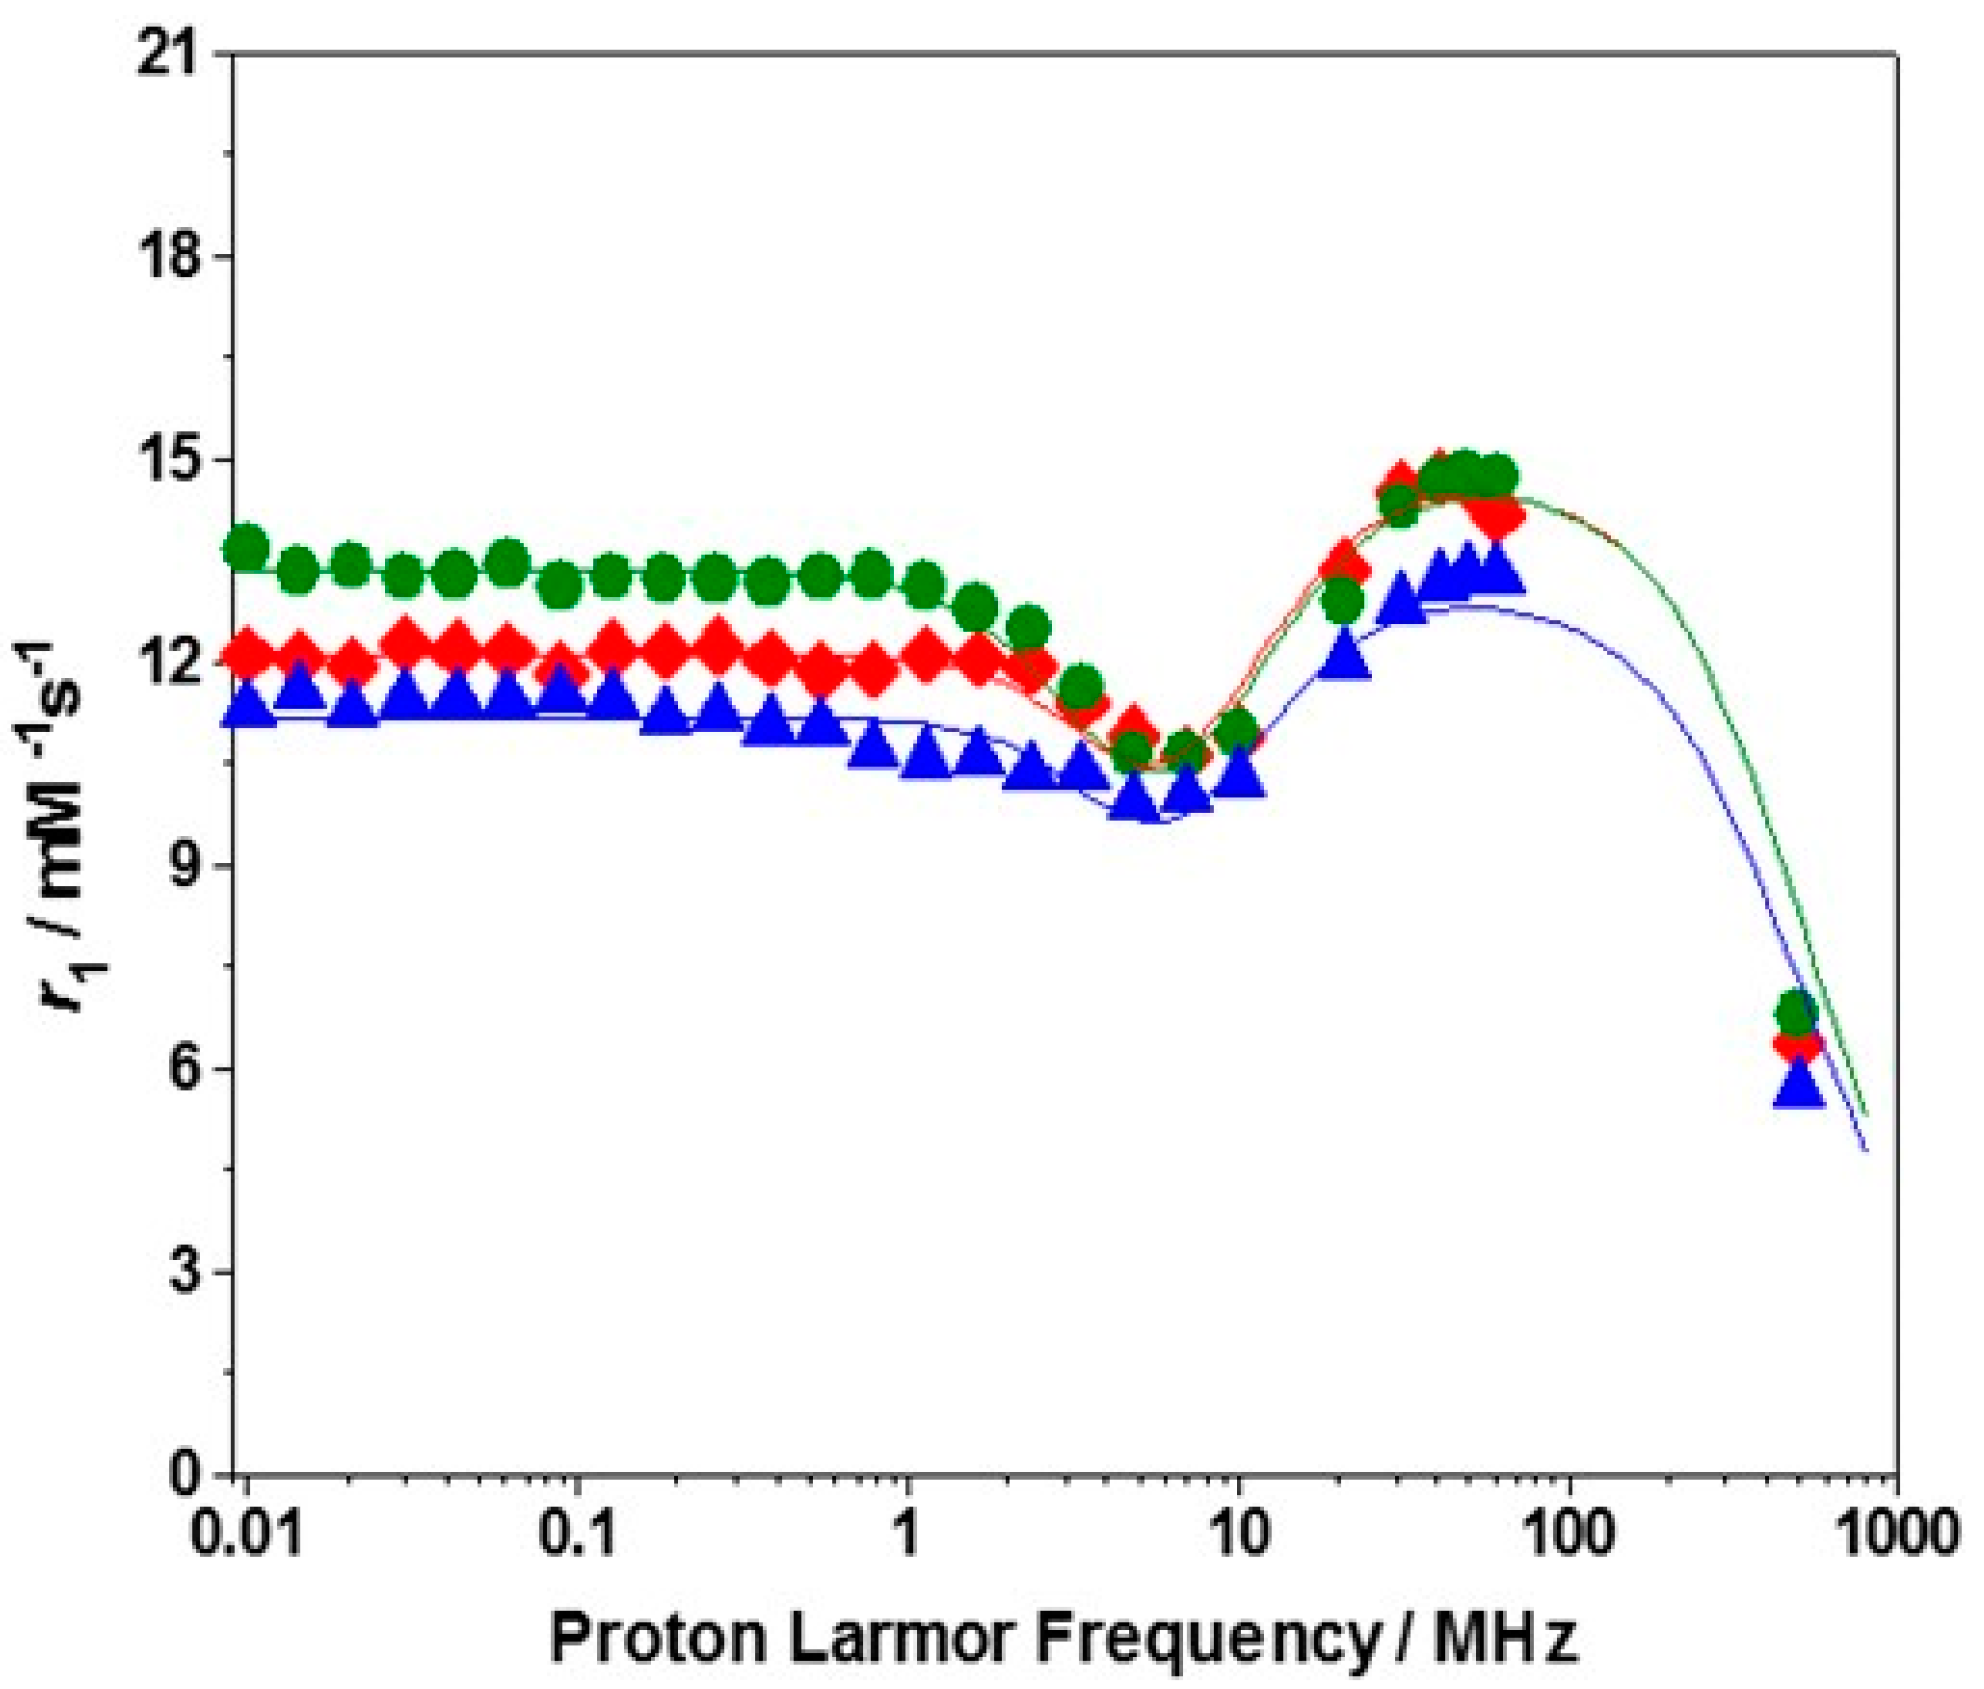
To analyze in detail the role of the different mechanisms of interaction between the paramagnetic particles and the protons of water molecules, 1H relaxivity value of the samples dispensed in aqueous solution are measured as a function of the proton Larmor frequency (Nuclear Magnetic Resonance Dispersion (NMRD)) [33] at 310 K from 0.01 to 500 MHz (Figure 4).
The NMRD profiles are typical of macromolecular systems with slow mobility, with a plateau at low filed, followed by a dispersion from 1 to 10 MHz, and finally a hump at high magnetic fields with a maximum close to 60 MHz (1.5 T), as previously observed for Gd2O3 and GdF3 nanoparticles with comparable size (Figure 4) [30]. It is important to note that the relaxivity values calculated at the different magnetic fields are an average result considering that all the paramagnetic ions in the particle contribute in the same way to the relaxivity value. The best fit for the NMRD profile was obtained by applying the Solomon–Bloembergen–Morgan (SBM) [34] and Freed’s [35] equations for the inner- and outer-sphere proton relaxation mechanisms and considering also the second sphere contribution. Some parameters were maintained during the fitting: the distance of closest approach for the outer-sphere contribution aGdH was fixed to 4.0 Å; the distance between Gd3+ ion and the inner sphere water protons (rGdH) to 3.1 Å; and the diffusion coefficient (D310), attributed to the outer sphere water molecules diffusing close to the Gd3+ ions exposed on the surface, was fixed to 3.1 × 10⁻⁵ cm2 s−1. The more convincing results were obtained by considering one inner sphere water molecule (q = 1) coordinated to the Gd3+ ions with τR of 0.35 ns for all samples. The differences in the aggregates size for the samples are limited and we did not observe a clear and direct relationship between the particles size and the r1 values during the best-fitting procedure. Furthermore, the good overlapping of the 1H-NMRD profiles of Gd2O3 and Gd2O3:Yb LL testified these considerations Nevertheless, the SS mechanism was present and it corresponded to the presence of one water molecule for Gd2O3 and Gd2O3:Yb (LL) samples and 0.75 waters for Gd2O3:Yb (HL), with a distance of 3.5 Å and τR′ of 0.20 ns for the first two systems and 0.17 ns for the particles with high Yb3+ loading. The electronic contributions correlated to the square of the zero-field splitting tensor, Δ2. The correlation time describing the modulation of the zero-field splitting (τV) are comparable for all the samples and the relative values are reported in the Table 2.
Finally, the stability of Gd2O3 nanoparticles was also monitored in reconstructed human serum (Seronorm) by measuring the longitudinal relaxation rate (R1) values at 310 K and 40 MHz over the time. Despite a limited decrease of the relaxation rate after few minutes of ca, 10%, mainly ascribed to a possible alteration of the surface properties of the nanoparticles (i.e., replacement of the citrate ions by other anions present in the serenorm matrix), the values remained constant for 24 h. This test suggested that no detectable leaching of paramagnetic ions occurred in the matrix (Figure 5A).
In a second more severe test, the particles were treated with increased amount of a chelating agent, ethylendiammine tetracetic acid (EDTA). The behavior was different for the three samples. For Gd2O3, we assisted to a progressive decrease of r1 value determined at 298 K and 40 MHz by increasing the EDTA amount. The EDTA/Gd3+ molar ratio of 0.5 was enough to promote the complete erosion of the nanoparticles with formation of the Gd(III)–EDTA chelate (Figure 5B). The particles bearing in the structure Yb3+ ions showed a completely different behavior. In the presence of limited amount of EDTA (EDTA/Gd3+ ratio of 0.3–0.5), the r1 value increases and this was mainly evident for the sample with high Yb3+ loading. A further increase of the EDTA/Gd3+ molar ratio promoted a partial degradation of the nanoparticles with consequent decrease of the relaxivity values (Figure 5B). The partial increase of the relaxivity at the beginning was tentatively attributed to the complexation of the Yb3+ ions (not directly responsible of the relaxivity values observed for these NPs) on the surface and to the relative exposition of other internal Gd3+ ions, becoming more accessible to the water molecules.
3. Materials and Methods
Gd2O3 NPs: 2 mmol of Gd(NO3)3·6H2O were dissolved in 10 mL of triethylene glycol (TEG). In parallel, 6 mmol of NaOH were added to other 10 mL of TEG. A third solution was prepared by dissolving 1.6 mmol of citric acid in 5 mL of TEG. All the solutions were stirred for 1 h at room temperature. In the second step, the first two solutions containing Gd(NO3)3 and NaOH were jointed together and maintained at 210 °C for 30 min. Then, the citric solution previously prepared was added and the final matrix was stirred at 210 °C for 1 h. A brown suspension was obtained. The solid phase containing Gd2O3 NPs was separated by centrifugation, and it was washed two times with 30 mL of ultrapure water. The particles were maintained in aqueous suspension in order to prevent particles aggregation.
Gd2O3:Yb NPs: A same procedure previously described for Gd2O3 was adopted for the preparation of mixed oxides containing low and high Ytterbium loading. The only difference is related to the molar amount of Gd3+ and Yb3+ precursor used in the reaction batch. In detail, for particles with lower Yb3+ amount (Gd2O3:Yb LL), 1.9 mmol of Gd(NO3)3·6H2O, and 0.1 mmol of Yb(NO3)3·5H2O were used. On the contrary, 1.8 mmol and 0.2 mmol of Gd(NO3)3·6H2O and Yb(NO3)3·5H2O, respectively, were dissolved in TEG solvent for the synthesis of the particles with higher Yb3+ loading (Gd2O3:Yb HL).
Characterisation Methods
The amount of Gd3+ and Yb3+ in the final materials was estimated using ICP-MS Thermo Scientific X5 Series (Waltham, MA, USA). The samples were mineralized via dissolution in HNO3 (5 mL) at 120 °C for 24 h. The amount of citrate in the nanoparticles was quantified by using Euro EA CHNSO Analyzer of HEKAtech GmbH Company (Wegberg, Germany). XRD patterns were obtained on a ARL XTRA48 diffractometer (Portland, OR, USA) by using Cu Kα radiation (λ = 1.54062 Å). IR spectra were collected in air at 298 K in the range (4000–400 cm−1) and with a resolution of 4 cm−1 by using a Bruker Equinox 55 spectrometer (Milano, Italy). The samples were mixed with KBr (10 wt %). DLS and Z-potential experiments were performed on a suspension of the particles in aqueous medium by using a Zetasizer NanoZS instrument (Malvern, UK) operating in the particle size range from 0.6 nm to 6 mm and equipped with a He–Ne laser (λ = 633 nm).
The water proton longitudinal relaxation rates were measured with a Stelar Spinmaster spectrometer (Pavia, Italy) operating from 20 to 70 MHz at 310 K. The standard inversion–recovery method was employed (16 experiments, 2 scans) with a typical 90° pulse width of 3.5 μs. The temperature was controlled with a Stelar VTC-91 airflow heater equipped with a copper–constantan thermocouple. The proton 1/T1 NMRD profiles were measured on a fast field-cycling Stelar SmarTracer relaxometer over a continuum of magnetic field strengths from 0.00024 to 0.25 T (corresponding to 0.01–10 MHz proton Larmor frequencies). Additional data points in the range 20–70 MHz and at 500 MHz were obtained using a conventional spectrometer using WP 80 magnet interfaced with a STELAR console and Bruker NMR spectrometers, respectively.
4. Conclusions
In conclusion, Gd2O3 nanoparticles doped in the framework with different Yb3+ loading were successfully prepared through a fast and easily reproducible synthetic approach and they were decorated with hydrophilic citrate molecules. Nanoparticles that did not incorporate Yb3+ were also prepared as a reference material. In all cases, we obtained appreciable aqueous suspensions, which were stable and homogeneous without sedimentation. The samples showed relaxivity values at high magnetic fields, which were improved in respect to the clinically approved Gd(III)-chelates and in agreement with the results observed for comparable Gd2O3 and GdF3 nanoparticles reported in the literature. 1H NMR relaxometry data indicated that the relaxivity values were mainly determined by the inner sphere contribution, but also second sphere water molecules H-bonded to the polar groups of citrate contribute to the final relaxivity. The nanoparticles were chemically stable in physiological medium (human serum). Furthermore, Gd2O3 samples doped with Yb3+ ions and with particles size distribution in aqueous solution centered at ca. Moreover, 120 nm (comparable to the samples here discussed) were tested both in vitro and in vivo as dual contrast agents and a toxicological study demonstrated the good biocompatibility and safety of these nanoparticles [22]. These features along with the co-presence of Gd3+ and Yb3+ ions in the same inorganic structure make these nanoparticles suitable for dual MRI-CT diagnostic analyses.
Author Contributions
Conceptualization, Investigation, Writing-Original Draft Preparation, Supervision, Project Administration: F.C.; Methodology, Formal Analysis, Resources, Data Curation, Writing-Review & Editing, Visualization, Funding Acquisition: F.C. and G.G.
Funding
This research was supported by the Università del Piemonte Orientale (Ricerca locale 2016).
Acknowledgments
This study was realized under the auspices of COST Action European Network on NMR Relaxometry CA15209 and the Consorzio Interuniversitario di Ricerca in Chimica dei Metalli nei Sistemi Biologici (CIRCMSB). The authors appreciated the experimental support of Luigi Canobbio.
Conflicts of Interest
The authors declare no conflict of interest.
References
- Doan, B.-T.; Meme, S.; Beloeil, J.-C. The Chemistry of Contrast Agents in Medical Magnetic Resonance Imaging; Merbach, A., Helm, L., Toth, E., Eds.; John Wiley & Sons: Chichester, UK, 2013; pp. 1–23. [Google Scholar]
- Wahsner, J.; Gale, E.M.; Rodriguez-Rodriguez, A.; Caravan, P. Chemistry of MRI Contrast Agents: Current Challenges and New Frontiers. Chem. Rev. 2019. [Google Scholar] [CrossRef] [PubMed]
- Faulkner, S.; Blackburn, O.A. The Chemistry of Molecular Imaging; Long, N., Wong, W.-T., Eds.; John Wiley & Sons: Hoboken, NJ, USA, 2015; pp. 179–197. [Google Scholar]
- Hanaoka, K.; Lubag, A.J.; Castillo-Muzquiz, A.; Kodadek, T.; Sherry, A.D. The detection limit of a Gd3+-based T1 agent is substantially reduced when targeted to a protein microdomain. Magn. Reson. Imaging 2008, 26, 608–617. [Google Scholar] [CrossRef] [PubMed]
- Carniato, F.; Tei, T.; Dastrú, W.; Marchese, L.; Botta, M. Relaxivity modulation in Gd-functionalised mesoporous silicas. Chem. Commun. 2009, 1246–1248. [Google Scholar] [CrossRef] [PubMed]
- Carniato, F.; Tei, L.; Cossi, M.; Marchese, L.; Botta, M. A Chemical Strategy for the Relaxivity Enhancement of GdIII Chelates Anchored on Mesoporous Silica Nanoparticles. Chem. Eur. J. 2010, 16, 10727–10734. [Google Scholar] [CrossRef] [PubMed]
- Carniato, F.; Tei, L.; Arrais, A.; Marchese, L.; Botta, M. Selective Anchoring of GdIII Chelates on the External Surface of Organo-Modified Mesoporous Silica Nanoparticles: A New Chemical Strategy to Enhance Relaxivity. Chem. Eur. J. 2013, 19, 1421–1428. [Google Scholar] [CrossRef] [PubMed]
- Carniato, F.; Tei, L.; Botta, M. Gd-Based Mesoporous Silica Nanoparticles as MRI Probes. Eur. J. Inorg. Chem. 2018, 4936–4954. [Google Scholar] [CrossRef]
- Huang, W.-Y.; Davies, G.-L.; Davis, J.J. High signal contrast gating with biomodified Gd doped mesoporous nanoparticles. Chem. Commun. 2013, 49, 60–62. [Google Scholar] [CrossRef] [PubMed] [Green Version]
- Bouchoucha, M.; C.-Gaudreault, R.; Fortin, M.-A.; Kleitz, F. Mesoporous Silica Nanoparticles: Selective Surface Functionalization for Optimal Relaxometric and Drug Loading Performances. Adv. Funct. Mater. 2014, 24, 5911–5923. [Google Scholar] [CrossRef]
- Dong, H.; Du, S.-R.; Zheng, X.-Y.; Lyu, G.-M.; Sun, L.-D.; Li, L.-D.; Zhang, P.-Z.; Zhang, C.; Yan, C.-H. Lanthanide Nanoparticles: From Design toward Bioimaging and Therapy. Chem. Rev. 2015, 115, 10725–10815. [Google Scholar] [CrossRef] [PubMed]
- Guillet-Nicolas, R.; Jean, N.; Bridot, L.; Seo, Y.; Fortin, M.-A.; Kleitz, F. Enhanced Relaxometric Properties of MRI “Positive” Contrast Agents Confined in Three-Dimensional Cubic Mesoporous Silica Nanoparticles. Adv. Funct. Mater. 2011, 21, 4653–4662. [Google Scholar] [CrossRef]
- Johnson, N.J.J.; Oakden, W.; Stanisz, G.J.; Prosser, R.S.; van Veggel, F.C.J.M. Size-Tunable, Ultrasmall NaGdF4 Nanoparticles: Insights into Their T1 MRI Contrast Enhancement. Chem. Mater. 2011, 23, 3714–3722. [Google Scholar] [CrossRef]
- Ahmad, M.W.; Kim, C.R.; Baeck, J.S.; Chang, Y.; Kim, T.J.; Bae, J.E.; Chaed, K.S.; Lee, G.H. Bovine Serum Albumin (BSA) and Cleaved-BSA Conjugated Ultrasmall Gd2O3 Nanoparticles: Synthesis, Characterization, and Application to MRI Contrast Agents. Colloids Surf. A 2014, 450, 67–75. [Google Scholar] [CrossRef]
- Ahren, M.; Selegaard, L.; Soederlind, F.; Linares, M.; Kauczor, J.; Norman, P.; Kaell, P.-O.; Uvdal, K. A Simple Polyol-free Synthesis Route to Gd2O3 Nanoparticles for MRI Applications: An Experimental and Theoretical Study. J. Nanopart. Res. 2012, 14, 1006–1022. [Google Scholar] [CrossRef]
- Cho, M.; Sethi, R.; Ananta narayanan, J.S.; Lee, S.S.; Benoit, D.N.; Taheri, N.; Decuzzi, P.; Colvin, V.L. Gadolinium Oxide Nanoplates with High Longitudinal Relaxivity for Magnetic Resonance Imaging. Nanoscale 2014, 6, 13637–13645. [Google Scholar] [CrossRef] [PubMed]
- Hu, X.; Wang, M.; Miao, F.; Ma, J.; Shen, H.; Jia, N. Regulation of Multifunctional Mesoporous Core–shell Nanoparticles with Luminescence and Magnetic Properties for Biomedical Applications. J. Mater. Chem. B 2014, 2, 2265–2275. [Google Scholar] [CrossRef]
- Liu, J.; Tian, X.; Luo, N.; Yang, C.; Xiao, J.; Shao, Y.; Chen, X.; Yang, G.; Chen, D.; Li, L. Sub-10 nm Monoclinic Gd2O3:Eu3+ Nanoparticles as Dual-Modal Nanoprobes for Magnetic Resonance and Fluorescence Imaging. Langmuir 2014, 30, 13005–13013. [Google Scholar] [CrossRef] [PubMed]
- Chen, F.; Chen, M.; Yang, C.; Liu, J.; Luo, N.Q.; Yang, G.W.; Chen, D.H.; Li, L. Terbium-doped Gadolinium Oxide Nanoparticles Prepared by Laser Ablation in Liquid for Use as a Fluorescence and Magnetic Resonance Imaging Dual-modal Contrast Agent. Phys. Chem. Chem. Phys. 2015, 17, 1189–1196. [Google Scholar] [CrossRef] [PubMed]
- Petoral, R.M.; Soederlind, F.; Klasson, A.; Suska, A.; Fortin, M.A.; Abrikossova, N.; Selegaard, L.; Kaell, P.-O.; Engstroem, M.; Uvdal, K. Synthesis and Characterization of Tb3+-Doped Gd2O3 Nanocrystals: A Bifunctional Material with Combined Fluorescent Labeling and MRI Contrast Agent Properties. J. Phys. Chem. C 2009, 113, 6913–6920. [Google Scholar] [CrossRef]
- Luo, N.; Yang, C.; Tian, X.; Xiao, J.; Liu, J.; Chen, F.; Zhang, D.; Xu, D.; Zhang, Y.; Yang, G.; et al. A General top-down Approach to Synthesize Rare Earth Doped-Gd2O3 Nanocrystals as Dualmodal Contrast Agents. J. Mater. Chem. B 2014, 2, 5891–5897. [Google Scholar] [CrossRef]
- Liu, Z.; Pu, F.; Liu, J.; Jiang, L.; Yuan, Q.; Li, Z.; Ren, J.; Qu, X. PEGylated Hybrid Ytterbia Nanoparticles as High-Performance Diagnostic Probes for in Vivo Magnetic resonance and X-Ray Computed Tomography Imaging with Low Systemic Toxicity. Nanoscale 2013, 5, 4252–4261. [Google Scholar] [CrossRef] [PubMed]
- Carniato, F.; Thangavel, K.; Tei, L.; Botta, M. Structure and dynamics of the hydration shells of citrate-coated GdF3 nanoparticles. J. Mater. Chem. B 2013, 1, 2442–2446. [Google Scholar] [CrossRef]
- Söderlind, F.; Pedersen, H.; Petoral, R.M., Jr.; Käll, P.-O.; Uvdal, K. Synthesis and characterisation of Gd2O3 nanocrystals functionalised by organic acids. J. Colloid Interface Sci. 2005, 288, 140–148. [Google Scholar] [CrossRef] [PubMed]
- Caruntu, D.; Remond, Y.; Chou, N.H.; Jun, M.-J.; Caruntu, G.; He, J.; Goloverda, G.; O’Connor, C.; Kolesnichenko, V. Reactivity of 3d Transition Metal Cations in Diethylene Glycol Solutions. Synthesis of Transition Metal Ferrites with the Structure of Discrete Nanoparticles Complexed with Long-Chain Carboxylate Anions. Inorg. Chem. 2002, 41, 6137–6146. [Google Scholar] [CrossRef] [PubMed]
- Wang, F.; Peng, E.; Zheng, B.; Li, S.F.Y.; Xue, J.M. Synthesis of Water-Dispersible Gd2O3/GO Nanocomposites with Enhanced MRI T1 Relaxivity. J. Phys. Chem. C 2015, 119, 23735–23742. [Google Scholar] [CrossRef]
- Faucher, L.; Guay-Bégin, A.A.; Lagueux, J.; Côté, M.-F.; Petitclerc, E.; Fortin, M.-A. Ultra-small gadolinium oxide nanoparticles to image brain cancer cells in vivo with MRI. Contrast Media Mol. Imaging 2011, 6, 209–218. [Google Scholar] [CrossRef] [PubMed]
- Caravan, P.; Ellison, J.J.; McMurry, T.J.; Lauffer, R.B. Gadolinium(III) Chelates as MRI Contrast Agents: Structure, Dynamics, and Applications. Chem. Rev. 1999, 99, 2293–2352. [Google Scholar] [CrossRef] [PubMed]
- Aime, S.; Geninatti Crich, S.; Gianolio, E.; Giovenzana, G.B.; Tei, L.; Terreno, E. High sensitivity lanthanide(III) based probes for MR-medical imaging. Coord. Chem. Rev. 2006, 250, 1562–1579. [Google Scholar] [CrossRef]
- Bridot, J.-L.; Faure, A.-C.; Laurent, S.; Rivière, C.; Billotey, C.; Hiba, B.; Janier, M.; Josserand, V.; Coll, J.-L.; Vander Elst, L.; et al. Hybrid Gadolinium Oxide Nanoparticles: Multimodal Contrast Agents for in Vivo Imaging. J. Am. Chem. Soc. 2007, 129, 5076–5084. [Google Scholar] [CrossRef] [PubMed]
- Botta, M. Second Coordination Sphere Water Molecules and Relaxivity of Gadolinium(III) Complexes: Implications for MRI Contrast Agents. Eur. J. Inorg. Chem. 2000, 399–407. [Google Scholar] [CrossRef]
- Carniato, F.; Tei, L.; Phadngam, S.; Isidoro, C.; Botta, M. NaGdF4 Nanoparticles Coated with Functionalised Ethylenediaminetetraacetic Acid as Versatile Probes for Dual Optical and Magnetic Resonance Imaging. ChemPlusChem 2015, 80, 503–510. [Google Scholar] [CrossRef]
- Helm, L.; Morrow, J.R.; Bond, C.J.; Carniato, F.; Botta, M.; Braun, M.; Baranyai, Z.; Pujales-Paradela, R.; Regueiro-Figueroa, M.; Esteban-Gómez, D.; et al. Contrast Agents for MRI: Experimental Methods; Pierre, V.C., Allen, M.J., Eds.; RSC: London, UK, 2018; pp. 11–242. [Google Scholar]
- Solomon, I.; Bloembergen, N. Nuclear Magnetic Interactions in the HF Molecule. J. Chem. Phys. 1956, 25, 261. [Google Scholar] [CrossRef]
- Freed, J.H. Dynamic effects of pair correlation functions on spin relaxation by translational diffusion in liquids. II. Finite jumps and independent T1 processes. J. Chem. Phys. 1978, 68, 4034. [Google Scholar] [CrossRef]
Figure 1.
(A) Schematic view of Gd2O3:Yb nanoparticles covered on the surface with citrate; (B) X-ray profiles of Gd2O3 (red), Gd2O3:Yb (LL) (green), and Gd2O3:Yb (HL) (blue).
Figure 1.
(A) Schematic view of Gd2O3:Yb nanoparticles covered on the surface with citrate; (B) X-ray profiles of Gd2O3 (red), Gd2O3:Yb (LL) (green), and Gd2O3:Yb (HL) (blue).

Figure 2.
Fourier-transform infrared (FT-IR) spectra of Gd2O3 (red), Gd2O3:Yb (LL) (green) and Gd2O3:Yb (HL) (blue).
Figure 2.
Fourier-transform infrared (FT-IR) spectra of Gd2O3 (red), Gd2O3:Yb (LL) (green) and Gd2O3:Yb (HL) (blue).

Figure 3.
(A) Digital photograph of aqueous suspensions of Gd2O3, Gd2O3:Yb (LL) and Gd2O3:Yb (HL) (from left to right); (B) dynamic light scattering (DLS) analysis of Gd2O3 (red), Gd2O3:Yb (LL) (green) and Gd2O3:Yb (HL) (blue) suspensions.
Figure 3.
(A) Digital photograph of aqueous suspensions of Gd2O3, Gd2O3:Yb (LL) and Gd2O3:Yb (HL) (from left to right); (B) dynamic light scattering (DLS) analysis of Gd2O3 (red), Gd2O3:Yb (LL) (green) and Gd2O3:Yb (HL) (blue) suspensions.

Figure 4.
1/T1 Nuclear Magnetic Resonance Dispersion (NMRD) profiles for Gd2O3 (red), Gd2O3:Yb (LL) (green), and Gd2O3:Yb (HL) (blue) at 310 K. The best-fit curves (solid lines) are calculated using the parameters of Table 2.
Figure 4.
1/T1 Nuclear Magnetic Resonance Dispersion (NMRD) profiles for Gd2O3 (red), Gd2O3:Yb (LL) (green), and Gd2O3:Yb (HL) (blue) at 310 K. The best-fit curves (solid lines) are calculated using the parameters of Table 2.

Figure 5.
(A) Stability over the time of Gd2O3 (red), Gd2O3:Yb (LL) (green) and Gd2O3:Yb (HL) (blue) in Seronorm suspension at 40 MHz and 310 K; (B) r1 values (40 MHz, 298 K) for Gd2O3 (red), Gd2O3:Yb (LL) (green) and Gd2O3:Yb (blue) as a function of [ethylendiammine tetracetic acid (EDTA)]/[Gd3+] molar ratio.


Table 1.
The r1 and r2/r1 ratio values per gadolinium ion measured at 40 and 60 MHz (310 K).
| Samples | r140 (mM−1 s−1) | r160 (mM−1 s−1) | r2/r1 (40 MHz) | r2/r1 (60 MHz) |
|---|---|---|---|---|
| Gd2O3 | 14.7 | 14.2 | 1.35 | 1.60 |
| Gd2O3:Yb (LL) | 14.7 | 14.7 | 1.39 | 1.92 |
| Gd2O3:Yb (HL) | 13.1 | 13.2 | 1.43 | 1.64 |
Table 2.
Selected best-fit parameters obtained from the analysis of the 1/T1 NMRD profiles (310 K) of all the nanoparticles.
Table 2.
Selected best-fit parameters obtained from the analysis of the 1/T1 NMRD profiles (310 K) of all the nanoparticles.
| Samples | Δ2 (1019 s−2) | τV (ps) | q | τR (ns) | q′ | τR′ (ns) |
|---|---|---|---|---|---|---|
| Gd2O3 | 2.83 ± 0.17 | 37.0 ± 2.3 | 1 | 0.35 + 0.01 | 1 | 0.20 + 0.01 |
| Gd2O3:Yb (LL) | 2.77 ± 0.13 | 32.6 ± 1.6 | 1 | 0.35 + 0.01 | 1 | 0.20 + 0.02 |
| Gd2O3:Yb (HL) | 2.78 ± 0.21 | 32.8 ± 2.5 | 1 | 0.35 + 0.01 | 0.75 | 0.17 + 0.02 |
© 2019 by the authors. Licensee MDPI, Basel, Switzerland. This article is an open access article distributed under the terms and conditions of the Creative Commons Attribution (CC BY) license (http://creativecommons.org/licenses/by/4.0/).
Share and Cite
MDPI and ACS Style
Carniato, F.; Gatti, G. 1H NMR Relaxometric Analysis of Paramagnetic Gd2O3:Yb Nanoparticles Functionalized with Citrate Groups. Inorganics 2019, 7, 34. https://0-doi-org.brum.beds.ac.uk/10.3390/inorganics7030034
AMA Style
Carniato F, Gatti G. 1H NMR Relaxometric Analysis of Paramagnetic Gd2O3:Yb Nanoparticles Functionalized with Citrate Groups. Inorganics. 2019; 7(3):34. https://0-doi-org.brum.beds.ac.uk/10.3390/inorganics7030034
Chicago/Turabian StyleCarniato, Fabio, and Giorgio Gatti. 2019. "1H NMR Relaxometric Analysis of Paramagnetic Gd2O3:Yb Nanoparticles Functionalized with Citrate Groups" Inorganics 7, no. 3: 34. https://0-doi-org.brum.beds.ac.uk/10.3390/inorganics7030034
Note that from the first issue of 2016, this journal uses article numbers instead of page numbers. See further details here.