Toward Overcoming the Challenges in the Comparison of Different Pd Nanocatalysts: Case Study of the Ethanol Oxidation Reaction


Abstract
:
1. Introduction
2. Results
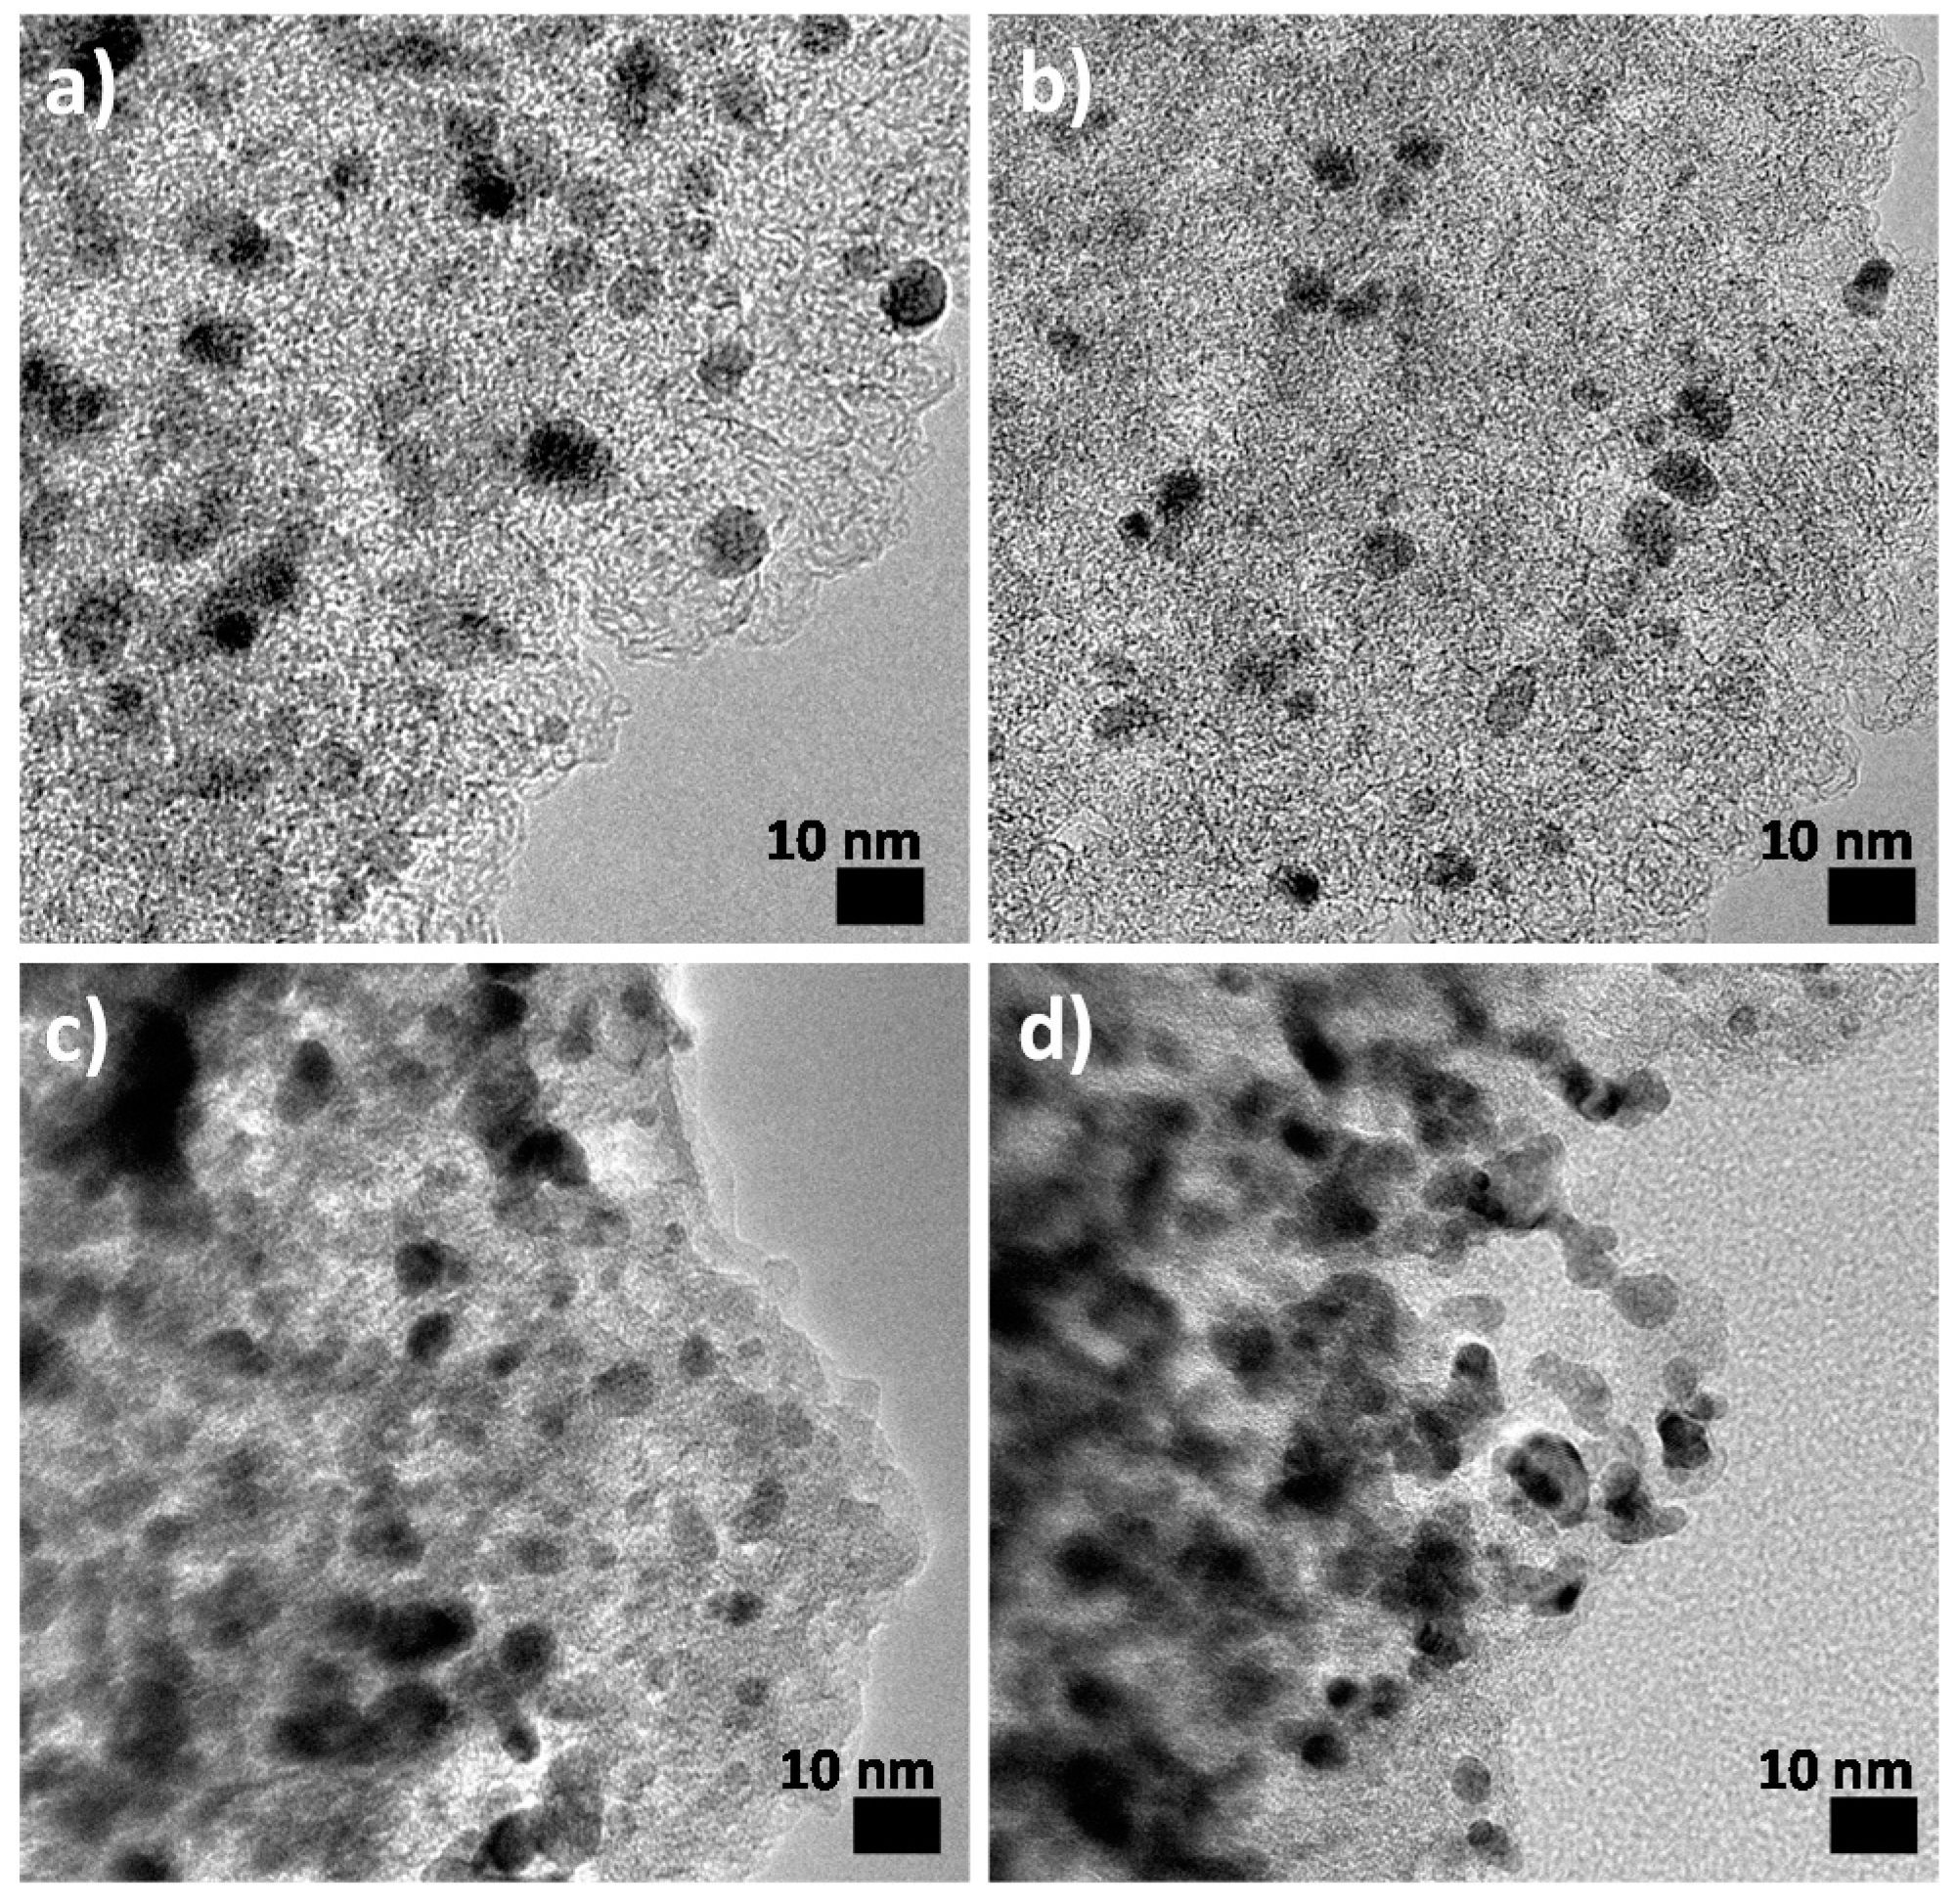
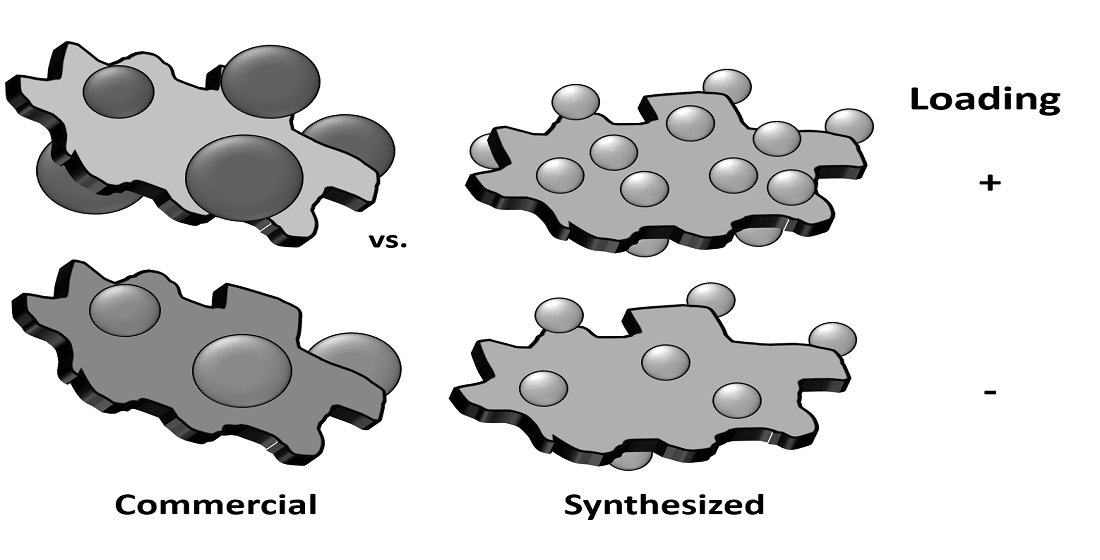
2.1. As-Synthesised Pd Nanoparticles
2.2. Ethanol Oxidation
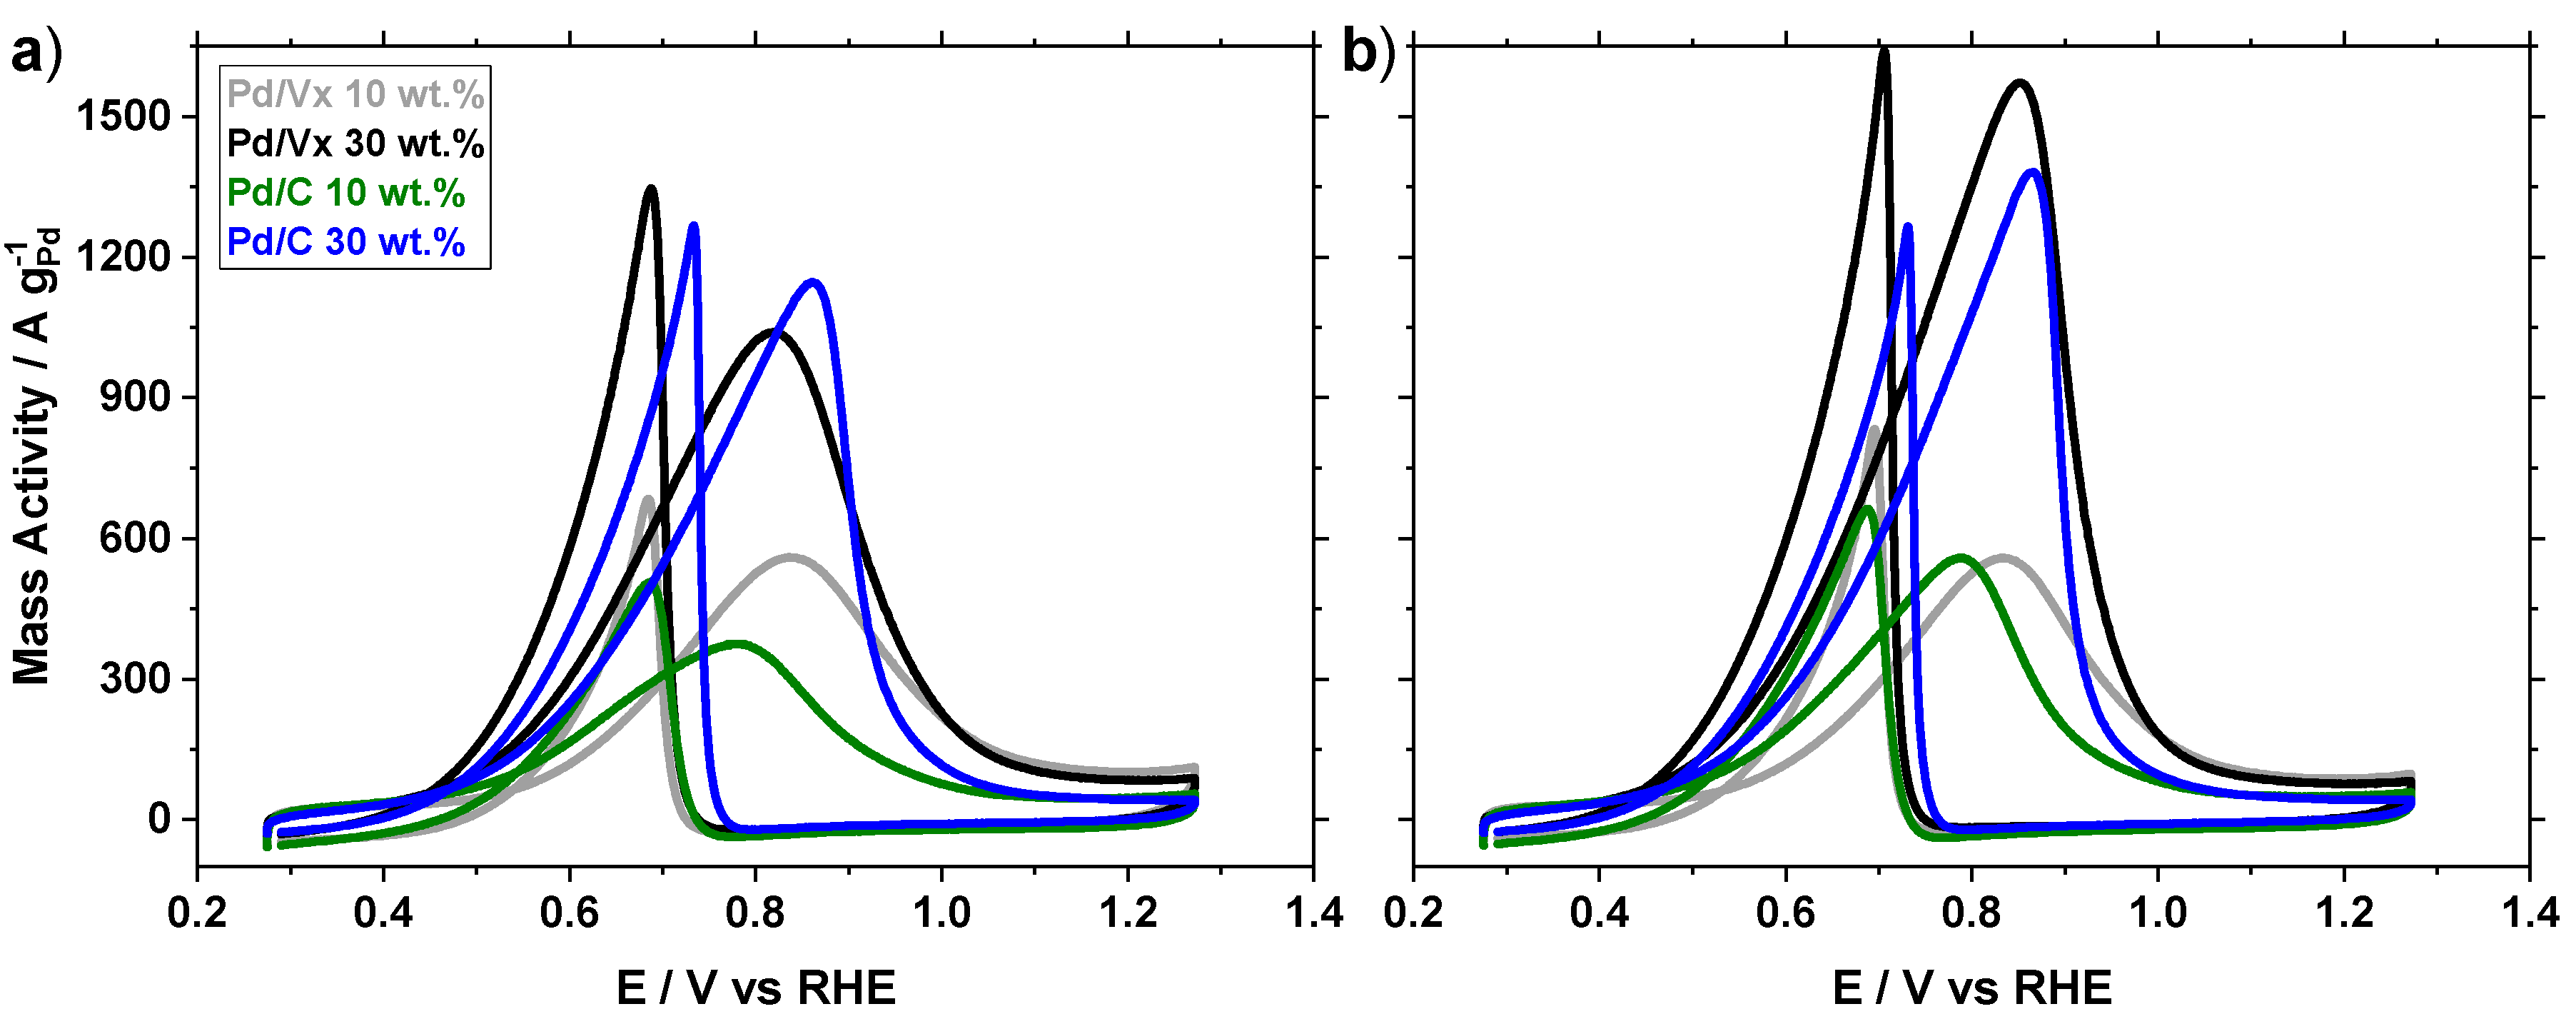
2.2.1. Activity
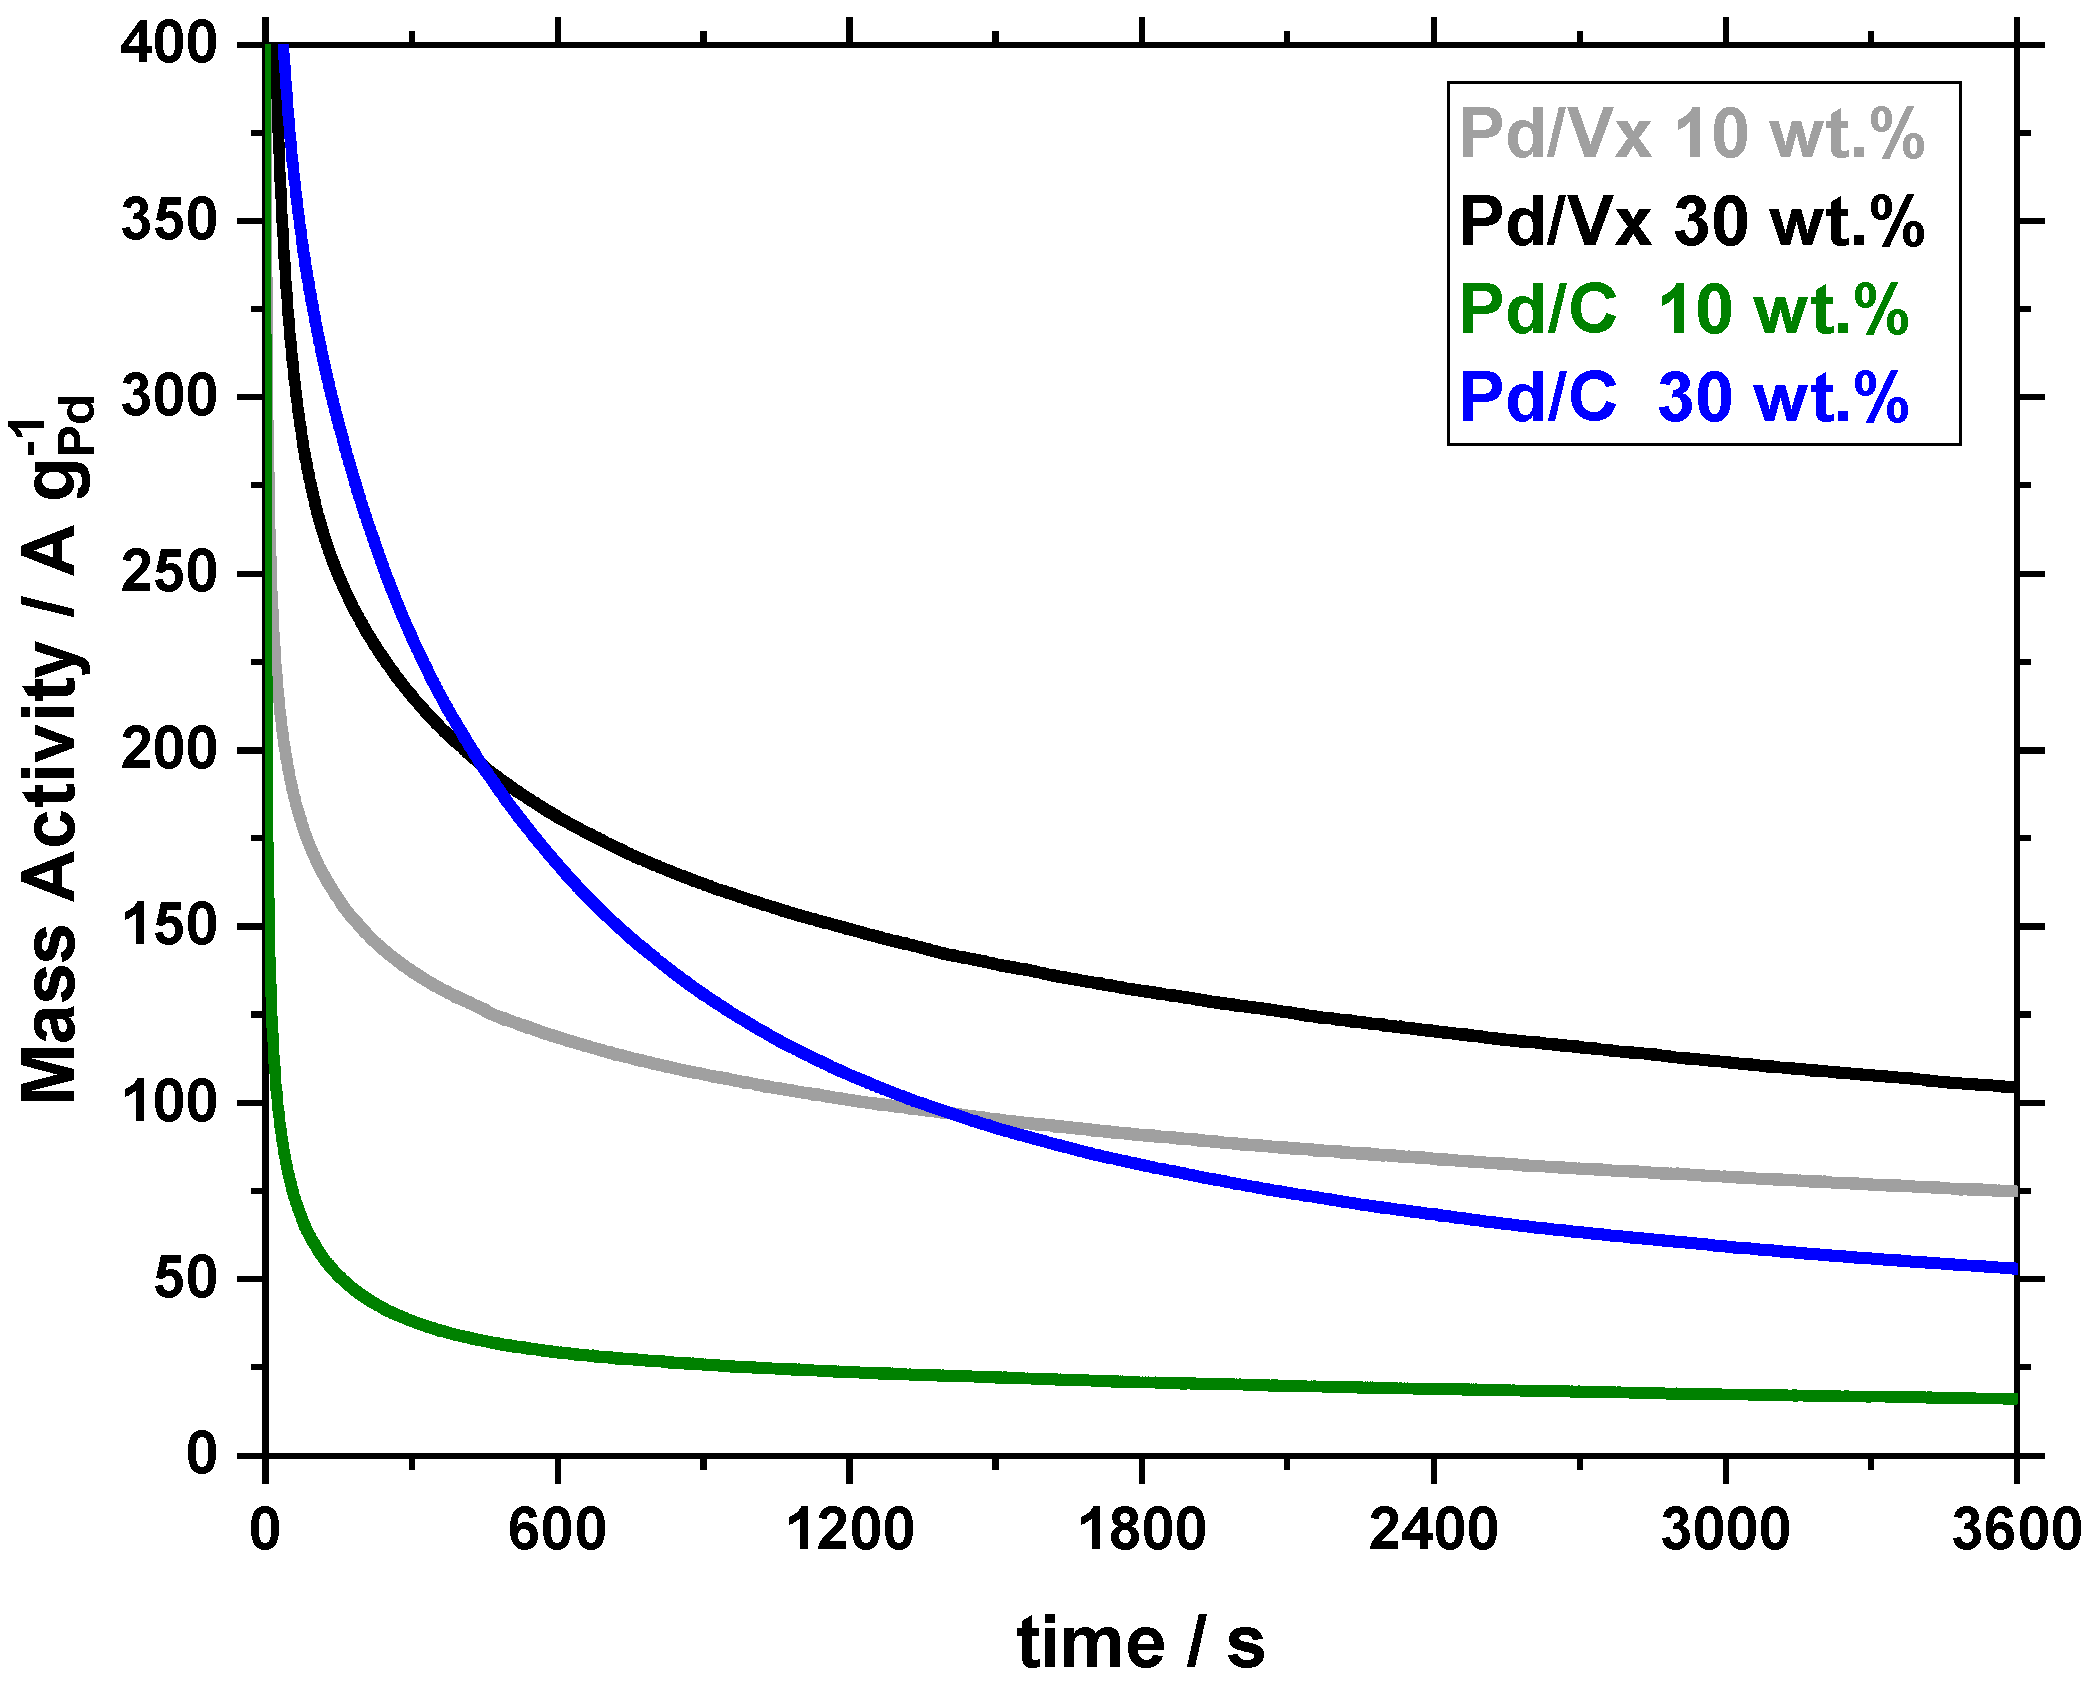
2.2.2. Stability
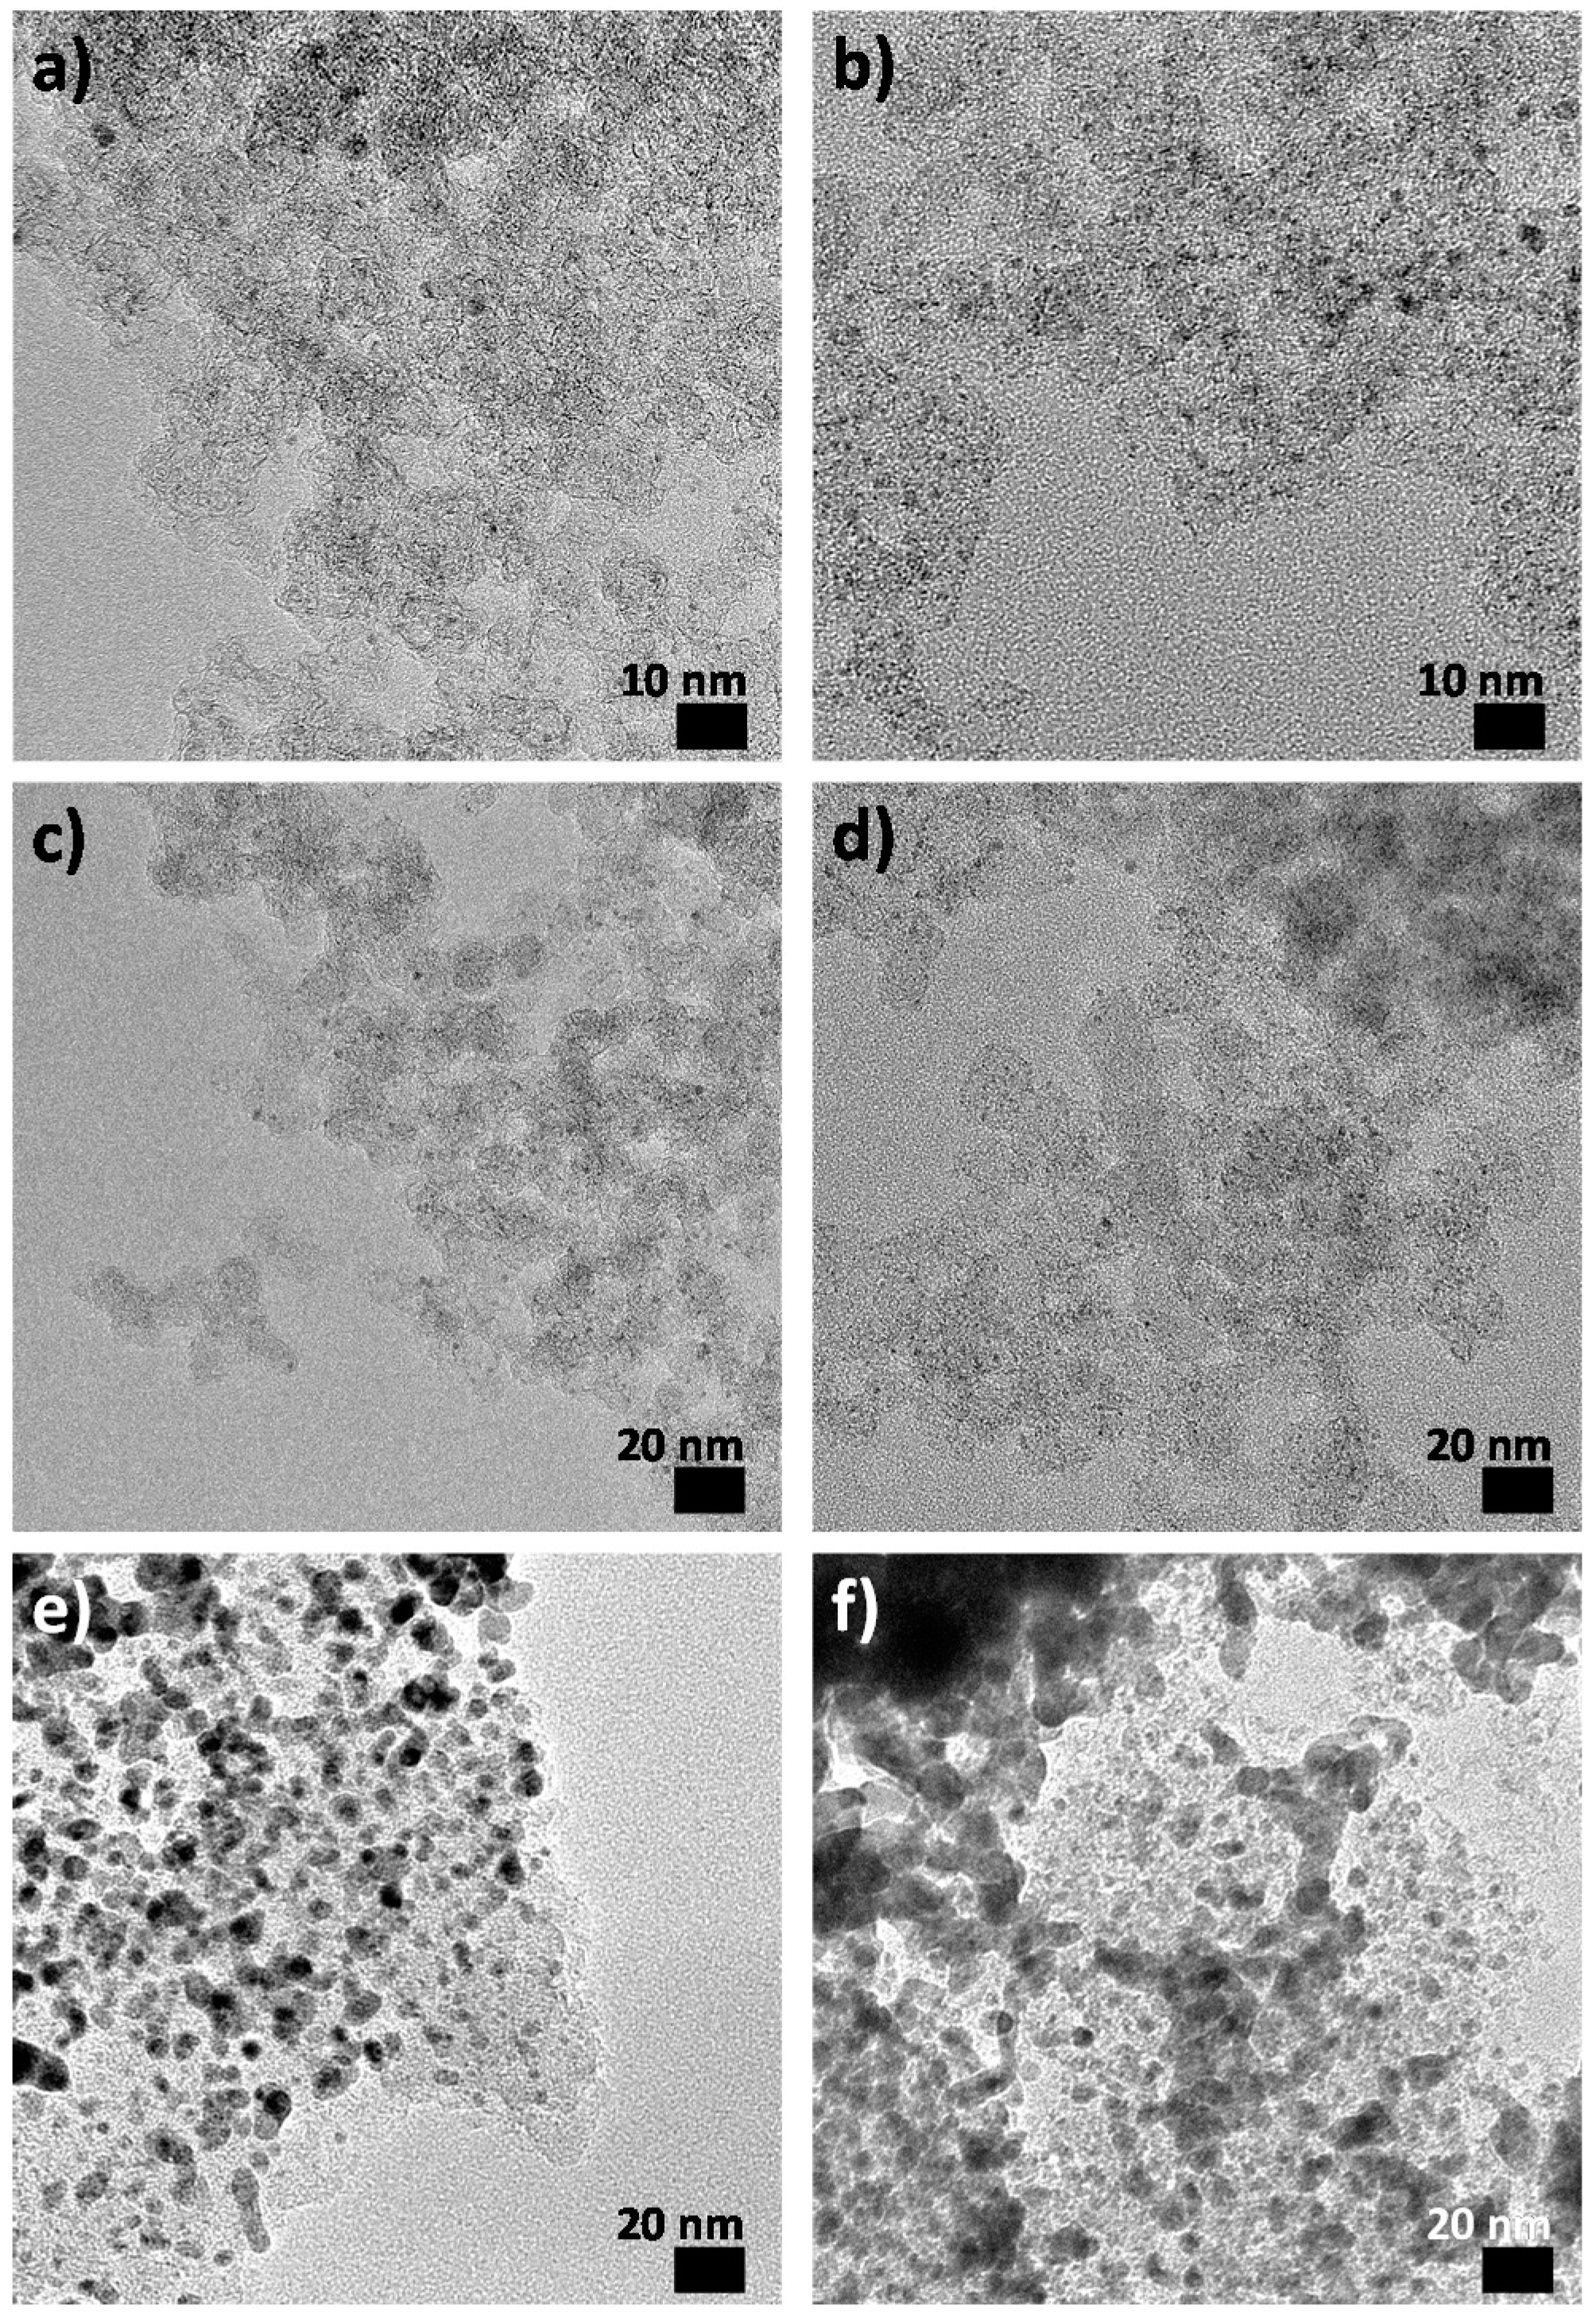
2.3. Post-Catalysis Characterization
2.3.1. Electro-Active Surface Estimation
2.3.2. Post-Mortem Transmission Electron Microscopy
3. Discussion
4. Materials and Methods
4.1. Chemicals
4.2. Supported NP Synthesis
4.3. Pd/Vx Ink Preparation
4.4. Electrochemistry
4.4.1. Electrode Preparation
4.4.2. Electrochemical Cell
4.4.3. Electrochemical Measurements
4.4.4. Electrochemically Active Surface Area (ECSA)
4.4.5. Cyclic Voltammetry (CV)
4.4.6. Chronoamperometry (CA)
4.5. TEM Characterization
4.6. ICP-MS Measurements
5. Conclusions
Supplementary Materials
Author Contributions
Funding
Acknowledgments
Conflicts of Interest
References
- Witte, P.T.; Berben, P.H.; Boland, S.; Boymans, E.H.; Vogt, D.; Geus, J.W.; Donkervoort, J.G. BASF NanoSelect (TM) Technology: Innovative Supported Pd- and Pt-based Catalysts for Selective Hydrogenation Reactions. Top. Catal. 2012, 55, 505–511. [Google Scholar] [CrossRef] [Green Version]
- Quinson, J.; Neumann, S.; Wannmacher, T.; Kacenauskaite, L.; Inaba, M.; Bucher, J.; Bizzotto, F.; Simonsen, S.B.; Kuhn, L.T.; Bujak, D.; et al. Colloids for Catalysts: A Concept for the Preparation of Superior Catalysts of Industrial Relevance. Angew. Chem.-Int. Ed. 2018, 57, 12338–12341. [Google Scholar] [CrossRef]
- Escudero-Escribano, M.; Malacrida, P.; Hansen, M.H.; Vej-Hansen, U.G.; Velazquez-Palenzuela, A.; Tripkovic, V.; Schiotz, J.; Rossmeisl, J.; Stephens, I.E.L.; Chorkendorff, I. Tuning the activity of Pt alloy electrocatalysts by means of the lanthanide contraction. Science 2016, 352, 73–76. [Google Scholar] [CrossRef] [PubMed] [Green Version]
- Escudero-Escribano, M.; Jensen, K.D.; Jensen, A.W. Recent advances in bimetallic electrocatalysts for oxygen reduction: Design principles, structure-function relations and active phase elucidation. Curr. Opin. Electrochem. 2018, 8, 135–146. [Google Scholar] [CrossRef]
- Pollet, B.G.; Kocha, S.S.; Staffell, I. Current status of automotive fuel cells for sustainable transport. Curr. Opin. Electrochem. 2019, 16, 90–95. [Google Scholar] [CrossRef]
- Pedone, D.; Moglianetti, M.; De Luca, E.; Bardi, G.; Pompa, P.P. Platinum nanoparticles in nanobiomedicine. Chem. Soc. Rev. 2017, 46, 4951–4975. [Google Scholar] [CrossRef] [PubMed]
- Rai, M.; Ingle, A.P.; Birla, S.; Yadav, A.; Dos Santos, C.A. Strategic role of selected noble metal nanoparticles in medicine. Crit. Rev. Microbiol. 2016, 42, 696–719. [Google Scholar] [CrossRef] [PubMed]
- Wang, Q.Y.; Zhang, C.L.; Shi, L.; Zeng, G.F.; Zhang, H.; Li, S.G.; Wu, P.; Zhang, Y.L.; Fan, Y.Q.; Liu, G.J.; et al. Ultralow Pt Catalyst for Formaldehyde Removal: The Determinant Role of Support. Iscience 2018, 9, 487–501. [Google Scholar] [CrossRef] [Green Version]
- Pradeep, T. Noble metal nanoparticles for water purification: A critical review. Thin Solid Film. 2009, 517, 6441–6478. [Google Scholar] [CrossRef]
- Vesborg, P.C.K.; Jaramillo, T.F. Addressing the terawatt challenge: Scalability in the supply of chemical elements for renewable energy. Rsc. Adv. 2012, 2, 7933–7947. [Google Scholar] [CrossRef] [Green Version]
- Losch, P.; Huang, W.X.; Goodman, E.D.; Wrasman, C.J.; Holm, A.; Riscoe, A.R.; Schwalbe, J.A.; Cargnello, M. Colloidal nanocrystals for heterogeneous catalysis. Nano Today 2019, 24, 15–47. [Google Scholar] [CrossRef]
- Fievet, F.; Ammar-Merah, S.; Brayner, R.; Chau, F.; Giraud, M.; Mammeri, F.; Peron, J.; Piquemal, J.Y.; Sicard, L.; Viau, G. The polyol process: A unique method for easy access to metal nanoparticles with tailored sizes, shapes and compositions. Chem. Soc. Rev. 2018, 47, 5187–5233. [Google Scholar] [CrossRef] [PubMed]
- El Amri, N.; Roger, K. Polyvinylpyrrolidone (PVP) impurities drastically impact the outcome of nanoparticle syntheses. J. Colloid Interface Sci. 2020, 576, 435–443. [Google Scholar] [CrossRef]
- Liz-Marzan, L.M.; Kagan, C.R.; Millstone, J.E. Reproducibility in Nanocrystal Synthesis? Watch Out for Impurities! ACS Nano 2020, 14, 6359–6361. [Google Scholar] [CrossRef] [PubMed]
- Cargnello, M.; Chen, C.; Diroll, B.T.; Doan-Nguyen, V.V.T.; Gorte, R.J.; Murray, C.B. Efficient Removal of Organic Ligands from Supported Nanocrystals by Fast Thermal Annealing Enables Catalytic Studies on Well-Defined Active Phases. J. Am. Chem. Soc. 2015, 137, 6906–6911. [Google Scholar] [CrossRef] [PubMed]
- Niu, Z.Q.; Li, Y.D. Removal and Utilization of Capping Agents in Nanocatalysis. Chem. Mater. 2014, 26, 72–83. [Google Scholar] [CrossRef]
- Li, D.G.; Wang, C.; Tripkovic, D.; Sun, S.H.; Markovic, N.M.; Stamenkovic, V.R. Surfactant Removal for Colloidal Nanoparticles from Solution Synthesis: The Effect on Catalytic Performance. ACS Catal. 2012, 2, 1358–1362. [Google Scholar] [CrossRef]
- Huang, W.X.; Hua, Q.; Cao, T. Influence and Removal of Capping Ligands on Catalytic Colloidal Nanoparticles. Catal. Lett. 2014, 144, 1355–1369. [Google Scholar] [CrossRef]
- Zhang, S.; Jiang, B.; Jiang, K.; Cai, W.-B. Surfactant-Free Synthesis of Carbon-Supported Palladium Nanoparticles and Size-Dependent Hydrogen Production from Formic Acid-Formate Solution. ACS Appl. Mater. Interfaces 2017, 9, 24678–24687. [Google Scholar] [CrossRef]
- Yin, Y.R.; Ma, N.; Xue, J.; Wang, G.Q.; Liu, S.B.; Li, H.L.; Guo, P.Z. Insights into the Role of Poly(vinylpyrrolidone) in the Synthesis of Palladium Nanoparticles and Their Electrocatalytic Properties. Langmuir 2019, 35, 787–795. [Google Scholar] [CrossRef]
- Quinson, J.; Simonsen, S.B.; Theil Kuhn, L.; Kunz, S.; Arenz, M. Size effect studies in catalysis: A simple surfactant-free synthesis of sub 3 nm Pd nanocatalysts supported on carbon. RSC Adv. 2018, 8, 33794–33797. [Google Scholar] [CrossRef] [Green Version]
- Nasrollahzadeh, M.; Sajjadi, M.; Shokouhimehr, M.; Varma, R.S. Recent developments in palladium (nano)catalysts supported on polymers for selective and sustainable oxidation processes. Coord. Chem. Rev. 2019, 397, 54–75. [Google Scholar] [CrossRef]
- Monyoncho, E.A.; Steinmann, S.N.; Michel, C.; Baranova, E.A.; Woo, T.K.; Sautet, P. Ethanol Electro-oxidation on Palladium Revisited Using Polarization Modulation Infrared Reflection Absorption Spectroscopy (PM-IRRAS) and Density Functional Theory (DFT): Why Is It Difficult To Break the C–C Bond? ACS Catal. 2016, 6, 4894–4906. [Google Scholar] [CrossRef]
- Bai, J.; Liu, D.Y.; Yang, J.; Chen, Y. Nanocatalysts for Electrocatalytic Oxidation of Ethanol. ChemSusChem 2019, 12, 2117–2132. [Google Scholar] [CrossRef]
- Yao, C.X.; Zhang, Q.; Su, Y.; Xu, L.J.; Wang, H.; Liu, J.L.; Hou, S.F. Palladium Nanoparticles Encapsulated into Hollow N-Doped Graphene Microspheres as Electrocatalyst for Ethanol Oxidation Reaction. ACS Appl. Nano Mater. 2019, 2, 1898–1908. [Google Scholar] [CrossRef]
- Jensen, K.D.; Tymoczko, J.; Rossmeisl, J.; Bandarenka, A.S.; Chorkendorff, I.; Escudero-Escribano, M.; Stephens, I.E.L. Elucidation of the Oxygen Reduction Volcano in Alkaline Media using a Copper–Platinum(111) Alloy. Angew. Chem. -Int. Ed. 2018, 57, 2800–2805. [Google Scholar] [CrossRef]
- Xu, C.; Cheng, L.; Shen, P.; Liu, Y. Methanol and ethanol electrooxidation on Pt and Pd supported on carbon microspheres in alkaline media. Electrochem. Commun. 2007, 9, 997–1001. [Google Scholar] [CrossRef]
- An, L.; Zhao, T.S.; Li, Y.S. Carbon-neutral sustainable energy technology: Direct ethanol fuel cells. Renew. Sustain. Energy Rev. 2015, 50, 1462–1468. [Google Scholar] [CrossRef]
- Lai, S.C.S.; Kleijn, S.E.F.; Ozturk, F.T.Z.; Vellinga, V.C.V.; Koning, J.; Rodriguez, P.; Koper, M.T.M. Effects of electrolyte pH and composition on the ethanol electro-oxidation reaction. Catal. Today 2010, 154, 92–104. [Google Scholar] [CrossRef]
- Guo, J.S.; Chen, R.R.; Zhu, F.H.; Sun, S.G.; Villullas, H.M. New understandings of ethanol oxidation reaction mechanism on Pd/C and Pd2Ru/C catalysts in alkaline direct ethanol fuel cells. Appl. Catal. B-Environ. 2018, 224, 602–611. [Google Scholar] [CrossRef] [Green Version]
- Badwal, S.P.S.; Giddey, S.; Kulkarni, A.; Goel, J.; Basu, S. Direct ethanol fuel cells for transport and stationary applications–A comprehensive review. Appl. Energy 2015, 145, 80–103. [Google Scholar] [CrossRef]
- Varcoe, J.R.; Atanassov, P.; Dekel, D.R.; Herring, A.M.; Hickner, M.A.; Kohl, P.A.; Kucernak, A.R.; Mustain, W.E.; Nijmeijer, K.; Scott, K.; et al. Anion-exchange membranes in electrochemical energy systems. Energy Environ. Sci. 2014, 7, 3135–3191. [Google Scholar] [CrossRef] [Green Version]
- Ma, L.; Chu, D.; Chen, R.R. Comparison of ethanol electro-oxidation on Pt/C and Pd/C catalysts in alkaline media. Int. J. Hydrog. Energy 2012, 37, 11185–11194. [Google Scholar] [CrossRef]
- Bianchini, C.; Shen, P.K. Palladium-Based Electrocatalysts for Alcohol Oxidation in Half Cells and in Direct Alcohol Fuel Cells. Chem. Rev. 2009, 109, 4183–4206. [Google Scholar] [CrossRef]
- Wang, Y.; Zou, S.Z.; Cai, W.B. Recent Advances on Electro-Oxidation of Ethanol on Pt- and Pd-Based Catalysts: From Reaction Mechanisms to Catalytic Materials. Catalysts 2015, 5, 1507–1534. [Google Scholar] [CrossRef]
- Adishev, A.; Arrigo, R.; Baletto, F.; Bordet, A.; Bukhtiyarov, V.; Carosso, M.; Catlow, R.; Conway, M.; Davies, J.; Davies, P.; et al. Control of catalytic nanoparticle synthesis: General discussion. Faraday Discuss. 2018, 208, 471–495. [Google Scholar] [CrossRef]
- Quinson, J.; Arenz, M. The toolbox concept for the synthesis of surfactant-free colloidal nanoparticles as electrocatalysts. ECS Trans. 2020, 97, 443–455. [Google Scholar] [CrossRef]
- Bligaard, T.; Bullock, R.M.; Campbell, C.T.; Chen, J.G.G.; Gates, B.C.; Gorte, R.J.; Jones, C.W.; Jones, W.D.; Kitchin, J.R.; Scott, S.L. Toward Benchmarking in Catalysis Science: Best Practices, Challenges, and Opportunities. ACS Catal. 2016, 6, 2590–2602. [Google Scholar] [CrossRef]
- Wen, C.N.; Li, Z.P.; Cao, C.Y.; Wang, Y.Q.; Guo, P.Z.; Zhao, X.S. Structural evolution of palladium nanoparticles and their electrocatalytic activity toward ethanol oxidation in alkaline solution. RSC Adv. 2016, 6, 91991–91998. [Google Scholar] [CrossRef]
- Ma, X.-Y.; Chen, Y.; Wang, H.; Li, Q.-X.; Lin, W.-F.; Cai, W.-B. Electrocatalytic oxidation of ethanol and ethylene glycol on cubic, octahedral and rhombic dodecahedral palladium nanocrystals. Chem. Commun. 2018, 54, 2562–2565. [Google Scholar] [CrossRef] [Green Version]
- Yang, H.; Zhang, X.; Zou, H.; Yu, Z.; Li, S.; Sun, J.; Chen, S.; Jin, J.; Ma, J. Palladium Nanoparticles Anchored on Three-Dimensional Nitrogen-Doped Carbon Nanotubes as a Robust Electrocatalyst for Ethanol Oxidation. ACS Sustain. Chem. Eng. 2018, 6, 7918–7923. [Google Scholar] [CrossRef]
- Kaedi, F.; Yavari, Z.; Asmaei, M.; Abbasian, A.R.; Noroozifar, M. Ethanol electrooxidation on high-performance mesoporous ZnFe2O4-supported palladium nanoparticles. New J. Chem. 2019, 43, 3884–3890. [Google Scholar] [CrossRef]
- Ma, N.; Liu, X.H.; Yang, Z.Q.; Tai, G.J.; Yin, Y.R.; Liu, S.B.; Li, H.L.; Guo, P.Z.; Zhao, X.S. Carrageenan Asissted Synthesis of Palladium Nanoflowers and Their Electrocatalytic Activity toward Ethanol. ACS Sustain. Chem. Eng. 2018, 6, 1133–1140. [Google Scholar] [CrossRef]
- Chen, Y.J.; Chen, Y.R.; Chiang, C.H.; Tung, K.L.; Yeh, T.K.; Tuan, H.Y. Monodisperse ordered indium-palladium nanoparticles: Synthesis and role of indium for boosting superior electrocatalytic activity for ethanol oxidation reaction. Nanoscale 2019, 11, 3336–3343. [Google Scholar] [CrossRef]
- Su, Y.; Yao, C.X.; Zhan, Q.; Xu, L.J.; Wang, H.; Liu, J.L.; Hou, S.F. Palladium Nanoparticles Supported on B-Doped Carbon Nanocage as Electrocatalyst toward Ethanol Oxidation Reaction. ChemElectroChem 2019, 6, 5211–5219. [Google Scholar] [CrossRef]
- Zhang, L.J.; Xia, D.G. Electrocatalytic activity of ordered intermetallic PtSb for methanol electro-oxidation. Appl. Surf. Sci. 2006, 252, 2191–2195. [Google Scholar] [CrossRef]
- Manoharan, R.; Goodenough, J.B. Methanol oxidation in acid on ordered NiTi. J. Mater. Chem. 1992, 2, 875–887. [Google Scholar] [CrossRef]
- Cuesta, A.; Escudero, M.; Lanova, B.; Baltruschat, H. Cyclic Voltammetry, FTIRS, and DEMS Study of the Electrooxidation of Carbon Monoxide, Formic Acid, and Methanol on Cyanide-Modified Pt(111) Electrodes. Langmuir 2009, 25, 6500–6507. [Google Scholar] [CrossRef]
- Chen, L.; Lu, L.; Zhu, H.; Chen, Y.; Huang, Y.; Li, Y.; Wang, L. Improved ethanol electrooxidation performance by shortening Pd-Ni active site distance in Pd-Ni-P nanocatalysts. Nat. Commun. 2017, 8. [Google Scholar] [CrossRef] [Green Version]
- Wu, Z.P.; Miao, B.; Hopkins, E.; Park, K.; Chen, Y.F.; Jiang, H.X.; Zhang, M.H.; Zhong, C.J.; Wang, L.C. Poisonous Species in Complete Ethanol Oxidation Reaction on Palladium Catalysts. J. Phys. Chem. C 2019, 123, 20853–20868. [Google Scholar] [CrossRef]
- Meier, J.C.; Galeano, C.; Katsounaros, I.; Topalov, A.A.; Kostka, A.; Schuth, F.; Mayrhofer, K.J.J. Degradation Mechanisms of Pt/C Fuel Cell Catalysts under Simulated Start-Stop Conditions. Acs Catal. 2012, 2, 832–843. [Google Scholar] [CrossRef]
- Begum, H.; Ahmed, M.S.; Jeon, S. Highly Efficient Dual Active Palladium Nanonetwork Electrocatalyst for Ethanol Oxidation and Hydrogen Evolution. ACS Appl. Mater. Interfaces 2017, 9, 39303–39311. [Google Scholar] [CrossRef] [PubMed]
- Jovanovic, P.; Ruiz-Zepeda, F.; Sala, M.; Hodnik, N. Atomic Scale Insights into Electrochemical Dissolution of Janus Pt-SnO2 Nanoparticles in the Presence of Ethanol in Acidic Media: An IL-STEM and EFC-ICP-MS Study. J. Phys. Chem. C 2018, 122, 10050–10058. [Google Scholar] [CrossRef]
- Kasian, O.; Simon, G.; Mayrhofer, K.J.J.; Cherevko, S. Electrochemical On-line ICP-MS in Electrocatalysis Research. Chem. Rec. 2018, 19, 2130–2142. [Google Scholar] [CrossRef]
- Meng, H.; Zeng, D.; Xie, F. Recent Development of Pd-Based Electrocatalysts for Proton Exchange Membrane Fuel Cells. Catalysts 2015, 5, 1221–1274. [Google Scholar] [CrossRef]
- Antolini, E. Structural parameters of supported fuel cell catalysts: The effect of particle size, inter-particle distance and metal loading on catalytic activity and fuel cell performance. Appl. Catal. B Environ. 2016, 181, 298–313. [Google Scholar] [CrossRef]
- Perez-Alonso, F.J.; McCarthy, D.N.; Nierhoff, A.; Hernandez-Fernandez, P.; Strebel, C.; Stephens, I.E.L.; Nielsen, J.H.; Chorkendorff, I. The Effect of Size on the Oxygen Electroreduction Activity of Mass-Selected Platinum Nanoparticles. Angew. Chem. Int. Ed. 2012, 51, 4641–4643. [Google Scholar] [CrossRef]
- Perez, J.; Paganin, V.A.; Antolini, E. Particle size effect for ethanol electro-oxidation on Pt/C catalysts in half-cell and in a single direct ethanol fuel cell. J. Electroanal. Chem. 2011, 654, 108–115. [Google Scholar] [CrossRef] [Green Version]
- Qin, Y.H.; Yang, H.H.; Zhang, X.S.; Li, P.; Ma, C.A. Effect of carbon nanofibers microstructure on electrocatalytic activities of Pd electrocatalysts for ethanol oxidation in alkaline medium. Int. J. Hydrog. Energy 2010, 35, 7667–7674. [Google Scholar] [CrossRef]
- Lukaszewski, M.; Soszko, M.; Czerwinski, A. Electrochemical Methods of Real Surface Area Determination of Noble Metal Electrodes—an Overview. Int. J. Electrochem. Sci. 2016, 11, 4442–4469. [Google Scholar] [CrossRef]
- Pedersen, C.M.; Escudero-Escribano, M.; Velazquez-Palenzuela, A.; Christensen, L.H.; Chorkendorff, I.; Stephens, I.E.L. Benchmarking Pt-based electrocatalysts for low temperature fuel cell reactions with the rotating disk electrode: Oxygen reduction and hydrogen oxidation in the presence of CO (review article). Electrochim. Acta 2015, 179, 647–657. [Google Scholar] [CrossRef]
- Wei, C.; Rao, R.R.; Peng, J.Y.; Huang, B.T.; Stephens, I.E.L.; Risch, M.; Xu, Z.C.J.; Shao-Horn, Y. Recommended Practices and Benchmark Activity for Hydrogen and Oxygen Electrocatalysis in Water Splitting and Fuel Cells. Adv. Mater. 2019, 31. [Google Scholar] [CrossRef] [PubMed]
- Davi, M.; Kessler, D.; Slabon, A. Electrochemical oxidation of methanol and ethanol on two-dimensional self-assembled palladium nanocrystal arrays. Thin Solid Film. 2016, 615, 221–225. [Google Scholar] [CrossRef]
- He, Y.; Yang, P.; Fan, J.; Liu, Y.; Du, Y.; Feng, J.; Fan, F.; Li, D. Facile and surfactant-free synthesis of supported Pd nanoparticles on hydrotalcite for oxidation of benzyl alcohol. RSC Adv. 2015, 5, 74907–74915. [Google Scholar] [CrossRef]
- Zhu, Q.L.; Tsumori, N.; Xu, Q. Immobilizing Extremely Catalytically Active Palladium Nanoparticles to Carbon Nanospheres: A Weakly-Capping Growth Approach. J. Am. Chem. Soc. 2015, 137, 11743–11748. [Google Scholar] [CrossRef] [PubMed]
- Yang, Z.-R.; Wang, S.-Q.; Wang, J.; Zhou, A.-J.; Xu, C.-W. Pd supported on carbon containing nickel, nitrogen and sulfur for ethanol electrooxidation. Sci. Rep. 2017, 7. [Google Scholar] [CrossRef] [PubMed] [Green Version]
- Arminio-Ravelo, J.A.; Jensen, A.W.; Jensen, K.D.; Quinson, J.; Escudero-Escribano, M. Electrolyte effects on the electrocatalytic performance of iridium-based nanoparticles for oxygen evolution in rotating disc electrodes. Chem. Phys. Chem. 2019, 20, 2956–2963. [Google Scholar] [CrossRef] [PubMed]
- Inaba, M.; Quinson, J.; Arenz, M. pH matters: The influence of the catalyst ink on the oxygen reduction activity determined in thin film rotating disk electrode measurements. J. Power Sources 2017, 353, 19–27. [Google Scholar] [CrossRef]


| Characteristic | Commercial | Synthesized | ||
|---|---|---|---|---|
| wt % | 10 | 30 | 10 | 30 |
| dbefore/nm | 5.5 ± 1.7 | 5.7 ± 1.7 | 2.1 ± 0.7 | 2.5 ± 0.9 |
| dafter/nm | 7.2 ± 2.7 * | 7.7 ± 2.8 * | 5.5 ± 1.9 | 5.7 ± 1.6 |
| MA/A.g−1 after 1 h CA | 28.1 ± 11.8 | 60.6 ± 31.8 | 91.5 ± 76.9 | 121.0 ± 63.7 |
| ECSA before EOR/m2·g−1 | 8.3 ± 2.7 | 17.7 ± 9.0 | 38.6 ± 23.1 | 68.9 ± 25.1 |
| ECSA after EOR/m2·g−1 | 22.1 ± 7.2 | 20.8 ± 7.0 | 23.1 ± 12.4 | 33.1 ± 9.7 |
| SA after EOR/A·m−2 | 1.5 ± 0.9 | 2.9 ± 1.2 | 4.2 ± 2.3 | 3.6 ± 1.6 |
| Steps | Electrolyte | Conditions * | Purpose |
|---|---|---|---|
| 1 | 1 M KOH | CV—5 sweeps | ECSA before EOR |
| 2 | 1 M KOH + 1 M ethanol | CV—10 sweeps | Mass Activity |
| 3 | 1 M KOH + 1 M ethanol | CA—60 min | Mass Activity |
| 4 | 1 M KOH + 1 M ethanol | CV—10 sweeps | Mass Activity |
| 5 | 1 M KOH | CV—5 sweeps | - |
| 6 | 1 M KOH | CA—5 min | Cleaning |
| 7 | 1 M KOH | CV—5 sweeps | ECSA after EOR |
Publisher’s Note: MDPI stays neutral with regard to jurisdictional claims in published maps and institutional affiliations. |
© 2020 by the authors. Licensee MDPI, Basel, Switzerland. This article is an open access article distributed under the terms and conditions of the Creative Commons Attribution (CC BY) license (http://creativecommons.org/licenses/by/4.0/).
Share and Cite
Schreyer, O.A.H.; Quinson, J.; Escudero-Escribano, M. Toward Overcoming the Challenges in the Comparison of Different Pd Nanocatalysts: Case Study of the Ethanol Oxidation Reaction. Inorganics 2020, 8, 59. https://0-doi-org.brum.beds.ac.uk/10.3390/inorganics8110059
Schreyer OAH, Quinson J, Escudero-Escribano M. Toward Overcoming the Challenges in the Comparison of Different Pd Nanocatalysts: Case Study of the Ethanol Oxidation Reaction. Inorganics. 2020; 8(11):59. https://0-doi-org.brum.beds.ac.uk/10.3390/inorganics8110059
Chicago/Turabian StyleSchreyer, Oliver Asger Hjortshøj, Jonathan Quinson, and María Escudero-Escribano. 2020. "Toward Overcoming the Challenges in the Comparison of Different Pd Nanocatalysts: Case Study of the Ethanol Oxidation Reaction" Inorganics 8, no. 11: 59. https://0-doi-org.brum.beds.ac.uk/10.3390/inorganics8110059