Communication

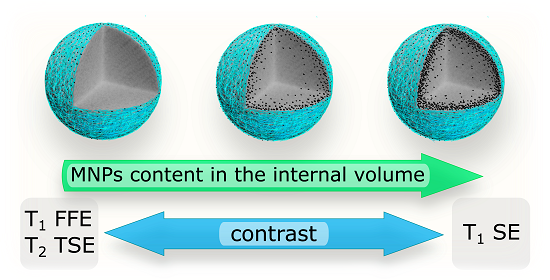
Magnetic Composite Submicron Carriers with Structure-Dependent MRI Contrast

by
Anastasiia A. Kozlova
1,*,
Sergey V. German
2,3,
Vsevolod S. Atkin
4,
Victor V. Zyev
5,
Maxwell A. Astle
6,
Daniil N. Bratashov
1,
Yulia I. Svenskaya
4 and
Dmitry A. Gorin
3
1
Biomedical photoacoustics lab, Saratov State University, Saratov 410012, Russia
2
Laboratory of objects and spectroscopy of nanoobjects of molecular spectroscopy department, Institute of Spectroscopy of the Russian Academy of Sciences (ISAN), Troitsk 108840, Russia
3
Skolkovo Institute of Science and Technology, Skolkovo Innovation Center, Moscow 121205, Russia
4
Research and Educational Institute of Nanostructures and Biosystems, Saratov State University, Saratov 410012, Russia
5
Scientific Research Institute of Fundamental and Clinical Uronephrology, Saratov State Medical University, Saratov 410012, Russia
6
School of Chemistry, University of Nottingham, University Park, Nottingham NG7 2RD, UK
*
Author to whom correspondence should be addressed.
Submission received: 11 December 2019 / Revised: 24 January 2020 / Accepted: 27 January 2020 / Published: 30 January 2020

Abstract

:
Magnetic contrast agents are widely used in magnetic resonance imaging in order to significantly change the signals from the regions of interest in comparison with the surrounding tissue. Despite a high variety of single-mode T1 or T2 contrast agents, there is a need for dual-mode contrast from the one agent. Here, we report on the synthesis of magnetic submicron carriers, containing Fe3O4 nanoparticles in their structure. We show the ability to control magnetic resonance contrast by changing not only the number of magnetite nanoparticles in one carrier or the concentration of magnetite in the suspension but also the structure of the core–shell itself. The obtained data open up the prospects for dual-mode T1/T2 magnetic contrast formation, as well as provides the basis for future investigations in this direction.

Graphical Abstract

1. Introduction

The image quality and resolution in magnetic resonance imaging (MRI) depend on the working mode, which choice is determined by the type of administrated contrast agent that reduces the longitudinal (T1) or transverse (T2) relaxation times. T1 contrast agents are more preferable for clinical applications as they provide a stronger (brighter) signal of the regions of interest in comparison to the surrounding tissue and, therefore, provide easy detection and further analysis. Gadolinium (Gd) complexes have been widely used as T1 MRI contrast agents for decades. However, in recent years there has been an ongoing debate about whether the benefits of their application generally outweigh the associated risks, as Gd-based complexes, especially in the case of linear (open-chained) ligands, can accumulate in brain tissue [1,2] as well as in the bone [3,4] and central nervous system [5] even in healthy patients. For patients with renal failure, these agents (based on linear Gd-complexes) constitute a high risk, because the moderate amount of them remains within the body for more than 24 h [6] and could not be effectively removed from the organism [7]. However, a recent study [8] reports about gadolinium-based contrast agents’ ability to cross the blood cell membrane and their retention in erythrocytes and leukocytes. Although the toxicity of gadolinium depends on its stability in a particular complex, the risk of neural tissue retention exists for all gadolinium-based agents [4].
Graphene oxide, doped with Gd, was used to provide T1 contrast and diminish toxicity [9]. However, in case of safe and effective choice, iron oxide nanoparticles are still preferable to use as a contrast agent. They degrade in the organism and could be cleared out as soon as 12 h after administration [10]. Moreover, ultrasmall (<4 nm) iron oxide nanoparticles provide high T1 contrast, r1 relaxivity reaches 20 mM−1 s−1 with the use of various ligands [7,10]. At this dimension, particles have reduced magnetic volume along with increased surface area and surface defects providing paramagnetic properties [11]. Iron oxide nanoparticle incorporation into stable material such as SiO2 provides T1 contrast enhancement compared to the colloid state, nearly equal to commercially available agents [12]. Nevertheless, the T1 contrast increase leads to a reduction in T2 contrast agent efficiency.
Both T1 and T2 MRI contrast agents are used to visualize drug delivery carriers and track them during the time. Despite T1-weighted images are preferred for clinical practice, T2 mode allows for investigation in inflamed areas of fluid-rich tissues. Therefore, recent MRI studies have been aimed at the development of agents and drug delivery systems providing dual-mode T1/T2 contrast. The most common way to create dual contrast agents is to combine materials with opposite contrast properties [13,14], such as iron oxide nanoparticles and gadolinium [15]. Another way is the use of iron oxide particles with the appropriate size and magnetization: Nanoparticles of more than 10 nm in diameter are typically T2 contrast agents, where the size less than 4 nm provides high T1 contrast [16]. However, nanoparticles of 3–10 nm in diameter were shown to possess dual MRI contrast, depending on the size [16], shape [17], and surface functionalization [7]. In vivo dual T1/T2 MRI contrast after contrast agent administration was shown in [18] for both liver and kidney of the study mouse.
In this study, we developed the drug delivery systems with controllable structure-dependent MRI contrast, based on dual-mode contrast Fe3O4 nanoparticles. These carriers are able not only to change the contrast after their degradation [19] but also to have various T1 and T2 contrast properties depending on the amount and localization of iron oxide nanoparticles.

2. Results

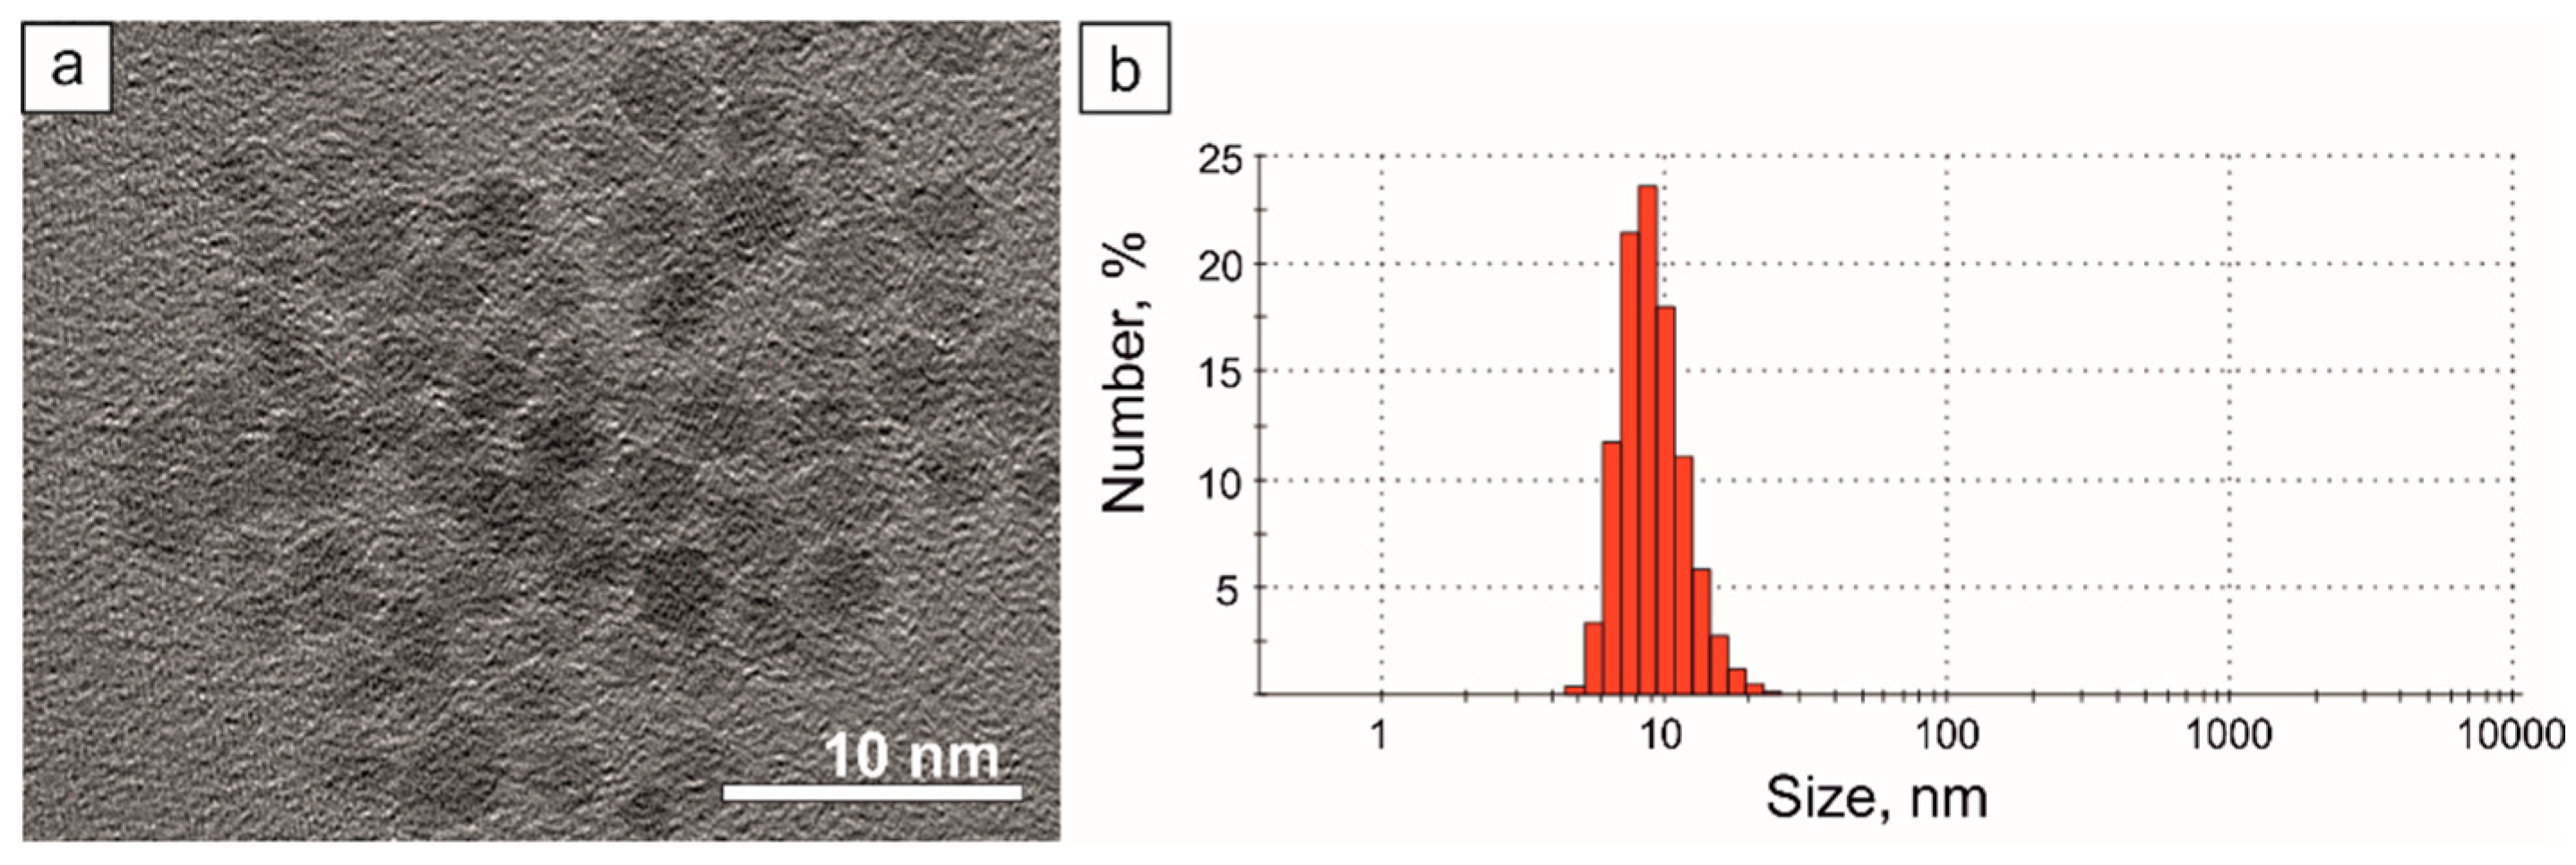
2.1. Magnetite Nanoparticle Synthesis

Magnetite nanoparticle colloid was synthesized by the chemical precipitation method in an inert atmosphere. From our point of view, the size of magnetite around 10 nm is optimal to have contrast for both T1 and T2, because the following increasing of nanoparticle size leads to significant reducing of r1 but decreasing of nanoparticle size induces the significant decreasing of r2 [20]. The concentration of magnetite colloid was 0.72 mg/mL (from the colorimetric titration method). The transmission electron microscopy (TEM) image of Fe3O4 nanoparticles is presented in Figure 1a. The average diameter, measured by dynamic light scattering (DLS, Figure 1b), was 9.3 ± 2.7 nm.

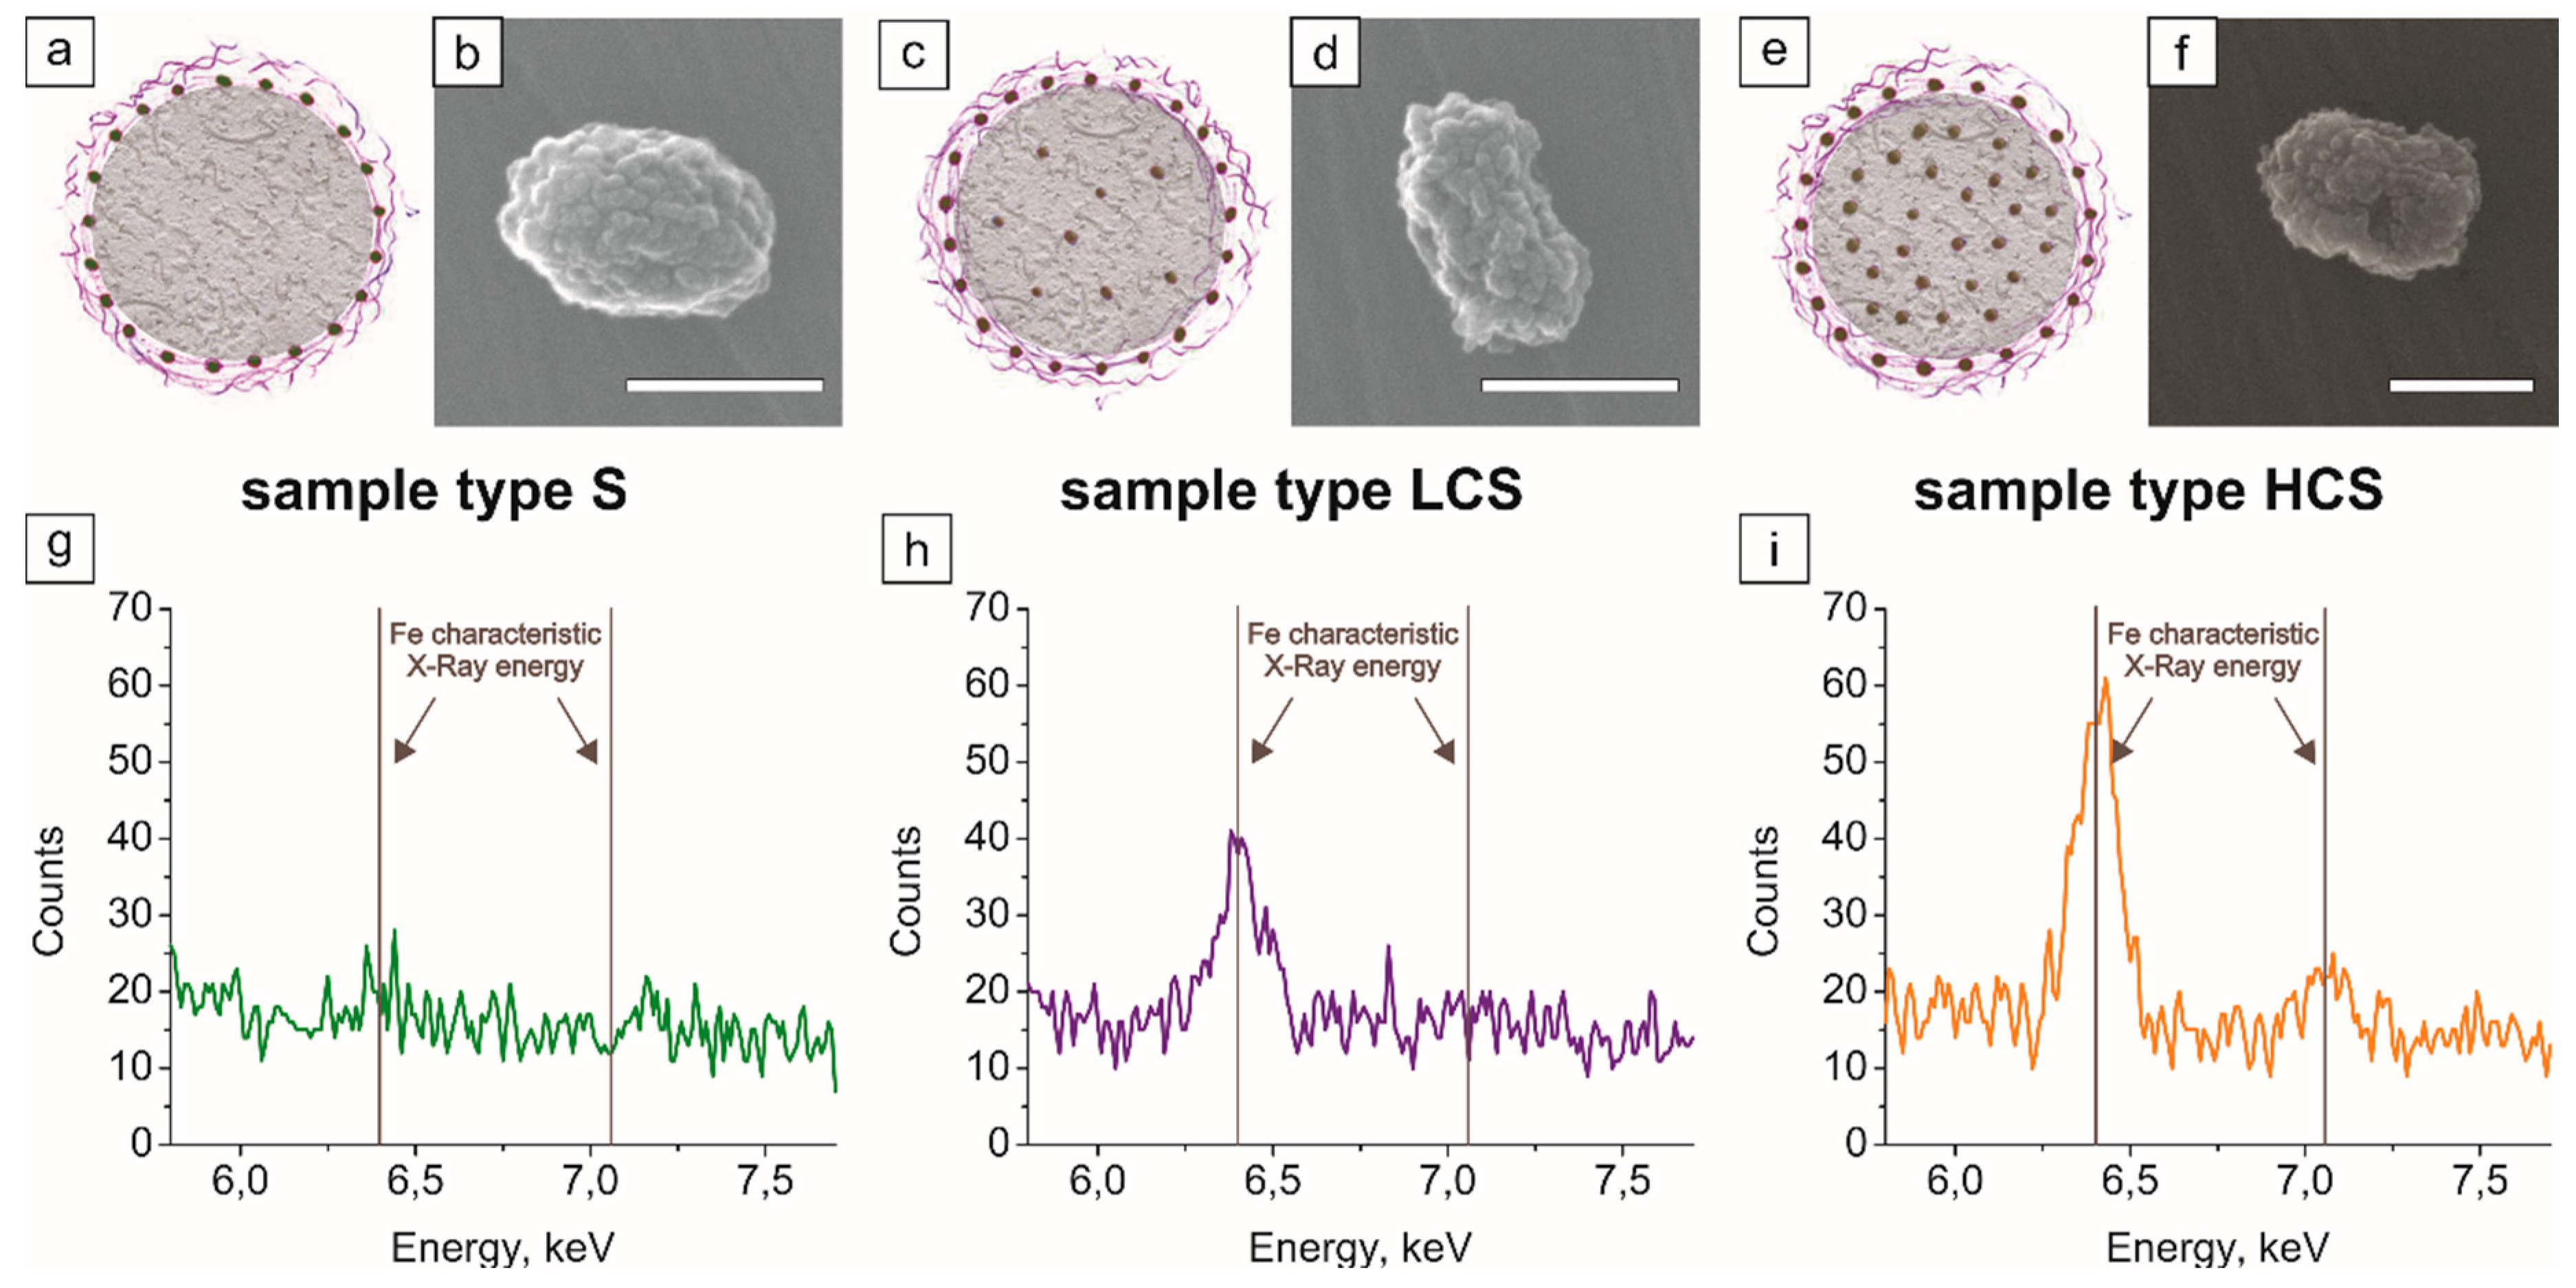
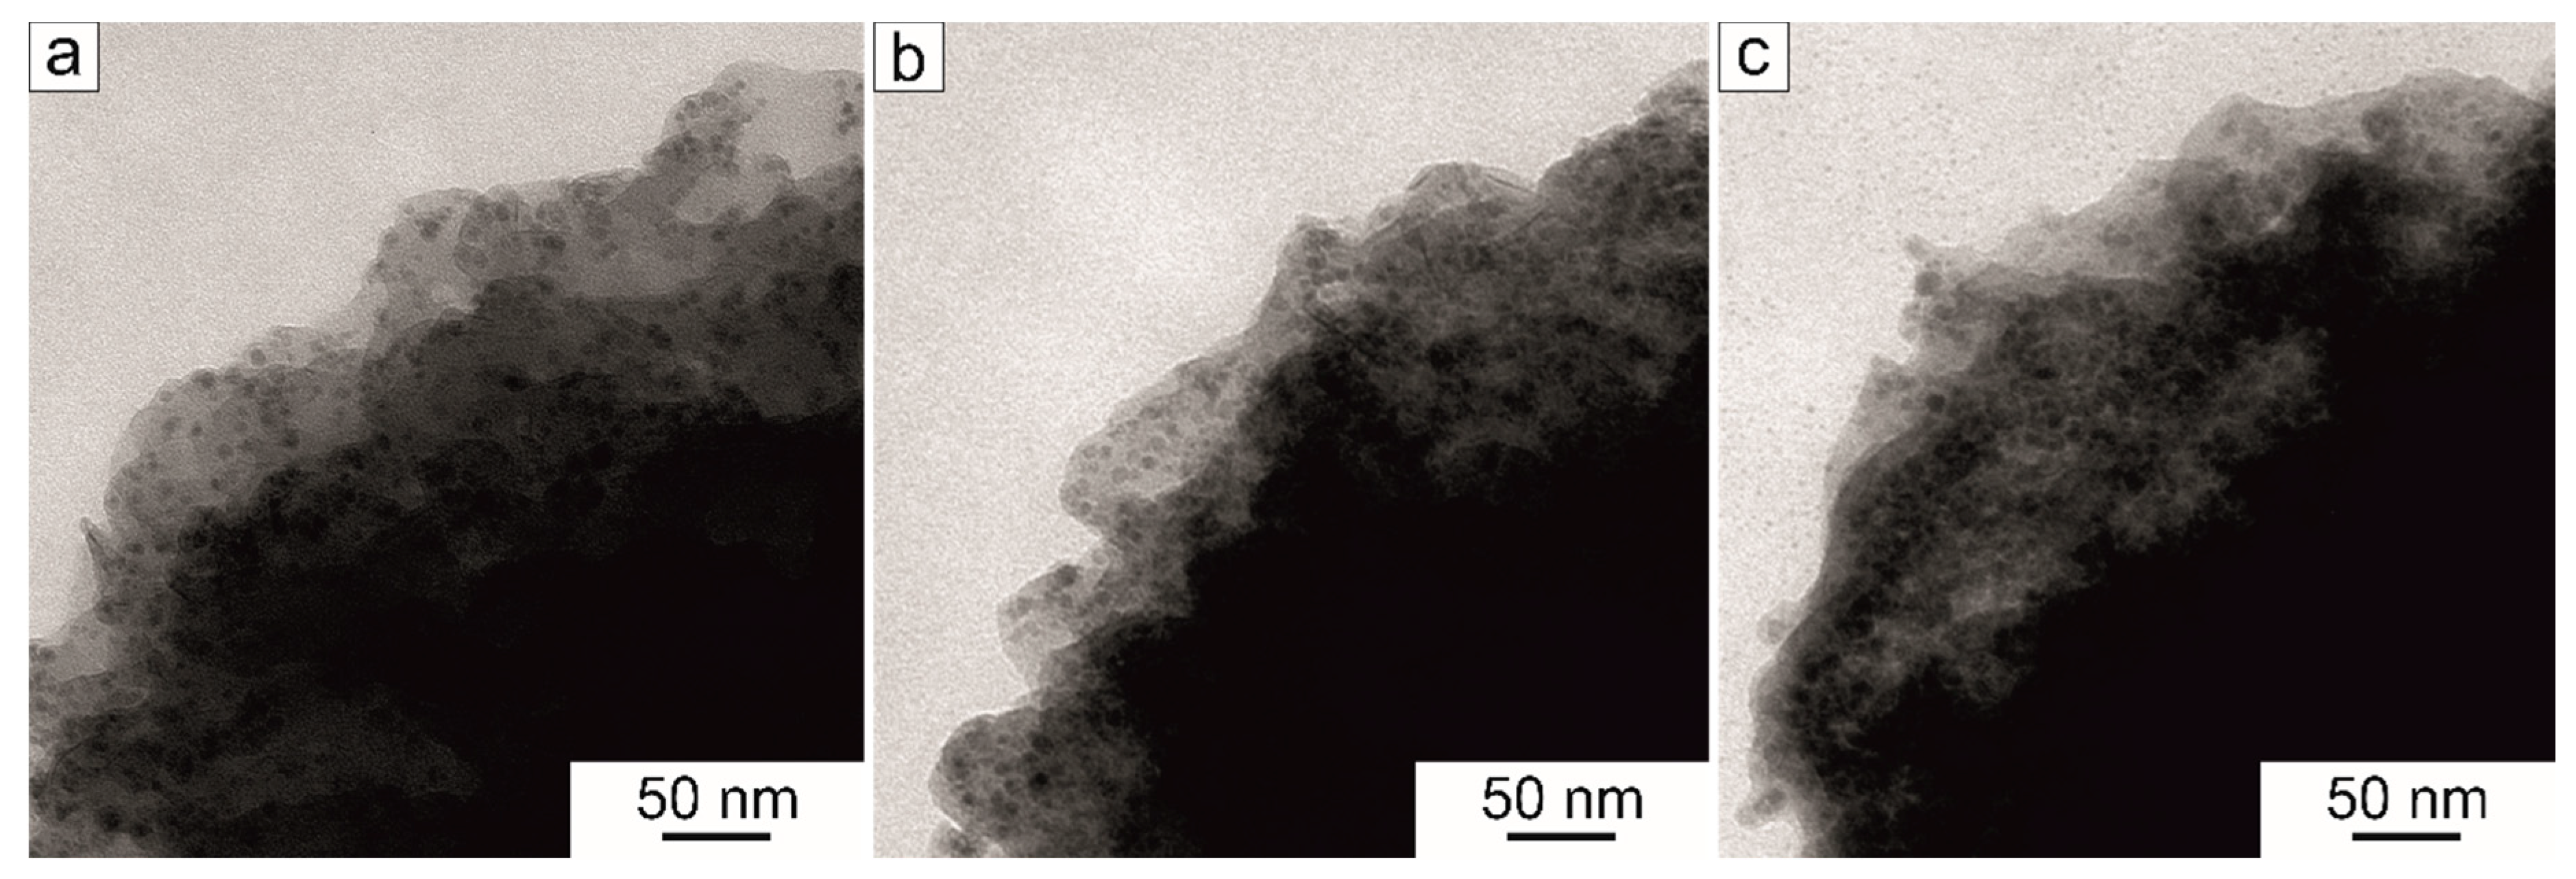
2.2. Magnetic Polymeric Submicron Core–Shells
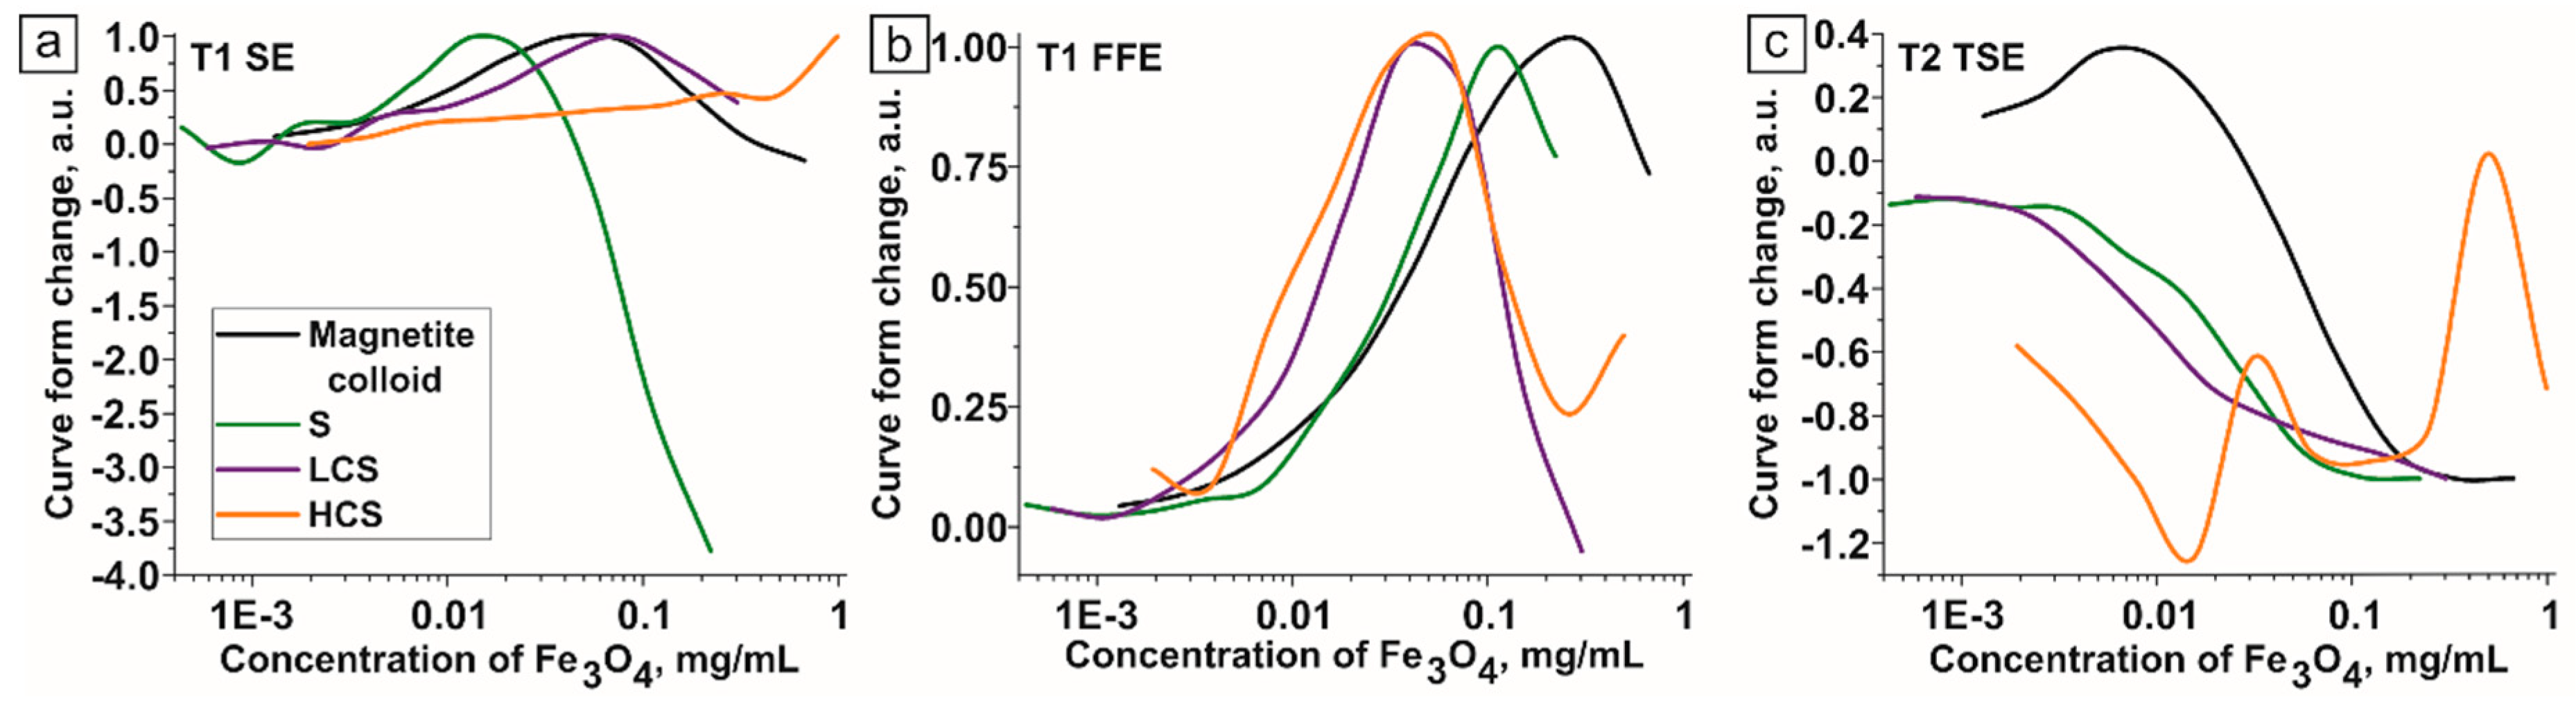
The three different types of magnetic submicron core–shells were formed to study the dependence of the magnetic nanoparticles amount and core–shell structure on their MRI properties. The average size of the submicron core–shells was 576 ± 102 nm. Each type had a shell formed by poly(allylamine hydrochloride) (PAH) and poly(sodium 4-styrenesulfonate) (PSS) by layer-by-layer (LbL) technique [21]. The first type (so-called S, from the shell, Figure 2a,b) contained only one layer of magnetite nanoparticles in the shell. In the previous study [19] we had shown that the variation of the package density of magnetite nanoparticles in the layer of the microcapsule shell changes the resulting MRI contrast. With the less distance between nanoparticles in the layer, the contrast (the ratio of the sample signal to the water signal) and r1 and r2 relaxivities decreased. This can be caused by the increasing role or magnetic interactions between nanoparticles when the distance becomes comparable to their size because of close packing [22]. In the current study, the package density of magnetite that provides the highest MRI contrast was chosen according to previous results [19].
The second type of submicron core–shells (LCS, from low-core plus shell, Figure 2c,d) contained one layer of magnetite in the shell along with Fe3O4 nanoparticles in the inner volume of the core–shell, loaded by the freezing-induced loading (FIL) method [23]. Finally, the third type (HCS, high-core+shell, Figure 2e,f) was the submicron core–shells analogous to LCS, but with four FIL loadings of magnetite. SEM images of obtained core-shells are presented in Figure S1 (Supplementary Materials).
The presence of iron (III) oxide nanoparticles was confirmed by energy-dispersive X-Ray spectroscopy (EDX), showing the two peaks at Kα = 6.3996 keV and Kβ = 7.058 keV Fe characteristic energies for the HCS sample with the highest Fe content (Figure 2i). With the decrease in magnetite concentration in the sample, only one peak remains, as demonstrated for the LCS sample in Figure 2h. However, some sensitivity threshold exists, below which the magnetite content is too low to be determined. This happens for the S sample with iron (III) oxide nanoparticles only in the shell, so we cannot see any specific Fe peaks at the EDX spectrum (Figure 2g). The transmission electron microscopy (TEM) images of individual submicron core-shells are presented in Figure 3.
The amount of magnetite loading for each core–shell suspension was measured by colorimetric titration. First, the core–shells were disrupted by the addition of sulfuric acid. Then, the qualitative reaction of Fe ions with ammonium rhodanide was carried out, and the resulting absorption of the solution was measured by a Synergy H1 multi-plate reader. To calculate the magnetite amount, the level of absorption was compared with that for the standard Fe solution. All of the measurements were made at least three times, and the resulting magnetite concentrations are shown in Table 1. The mass amount of Fe3O4 in one carrier (from 1.78 ± 0.01 pg for the S sample to 7.95 ± 0.13 pg for the HCS sample) was calculated with respect to the average core–shell number in each sample suspension. The dynamics of loading within the sample strongly correlates with the EDX data.
In order to measure the movement rate of the obtained core–shells in an external magnetic field, we used photosedimentometry. The setup of the experiment is shown in Figure 4a. The core–shell suspension was irradiated by 660 nm laser, and the transparency was measured during the time (see graphs in Figure 4b). Dependent on the magnetite content, the speed of the core–shells movement to the magnet changed. So, we calculated the average movement rate according to Equation (1):
v i = S t i   ,
where S is the distance between the cuvette wall and the laser, ti is a time of movement, vi is movement rate, and I the number of a sample. We obtained the movement rates as follows: vs = 54.5 µm/s, vLCS = 10.2 µm/s, and vHCS = 3.2 µm/s. Therefore, the HCS core–shells with the highest amount of magnetite possess a higher magnetic moment compared with other samples, so it can be controlled better and easier navigated as a drug delivery carrier.

2.3. MRI Study

The obtained core–shell suspensions were investigated by MRI. We obtained T1 and T2-weighted images in three different modes: T1 spin-echo (SE), T1 gradient echo (FFE), and T2 turbo spin-echo (TSE). The visualization parameters remained unchanged for all the samples within one visualization mode.

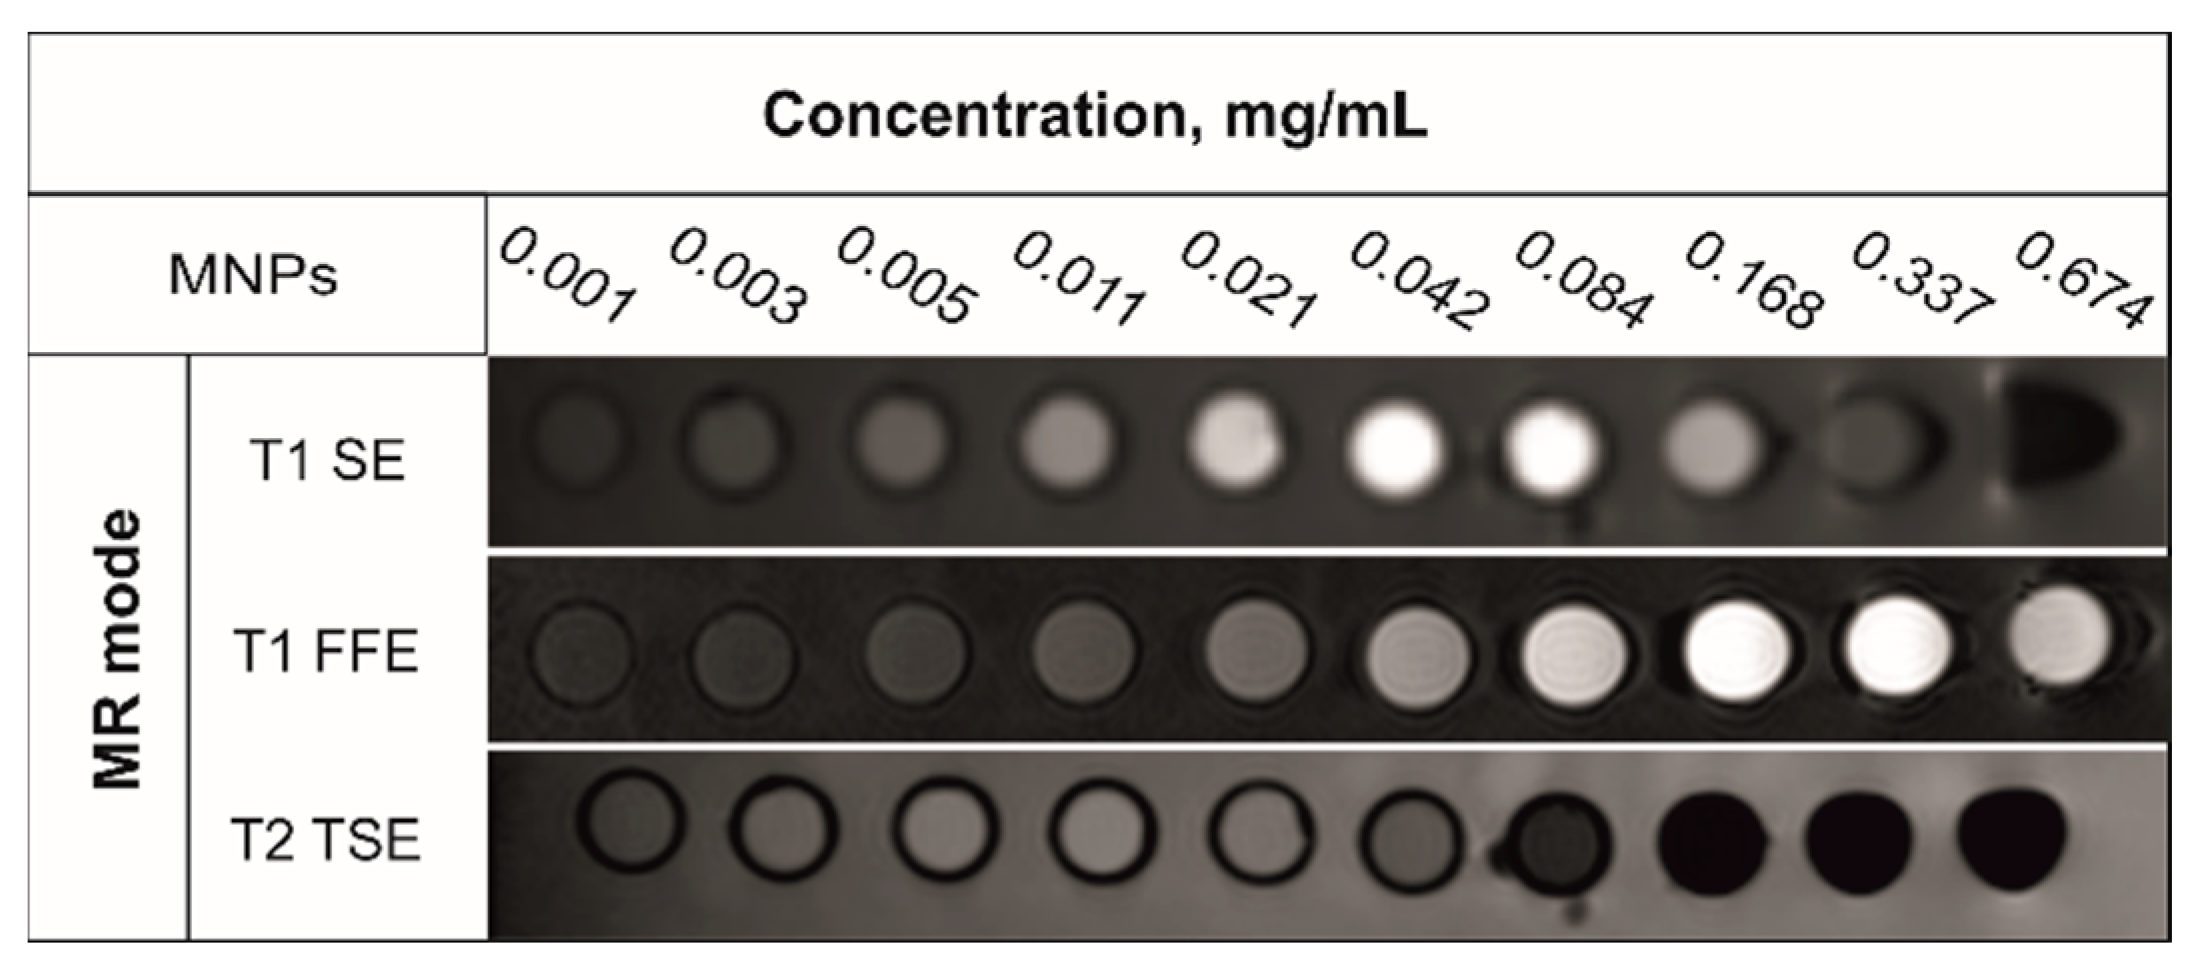
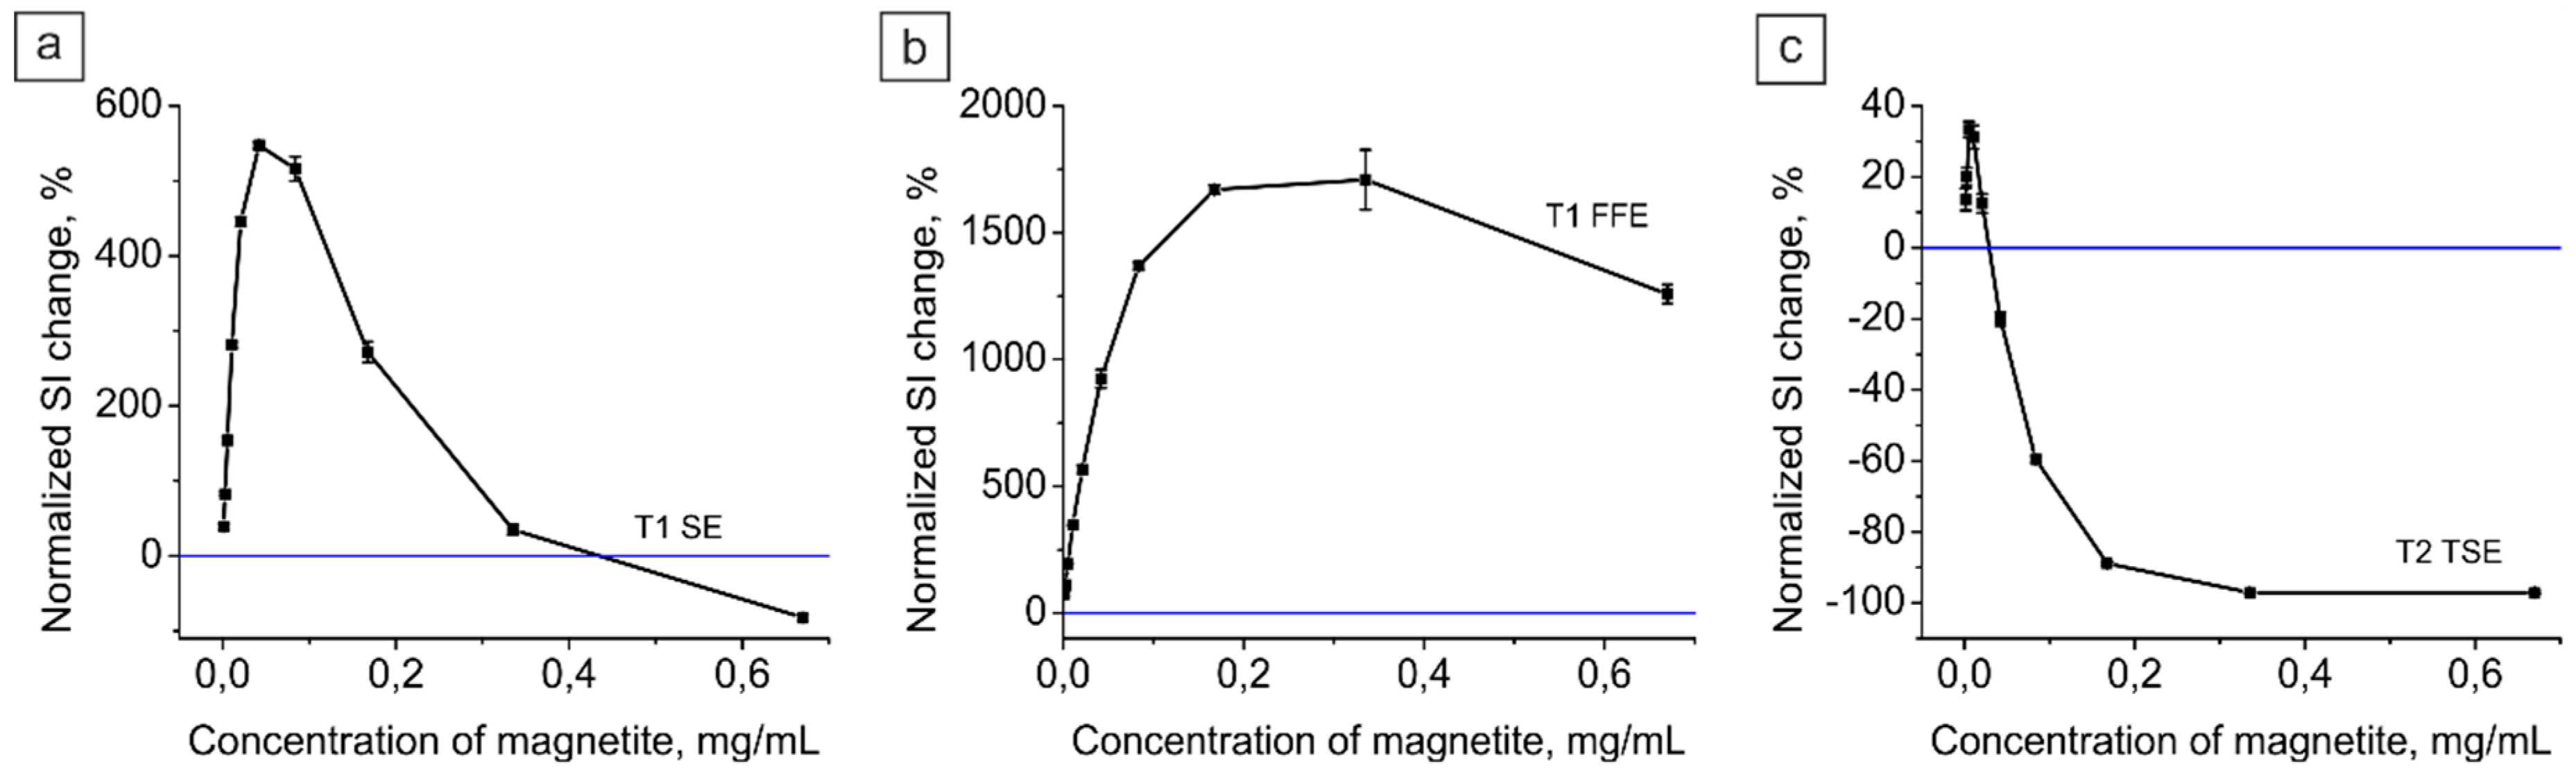
2.3.1. Magnetite Nanoparticle Colloid

The iron oxide nanoparticle colloid possessed a dual T1/T2 MRI contrast (Figure 5). This happened because the average size of magnetite nanoparticles was in the range from 4 to 10 nm that provides both T1 and T2 contrast [16]. T1-weighted images demonstrated a significant increase in the signal in comparison to water (surrounding media in the MRI images), stronger for the gradient than for spin-echo mode. The T2-weighted image had the signal reduction for concentrations less than 0.04 mg/mL, indicating the nanoparticles as a T2 contrast agent as well.

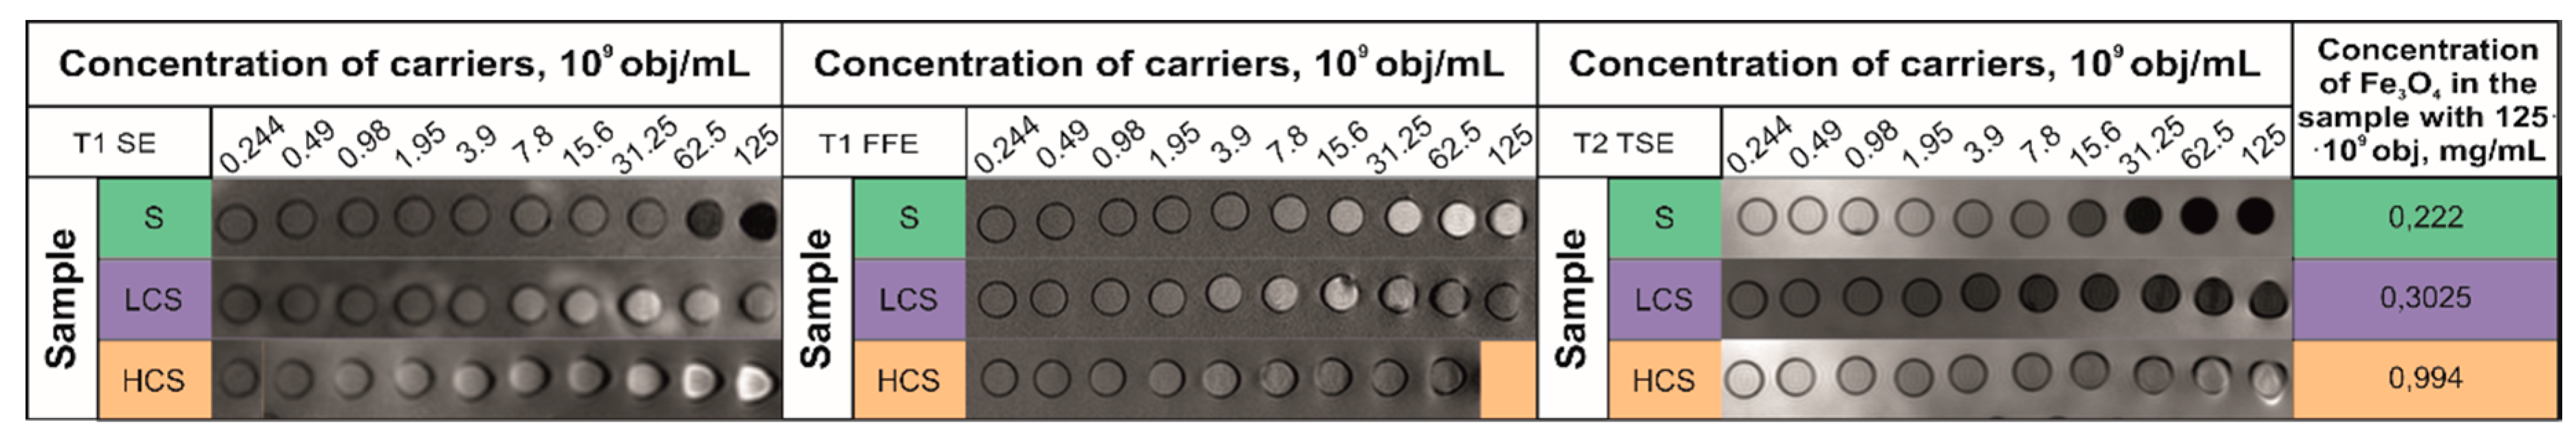
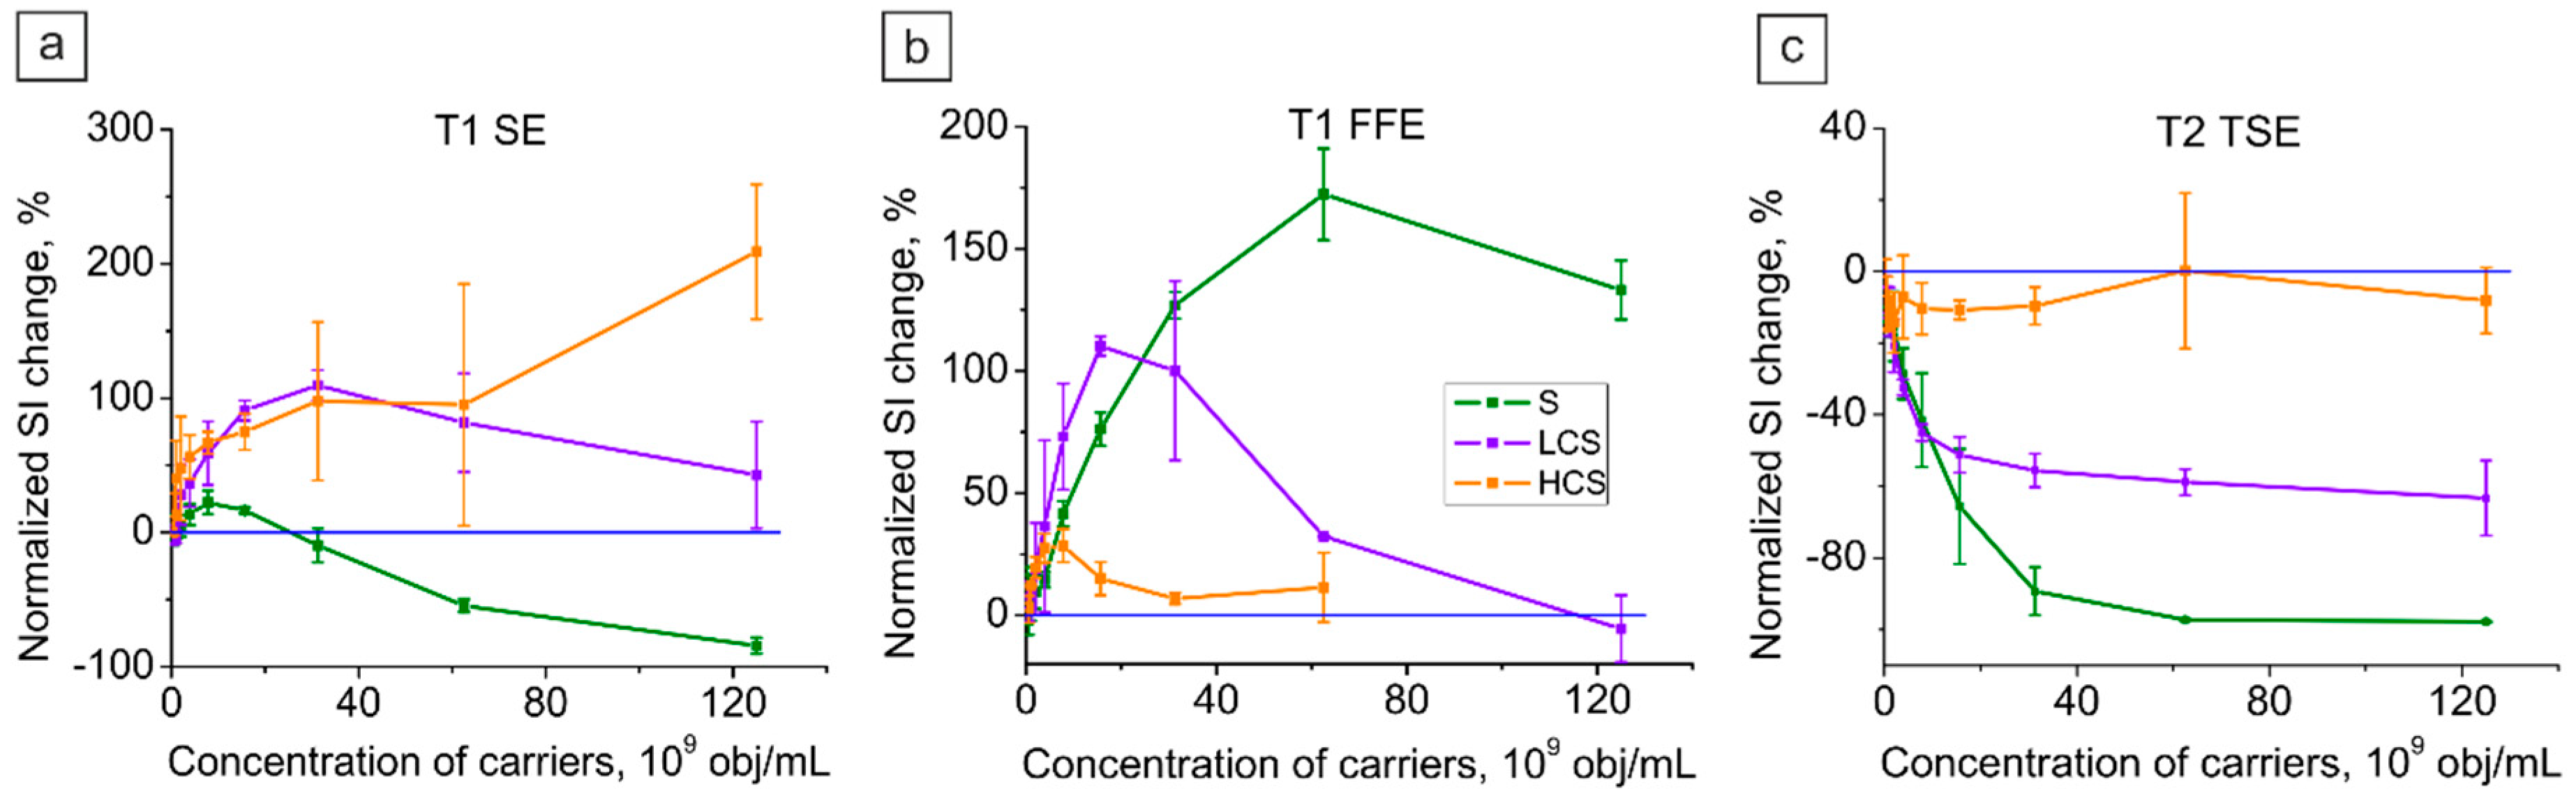
2.3.2. Magnetic Submicron Core–Shells

The core–shell suspensions were diluted to various carrier concentrations in the sample prior to MRI visualization since the concentrations of objects were the same for all samples. Thus, we obtained the magnetic resonance images showing the dependence of the sample contrast on its magnetite content (Figure 6). The sample S with the lowest iron(III) oxide content was shown to provide better MRI contrast in the T1 FFE mode in comparison with LCS and HCS samples. As it can be observed from Figure 3a, the package density of magnetite nanoparticles in the shell of the carrier corresponds to the previously mentioned assumption about the role of magnetic interactions in the resulting MRI contrast.
However, the maximum of T2 contrast can be observed after the addition of magnetite to the core of the carriers for the LCS sample, although the HCS core–shell suspension demonstrates MRI contrast only in T1 SE mode.

3. Discussion

For both T1 and T2 modes we obtained the dependencies of signal intensity, normalized to water, on the magnetite concentration by analyzing the previously shown images (Figure 5 and Figure 6). As for the magnetite colloid, it had a high positive signal intensity (SI) change in both T1 SE and FFE modes. Although the maximum contrast was around 550% for SE sequence (Figure 7a) and up to 1700% for FFE (Figure 7b), the concentration range, in which the contrast can be observed, is almost four times wider for the gradient mode. However, nearly full decay of a signal was obtained for the T2 TSE mode that allows using the magnetite colloid as an effective negative contrast agent at concentrations more than 0.04 mg/mL. The forms of contrast curves are typical for the Fe3O4 colloid [19].
The obtained MRI images for the core–shell suspensions were also analyzed. Figure 8 shows the dependencies of normalized to water SI change on the concentration of carriers. In T2 mode (Figure 8c), the full decay of a signal occurred only for the S sample until 0.05 mg/mL of Fe3O4 concentration, which is similar to the magnetite colloid behavior (Figure 7c). When the amount of nanoparticles increases (LCS and HCS samples), the T2 contrast tends to zero. This can be explained by the intensive magnetic interactions between nanoparticles while the distance between them decreases because of their higher concentration and, thus, the density of packaging [19].
For the gradient sequence in T1 mode, the tendency was generally the same. As it is shown in Figure 8b, the SI change still falls down with more magnetite content in the core–shell. However, the width of the contrast area has the same behavior—the highest for the S sample and the lowest for the HCS one. In the T1 spin-echo mode the tendency was surprisingly opposite. The S sample showed the lowest SI change no more than 30%, but it significantly increased with the loading of magnetite into the core. Moreover, the HCS sample provided 209% SI change on average even at high magnetite concentration that provides its usage as a positive contrast agent at a wide concentration range along with an ability of control and navigation by an external magnetic field.
To understand whether the characteristic form of magnetite colloid contrast curve remains unchanged after its loading into the core–shells, we calculated the curve form change for each sample according to the following Equation (2):
C i = N i N m a x   ,
where Ci is the curve form change and Ni is the normalized SI change for the current sample concentration; Nmax is the maximum normalized SI change for the sample.
The obtained curves are presented in Figure 9. As can be seen from Figure 9a, for the T1 spin-echo mode the more the amount of Fe3O4 presents in the sample, the more the concentration at which the contrast can be observed. The T1 gradient mode (Figure 9b) demonstrates the opposite behavior, and here with the addition of magnetite to the sample the concentration at which the maximum contrast occurs decreases along with the decrease in contrast properties (Figure 8b). However, in T2 mode S and LCS samples, unlike the magnetite colloid, possess only negative contrast even for low concentrations, which makes them effective negative contrast agents. However, there is some threshold concentration that exists, after which the sample loses the characteristic for magnetite contrast curve form. For example, this occurred for HCS suspension in T1 SE and T2 TSE modes.

4. Materials and Methods

4.1. Materials

Iron (III) chloride hexahydrate (99.8%, Sigma-Aldrich, St. Louis, MO, United States), iron (II) chloride tetrahydrate (99.8%, Sigma-Aldrich), sodium hydroxide (99.8%, Fluka, Buchs, Switzerland), citric acid (99.8%, Sigma-Aldrich), sodium carbonate, calcium chloride, poly(allylamine hydrochloride) (PAH, average MW ~70 kDa), poly(sodium 4-styrenesulfonate) (PSS, average MW 70 kDa), ethylene diamine tetraacetic acid disodium salt (Fluka), sodium chloride, glycerin (Reachem, Moscow, Russia) were used without additional purification.

4.2. Magnetite Nanoparticle Synthesis

Magnetic nanoparticles were obtained by chemical precipitation from di- and trivalent salts of iron in the presence of the base [24,25]. Initially, 1.3 g of FeCl3·6H2O and 0.478 g of FeCl2·4H2O were dissolved in water under room temperature with mixing. Then, 170 mL of 0.1 M NaOH was added to the reaction cell. For further colloids stabilization, 25 mL of citric acid (32 mg/mL) solution was prepared. A nitrogen was bubbled across the closed cells with mixtures of iron salts, sodium hydroxide, and citric acid for 10 min to remove oxygen from the solutions. Further, the iron salts solutions were injected into the sodium hydroxide solution after the heating until 40 °C with active mixing, after that the solution was left under active mixing and nitrogen pressure for 40 s resulting in black sediment formation of magnetite nanoparticles. Additionally, 25 mL of citric acid was added to the suspension under constant mixing and nitrogen pressure. Dialysis of magnetic hydrosol was conducted during three days in a 3 L vial under slow mixing. Mixing of reagents and washing steps were carried out under nitrogen.

4.3. Fabrication of Magnetic Polymeric Submicron Core–Shells

The submicron vaterite particles were synthesized in glycerol from CaCl2 and Na2CO3 salt solutions according to the method described in [23]. First, 400 µL of each salt solution were added to 4 g of glycerol at a constant stirring, and the resulted solution was left mixing for 1 h for CaCO3 submicroparticles formation. Then, the suspension was centrifuged, and the submicroparticles pellet was washed three times with deionized water. After that, the FIL stage was performed for the LCS and HCS samples: Prepared magnetite colloid of 2 mL were added to the sample, and it was freezed while constantly stirring [23]. Freezing/thawing cycles were repeated 1 and 4 times for the LCS and HCS samples consequently. Then, the polymeric shells were formed at all three samples by LbL technique [21] from PAH and PSS polyelectrolyte solutions in concentration of 1 mg/mL. One layer of Fe3O4 nanoparticles in concentration of 0.56 mg/mL was adsorbed into the shell. For each shell layer formation, 1 mL of absorbing solution was added to the sample. As a result, the following shells were formed on the template surface: PAH/PSS/PAH/MNPs/PSS/PAH/PSS. The core–shells made in the current paper remained unchanged for at least six months and retained their zeta-potential.

4.4. Colorimetric Titration Measurements

The concentrations of magnetite in all the samples were measured by colorimetric titration, based on the qualitative reation of Fe3+ ions with ammonium thiocyanate. First, the magnetite colloid/core–shell suspension was dissolved in 1M H2SO4 solution. Then, 20 µL of ammonium thiocyanate were added to the sample under analysis, and the absorption level at the 473 nm wavelength was measured. Analogous to it, we measured the absorption of the standard Fe3+ solution in 1 M H2SO4 with the known concentration. The final Fe3+ ion concentration in the aliquot was calculated according to Equation (3):
C F e = C S t · n F e n S t   ,
where CFe is the concentration of Fe3+ ions in the aliquot, CSt is the concentration of Fe3+ ions in the standard solution, nFe and nSt are absorption levels of the aliquot and the standard solution consequently. The final magnetite amount was calculated from the received data.

4.5. TEM, DLS, SEM, and EDX Characterization

The measurements of the size distribution of the nanoparticles were performed using a Zetasizer Nano ZS instrument (Malvern Instruments Ltd, Malvern, UK).
Transmission electron microscopy (TEM) of magnetite nanoparticles was performed using a FEGTEM microscope (JEOL, Akishima, Tokyo, Japan) operating at 200 kV. TEM samples were prepared via a drop-casting technique, where samples were dispersed and deposited onto copper grid mounted “lacey” carbon films (Agar). All images were processed using the Gatan Digital Micrograph software.
TEM of submicron core–shells’ structure was performed using a Libra 120 Carl Zeiss microscope (Carl Zeiss SMT AG Company, Oberkochen, Germany) operating at 120 kV. The measurement was made on the basis of the Center of collective usage of scientific equipment in physico-chemical biology and nanobiotechnology “Simbioz”, Institute of Biochemistry and Physiology of Plants and Microorganisms Russian Academy of Sciences (IBPPM RAS).
Submicron core–shell morphology and chemical composition were investigated using a scanning electron microscope (SEM) MIRA II LMU (Tescan Orsay Holding, Brno, Czech Republic), equipped with INCA Energy energy-dispersive spectroscopy system. The SEM imaging was performed at the operating voltage of 30 kV under standard secondary and back-scattered electron modes. For the study of chemical composition, the energy-dispersive X-ray spectroscopy (EDX) was used.

4.6. Dynamics of Submicron Core–Shell Sedimentation

Submicron core–shell sedimentation rates in an external magnetic field were measured by the photosedimentometry. The suspension of core–shells in water was placed in the transparent cuvette (Figure 4a, number 4), through which the laser beam (Figure 4a, number 3) was going. We used a 660 nm semiconductor laser for the sample excitation. The permanent magnet (Figure 4a, number 1) was applied to the cuvette’s wall, so the magnetic field was directed perpendicularly to the laser path. After that the laser goes through the analyzing suspension and the incident beam reaches the phototransistor (Figure 4a, number 2). Using the described system, the time dependencies of the core–shell suspension transparency in an external magnetic field were obtained. The core–shell movement rates were then calculated.

4.7. MRI Study

In vitro MRI study was carried out using a Philips Achieva 1.5 T high field MRI scanner (Philips Healthcare, Best, The Netherlands) equipped with a phased array coil. For obtaining T1- and T2-weighted images spin-echo sequences (SE) and gradient-echo sequences (FFE) were applied. The following parameters were used for conducting measurements: The repetition time (TR) was 450 ms and the echo time (TE) was 15 ms for the T1-weighted pulse SE sequence; the TR was 61 ms and the TE was 2.484 ms for the T1-weighted pulse FFE sequence; the TR was 3000 ms and the TE was 47.7 ms for the T2-weighted pulse sequence. In order to increase MR signal in the T1-weighted image the TR should be decreased, so tissues do not manage to relax after an external influence, and the TE should be decreased too, because the sample highly changes the T2 relaxation and it can influence on the resulting MR signal in a T1-weighted image. At the same time, the T2-weighted image requires to have both long TR and TE [26].

5. Conclusions

In the current study, we demonstrated the fabrication of magnetic composite submicron carriers with an ability to control the magnetic resonance contrast properties by changing their structure. We found that the highest T2 and T1 gradient contrast can be observed from the core–shell suspension with magnetite nanoparticles contained only in the shell. The contrast properties in these two modes become worse with the addition of magnetite nanoparticles by freezing-induced loading and, thus, increasing their packaging density and interactions between them. Nevertheless, the HCS core–shell suspension with 4 FIL loading of magnetite surprisingly possessed the 209% normalized SI change even for the high magnetite concentration in T1 SE mode. Thus, one can combine a high T1 contrast, not characteristic for the magnetic capsules, and their control by a magnetic field. However, if choosing the appropriate structure, it can be possible to observe both T1 and T2 contrasts from the carrier for remote drug delivery and controlled release, all with the verification by MRI visualization, to which our further studies will be devoted.

Supplementary Materials

The following are available online at https://0-www-mdpi-com.brum.beds.ac.uk/2304-6740/8/2/11/s1, Figure S1: SEM images of (a) S, (b) LCS, and (c) HCS submicron core–shells.

Author Contributions

Conceptualization and investigation, A.A.K., S.V.G., Y.I.S., D.A.G., and D.N.B.; MRI visualization, V.V.Z.; TEM measurements, M.A.A.; SEM measurements and EDX analysis, V.S.A.; Writing—original draft preparation, A.A.K.; Writing—review and editing, Y.I.S., S.V.G., D.A.G., V.S.A., and D.N.B.; Supervision, D.A.G. and D.N.B.; Funding acquisition, D.A.G., D.N.B. and Y.I.S. All authors have read and agreed to the published version of the manuscript.

Funding

This research was supported by the Russian Science Foundation (grant number 18-19-00354), Russian Ministry of Education and Science (project No 16.8144.2017/9.10), by the Russian Foundation for Basic Research (RFBR grant 18-29-08046).

Acknowledgments

The experimental part of this work related to the preparation of remote-controlled magnetic core–shells was supported by the Russian Science Foundation (grant number 18-19-00354). The transmission electron microscopy and magnetic resonance imaging were supported by the Russian Foundation for Basic Research (RFBR grant 18-29-08046). The scanning electron microscopy measurements and photosedimentonetry were supported by the Russian Ministry of Education and Science (project No 16.8144.2017/9.10). The authors would like to thank the Center of collective usage of scientific equipment in physico-chemical biology and nanobiotechnology “Simbioz”, Institute of Biochemistry and Physiology of Plants and Microorganisms Russian Academy of Sciences (IBPPM RAS) for their kind help in the transmission electron microscopy measurements.

Conflicts of Interest

The authors declare no conflict of interest.

References

  1. Roberts, D.R.; Holden, K.R. Progressive increase of T1 signal intensity in the dentate nucleus and globus pallidus on unenhanced T1-weighted MR images in the pediatric brain exposed to multiple doses of gadolinium contrast. Brain Dev. 2016, 38, 331–336. [Google Scholar] [CrossRef] [PubMed]
  2. Pullicino, R.; Radon, M.; Biswas, S.; Bhojak, M.; Das, K. A Review of the Current Evidence on Gadolinium Deposition in the Brain. Clin. Neuroradiol. 2018, 28, 159–169. [Google Scholar] [CrossRef] [PubMed]
  3. White, G.W.; Gibby, W.A.; Tweedle, M.F. Comparison of Gd(DTPA-BMA) (Omniscan) Versus Gd(HP-DO3A) (ProHance) Relative to Gadolinium Retention in Human Bone Tissue by Inductively Coupled Plasma Mass Spectroscopy. Invest. Radiol. 2006, 41, 272–278. [Google Scholar] [CrossRef] [PubMed] [Green Version]
  4. Layne, K.A.; Dargan, P.I.; Archer, J.R.H.; Wood, D.M. Gadolinium deposition and the potential for toxicological sequelae – A literature review of issues surrounding gadolinium-based contrast agents. Br. J. Clin. Pharmacol. 2018, 84, 2522–2534. [Google Scholar] [CrossRef]
  5. Vergauwen, E.; Vanbinst, A.-M.; Brussaard, C.; Janssens, P.; De Clerck, D.; Van Lint, M.; Houtman, A.C.; Michel, O.; Keymolen, K.; Lefevere, B.; et al. Central nervous system gadolinium accumulation in patients undergoing periodical contrast MRI screening for hereditary tumor syndromes. Hered. Cancer Clin. Pract. 2018, 16, 2. [Google Scholar] [CrossRef] [Green Version]
  6. Oksendal, A.N.; Hals, P.-A. Biodistribution and toxicity of MR imaging contrast media. J. Magn. Reson. Imaging 1993, 3, 157–165. [Google Scholar] [CrossRef]
  7. Bao, Y.; Sherwood, J.A.; Sun, Z. Magnetic iron oxide nanoparticles as T 1 contrast agents for magnetic resonance imaging. J. Mater. Chem. C 2018, 6, 1280–1290. [Google Scholar] [CrossRef]
  8. Di Gregorio, E.; Furlan, C.; Atlante, S.; Stefania, R.; Gianolio, E.; Aime, S. Gadolinium Retention in Erythrocytes and Leukocytes From Human and Murine Blood Upon Treatment With Gadolinium-Based Contrast Agents for Magnetic Resonance Imaging. Invest. Radiol. 2020, 55, 30–37. [Google Scholar] [CrossRef]
  9. Zhang, M.; Liu, X.; Huang, J.; Wang, L.; Shen, H.; Luo, Y.; Li, Z.; Zhang, H.; Deng, Z.; Zhang, Z. Ultrasmall graphene oxide based T1 MRI contrast agent for in vitro and in vivo labeling of human mesenchymal stem cells. Nanomedicine Nanotechnology, Biol. Med. 2018, 14, 2475–2483. [Google Scholar] [CrossRef] [PubMed]
  10. Stark, D.D.; Weissleder, R.; Elizondo, G.; Hahn, P.F.; Saini, S.; Todd, L.E.; Wittenberg, J.; Ferrucci, J.T. Superparamagnetic iron oxide: Clinical application as a contrast agent for MR imaging of the liver. Radiology 1988, 168, 297–301. [Google Scholar] [CrossRef] [PubMed]
  11. Kim, B.H.; Lee, N.; Kim, H.; An, K.; Park, Y.I.; Choi, Y.; Shin, K.; Lee, Y.; Kwon, S.G.; Na, H.B.; et al. Large-Scale Synthesis of Uniform and Extremely Small-Sized Iron Oxide Nanoparticles for High-Resolution T 1 Magnetic Resonance Imaging Contrast Agents. J. Am. Chem. Soc. 2011, 133, 12624–12631. [Google Scholar] [CrossRef] [PubMed]
  12. Starsich, F.H.L.; Eberhardt, C.; Keevend, K.; Boss, A.; Hirt, A.M.; Herrmann, I.K.; Pratsinis, S.E. Reduced Magnetic Coupling in Ultrasmall Iron Oxide T 1 MRI Contrast Agents. ACS Appl. Bio Mater. 2018, 1, 783–791. [Google Scholar] [CrossRef]
  13. Shin, T.-H.; Choi, J.; Yun, S.; Kim, I.-S.; Song, H.-T.; Kim, Y.; Park, K.I.; Cheon, J. T 1 and T 2 Dual-Mode MRI Contrast Agent for Enhancing Accuracy by Engineered Nanomaterials. ACS Nano 2014, 8, 3393–3401. [Google Scholar] [CrossRef] [PubMed]
  14. Peng, Y.-K.; Lui, C.N.P.; Chen, Y.-W.; Chou, S.-W.; Raine, E.; Chou, P.-T.; Yung, K.K.L.; Tsang, S.C.E. Engineering of Single Magnetic Particle Carrier for Living Brain Cell Imaging: A Tunable T 1 -/T 2 -/Dual-Modal Contrast Agent for Magnetic Resonance Imaging Application. Chem. Mater. 2017, 29, 4411–4417. [Google Scholar] [CrossRef]
  15. Szpak, A.; Fiejdasz, S.; Prendota, W.; Strączek, T.; Kapusta, C.; Szmyd, J.; Nowakowska, M.; Zapotoczny, S. T1–T2 Dual-modal MRI contrast agents based on superparamagnetic iron oxide nanoparticles with surface attached gadolinium complexes. J. Nanoparticle Res. 2014, 16, 2678. [Google Scholar] [CrossRef] [Green Version]
  16. Shen, Z.; Wu, A.; Chen, X. Iron Oxide Nanoparticle Based Contrast Agents for Magnetic Resonance Imaging. Mol. Pharm. 2017, 14, 1352–1364. [Google Scholar] [CrossRef]
  17. Sharma, V.K.; Alipour, A.; Soran-Erdem, Z.; Aykut, Z.G.; Demir, H.V. Highly monodisperse low-magnetization magnetite nanocubes as simultaneous T 1 – T 2 MRI contrast agents. Nanoscale 2015, 7, 10519–10526. [Google Scholar] [CrossRef] [Green Version]
  18. Li, Z.; Yi, P.W.; Sun, Q.; Lei, H.; Li Zhao, H.; Zhu, Z.H.; Smith, S.C.; Lan, M.B.; Lu, G.Q.M. Ultrasmall Water-Soluble and Biocompatible Magnetic Iron Oxide Nanoparticles as Positive and Negative Dual Contrast Agents. Adv. Funct. Mater. 2012, 22, 2387–2393. [Google Scholar] [CrossRef]
  19. German, S.V.; Bratashov, D.N.; Navolokin, N.A.; Kozlova, A.A.; Lomova, M.V.; Novoselova, M.V.; Burilova, E.A.; Zyev, V.V.; Khlebtsov, B.N.; Bucharskaya, A.B.; et al. In vitro and in vivo MRI visualization of nanocomposite biodegradable microcapsules with tunable contrast. Phys. Chem. Chem. Phys. 2016, 18, 32238–32246. [Google Scholar] [CrossRef]
  20. Zeng, J.; Jing, L.; Hou, Y.; Jiao, M.; Qiao, R.; Jia, Q.; Liu, C.; Fang, F.; Lei, H.; Gao, M. Anchoring Group Effects of Surface Ligands on Magnetic Properties of Fe 3 O 4 Nanoparticles: Towards High Performance MRI Contrast Agents. Adv. Mater. 2014, 26, 2694–2698. [Google Scholar] [CrossRef]
  21. Sukhorukov, G.B.; Donath, E.; Davis, S.; Lichtenfeld, H.; Caruso, F.; Popov, V.I.; Möhwald, H. Stepwise polyelectrolyte assembly on particle surfaces: A novel approach to colloid design. Polym. Adv. Technol. 1998, 9, 759–767. [Google Scholar] [CrossRef]
  22. Romodina, M.N.; Khokhlova, M.D.; Lyubin, E.V.; Fedyanin, A.A. Direct measurements of magnetic interaction-induced cross-correlations of two microparticles in Brownian motion. Sci. Rep. 2015, 5, 10491. [Google Scholar] [CrossRef] [PubMed] [Green Version]
  23. German, S.V.; Novoselova, M.V.; Bratashov, D.N.; Demina, P.A.; Atkin, V.S.; Voronin, D.V.; Khlebtsov, B.N.; Parakhonskiy, B.V.; Sukhorukov, G.B.; Gorin, D.A. High-efficiency freezing-induced loading of inorganic nanoparticles and proteins into micron- and submicron-sized porous particles. Sci. Rep. 2018, 8, 17763. [Google Scholar] [CrossRef] [Green Version]
  24. Massart, R. Preparation of aqueous magnetic liquids in alkaline and acidic media. IEEE Trans. Magn. 1981, 17, 1247–1248. [Google Scholar] [CrossRef]
  25. German, S.V.; Inozemtseva, O.A.; Markin, A.V.; Metvalli, K.; Khomutov, G.B.; Gorin, D.A. Synthesis of magnetite hydrosols in inert atmosphere. Colloid J. 2013, 75, 483–486. [Google Scholar] [CrossRef]
  26. Westbrook, C.; Kaut, C. MRI in Practice, 4th ed.; Wiley-Blackwell: Oxford, UK, 1998; Volume 37, ISBN1 0632042052. ISBN2 9780632042050. [Google Scholar]
Figure 1. Characterization of synthesized magnetite nanoparticles: (a) TEM image and (b) size distribution, measured by dynamic light scattering.
Inorganics 08 00011 g001
Figure 2. Scheme of (a) S, (c) LCS, and (e) HCS submicron core–shells; SEM images of (b) S, (d) LCS, and (f) HCS and EDX analysis of (g) S, (h) LCS, and (i) HCS samples. Scale bar: 500 nm.
Inorganics 08 00011 g002
Figure 3. TEM images of (a) S, (b) LCS, and (c) HCS submicron core–shell.
Inorganics 08 00011 g003
Figure 4. Photosedimentometry of submicron core–shells in water during the time: (a) The experimental setup, where 1—permanent magnet, 2—phototransistor, 3—laser beam, 4—cuvette with core–shell suspension, 5—semiconductor laser; (b) time dependence of the core–shell suspension transparency in an external magnetic field.
Inorganics 08 00011 g004
Figure 5. MRI images of magnetite nanoparticle colloid.
Inorganics 08 00011 g005
Figure 6. MRI images of magnetic submicron core–shells.
Inorganics 08 00011 g006
Figure 7. MRI contrast dependence on magnetite colloid concentration: (a) T1 spin-echo and (b) T1 gradient echo; (c) T2 turbo spin-echo. The blue line on each graph–water contrast level.
Inorganics 08 00011 g007
Figure 8. MRI contrast dependence on Fe concentration in submicron core–shells suspension for (a) T1 spin-echo, (b) T1 gradient-echo, and (c) T2 turbo spin-echo: green curve—S sample; purple curve—LCS, and orange curve—HCS submicron core–shells. The blue line on each graph–water contrast level.
Inorganics 08 00011 g008
Figure 9. Curve form changes for magnetite colloid and core–shell suspensions in (a) T1 SE, (b) T1 FFE, and (c) T2 TSE modes.
Inorganics 08 00011 g009
Table 1. Amount of magnetite nanoparticles loading into submicron core–shells data.
Type of SampleCore–Shell’s StructureAmount of Fe3O4 Loaded, mgThe Mass Amount of Magnetite per Carrier, pg
SPAH/PSS/PSH/MNPs/PAH/PSS0.445 ± 0.0031.78 ± 0.01
LCSMNPslow@PAH/PSS/PSH/MNPs/PAH/PSS0.605 ± 0.0032.42 ± 0.01
HCSMNPshigh@PAH/PSS/PSH/MNPs/PAH/PSS1.987 ± 0.0337.95 ± 0.13

