Susceptibility of the Formate Hydrogenlyase Reaction to the Protonophore CCCP Depends on the Total Hydrogenase Composition


Institute for Biology/Microbiology, Martin-Luther-University Halle-Wittenberg, 06108 Halle, Germany
*
Author to whom correspondence should be addressed.
Inorganics 2020, 8(6), 38; https://0-doi-org.brum.beds.ac.uk/10.3390/inorganics8060038
Submission received: 23 April 2020
/
Revised: 26 May 2020
/
Accepted: 27 May 2020
/
Published: 28 May 2020
(This article belongs to the Special Issue Transition Metals in Catalysis: The Functional Relationship of Fe–S Clusters and Molybdenum or Tungsten Cofactor-Containing Enzyme Systems)
Abstract
:Fermentative hydrogen production by enterobacteria derives from the activity of the formate hydrogenlyase (FHL) complex, which couples formate oxidation to H2 production. The molybdenum-containing formate dehydrogenase and type-4 [NiFe]-hydrogenase together with three iron-sulfur proteins form the soluble domain, which is attached to the membrane by two integral membrane subunits. The FHL complex is phylogenetically related to respiratory complex I, and it is suspected that it has a role in energy conservation similar to the proton-pumping activity of complex I. We monitored the H2-producing activity of FHL in the presence of different concentrations of the protonophore CCCP. We found an inhibition with an apparent EC50 of 31 µM CCCP in the presence of glucose, a higher tolerance towards CCCP when only the oxidizing hydrogenase Hyd-1 was present, but a higher sensitivity when only Hyd-2 was present. The presence of 200 mM monovalent cations reduced the FHL activity by more than 20%. The Na+/H+ antiporter inhibitor 5-(N-ethyl-N-isopropyl)-amiloride (EIPA) combined with CCCP completely inhibited H2 production. These results indicate a coupling not only between Na+ transport activity and H2 production activity, but also between the FHL reaction, proton import and cation export.
1. Introduction
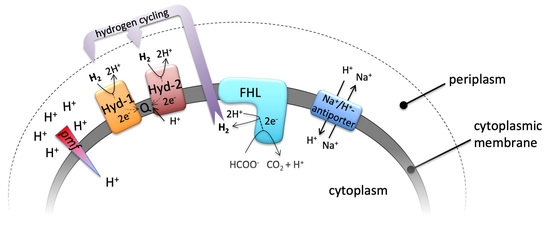
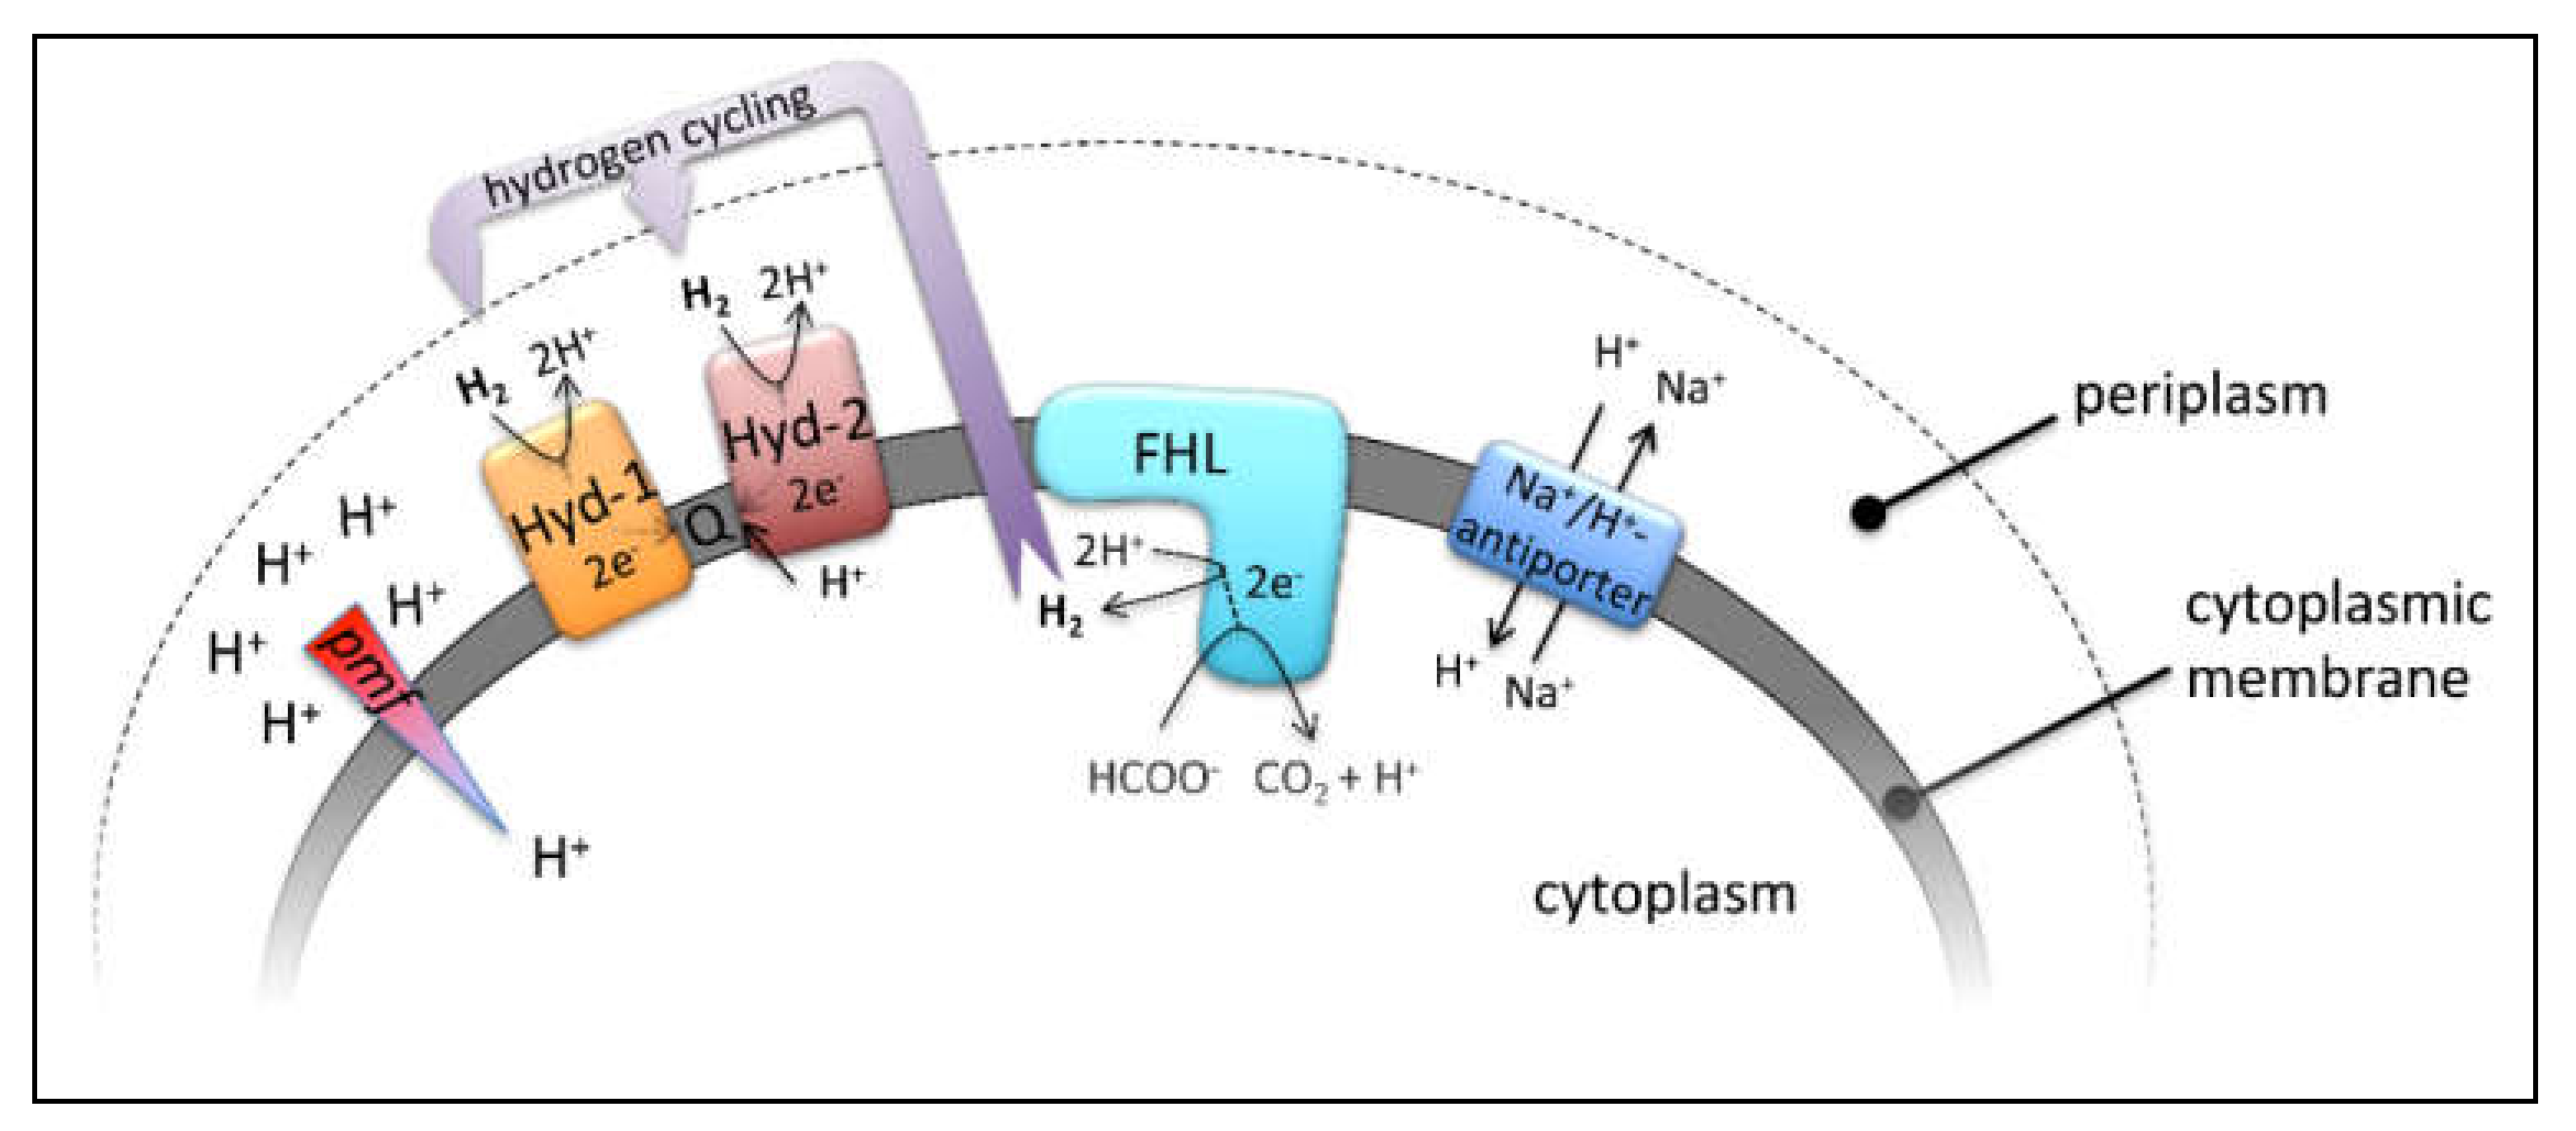
Anaerobic or fermentative growth in the absence of oxygen requires that conservation of energy is at its utmost efficiency. The reaction of the formate hydrogenlyase (FHL) complex contributes indirectly to the generation of a proton gradient at the cytoplasmic membrane by consumption of protons (H+) from the cytoplasm, diffusion of H2-gas across the membrane and subsequent oxidation by the two periplasmic H2-oxidizing hydrogenases (Hyd-1 and Hyd-2) [1] (Figure 1). Hyd-1 forms a redox loop, and Hyd-2 contributes directly to proton transfer from the cytoplasm to the quinone during oxidation of H2 [1,2]. The hyaB and hybC genes encode the catalytic subunits of Hyd-1 and Hyd-2, respectively [3]. This kind of intracellular syntrophy was initially described for Desulfovibrio species [4] and more recently for Acetobacterium woodii [5]. The FHL complex of Escherichia coli is active during mixed acid fermentation to disproportionate formate, which, when accumulated intracellularly, has cytotoxic effects [6]. The two active sites of the FHL complex comprise the [NiFe]-hydrogenase 3 (HycE protein) and the molybdenum- and selenium-containing formate dehydrogenase H (FdhH protein), which function together with three electron-transferring iron-sulfur carrying subunits located in the cytoplasm. Membrane attachment to the membrane-integral HycC and HycD subunits is required for coupling of these half-reactions [7,8]. Our previous studies have shown that the FHL complex can work in reverse in resting cells, a reaction of great biotechnological interest for H2 and CO2 storage as formate [8,9]. A second FHL complex with a predicted five instead of two membrane subunits is encoded in the hyf-operon on the E. coli chromosome, but, presumably due to its low level of gene expression, the activity of this enzyme complex is not detectable under our growth conditions [10,11].
When the phylogenetic relationship between the FHL complex and complex I was discovered, energy conservation by proton-pumping of the complex was also assumed [12,13]. The hydrogenase 3 (HycE protein) belongs to the class 4 hydrogenases and is similar to the Ech (Energy-converting hydrogenase) hydrogenases, which were shown to generate proton gradients during catalysis [14]. However, while studying FHL bidirectionality as the basis for analyzing the influence of ionophores, we unexpectedly found that the protonophore carbonyl cyanide m-chlorophenyl-hydrazone (CCCP) showed only a 40% inhibition of the H2 production activity and a 30% increase of the reverse formate production reaction from H2 and CO2 [8].
It was speculated that due to the small difference in standard redox potentials of formate (E0′ = −432 mV, pH 7.0) and H2 (E0′ = −414 mV, pH 7.0), redox energy for proton translocation becomes available only when the physiological conditions shift to a more acidic pH [15]. However, the reversibility of an artificially coupled hydrogenase and formate dehydrogenase reaction from Desulfovibrio via an electrode was able to mimic the FHL reaction in both directions in vitro without dependence of the reaction on energy provision [16]. Instead, a controversially discussed model of a multienzyme transport supercomplex comprising F1F0-ATPase, the K+-transporting TrkA symporter and the FHL(-2) complex was suggested for energetic coupling [17,18]; however, its existence still requires verification (reviewed in [19]). Therefore, both the necessity for and the role of the FHL complex’s membrane attachment in energy conservation remains to be resolved.
In the present work we have systematically re-examined the CCCP effect on FHL activity, whereby we combined different CCCP concentrations with use of different carbon sources to initiate FHL activity in strains either bearing or lacking the H2-oxidising Hyds. We found that ultimately all strains could be inhibited by CCCP, but strains lacking Hyd-1 required lower, and those lacking Hyd-2 required higher, concentrations of CCCP for inhibition. Based on the relationship of the membrane subunit HycC to Na+/H+ (MRP)-type antiporters, we further addressed the question of whether the FHL reaction is driven by or is contributing to the pmf and if it might be linked to the sodium motive force. We present strong evidence for a dependence of the FHL reaction on proton influx and sodium export.
2. Results and Discussion
2.1. CCCP Inhibits H2 Production to Different Degrees Depending on the Hydrogenase Composition
Cell suspensions initiate H2 production after the anaerobic addition of either formate or glucose, the latter requires metabolizing by the cells to formate prior to H2 production. Consequently, the mixed-acid fermentation yields 2 mol formate per mol glucose (reviewed in [3]). Formate is the direct substrate for the FHL complex, but its import via the formate channel FocA could mask the effects seen. FocA behaves as a pH-dependent channel in vitro, while its activity is mostly determined by its interaction with the pyruvate formate lyase protein PflB in vivo [20]. It is feasible that formate export across the membrane contributes to pmf generation by proton symport, but the import mechanism is unresolved, except that it only occurs when formate-consuming reactions in the cytoplasm can take place [21]. Therefore, the apparent 1.3 mol H+ that are translocated across the membrane per mole of formate oxidized during the FHL reaction could be indirect [22]. On the other hand, the transport of glucose across the membrane is PTS (phosphotransferase system)-dependent, where phosphoenolpyruvate provides the phosphoryl group for the incoming glucose in a pmf-independent manner [23]. Our parallel experimental design circumvents the fact that indirect effects through the transport of the carbon source into the cells are observed.
The parental strain MC4100, the isogenic hyaB deletion strain CP630, which lacks Hyd-1 activity, the isogenic hybC deletion strain CP631, which lacks Hyd-2 activity, or the hyaB hybC double deletion strain CP734 were grown under the optimal conditions for FHL activity. Subsequently, cells were harvested and suspensions used on a modified Clark-type electrode to monitor H2 production. The strains showed initial activities very similar to each other in the presence of the same carbon source, but generally higher activity was observed in the presence of formate than glucose (Table 1). A strain lacking the genes for the FHL complex (HDK103) did not produce H2 under these conditions, supporting the observation that the second FHL is inactive under the conditions tested here [10].
When CCCP concentrations of 100 µM were employed, the effect this had on the H2 production was strain dependent. A previous study from our lab had shown that 100 µM CCCP caused a slight inhibition of the H2 production rate in a strain with a similar Hyd composition to CP734 [8]. If indeed proton translocation is directly performed by the FHL complex, then CCCP would be expected to cause an increase of the activity, not a decrease. Nevertheless, 100 µM CCCP caused complete inhibition of H2 production by the parental strain MC4100 independent of the employed carbon source. The slope of the H2 production even inverted (i.e., H2 oxidation) after CCCP addition (Figure 2), which indicates consumption of the produced H2 within the electrode system and indicates the activity of H2-oxidation reactions, which are usually not performed by the FHL complex, but by the H2-oxidizing Hyd-1 and Hyd-2 enzymes, indicating they are responsible for the difference.
In the next step, strains lacking the genes encoding the large subunit of either Hyd-1 (ΔhyaB, strain CP630) or Hyd-2 (ΔhybC, strain CP631) were used in the same experimental setup. While the Hyd-2-deficient strain CP631 (purple curves) mimics the H2 production curves of the double deletion strain CP734 (ΔhyaB ΔhybC) after CCCP addition, the Hyd-1 deficient strain CP630 (blue curves) looks very similar to the parental curves and negative slopes after CCCP addition is observed. It can be further observed that the effect of CCCP addition is not immediate, but H2 production rates shift rather gradually. For the direct dependence of an activity on pmf, we have previously observed immediate and complete effects of CCCP addition on the activity [2], suggesting an indirect effect of CCCP occurs here. Notably, the addition of other protonophores like 2,4-dinitrophenol (DNP) up to 1 mM had no effect on the H2 production activity of the cells, similar to what was observed before at lower concentrations [8]. Taken together, this indicates that the effect of CCCP on FHL activity is indirect.
2.2. Hyd-1 Confers Resistance and Hyd-2 Sensitivity of H2 Production to CCCP
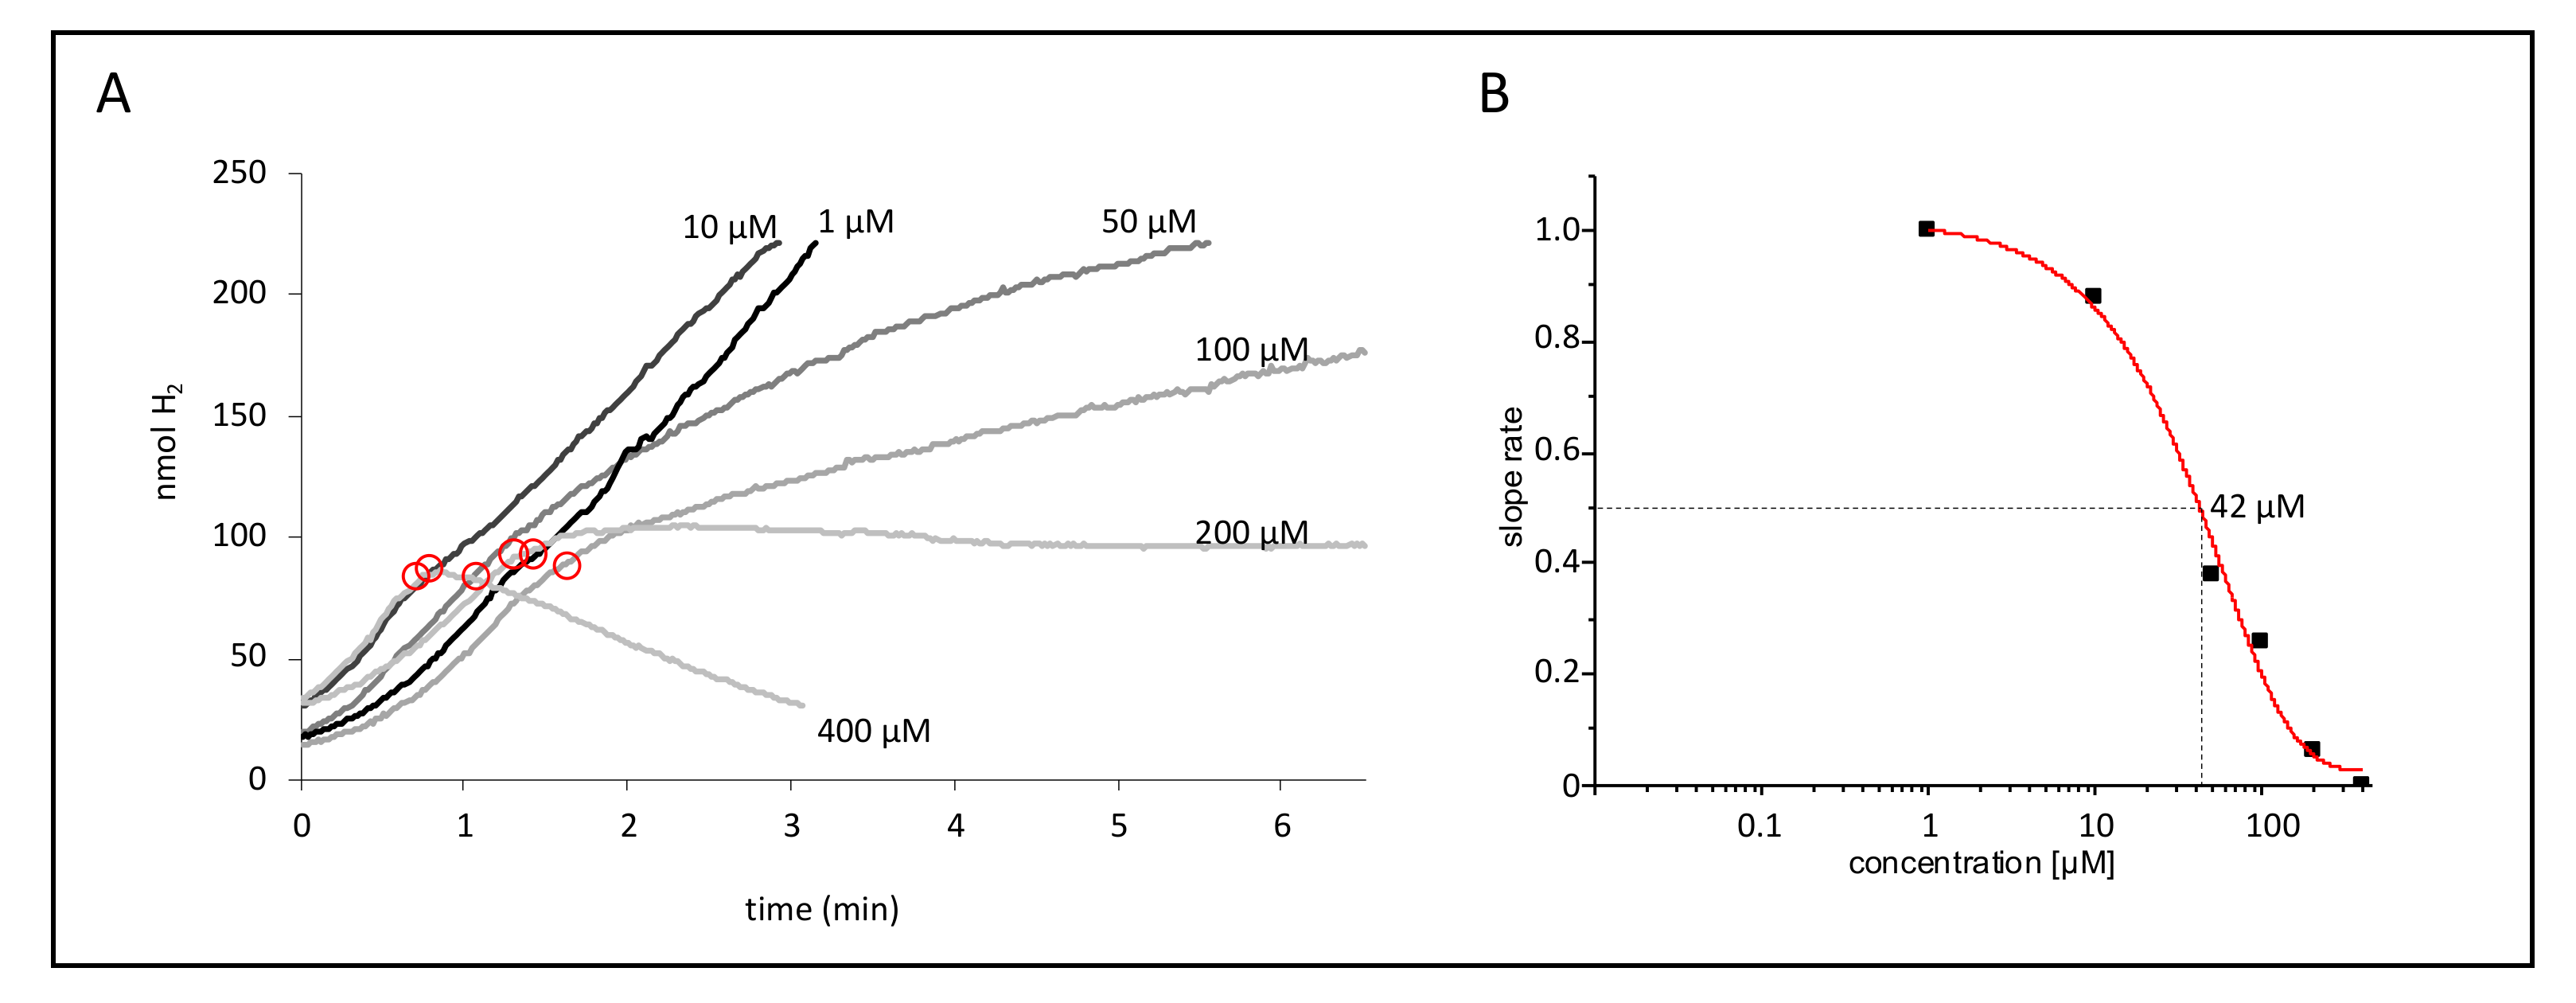
In order to quantify the effect of CCCP on the FHL activity, we calculated the apparent EC50 (half maximal effective concentration) values (Table 2). For that purpose, we analyzed the H2 production on the electrode, and at about 100 nmol H2, different concentrations of CCCP were added to the reaction. Figure 3A shows an example of the effect of the CCCP addition on strain CP630 (ΔhyaB). A concentration of 1 and 10 µM did not significantly alter the slope of H2 production, while 50 and 100 µM CCCP clearly slowed down the reaction, and 200 µM led to complete stagnation of H2 production. A further increase to 400 µM CCCP revealed negative slopes, indicating re-oxidation of H2 by Hyd-2. Due to slight variations in the initial FHL activities, the reduction of activity after CCCP addition was calculated as the ratio of the activity after CCCP addition to the activity before its addition (Figure 3B). In the case of a negative slope, the ratio after CCCP addition was calculated as zero.
An apparent half-maximal inhibition (EC50) of H2 production can be observed at 31 µM CCCP with glucose or 81 µM CCCP with formate as substrate in strain MC4100 (Table 2). These higher concentrations of CCCP, which are required in the presence of formate compared to glucose, reflect the higher initial activities in the presence of formate (Table 1). The double deletion strain CP734 (ΔhyaB ΔhybC) only showed reduction of H2 production at elevated CCCP concentrations, which is reflected in the increased apparent EC50 values. For example, we observed complete inhibition of MC4100 (glucose initiated) at 50 µM CCCP but in strain CP734 only at 500 µM CCCP. Looking at the effect of single deletions of the two H2-oxidizing Hyd in strains CP630 and CP631, respectively, then the Hyd-1 deletion (ΔhyaB, strain CP630) caused increased sensitivity to CCCP compared to the parental MC4100, while the Hyd-2 deletion (ΔhybC, strain CP631) increased resistance to CCCP similar to the double deletion strain CP734 (Table 2).
Hyd-1 has a lower catalytic activity than Hyd-2 [24,25], while at the same time it has a similar abundance in the membrane under the conditions used to grow the cells here [26]. It is possible that the inactivation of Hyd-1 in strain CP630 results in elevated amounts of Hyd-2 because more maturation enzymes for cofactor construction and more membrane space are available. Hyd-2 is the enzyme that contributes to pmf generation [27], and the data show that Hyd-2 but not Hyd-1 catalyzes the oxidation of H2 at high CCCP concentrations. CCCP enhances Hyd-2 activity by removing the back-pressure of the pmf on the enzyme. When assayed directly, the effect is not very prominent because the enzyme works at its catalytic optimum, but in variants that exhibit difficulties in transferring electrons across the membrane, the effect is more pronounced [2]. Electrons from Hyd-2 are concomitantly channeled into the quinone pool for reduction of electron acceptors like fumarate, which can be internally produced during mixed-acid fermentation when glucose is provided to the cells [28]. Therefore, negative slopes occur mostly when Hyd-2 is present and glucose is provided. This does not account for H2 oxidation in the presence of formate; however, we cannot currently explain this effect (Figure 3A). The higher amounts of Hyd-2 enzyme in combination with its CCCP-elevated activity account for the apparent higher CCCP sensitivity in the absence of Hyd-1. Therefore, the absence of Hyd-2 confers resistance, and the absence of Hyd-1, resulting in a concomitant increase in Hyd-2 levels, causes sensitivity to CCCP.
CCCP is, however, also effective at stalling the H2 production when Hyd-1 and Hyd-2 are both absent, albeit only at higher concentrations, but independent of the given carbon source. Hence, a secondary effect, exclusively based on FHL activity, must occur. When, in an unrelated study, a proteorhodopsin was expressed in E. coli cells, the H2 production from FHL was increased upon light exposure, which initiates proton-pumping activity of the proteorhodopsin [29] and supports the observed pmf-consumption during H2-evolution observed here. We can exclude a direct inhibition of either the hydrogenase or formate dehydrogenase half-reaction of the FHL complex. When assayed independently of one another with benzyl viologen redox dye, crude extracts from strain CP734 showed a hydrogenase activity of 2.43 ± 0.48 U mg−1 in the absence and 2.36 ± 0.42 U mg−1 in the presence of CCCP. The formate dehydrogenase activity was similarly unaltered with an activity of 0.26 ± 0.09 U mg−1 without and 0.27 ± 0.07 U mg−1 with CCCP present.
2.3. CCCP Promotes the Reverse FHL Reaction
Due to the inhibitory effect of CCCP addition on the H2 production of FHL, we investigated its effect on the reverse FHL reaction, which can be initiated if resting cells are incubated under elevated pressure of H2 and CO2 gas mix, as exploited before [8,9]. The reverse reaction was tested in the presence of different concentrations of CCCP, and the resulting formate concentration secreted by the cell suspensions at the equilibrium state was subsequently analyzed using HPLC (Figure 4). While cells produced 23 mM formate in the absence of CCCP in a strain that lacked Hyd-1 and Hyd-2, no formate formation was observed in the parental strain MC4100 under these conditions. The amount of formate initially decreased in the presence of 1, 10 and 50 µM CCCP, was then similar to no addition in the presence of 75 µM CCCP and finally increased to 180 mM formate when 500 µM CCCP was added. The parental strain MC4100 only showed formate production when 200 µM CCCP or more was present but eventually produced 157 mM formate in the presence of 500 µM CCCP (Figure 4). This difference between the two strains clearly showed that when Hyd-1 and Hyd-2 are present (strain MC4100), H2 oxidation by these enzymes is the preferred route for H2 oxidation to the FHL reverse reaction. Generally, an increase of the CCCP concentration resulted in an increase of formate production. If the CCCP effect was pmf-mediated, then this could be interpreted as CCCP-mediated relief of the pmf counter-pressure during the reverse FHL reaction. An alternative explanation is provided by the proton symport of the formate channel FocA during export, which would be enhanced in the presence of CCCP, thus removing cytoplasmic formate from the reaction and, therefore, shifting the equilibrium of the FHL reaction towards formate production.
2.4. The DTT Reversal of the CCCP Effect Is Not Mediated by Hyd-2 Activity
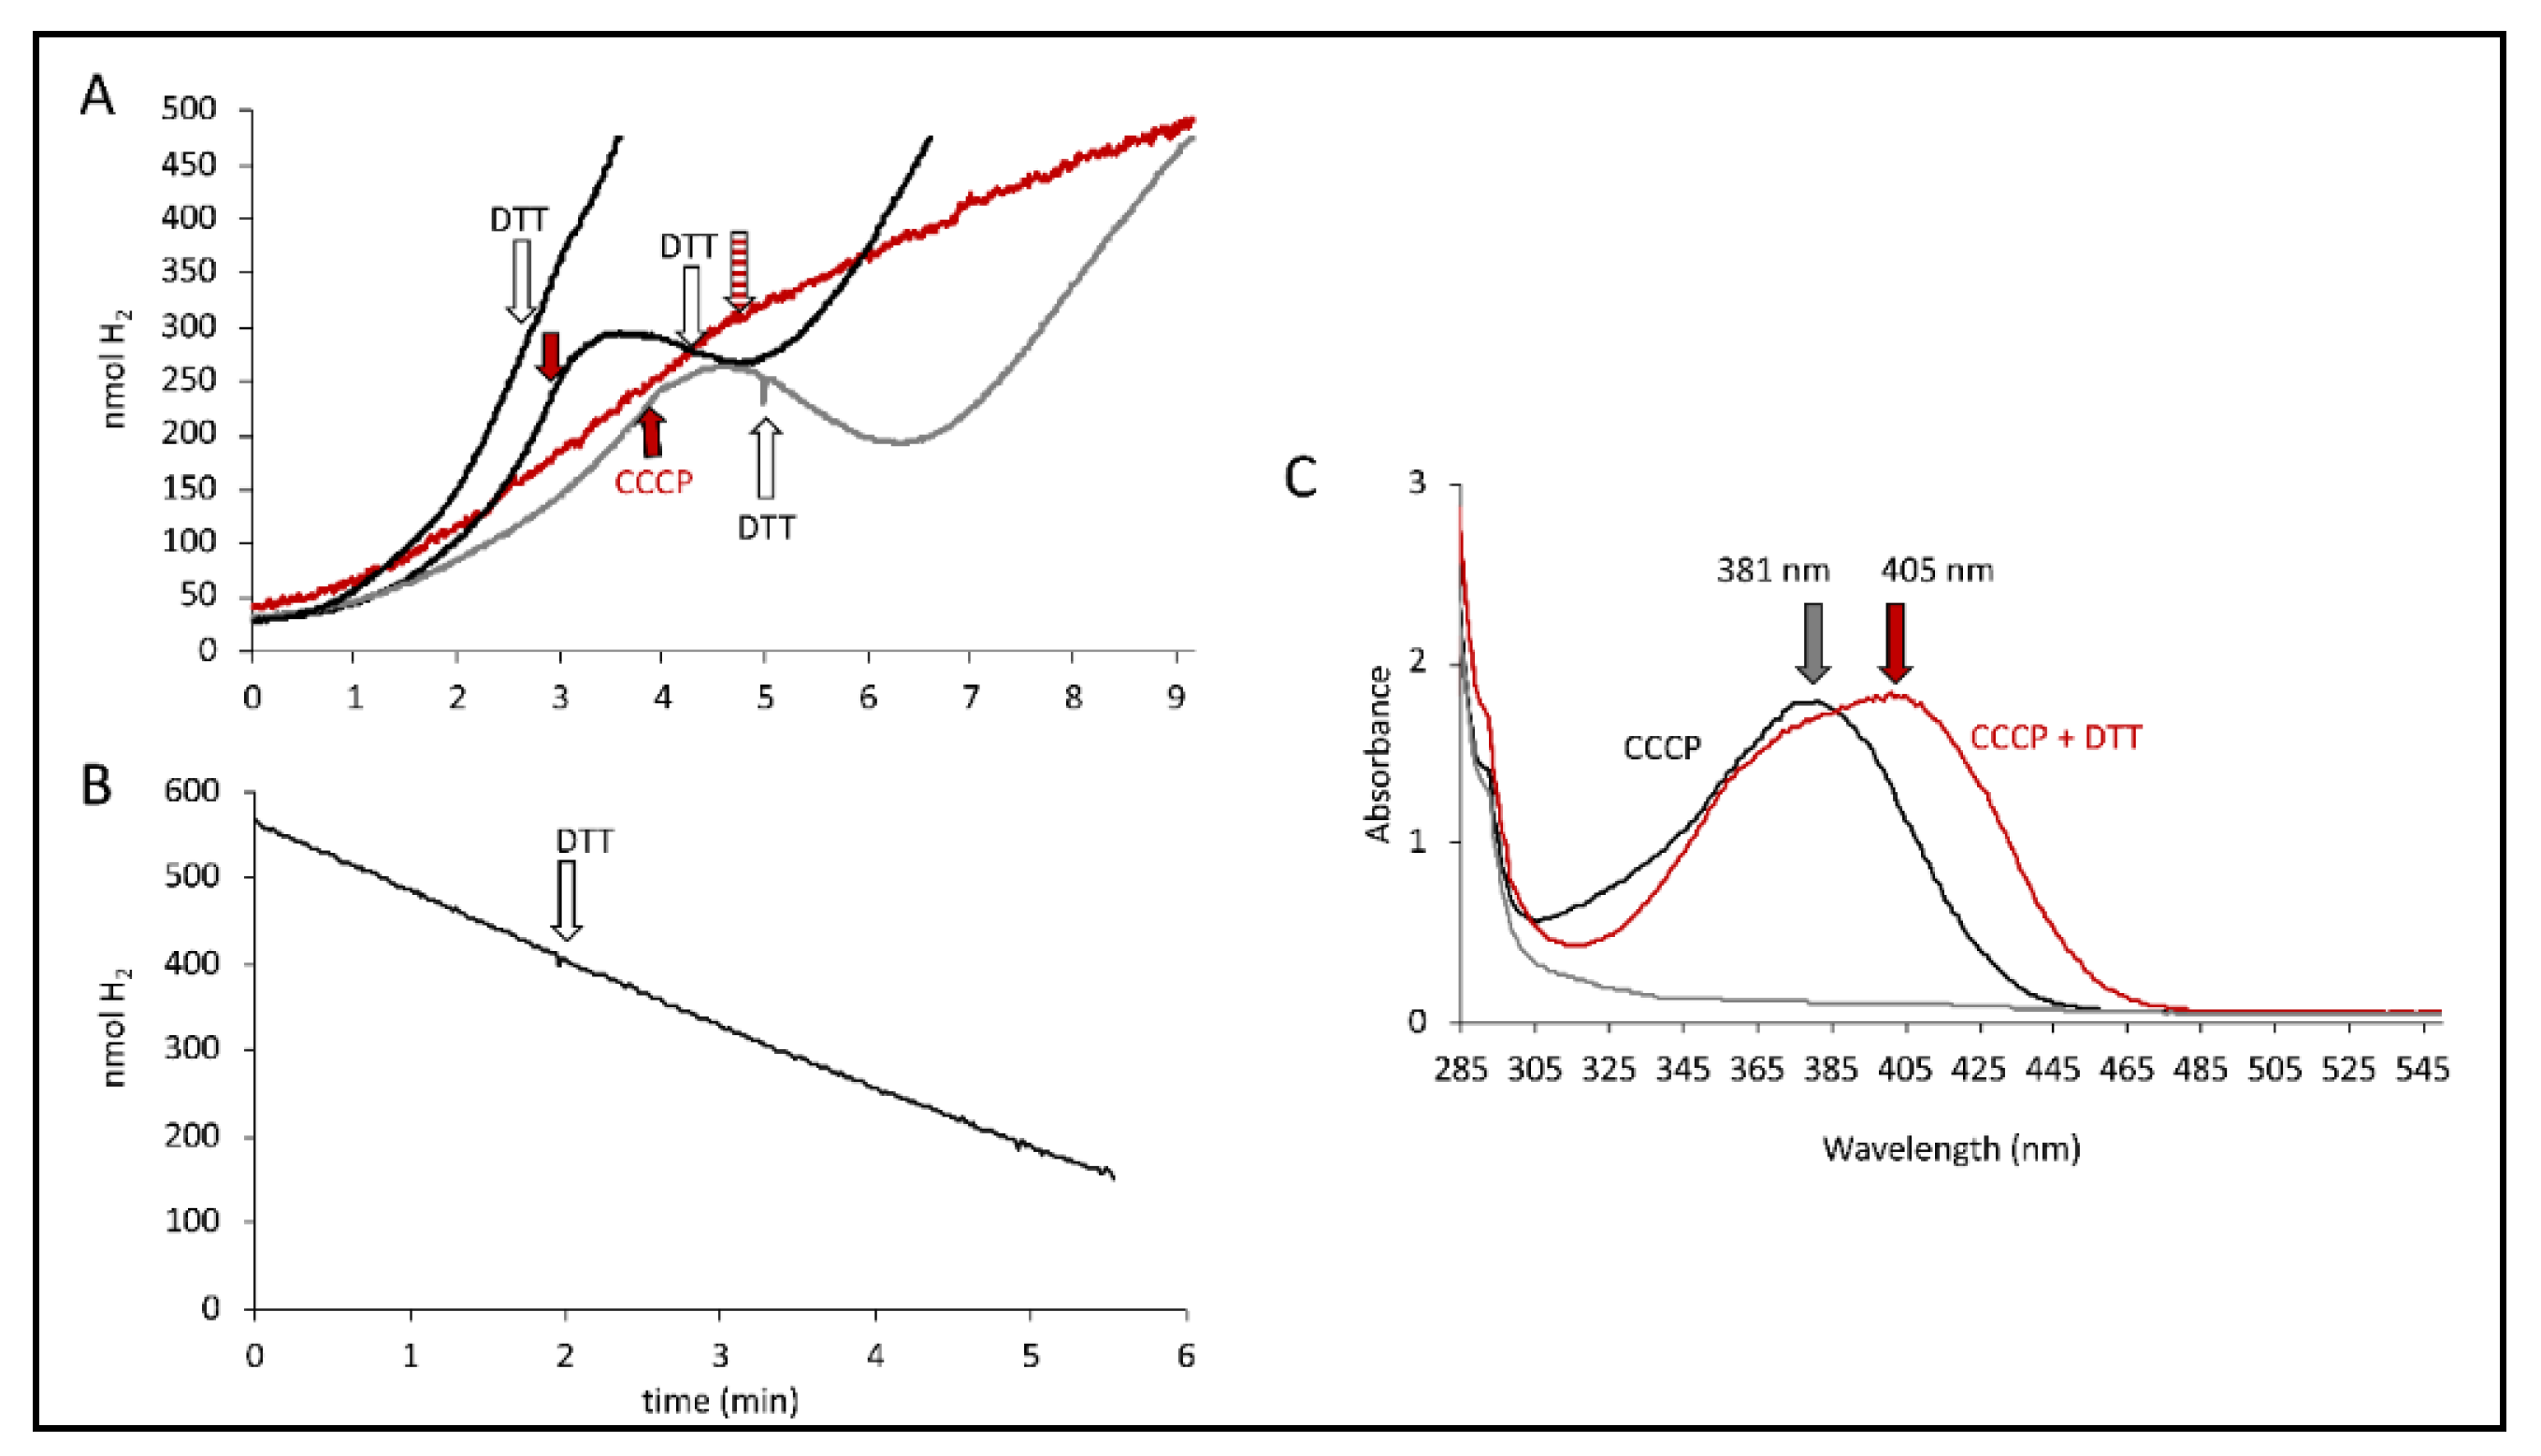
It has been observed that the effects of CCCP can be generally relieved by addition of dithiothreitol (DTT) [30] and also specifically restore the activity of FHL with DTT after CCCP inhibition [17]. Initially, it was verified that the addition of DTT on its own had no effect on the H2 production rate of MC4100 (Figure 5A). Once the H2 production was CCCP-inhibited, the addition of DTT was able to gradually restore H2 production up to the rate it had been before CCCP addition (Figure 5A). We also observed that the DTT relief of CCCP inhibition is independent of the strain used, indicating that the presence of Hyd-2 or Hyd-1 is not essential for the reversibility. Furthermore, CCCP was unable to inhibit H2 production when it was already pre-incubated with DTT (red curve in Figure 5A).
We were recently able to show that Hyd-2 contributes to pmf generation in an electrogenic fashion that is susceptible to CCCP addition [2,27]. If CCCP addition substantially increased Hyd-2 activity to the amount where it outcompeted the H2 production of the FHL complex and thus reduced the overall H2 production, then the DTT addition would inhibit Hyd-2 H2-oxidizing activity and consequently restore overall H2 production. Strain HDK103 (ΔhyaB ΔhycA-I), which only synthesizes active Hyd-2 enzymes, was used to investigate whether DTT addition influenced the H2-oxidizing activity of Hyd-2. H2-saturated buffer was applied to the electrode, and cell suspension was added before the reaction was initiated with 15 mM fumarate as electron acceptor and the H2 trace recorded (Figure 5B). The addition of 5 mM DTT is indicated but did not inhibit H2 oxidation. Hence, DTT did not inhibit the H2-oxidizing activity of Hyd-2, and restoration of overall H2 production is caused otherwise.
It is noteworthy that a redshift of the CCCP spectrum in the presence of DTT was observed, where the absorbance maximum shifts from 381 nm to 405 nm (Figure 5C). The reaction of CCCP derivatives with thiols has been characterized [31] and showed that they are inactivated in the reaction in the presence of DTT. Taken together, this supports the observation made above that the observed effects of CCCP are not merely due to its protonophore activity but rather could be attributed to its interaction with thiols from cysteine residues, possibly those within the FHL complex. Cysteine residues are essential for electron transfer within the FHL complex by coordinating the metal cofactors. Recently, the number of free thiols was determined and was reduced in strains unable to synthesize a functional FHL complex [32]. However, an inactivation of CCCP by DTT and re-formation of the pmf by the cell can also not be excluded.
2.5. Effect of Monovalent Cations on FHL Reactions
CCCP has been described to collapse both the ΔpH and the transmembrane electrical gradient (ΔΨ) component of the pmf [33]. It has been observed that FHL is more active and the hyc-genes more strongly expressed under acidic conditions [34,35]. While a ΔpH collapse would increase the availability of protons to the hydrogenase active site in the cytoplasm, and hence increase substrate availability, the ΔΨ collapse represents reduction of the outer positive charge and inner negative charge of the membrane. In order to investigate the possibility that the apparent pmf dependence could be due to the ΔΨ collapse mediated by CCCP, we analyzed the effects of cation addition on H2 production.
Kinetic experiments on the electrode showed reduction of the H2 production rate when increasing concentrations of Na+ ions were present. The rates were reduced by 27% in strain CP734 in the presence of 200 mM sodium compared to in its absence (Figure 6A). When 100 µM CCCP was added to any of the reactions, the reduction was between 40%–50%, regardless of the sodium ion concentration present (Figure 6A, grey dots). Therefore, the presence of NaCl did not enhance the effect of CCCP in this strain.
The net charge of the ions remains unaltered through the addition of NaCl or KCl, because the chloride counterion is present. However, the cation/H+ antiporters counteract the increased salt concentrations that challenge the cell and concomitantly excrete excess cations, which is accompanied by an increased H+ influx. It was observed that ΔΨ decreased over the first 15–20 min after addition of KCl or NaCl [36], hence within the time-frame where H2 production was monitored. Apparently, it is this disturbance of the electrical gradient that is detrimental to H2 production by FHL.
Similarly, when cells were already grown in the presence of different concentrations of Na+ or K+ ions and subsequently the H2 content in the headspace sampled by gas chromatography (GC), which indirectly reflects the activity of the FHL complex, a reduction in the presence of increasing concentrations of Na+ ions could be observed (Figure 6B). Strain CP734 (ΔhyaB ΔhybC) showed an increased H2 accumulation by 30%–70% compared to its parent MC4100 under all conditions. This effect is due to the absence of Hyd-1 and Hyd-2 enzymes, which oxidize part of the produced H2. The H2 content of strain MC4100 was reduced by 36% and 48% in the presence of 200 mM and 500 mM NaCl, respectively, while strain CP734 showed a similar reduction of 26% and 42% in the presence of 200 and 500 mM NaCl, respectively. This further supports the notion that H2 oxidation, and hence the activity of the H2-oxidizing enzymes, was not increased in response to NaCl. To verify whether the effect of Na+ ions was specific, 200 mM K+ ions were used instead and showed an identical reduction of the H2 content by 35% and 22% for MC4100 and CP734, respectively. Therefore, the reduction was not specific for a particular cation. However, Na+-transport was shown to be K+ dependent in E. coli, albeit not by direct exchange but rather is H+-antiport coupled [37]. This interconnection of the two cation transport systems could explain the similar effect of both cations.
Headspace H2 derives from supplemented glucose given to the cells during growth, which is converted to formate as one of the products of mixed-acid fermentation. Elevated concentrations of 500 mM Na+-ions reduced the amount of produced H2 (Figure 6B). In order to identify the fate of the carbon, the formate concentration was determined. The cultures had reduced formate amounts by 35% and 29% for MC4100 and CP734, respectively (Figure 6C). Other key metabolites of the mixed acid fermentation like succinate and acetate were similarly reduced under high salt conditions (data not shown). At the same time, the growth of the cultures was reduced by only 15% and was therefore not the main reason for the reduced formate production. This result indicates that under high salt conditions formate is not accumulated because of FHL inhibition, but rather, more generally, the entire mixed-acid fermentation was reduced.
2.6. The Na+ Ionophore EIPA Enhances CCCP Inhibition
The sodium concentration of the cell is maintained by Na+/H+ antiporters that reside in the cell membrane and also function in regulation of the intracellular pH. E. coli synthesizes three MRP-type antiporter proteins (NhaA, NhaB and ChaA), which are responsible for Na+/H+ exchange [38]. Intriguingly, this class of Na+/H+ antiporters is homologous to the HycC protein of the FHL membrane domain and to the NuoLMN (E. coli nomenclature) proteins, the proton-pumping subunits of the NADH-oxidizing complex I [39]. Some of these antiporters, especially those homologous subunits within the membrane domain of respiratory complex I, can be inhibited by EIPA (5-(N-ethyl-N-isopropyl)-amiloride) [40]. Klebsiella pneumoniae complex I was shown to translocate Na+ ions instead of protons and some evidence for Na+ translocation of E. coli complex I exists, but this might merely be a secondary effect [41,42]. In addition, in thermophilic organisms like Thermococcus onnurineus, energy conservation functions in an intricate mechanism that couples formate oxidation with concomitant H2 production for the generation of a proton gradient. This proton gradient is subsequently converted into a Na+ gradient by a Na+/H+-antiporter and then employed by a Na+ ATPase for ATP synthesis [43].
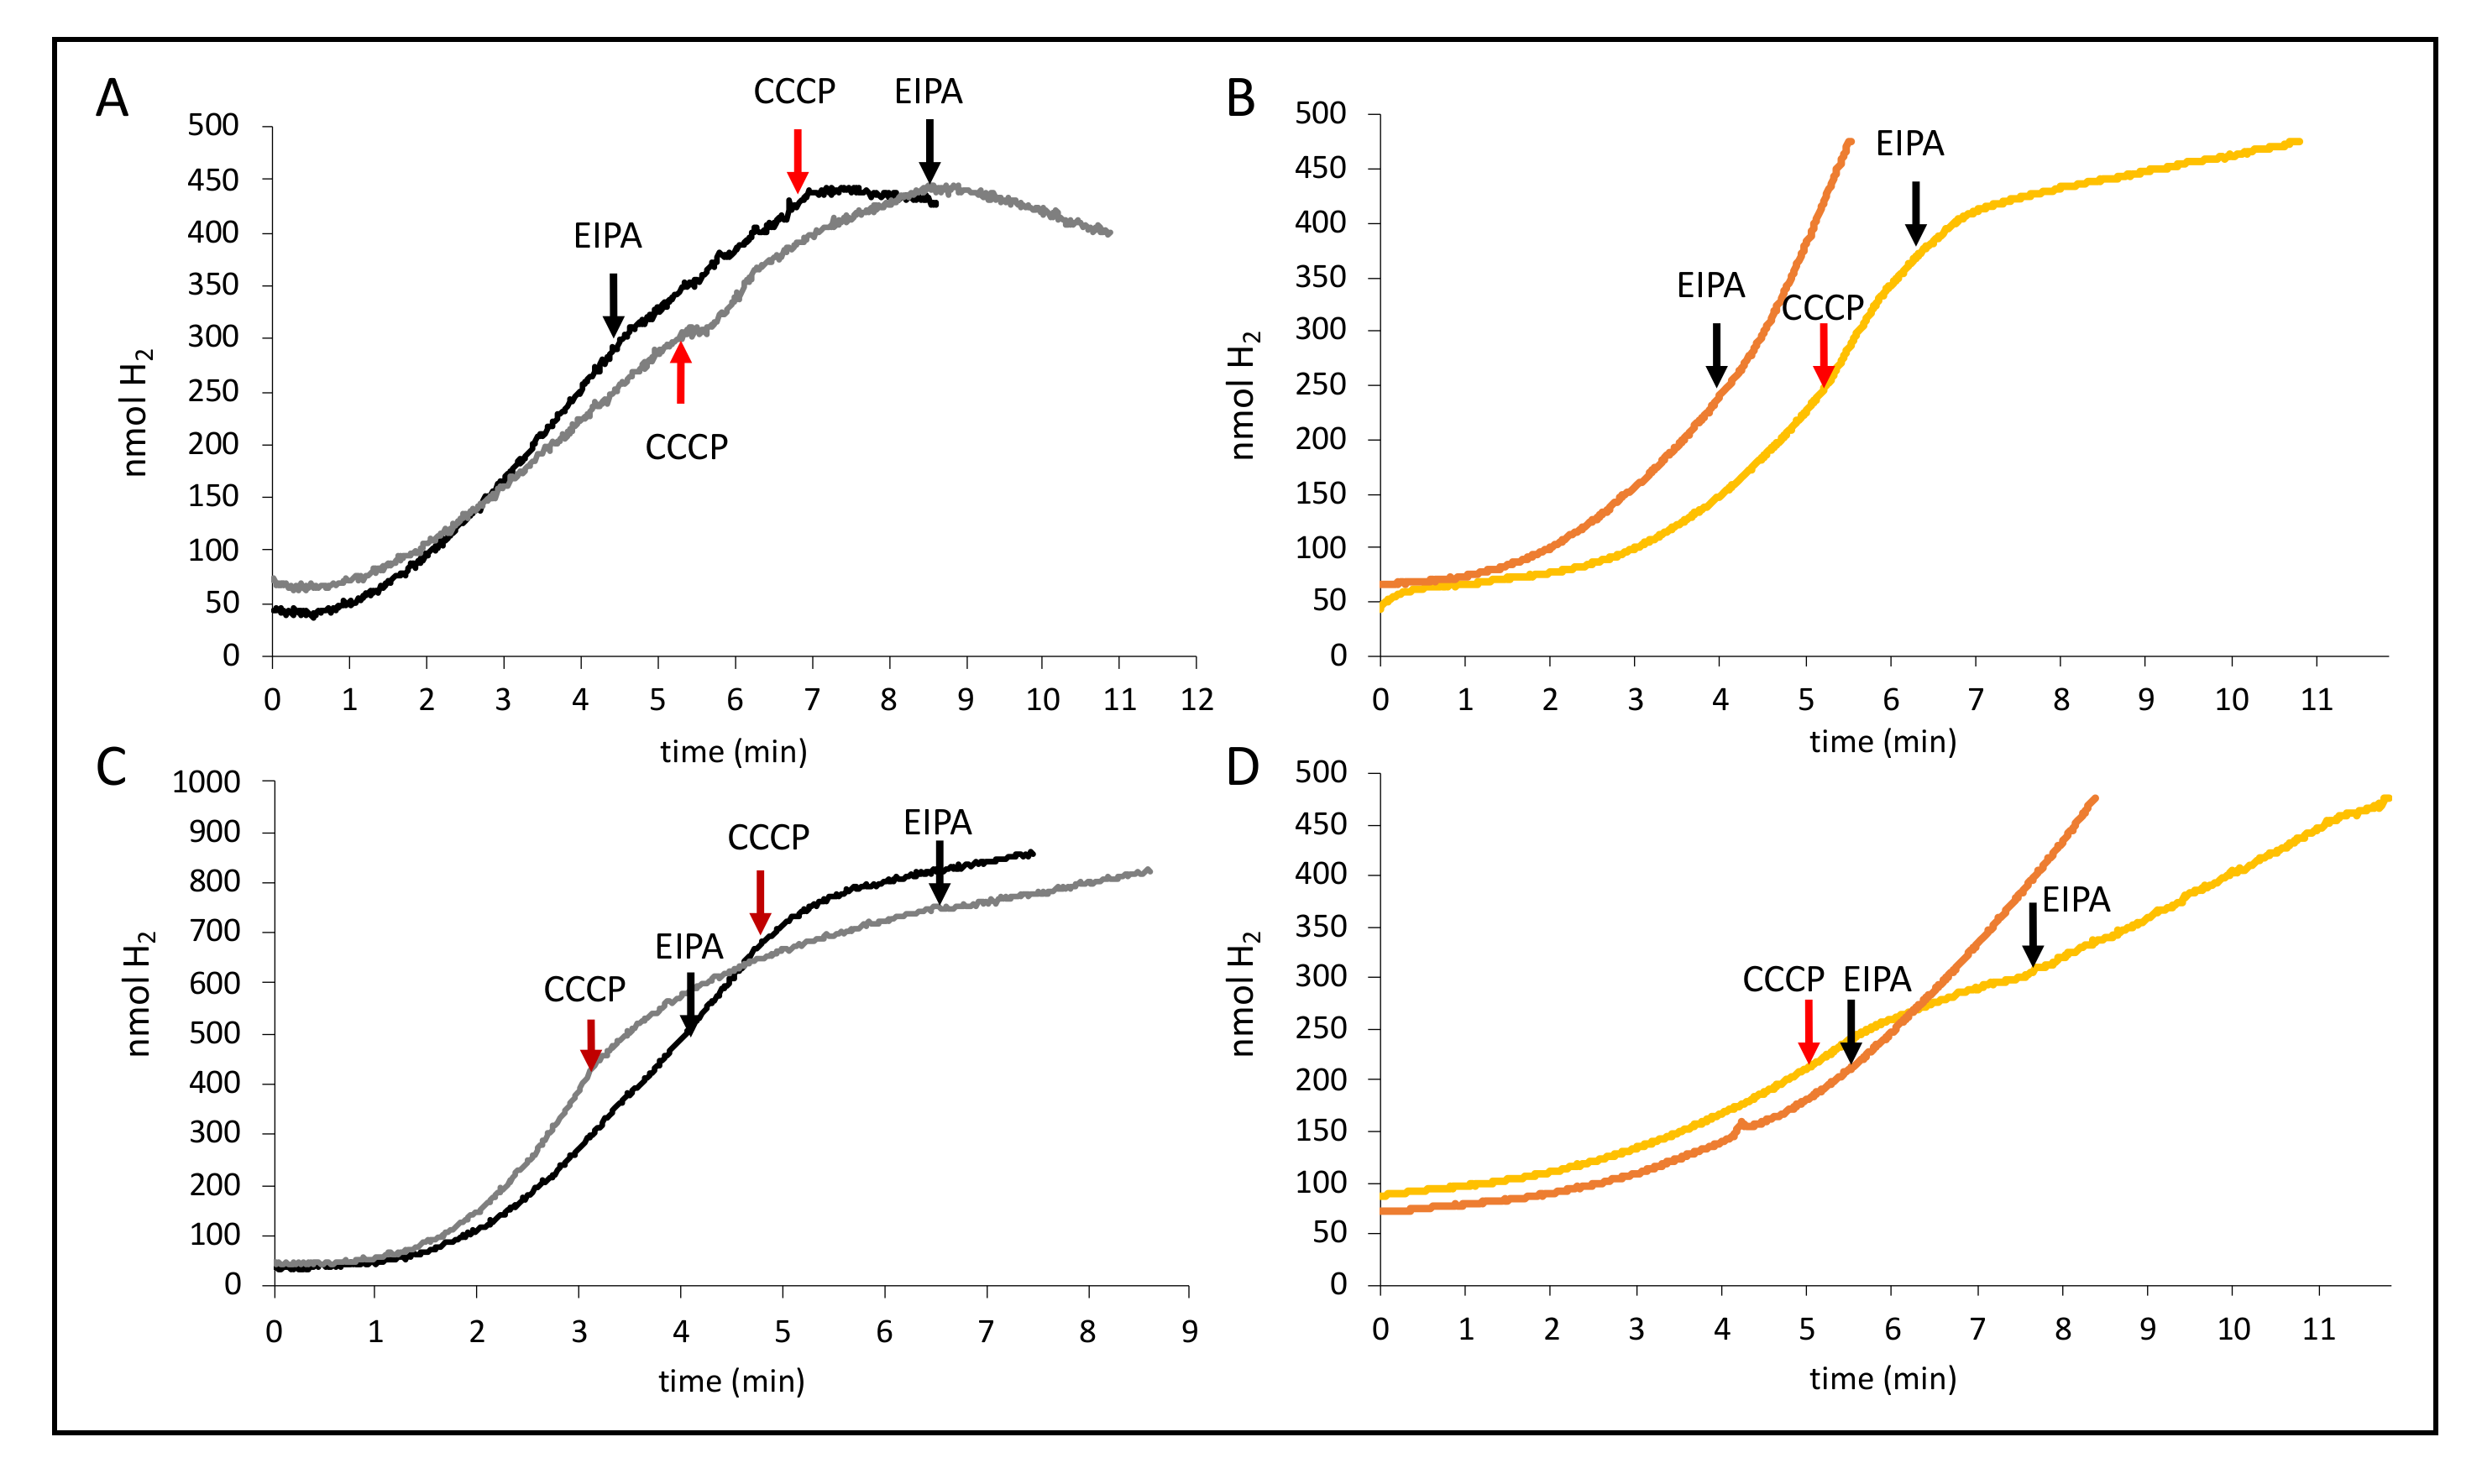
Due to the observed reduction of H2 production by NaCl, we tested the effect EIPA had on the H2 production of FHL and found that, on its own or combined with 200 mM NaCl, the effects were negligible as described before [8]. Surprisingly, however, when EIPA and CCCP were given shortly after each other, they were able to inhibit H2 production completely (Figure 7A). A similar effect was also determined for strain CP734 (ΔhyaB ΔhybC, Figure 7B); however, inhibition of H2 production was not as complete as for MC4100. EIPA on its own also had no effect (Figure 7B). Notably, inhibition was also not complete for MC4100 when the reaction was started with formate instead of glucose (Figure 7C), and no effect was seen in strain CP734 (ΔhyaB ΔhybC) when formate was used to initiate the H2 production (Figure 7D). This indicates that the activity of the Na+/H+ antiporter plays a crucial role during H2 production from glucose. However, the MRP-type membrane subunit HycC of the FHL complex, which is essential for the reaction, is not inhibited by EIPA. Taken together, this could imply that a H+ gradient is converted into a Na+ gradient at the cell membrane during catalysis and that the FHL reaction couples both. Further experiments will be necessary to find the target of the ionophores.
3. Materials and Methods
3.1. Strains and Growth Conditions
Strains are listed in Table 3. Strains CP630 and CP631 were constructed using P1kc-mediated phage transduction of the ΔhyaB and ΔhybC alleles of the Keio-collection strains JW0955 and JW2962, respectively, as described [44]. Strains were routinely grown aerobically in LB medium or on LB agar plates at 37 °C. For analysis of FHL activity, the strains were grown anaerobically as standing liquid cultures for 16 h in 50 mL TGYEP medium, pH 6.5 (1% (w/v) tryptone, 0.5% (w/v) yeast extract, 0.1 M potassium phosphate buffer, pH 6.5, 0.8% (w/v) glucose) at 30 °C [45]. Cultures for H2 headspace and HPLC analyses were grown in phosphate-buffered M9-minimal medium supplemented with 0.8% (w/v) glucose as described [46]. When indicated, sterile solutions of NaCl or KCl were added. CCCP was used at 100 µM unless otherwise indicated. Cultures were harvested by centrifugation at 4000× g for 15 min at 4 °C, resuspended in 800 µL 50 mM Tris/HCl, pH 7.0, and kept on ice until further use.
3.2. Enzymatic Assays
The kinetic activity of the FHL complex was determined on a modified Clark-type electrode equipped with an OXY/ECU module (Oxytherm, Hansatech Instruments, Norfolk, UK) to reverse the polarizing voltage to −0.7 V. A volume of 2 mL degassed 50 mM Tris/HCl buffer, pH 7.0, at 30 °C was added to the chamber prior to adding 50 µL of cell suspension. The reaction was started either with 50 mM formate or with 14 mM glucose. When the effect of sodium ions was studied, the ammonium salt of formate was used to initiate the reaction, which increased the pH by 0.02 units. The amount of H2 was calibrated as described [49]. EC50 values were calculated with Origin Pro 2017G software (OriginLab, Northampton, MA, USA). The protein content of the respective cell suspensions was determined using the method of Lowry in a micro-scale assay [50]. Optical densities and spectra were recorded with a Tecan plate reader.
The H2 content of the gas headspace of a 15-mL Hungate tube filled with 7 mL of culture was determined using gas chromatography with a GC2010 Plus Gas Chromatograph (Shimadzu, Kyõto, Japan) as described [39].
For the reverse FHL reaction, the cells were initially grown anaerobically in TGYEP, pH 6.5, for 16 h at 30 °C, harvested and resuspended in 50 mM Tris/HCl, pH 7.5. Cell suspensions were further mixed with different concentrations of CCCP, as indicated, and incubated under 2 atm pressure of H2 and CO2 1:1 mixture for 16 h at 37 °C. Cells were then removed by filtration through a 0.2 µM filter and supernatants applied to an HPLC system equipped with an Aminex HPX-87H column (Bio-Rad, Hercules, CA, USA), and formate concentrations were determined as previously described [8]. The culture supernatant was centrifuged and subsequently passed through a 0.2 µM filter prior to loading onto the HPLC system.
Calorimetric assays of FdhH activity and hydrogenase activity were carried out with crude extracts from anaerobically grown cells. The cells were harvested, sonicated for 2 min at 20 W with 0.5 s pulses and briefly centrifuged. Anaerobic cuvettes were prepared containing 0.8 mL 50 mM Tris/HCl buffer, pH 7.0, and 4 mM benzyl viologen. The FdhH reaction was started with 15 mM formate, and the hydrogenase reaction was started by adding crude extract to the cuvettes after exchange of the N2 headspace with H2. The signal at 600 nm was recorded, and an EM value of 7400 M−1 cm−1 was assumed for reduced benzyl viologen. Data were derived from three independent biological replicates. Protein concentration was determined using the Lowry method [50].
4. Conclusions
The data presented here confirm CCCP-dependent inhibition of FHL activity. Here, we quantified this effect for the first time and saw striking differences depending on the presence of active H2-oxidizing Hyd enzymes. The CCCP-dependent inhibition showed clearly that FHL did not contribute to proton translocation across the membrane, and in contrast, the data suggest it is driven by proton influx. Nevertheless, the data further highlight that the effect of CCCP might not be due to its protonophore activity but might rather be indirect, either by interacting with thiol groups within the complex or by disturbing the charge distribution at the membrane. The absence of an effect of another protonophore on the H2 production further supports this finding. The sodium/potassium inhibition of the H2 production showed that in order for it to function most effectively, the FHL complex requires low external cation concentrations. Our data clearly suggests that H2 production couples H+ influx with Na+ efflux. However, evidence shows that it is not the MRP antiporter subunit HycC of the FHL complex that is directly involved, but rather it is the cation/H+ antiport of the membrane that influences H2 production.
Author Contributions
C.P. conceived the study; J.T.M. and C.P. collected and analyzed the data, C.P. wrote the original draft and supervised J.T.M. All authors have read and agreed to the published version of the manuscript.
Funding
We acknowledge the financial support within the funding program Open Access Publishing by the German Research Foundation (DFG).
Acknowledgments
We are grateful to Julia Fritz-Steuber (University of Hohenheim, Germany) and Etana Padan (Hebrew University of Jerusalem, Israel), who kindly provided strain EP432. We thank Gary Sawers (Martin-Luther University Halle-Wittenberg, Germany) for fruitful discussions and support in writing this manuscript.
Conflicts of Interest
The authors declare no conflict of interest.
References
- Pinske, C. Bioenergetic aspects of archaeal and bacterial hydrogen metabolism. Adv. Microb. Physiol. 2019, 74, 487–514. [Google Scholar]
- Lubek, D.; Simon, A.H.; Pinske, C. Amino acid variants of the HybB membrane subunit of Escherichia coli [NiFe]-hydrogenase-2 support a role in proton transfer. FEBS Lett. 2019, 156, 2194–2203. [Google Scholar] [CrossRef]
- Pinske, C.; Sawers, R.G. Anaerobic formate and hydrogen metabolism. EcoSal Plus 2016, 7, ESP-0011-2016. [Google Scholar] [CrossRef]
- Odom, J.M.; Peck, H.D. Hydrogen cycling as a general mechanism for energy coupling in the sulfate-reducing bacteria, Desulfovibrio sp. FEMS Microbiol. Lett. 1981, 12, 47–50. [Google Scholar] [CrossRef]
- Wiechmann, A.; Ciurus, S.; Oswald, F.; Seiler, V.N.; Müller, V. It does not always take two to tango: “Syntrophy” via hydrogen cycling in one bacterial cell. ISME J. 2020, 14, 1561–1570. [Google Scholar] [CrossRef]
- Sawers, R.G. Formate and its role in hydrogen production in Escherichia coli. Biochem. Soc. Trans. 2005, 33, 42–46. [Google Scholar] [CrossRef] [Green Version]
- Sauter, M.; Böhm, R.; Böck, A. Mutational analysis of the operon (hyc) determining hydrogenase 3 formation in Escherichia coli. Mol. Microbiol. 1992, 6, 1523–1532. [Google Scholar] [CrossRef] [PubMed]
- Pinske, C.; Sargent, F. Exploring the directionality of Escherichia coli formate hydrogenlyase: A membrane-bound enzyme capable of fixing carbon dioxide to organic acid. Microbiologyopen 2016, 5, 721–737. [Google Scholar] [CrossRef] [PubMed]
- Roger, M.; Brown, F.; Gabrielli, W.; Sargent, F. Efficient hydrogen-dependent carbon dioxide reduction by Escherichia coli. Curr. Biol. 2018, 28, 140–145. [Google Scholar] [CrossRef] [Green Version]
- Redwood, M.D.; Mikheenko, I.P.; Sargent, F.; Macaskie, L.E. Dissecting the roles of Escherichia coli hydrogenases in biohydrogen production. FEMS Microbiol. Lett. 2008, 278, 48–55. [Google Scholar] [CrossRef] [Green Version]
- Andrews, S.C.; Berks, B.C.; McClay, J.; Ambler, A.; Quail, M.A.; Golby, P.; Guest, J.R. A 12-cistron Escherichia coli operon (hyf) encoding a putative proton-translocating formate hydrogenlyase system. Microbiology 1997, 143, 3633–3647. [Google Scholar] [CrossRef] [PubMed] [Green Version]
- Böhm, R.; Sauter, M.; Böck, A. Nucleotide sequence and expression of an operon in Escherichia coli coding for formate hydrogenlyase components. Mol. Microbiol. 1990, 4, 231–243. [Google Scholar] [CrossRef] [PubMed]
- Marreiros, B.C.; Batista, A.P.; Duarte, A.M.S.; Pereira, M.M. A missing link between complex I and group 4 membrane-bound [NiFe] hydrogenases. Biochim. Biophys. Acta 2012, 1827, 198–209. [Google Scholar] [CrossRef] [Green Version]
- Welte, C.; Krätzer, C.; Deppenmeier, U. Involvement of Ech hydrogenase in energy conservation of Methanosarcina mazei. FEBS J. 2010, 277, 3396–3403. [Google Scholar] [CrossRef] [PubMed]
- McDowall, J.S.; Murphy, B.J.; Haumann, M.; Palmer, T.; Armstrong, F.A.; Sargent, F. Bacterial formate hydrogenlyase complex. Proc. Natl. Acad. Sci. USA 2014, 111, E3948–E3956. [Google Scholar] [CrossRef] [PubMed] [Green Version]
- Sokol, K.P.; Robinson, W.E.; Oliveira, A.R.; Zacarias, S.; Lee, C.-Y.; Madden, C.; Bassegoda, A.; Hirst, J.; Pereira, I.A.C.; Reisner, E. Reversible and selective interconversion of hydrogen and carbon dioxide into formate by a semiartificial formate hydrogenlyase mimic. J. Am. Chem. Soc. 2019, 141, 17498–17502. [Google Scholar] [CrossRef] [Green Version]
- Bagramyan, K.A.; Martirosov, S.M. Formation of an ion transport supercomplex in Escherichia coli. An experimental model of direct transduction of energy. FEBS Lett. 1989, 246, 149–152. [Google Scholar] [CrossRef] [Green Version]
- Babu, M.; Bundalovic-Torma, C.; Calmettes, C.; Phanse, S.; Zhang, Q.; Jiang, Y.; Minic, Z.; Kim, S.; Mehla, J.; Gagarinova, A.; et al. Global landscape of cell envelope protein complexes in Escherichia coli. Nat. Biotechnol. 2018, 36, 103–112. [Google Scholar] [CrossRef]
- Trchounian, A.; Sawers, R.G. Novel insights into the bioenergetics of mixed-acid fermentation: Can hydrogen and proton cycles combine to help maintain a proton motive force? IUBMB Life 2014, 66, 1–7. [Google Scholar] [CrossRef]
- Doberenz, C.; Zorn, M.; Falke, D.; Nannemann, D.; Hunger, D.; Beyer, L.; Ihling, C.H.; Meiler, J.; Sinz, A.; Sawers, R.G. Pyruvate formate-lyase interacts directly with the formate channel FocA to regulate formate translocation. J. Mol. Biol. 2014, 426, 2827–2839. [Google Scholar] [CrossRef] [Green Version]
- Beyer, L.; Doberenz, C.; Falke, D.; Hunger, D.; Suppmann, B.; Sawers, R.G. Coordination of FocA and pyruvate formate-lyase synthesis in Escherichia coli demonstrates preferential translocation of formate over other mixed-acid fermentation products. J. Bacteriol. 2013, 195, 1428–1435. [Google Scholar] [CrossRef] [Green Version]
- Hakobyan, M.; Sargsyan, H.; Bagramyan, K. Proton translocation coupled to formate oxidation in anaerobically grown fermenting Escherichia coli. Biophys. Chem. 2005, 115, 55–61. [Google Scholar] [CrossRef]
- Mayer, C.; Boos, W. Hexose/Pentose and Hexitol/Pentitol Metabolism. EcoSal Plus 2005, 1, 1. [Google Scholar] [CrossRef] [PubMed]
- Pinske, C.; Krüger, S.; Soboh, B.; Ihling, C.; Kuhns, M.; Braussemann, M.; Jaroschinsky, M.; Sauer, C.; Sargent, F.; Sinz, A.; et al. Efficient electron transfer from hydrogen to benzyl viologen by the [NiFe]-hydrogenases of Escherichia coli is dependent on the coexpression of the iron-sulfur cluster-containing small subunit. Arch. Microbiol. 2011, 193, 893–903. [Google Scholar] [CrossRef]
- Laurinavichene, T.V.; Tsygankov, A.A. H2 consumption by Escherichia coli coupled via hydrogenase 1 or hydrogenase 2 to different terminal electron acceptors. FEMS Microbiol. Lett. 2001, 202, 121–124. [Google Scholar] [CrossRef] [PubMed] [Green Version]
- Sawers, R.G.; Ballantine, S.; Boxer, D. Differential expression of hydrogenase isoenzymes in Escherichia coli K-12: Evidence for a third isoenzyme. J. Bacteriol. 1985, 164, 1324–1331. [Google Scholar] [CrossRef] [PubMed] [Green Version]
- Pinske, C.; Jaroschinsky, M.; Linek, S.; Kelly, C.L.; Sargent, F.; Sawers, R.G. Physiology and bioenergetics of [NiFe]-hydrogenase 2-catalyzed H2-consuming and H2-producing reactions in Escherichia coli. J. Bacteriol. 2015, 197, 296–306. [Google Scholar] [CrossRef] [Green Version]
- Laurinavichene, T.V.; Zorin, N.A.; Tsygankov, A.A. Effect of redox potential on activity of hydrogenase 1 and hydrogenase 2 in Escherichia coli. Arch. Microbiol. 2002, 178, 437–442. [Google Scholar] [CrossRef]
- Kuniyoshi, T.M.; Balan, A.; Schenberg, A.C.G.; Severino, D.; Hallenbeck, P.C. Heterologous expression of proteorhodopsin enhances H2 production in Escherichia coli when endogenous Hyd-4 is overexpressed. J. Biotechnol. 2015, 206, 52–57. [Google Scholar] [CrossRef]
- Ridgway, H.F. Source of energy for gliding motility in Flexibacter polymorphus: Effects of metabolic and respiratory inhibitors on gliding movement. J. Bacteriol. 1977, 131, 544–556. [Google Scholar] [CrossRef] [Green Version]
- Šturdík, E.; Antalík, M.; Sulo, P.; Baláž, Š.; Ďurčová, E.; Drobnica, Ľ. Relationships among structure, reactivity towards thiols and basicity of phenylhydrazonopropanedinitriles. Collect. Czechoslov. Chem. Commun. 1985, 50, 2065–2076. [Google Scholar] [CrossRef]
- Gevorgyan, H.; Trchounian, A.; Trchounian, K. Formate and potassium ions affect Escherichia coli proton ATPase activity at low pH during mixed carbon fermentation. IUBMB Life 2020, 72, 915–921. [Google Scholar] [CrossRef] [PubMed]
- Akiyama, Y. Proton-motive force stimulates the proteolytic activity of FtsH, a membrane-bound ATP-dependent protease in Escherichia coli. Proc. Natl. Acad. Sci. USA 2002, 99, 8066–8071. [Google Scholar] [CrossRef] [Green Version]
- Rossmann, R.; Sawers, R.G.; Böck, A. Mechanism of regulation of the formate-hydrogenlyase pathway by oxygen, nitrate, and pH: Definition of the formate regulon. Mol. Microbiol. 1991, 5, 2807–2814. [Google Scholar] [CrossRef]
- Bagramyan, K.; Mnatsakanyan, N.; Poladian, A.; Vassilian, A.; Trchounian, A. The roles of hydrogenases 3 and 4, and the F0F1-ATPase, in H2 production by Escherichia coli at alkaline and acidic pH. FEBS Lett. 2002, 516, 172–178. [Google Scholar] [CrossRef] [Green Version]
- Kashket, E.R. Effects of K+ and Na+ on the proton motive force of respiring Escherichia coli at alkaline pH. J. Bacteriol. 1985, 163, 423–429. [Google Scholar] [CrossRef] [PubMed] [Green Version]
- Verkhovskaya, M.L.; Verkhovsky, M.I.; Wikström, M. K+-dependent Na+ transport driven by respiration in Escherichia coli cells and membrane vesicles. Biochim. Biophys. Acta 1996, 1273, 207–216. [Google Scholar] [CrossRef] [Green Version]
- Padan, E.; Landau, M. Sodium-proton (Na+/H+) antiporters: Properties and roles in health and disease. Met. Ions Life Sci. 2016, 16, 391–458. [Google Scholar]
- Friedrich, T.; Scheide, D. The respiratory complex I of bacteria, archaea and eukarya and its module common with membrane-bound multisubunit hydrogenases. FEBS Lett. 2000, 479, 1–5. [Google Scholar] [CrossRef] [Green Version]
- Steuber, J. The C-terminally truncated NuoL subunit (ND5 homologue) of the Na+-dependent complex I from Escherichia coli transports Na+. J. Biol. Chem. 2003, 278, 26817–26822. [Google Scholar] [CrossRef] [PubMed] [Green Version]
- Steuber, J.; Schmid, C.; Rufibach, M.; Dimroth, P. Na+ translocation by complex I (NADH:quinone oxidoreductase) of Escherichia coli. Mol. Microbiol. 2000, 35, 428–434. [Google Scholar] [CrossRef]
- Stolpe, S.; Friedrich, T. The Escherichia coli NADH:ubiquinone oxidoreductase (complex I) is a primary proton pump but may be capable of secondary sodium antiport. J. Biol. Chem. 2004, 279, 18377–18383. [Google Scholar] [CrossRef] [PubMed] [Green Version]
- Kim, Y.J.; Lee, H.S.; Kim, E.S.; Bae, S.S.; Lim, J.K.; Matsumi, R.; Lebedinsky, A.V.; Sokolova, T.G.; Kozhevnikova, D.A.; Cha, S.-S.; et al. Formate-driven growth coupled with H2 production. Nature 2010, 467, 352–355. [Google Scholar] [CrossRef]
- Baba, T.; Ara, T.; Hasegawa, M.; Takai, Y.; Okumura, Y.; Baba, M.; Datsenko, K.; Tomita, M.; Wanner, B.; Mori, H. Construction of Escherichia coli K-12 in-frame, single-gene knockout mutants: The Keio collection. Mol. Syst. Biol. 2006, 2, 2006.0008. [Google Scholar] [CrossRef] [Green Version]
- Begg, Y.A.; Whyte, J.N.; Haddock, B.A. The identification of mutants of Escherichia coli deficient in formate dehydrogenase and nitrate reductase activities using dye indicator plates. FEMS Microbiol. Lett. 1977, 2, 47–50. [Google Scholar] [CrossRef]
- Sambrook, J.; Russell, D. Molecular Cloning: A Laboratory Manual, 3rd ed.; Cold Spring Harbor Laboratory Press: Cold Spring Harbor, NY, USA, 2001. [Google Scholar]
- Casadaban, M.J. Transposition and fusion of the lac genes to selected promoters in Escherichia coli using bacteriophage lambda and Mu. J. Mol. Biol. 1976, 104, 541–555. [Google Scholar] [CrossRef]
- Jacobi, A.; Rossmann, R.; Böck, A. The hyp operon gene products are required for the maturation of catalytically active hydrogenase isoenzymes in Escherichia coli. Arch. Microbiol. 1992, 158, 444–451. [Google Scholar] [CrossRef]
- Sargent, F.; Stanley, N.R.; Berks, B.C.; Palmer, T. Sec-independent protein translocation in Escherichia coli. A distinct and pivotal role for the TatB protein. J. Biol. Chem. 1999, 274, 36073–36082. [Google Scholar] [CrossRef] [Green Version]
- Lowry, O.; Rosebrough, N.; Farr, A.; Randall, R. Protein measurement with the Folin phenol reagent. J. Biol. Chem. 1951, 193, 265–275. [Google Scholar]
Figure 1.
Relevant enzyme complexes of this study, their reactions and their membrane localization. Hyd-1 and Hyd-2 indicate the periplasmic H2-oxidizing hydrogenases, which channel electrons into the quinone pool (Q), FHL—the cytoplasmic formate hydrogenlyase—and the membrane bound Na+/H+ antiporters. Further details are highlighted in the main text.

Figure 2.
Different degrees of inhibition by protonophore carbonyl cyanide m-chlorophenyl-hydrazone (CCCP). Panel A shows H2 production from the strains MC4100 (parental, black curves) and CP734 (ΔhyaB ΔhybC, orange curves) while panel B shows the strains CP630 (ΔhyaB, blue curves) and CP631 (ΔhybC, purple curves) after addition of either 14 mM glucose (dashed lines) or 50 mM formate (solid lines). When H2 production was linear, a final concentration of 100 µM CCCP was added to the reaction vessel, as indicated by the red arrows.
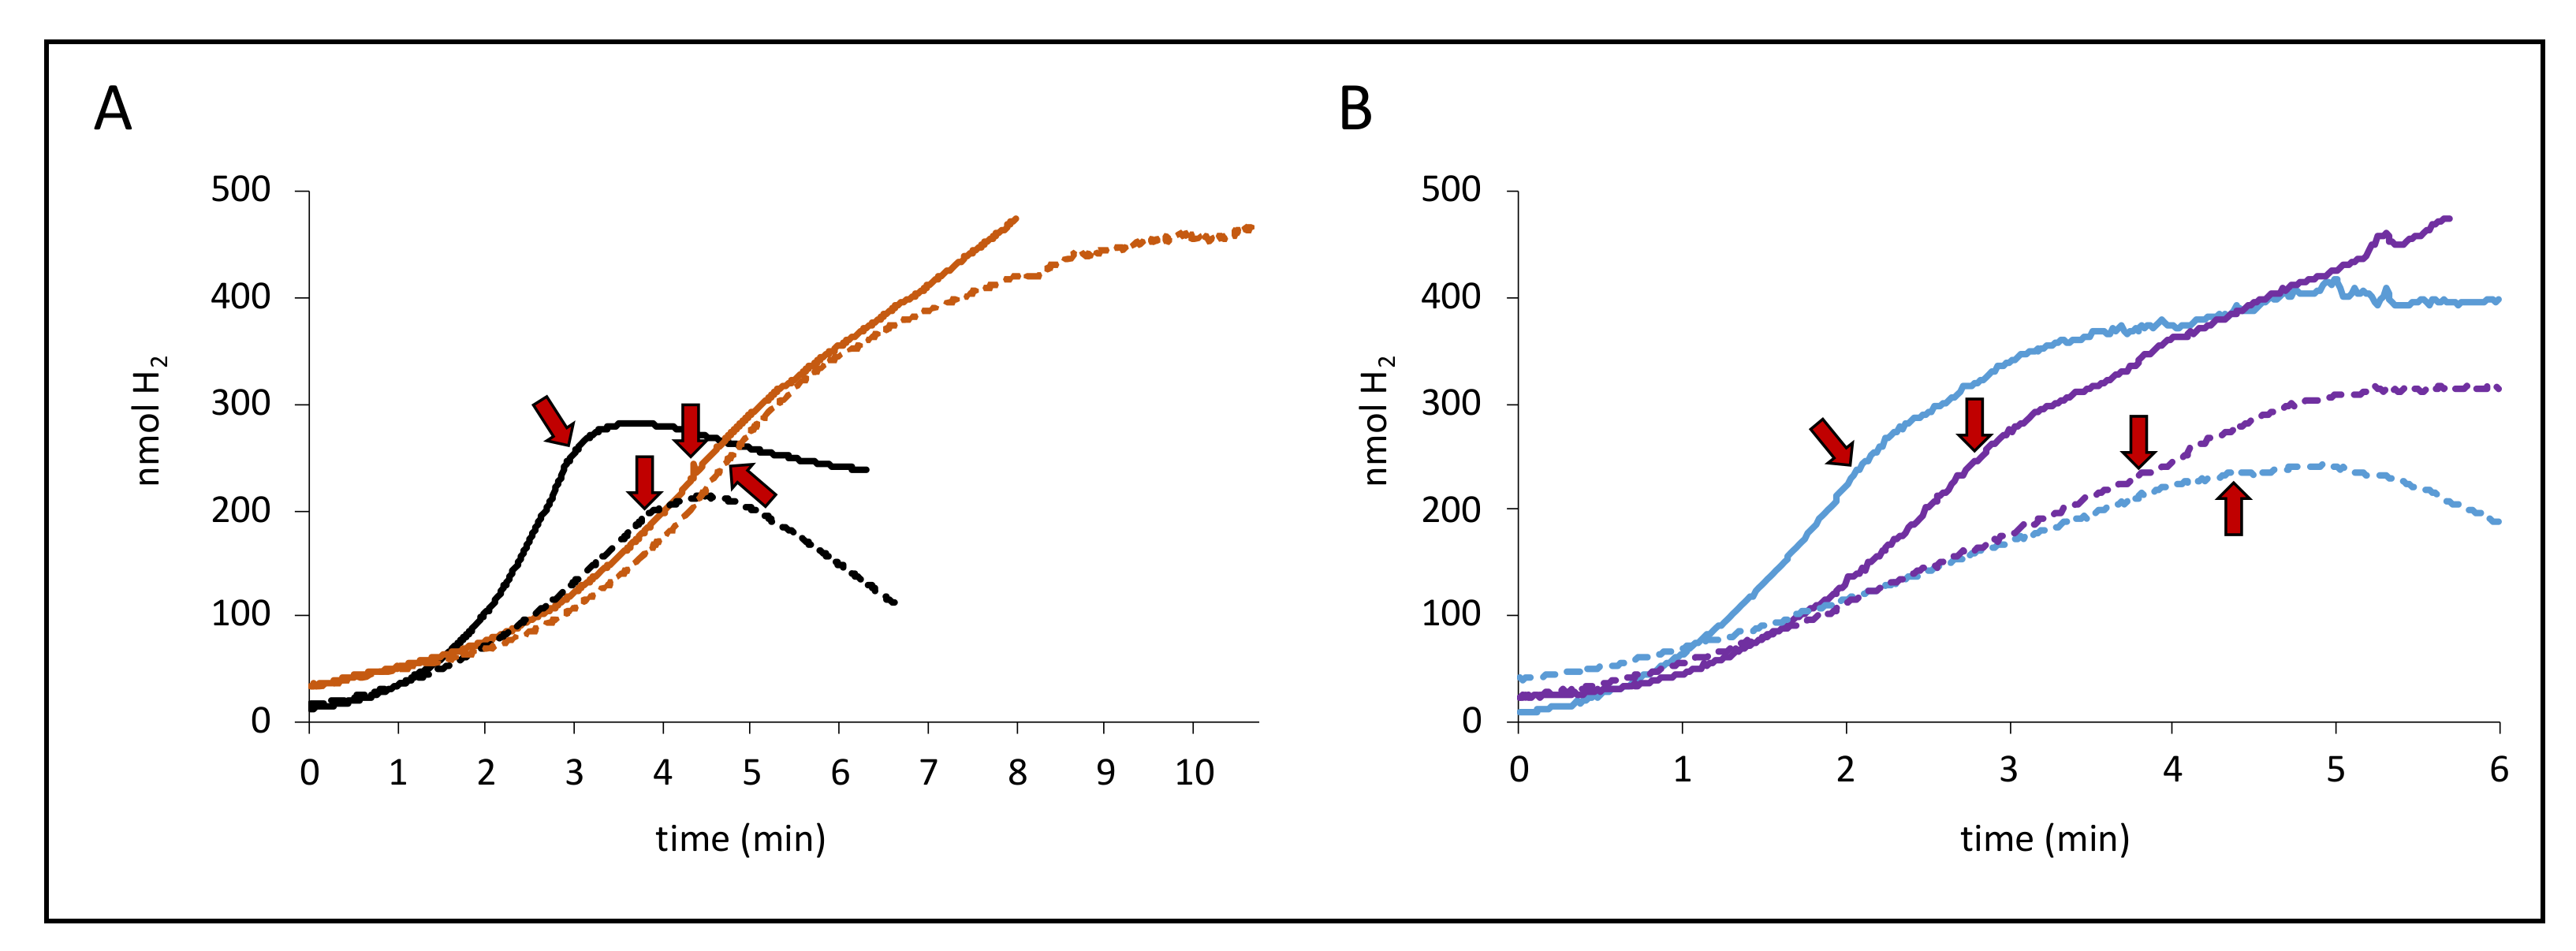
Figure 3.
Dose-dependent effect of CCCP. (A) Strain CP630 (ΔhyaB) was used as a representative strain for CCCP inhibition after initiation of the reaction with 50 mM formate and linear slope; the designated concentrations of CCCP were added at the time points encircled in red. (B) The apparent EC50 values of this set of activities were calculated from the ratio of slopes after and before CCCP addition and subsequent fitting with the EC50 function in SigmaPlot.

Figure 4.
CCCP-dependent increase in formate synthesis by FHL. Strains MC4100 (parental, black dots) and CP734 (ΔhyaB ΔhybC, orange dots) were triggered for formate production in the presence of different concentration of CCCP as indicated (described in the Materials and Methods section). Each dot represents the average of three biological replicates with standard deviation.
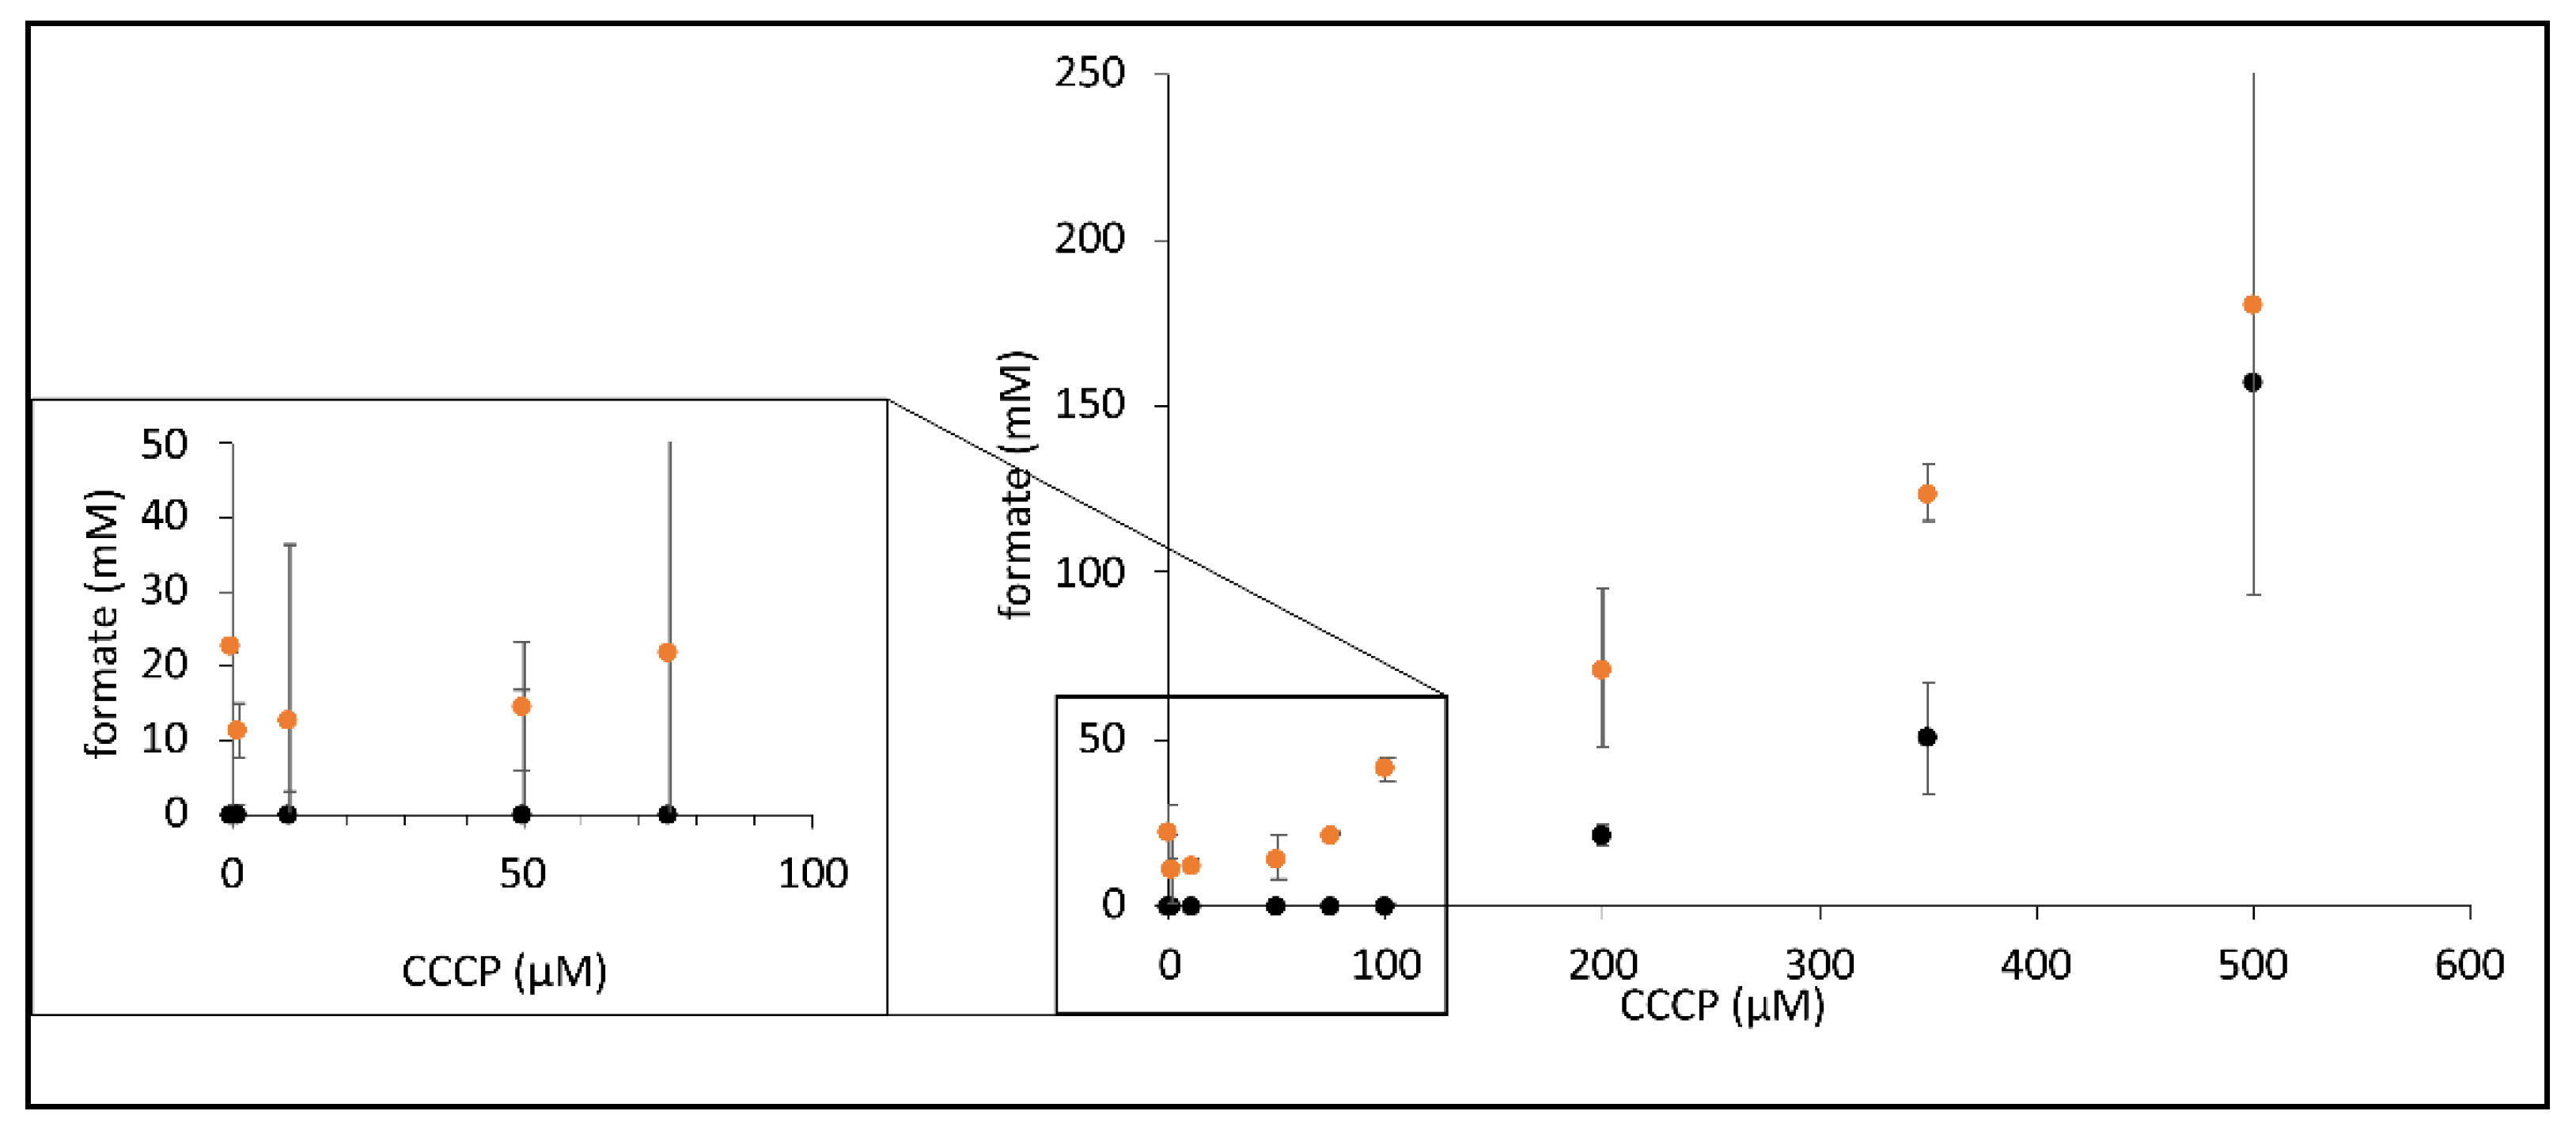
Figure 5.
DTT effect. (A) Electrode traces of MC4100 cells producing H2 from either glucose (grey curves) or formate (black curves). CCCP addition (red arrow, 100 µM) and DTT addition (white arrow, 5 mM) are indicated. The red trace shows the combined addition of DTT and CCCP (striped red arrow). (B) Electrode trace of strain HDK103 (ΔhyaB ΔhycA-I) showing the activity of Hyd-2 as H2 oxidation of H2-saturated buffer after the addition of 15 mM fumarate. The white arrow indicates the addition of 5 mM DTT. (C) Absorption spectra of CCCP solution (black), CCCP solution after DTT addition (red) and DTT alone (grey). The arrows indicate the respective maxima.

Figure 6.
Effect of cations on H2 production. Panel (A) shows the kinetic H2 production rates of CP734 cells in the presence of different concentrations of NaCl (black dots) and in combination with 100 µM CCCP (gray dots). Reactions were initiated with 50 mM formate. Each point represents the average of two independent biological experiments with the respective standard deviation. The trend lines were calculated using linear regression. Panel (B) shows the H2 content in the headspace of a 7 mL culture tube of MC4100 (black graphs) or CP734 (ΔhyaB ΔhybC, orange graphs) after anaerobic overnight growth in M9-minimal medium with 0.8% (w/v) glucose in the presence of NaCl or KCl as indicated. (C) The formate concentration of cultures from panel B was quantified using HPLC, as described in the Materials and Methods section. All values represent the average of three independent biological replicates and their standard deviations.
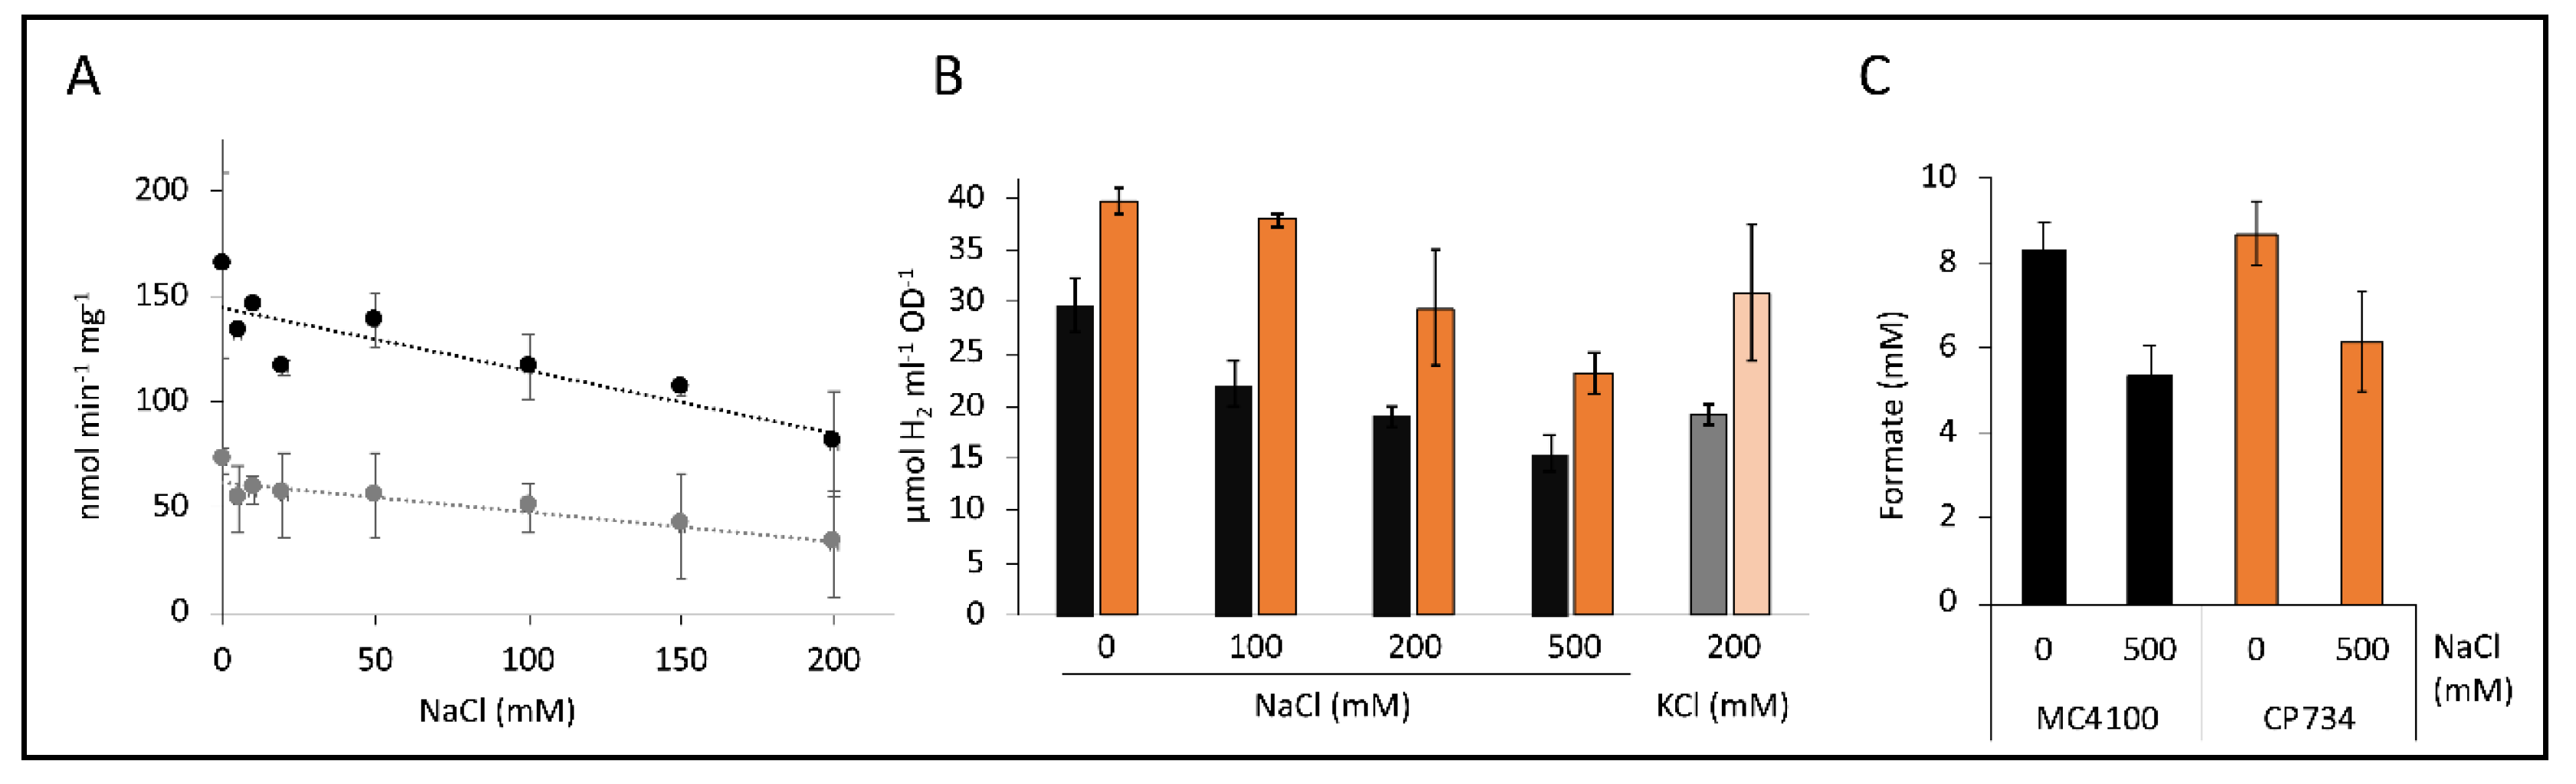
Figure 7.
Effect of EIPA combination with CCCP. Cells of MC4100 (black, panels (A) and (C)) or CP734 (orange, panels (B) and (D)) were grown anaerobically in TGYEP, pH 6.5, and applied to the electrode as described in the Materials and Methods section. The reaction was initiated with glucose (top panels (A) and (B)) or formate (bottom panels (C) and (D)). Where indicated, 50 µM CCCP (red arrows) or 50 µM EIPA (black arrows) were added to the reaction.


Table 1.
H2 production rates in nmol H2·min−1·mg−1 ± standard deviation from at least three independent biological samples.
Table 1.
H2 production rates in nmol H2·min−1·mg−1 ± standard deviation from at least three independent biological samples.
| Strain 1 | Glucose | Formate |
|---|---|---|
| MC4100 | 69 ± 12 | 160 ± 47 |
| CP630 (ΔhyaB) | 74 ± 23 | 173 ± 13 |
| CP631 (ΔhybC) | 101 ± 15 | 145 ± 20 |
| CP734 (ΔhyaB ΔhybC) | 114 ± 24 | 121 ± 13 |
1 Strains were grown in TGYEP, pH 6.5 medium for 16 h at 30 °C, cells harvested and suspended in 50 mM Tris/HCl, pH 7.0, prepared and assayed on the Clark-type electrode.
Table 2.
Apparent EC50 values of CCCP inhibition.
| Strain 1 | Glucose | Formate |
|---|---|---|
| MC4100 | 31 µM | 81 µM |
| CP630 (ΔhyaB) | 0.13 µM | 42 µM |
| CP631(ΔhybC) | 125 µM | 223 µM |
| CP734 (ΔhyaB ΔhybC) | 98 µM | 348 µM |
1 The same cell suspensions were used for the glucose and formate experiments. The same amount of total cell protein (1 mg) was used for the different strains. All values were calculated from at least five different CCCP concentrations.
Table 3.
Strain list.
| Strain | Genotype | Reference |
|---|---|---|
| MC4100 | F- araD139 Δ(argF-lac)U169 λ rpsL150 relA1 deoC1 flhD5301 Δ(fruK-yeiR)725(fruA25), rbsR22, Δ(fimB-fimE)632(::IS1) | [47] |
| CP630 | Like MC4100, but ΔhyaB | This study |
| CP631 | Like MC4100, but ΔhybC | This study |
| CP734 | Like MC4100, but ΔhyaB ΔhybC | [24] |
| HDK103 | Like MC4100, but ΔhyaB ΔhycA-I | [48] |
© 2020 by the authors. Licensee MDPI, Basel, Switzerland. This article is an open access article distributed under the terms and conditions of the Creative Commons Attribution (CC BY) license (http://creativecommons.org/licenses/by/4.0/).
Share and Cite
MDPI and ACS Style
Telleria Marloth, J.; Pinske, C. Susceptibility of the Formate Hydrogenlyase Reaction to the Protonophore CCCP Depends on the Total Hydrogenase Composition. Inorganics 2020, 8, 38. https://0-doi-org.brum.beds.ac.uk/10.3390/inorganics8060038
AMA Style
Telleria Marloth J, Pinske C. Susceptibility of the Formate Hydrogenlyase Reaction to the Protonophore CCCP Depends on the Total Hydrogenase Composition. Inorganics. 2020; 8(6):38. https://0-doi-org.brum.beds.ac.uk/10.3390/inorganics8060038
Chicago/Turabian StyleTelleria Marloth, Janik, and Constanze Pinske. 2020. "Susceptibility of the Formate Hydrogenlyase Reaction to the Protonophore CCCP Depends on the Total Hydrogenase Composition" Inorganics 8, no. 6: 38. https://0-doi-org.brum.beds.ac.uk/10.3390/inorganics8060038
Note that from the first issue of 2016, this journal uses article numbers instead of page numbers. See further details here.