Review

Structure: Function Studies of the Cytosolic, Mo- and NAD+-Dependent Formate Dehydrogenase from Cupriavidus necator

1
Department of Biochemistry, University of California, Riverside, CA 92521, USA
2
Department of Biochemistry and the Biochemistry and Molecular Biology Graduate Program, University of California, Riverside, CA 92521, USA
3
Department of Biochemistry and the Environmental Toxicology Graduate Program, University of California, Riverside, CA 92521, USA
4
Bioengineering Graduate Program, University of California, Riverside, CA 92521, USA
5
Department of Chemical and Environmental Engineering, University of California, Riverside, CA 92521, USA
*
Authors to whom correspondence should be addressed.
Submission received: 19 May 2020 / Revised: 23 June 2020 / Accepted: 28 June 2020 / Published: 6 July 2020

Abstract

:
Here, we report recent progress our laboratories have made in understanding the maturation and reaction mechanism of the cytosolic and NAD+-dependent formate dehydrogenase from Cupriavidus necator. Our recent work has established that the enzyme is fully capable of catalyzing the reverse of the physiological reaction, namely, the reduction of CO2 to formate using NADH as a source of reducing equivalents. The steady-state kinetic parameters in the forward and reverse directions are consistent with the expected Haldane relationship. The addition of an NADH-regenerating system consisting of glucose and glucose dehydrogenase increases the yield of formate approximately 10-fold. This work points to possible ways of optimizing the reverse of the enzyme’s physiological reaction with commercial potential as an effective means of CO2 remediation. New insight into the maturation of the enzyme comes from the recently reported structure of the FdhD sulfurase. In E. coli, FdhD transfers a catalytically essential sulfur to the maturing molybdenum cofactor prior to insertion into the apoenzyme of formate dehydrogenase FdhF, which has high sequence similarity to the molybdenum-containing domain of the C. necator FdsA. The FdhD structure suggests that the molybdenum cofactor may first be transferred from the sulfurase to the C-terminal cap domain of apo formate dehydrogenase, rather than being transferred directly to the body of the apoenzyme. Closing of the cap domain over the body of the enzymes delivers the Mo-cofactor into the active site, completing the maturation of formate dehydrogenase. The structural and kinetic characterization of the NADH reduction of the FdsBG subcomplex of the enzyme provides further insights in reversing of the formate dehydrogenase reaction. Most notably, we observe the transient formation of a neutral semiquinone FMNH·, a species that has not been observed previously with holoenzyme. After initial reduction of the FMN of FdsB by NADH to the hydroquinone (with a kred of 680 s−1 and Kd of 190 µM), one electron is rapidly transferred to the Fe2S2 cluster of FdsG, leaving FMNH·. The Fe4S4 cluster of FdsB does not become reduced in the process. These results provide insight into the function not only of the C. necator formate dehydrogenase but also of other members of the NADH dehydrogenase superfamily of enzymes to which it belongs.

1. Introduction

The molybdenum- and tungsten-dependent formate dehydrogenases have drawn increased attention over the past 5–10 years due to the demonstration that under the appropriate conditions, most, if not all, are able to catalyze the reverse reaction, reduction of CO2 to formate, under the appropriate conditions. Indeed, some enzymes of this family, which include the closely related formylmethanofuran dehydrogenases of the Wood–Ljungdahl pathway, function physiologically to reduce CO2 to formate in what is probably the most evolutionarily ancient mechanism of carbon fixation.
Cupriavidus necator H16 (previously known as Ralstonia eutropha) has four formate dehydrogenases, of which, two are cytosolic enzymes that utilize NAD+ as oxidizing substrate [1,2]. One of these contains molybdenum and is encoded by the fdsGBACD operon, the other possesses tungsten and is encoded by the fdwAB operon (presumably enlisting additional subunits from the fds operon) [3]. The molybdenum-containing enzyme was originally isolated and characterized by Bowien and coworkers, who showed that the mature holoenzyme belongs to the NADH dehydrogenase superfamily of enzymes [4,5,6]. The FdsA, FdsB, and FdsG subunits are homologous to corresponding subunits in the cytosolic arm of NADH dehydrogenase [7,8,9,10]. FdsA is homologous to the Nqo3 subunit of the NADH dehydrogenase from Thermus thermophilus [8,9], although the latter lacks a molybdenum center as found in the former [7]. The homology between FdsA and Nqo3 includes the presence of a histidine ligand to one of the Fe4S4 clusters. The C-terminal domain of FdsA, containing the molybdenum center, is also homologous to the crystallographically characterized FdhF formate dehydrogenase of E. coli, with the molybdenum-coordinating Cys 378 of FdsA equivalent to Sec 140 in FdhF [11]. The Fe4S4- and FMN-containing FdsB subunit is homologous to the T. thermophilus Nqo1 subunit and like Nqo1 also possesses a binding site for NADH/NAD+. The FdsG subunit is homologous to the T. thermophilus Nqo2 subunit and has a single Fe2S2 cluster. We report here recent work from our laboratories on both mechanistic and structural aspects of the C. necator enzyme.

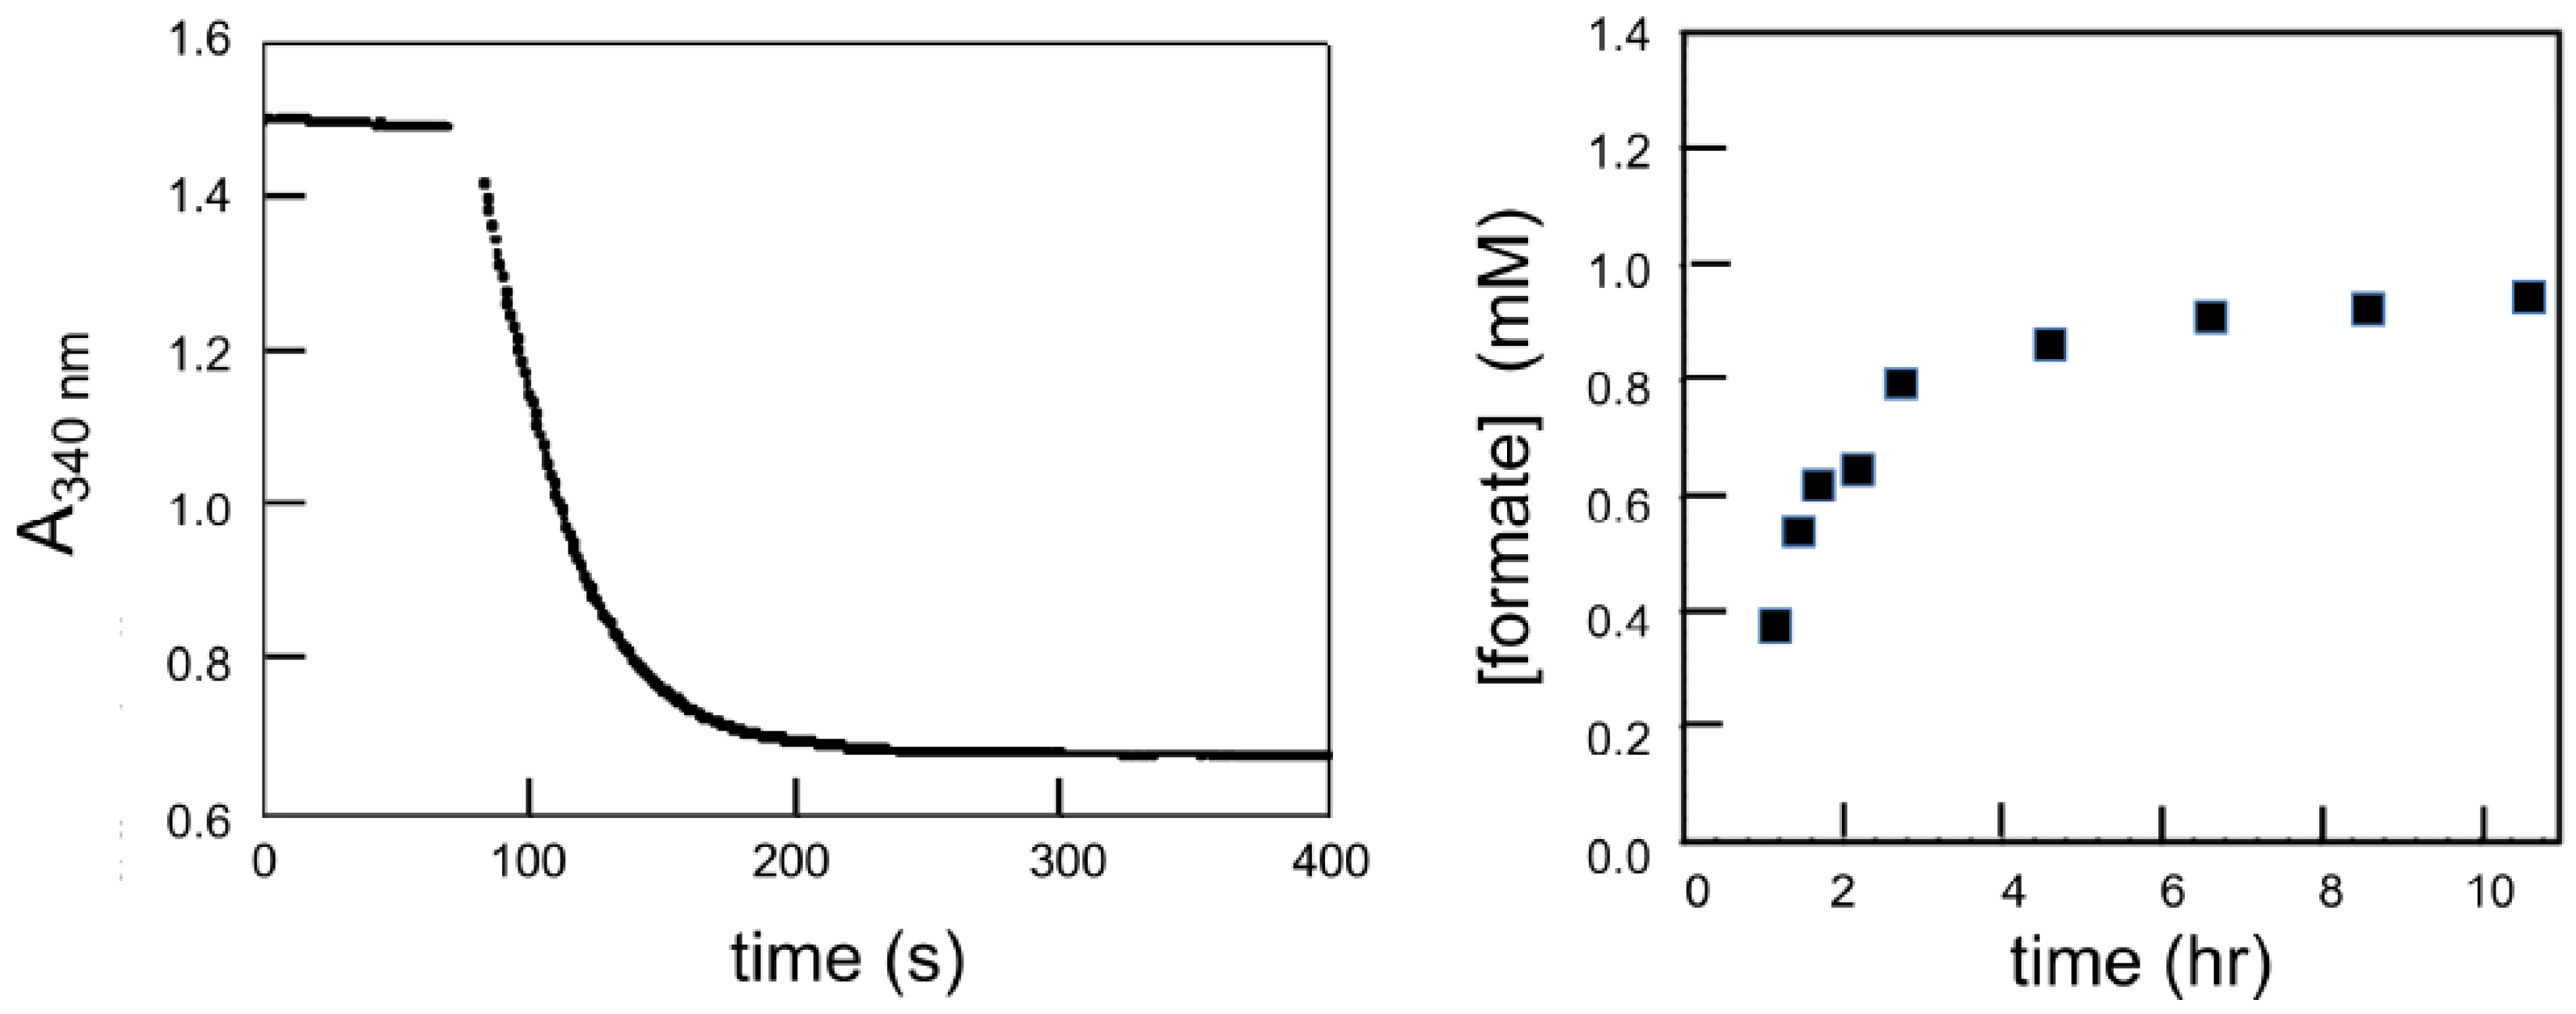
2. Catalysis of CO2 Reduction by the C. necator Formate Dehydrogenase

Under physiological conditions, reducing equivalents enter the C. necator formate dehydrogenase holoenzyme at its molybdenum center and leave at the FMN, reducing NAD+ to NADH; electron transfer between the molybdenum and flavin, which are separated by some 55 Å [10], is mediated by the intervening iron–sulfur clusters. Although originally reported to be unable to catalyze the CO2 by NADH, we have recently shown that the enzyme is indeed capable of doing so when CO2 (not bicarbonate) is used as substrate [12]. This is consistent with a mechanism for formate oxidation involving direct hydride transfer of the Cα-H to the MoVI = S group of the L2MoVIS(S-Cys) molybdenum center (where L is the bidentate enedithiolate-coordinated pyranopterin cofactor found in molybdenum- and tungsten-containing enzymes, present in this enzyme as the guanine dinucleotide) to L2MoIV(SH)(S-Cys), with CO2 rather than bicarbonate as the immediate product of the reaction [13]. The steady-state kinetic parameters have been determined in both the forward and reverse directions and are shown in Table 1.
The Haldane relationship for these parameters for an enzyme, such as formate dehydrogenase operating via a ping-pong mechanism with separate sites for the reductive and oxidative half-reactions, is as follows:
K eq = ( k cat forward ) ( K m formate ) · ( k cat forward ) ( K m NAD + ) ( k cat reverse ) ( K m CO 2 ) · ( k cat reverse ) ( K m NADH ) = ( 201   s 1 ) ( 130   μ M ) · ( 201   s 1 ) ( 310   μ M ) ( 10   s 1 ) ( 2700   μ M ) · ( 10   s 1 ) ( 46   μ M ) = 1250
The value 1250 compares favorably with the Keq calculated from the 100 mV difference between ΔE0′ for the NAD+/NADH and CO2/formate couples of 2100, the disparity reflecting a ~10% uncertainty in kcatforward and kcatreverse, which are squared terms in numerator and denominator, respectively, of Equation (1).
The reaction can be pushed significantly in the direction of CO2 reduction by the addition of an NADH regeneration system [14]. As shown in Figure 1 left, addition of a catalytic amount of formate dehydrogenase to a solution that is 29.5 mM in CO2 (at 30 °C) and 300 µM in NADH results in the formation of 120 µM formate (as quantified by ion chromatography) and 130 µM NAD+—in other words, the reaction is tightly coupled. When the experiment is repeated with the addition of 50 mM glucose and a catalytic amount of glucose dehydrogenase for NADH regeneration, the amount of formate generated increases approximately 10-fold to 1.0 mM (Figure 1 right). This illustrates the potential commercial use of the enzyme for generation of formate from CO2 using a suitable source of reducing equivalents.

3. Insertion of the Molybdenum Cofactor into Formate Dehydrogenase and Other Members of the DMSO Reductase Family

As is seen with all members of the DMSO reductase family of molybdenum enzymes, the active site molybdenum center is deeply buried in the C-terminal domain of the FdsA subunit, and the means by which it is introduced into the apoenzyme is not presently understood. Given the extensive structural homology of this domain to the E. coli FdhF, one can consider the overall topology of the latter which consists of three interlaced domains that constitute the body of the protein, and a contiguous C-terminal domain that constitutes a “cap” over the cofactor in the holoenzyme (Figure 2A [11]). It is now well-accepted that all the Mo- and W-containing formate dehydrogenases possess a M=S group that is inserted into the metal coordination sphere as the final step of cofactor maturation [15]. Sulfur forms a more covalent bond with molybdenum and tungsten than does the more electronegative oxygen. As a result, there is less formal negative charge on the sulfur, e.g., making it better able to accept a hydride in the course of the reaction. A similar argument has been made in the case of xanthine oxidase and related enzymes, which also require a Mo=S [10]. The sulfur transferase catalyzing this reaction (the product of the fdhD gene in E. coli, fdsC in the C. necator operon) is also thought to play a role in the insertion process, and the X-ray crystal structure of FdhD has recently been reported with two equivalents of GDP bound at the presumed position of the maturing molybdenum center [16]. Modeling the cofactor into the structure yields a complex with the apex of the molybdenum coordination sphere pointing into the channel through which the catalytically essential sulfur is delivered (via a cysteine desulfurase), with the bis(MGD) portion of the cofactor presenting a concave basket to the surface of the complex; the pyranopterin portion of both cofactors is solvent-exposed with the principal interactions with FdhD principally involving the guanine dinucleotide extensions of the cofactor (Figure 2B). In this orientation, the cofactor cannot be transferred directly to the body of the apo FdhF, where it is also oriented concave outwards with the two guanine dinucleotide arms extended into the protein, not out toward solvent. On the other hand, the molybdenum center in FdhF interacts with the cap domain of the protein principally via its pyranopterin rings, interacting minimally with the guanine dinucleotide arms. This being the case, it is possible to dock the cap (with bound cofactor) to the dimeric FdhD2·(GDP)2 complex in such a way that the GDP arms overlap; both proteins are in a position to interact optimally with the cofactor sandwiched between them. If this interaction is physiologically significant, the implication is that FdhD passes the now sulfurated and mature cofactor not to the body of apo FdhF but to its cap, which then closes over the body swinging the cofactor into position in the active site. In this way the highly unstable cofactor is never released into free solution. There have been a number of efforts in the past to identify regions on the surface of DMSO reductase family enzymes that interact with the cofactor insertion machinery. If the above analysis is correct, then this surface, on the face of the C-terminal cap domain that interfaces with the body of the enzyme, is buried in the structure of the holoenzyme. In support of this model, the C-terminal cap domains of the apo forms of both E. coli trimethylamine-N-oxide reductase TorA [17] and E. coli periplasmic nitrate reductase NapA [18] in complex with their respective chaperones TorD and NapD (that recognize the proteins’ N-terminal twin-Arg signal sequence that targets them to the periplasm) have been reported to assume an open position in readiness to accept the mature molybdenum cofactor. This indicates that the C-terminal cap domain is indeed able to adopt the type of open configuration that is proposed here.

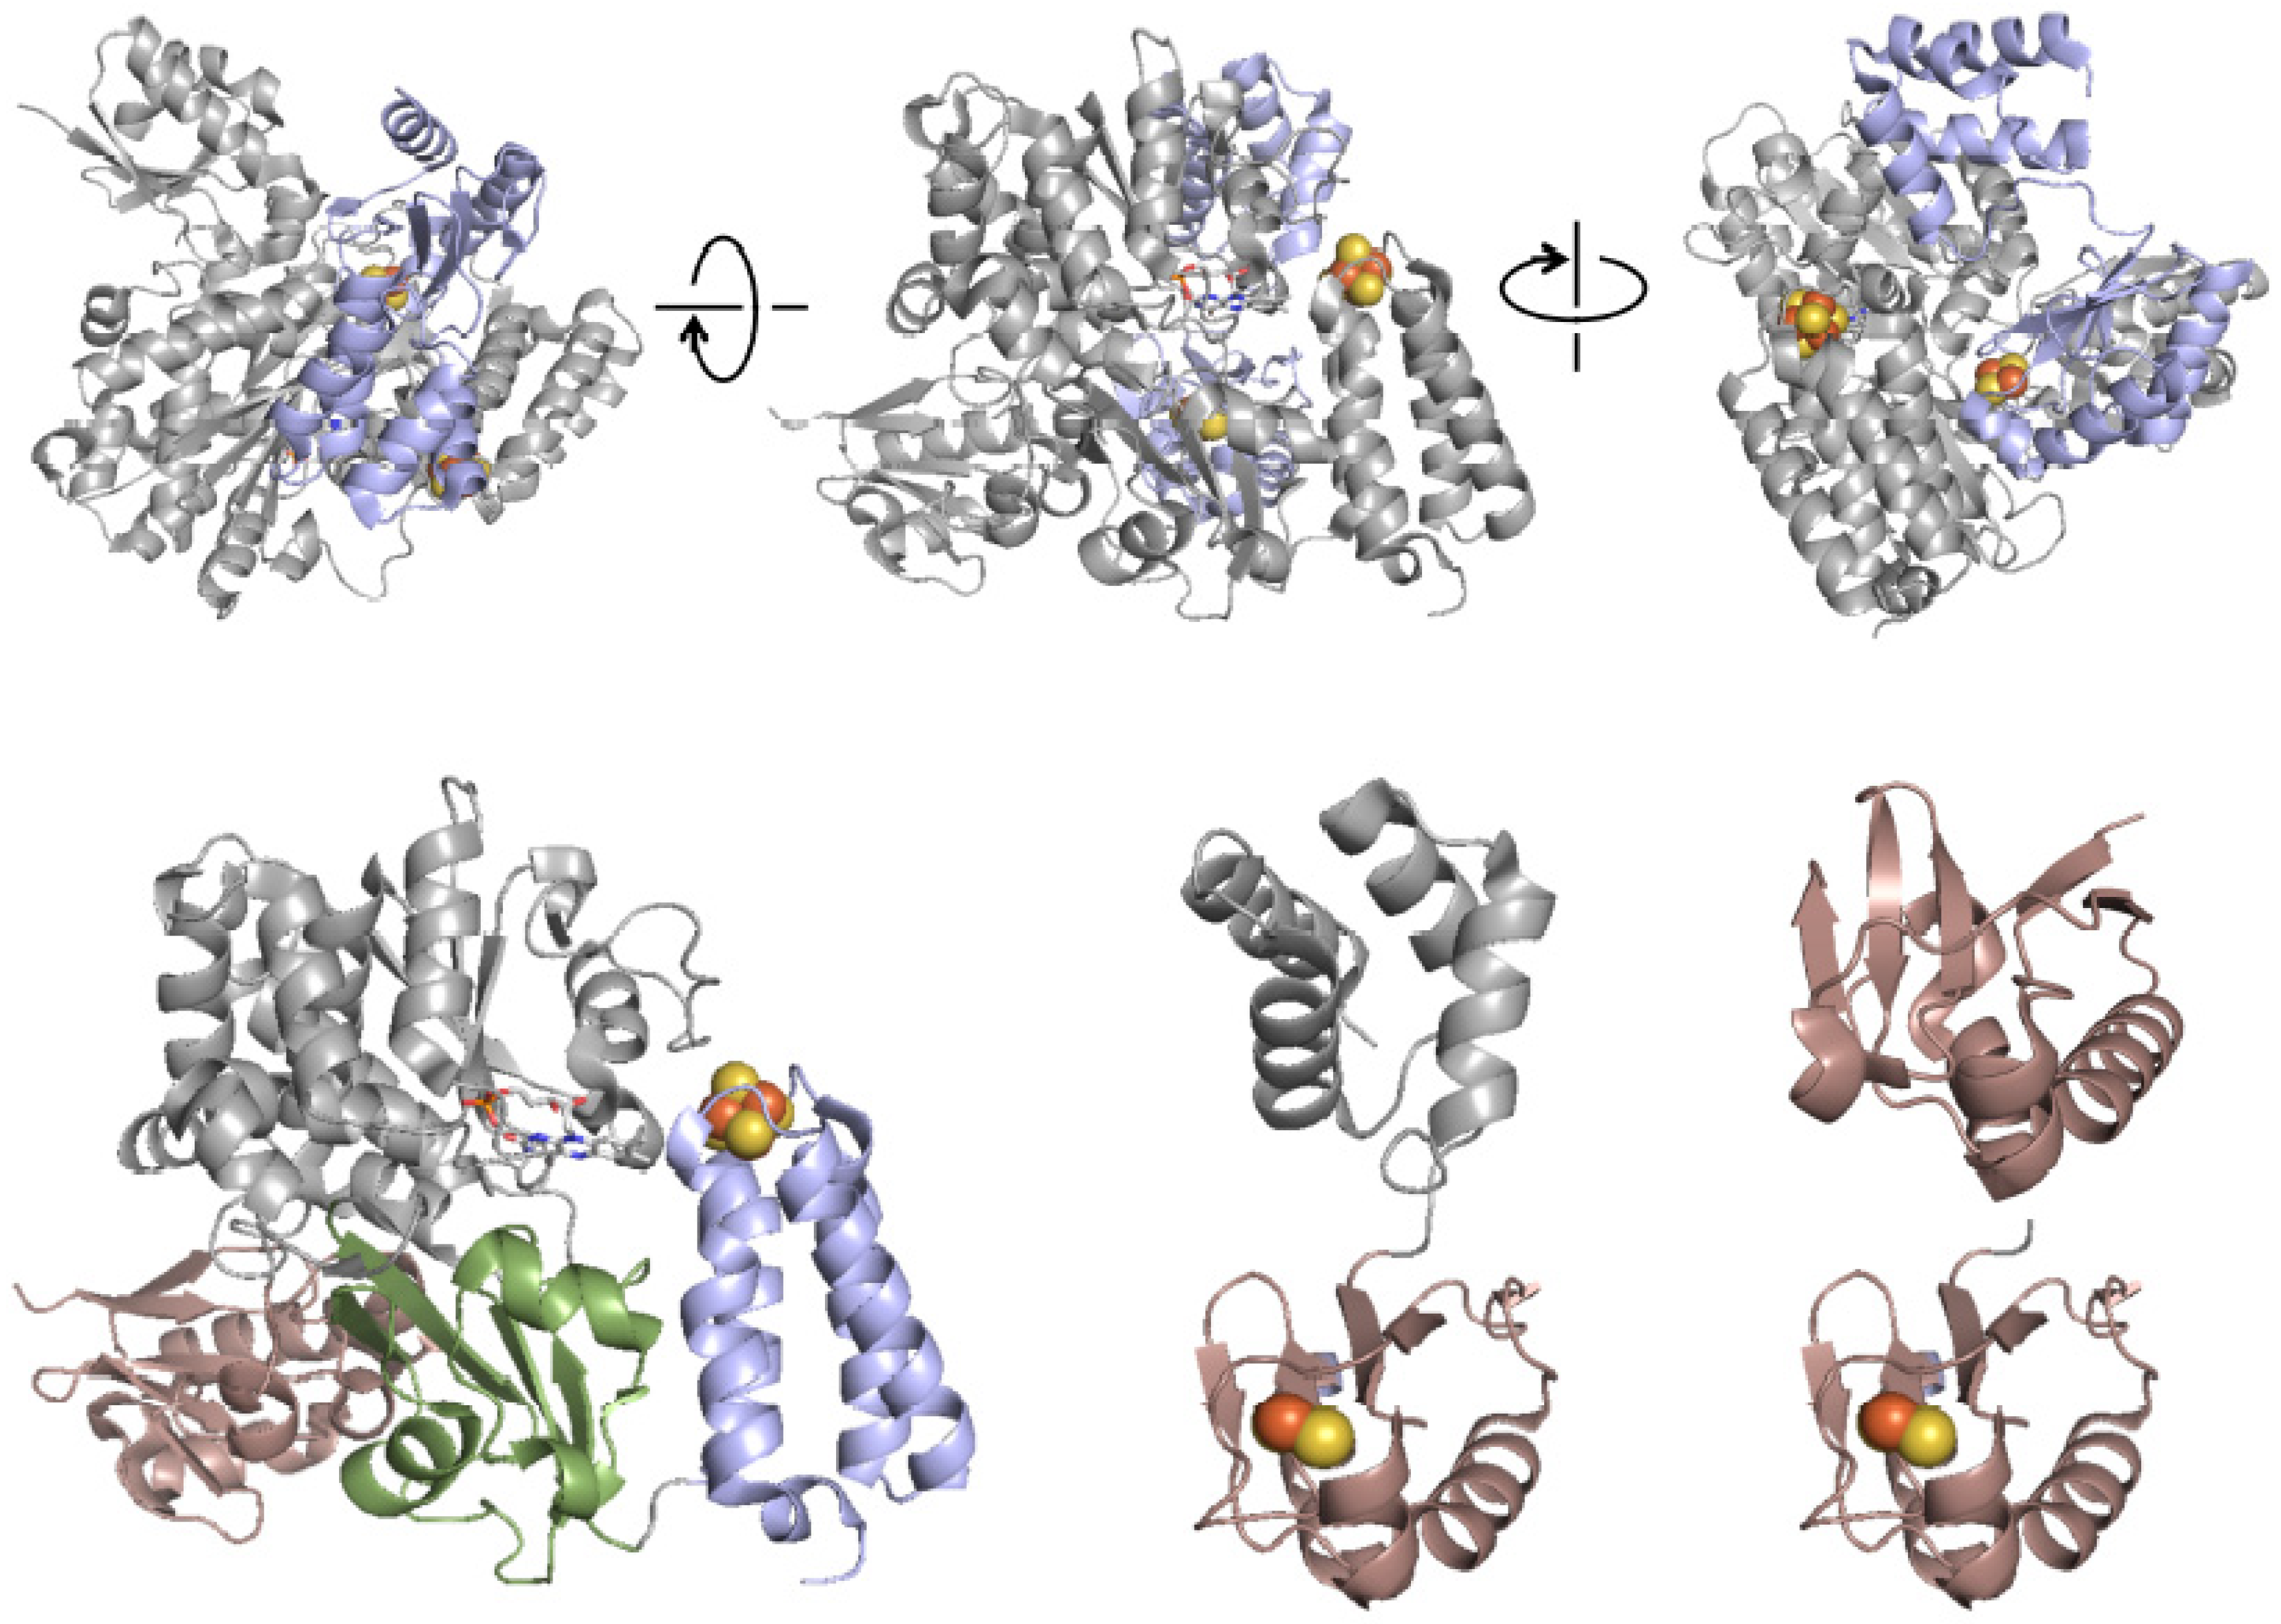
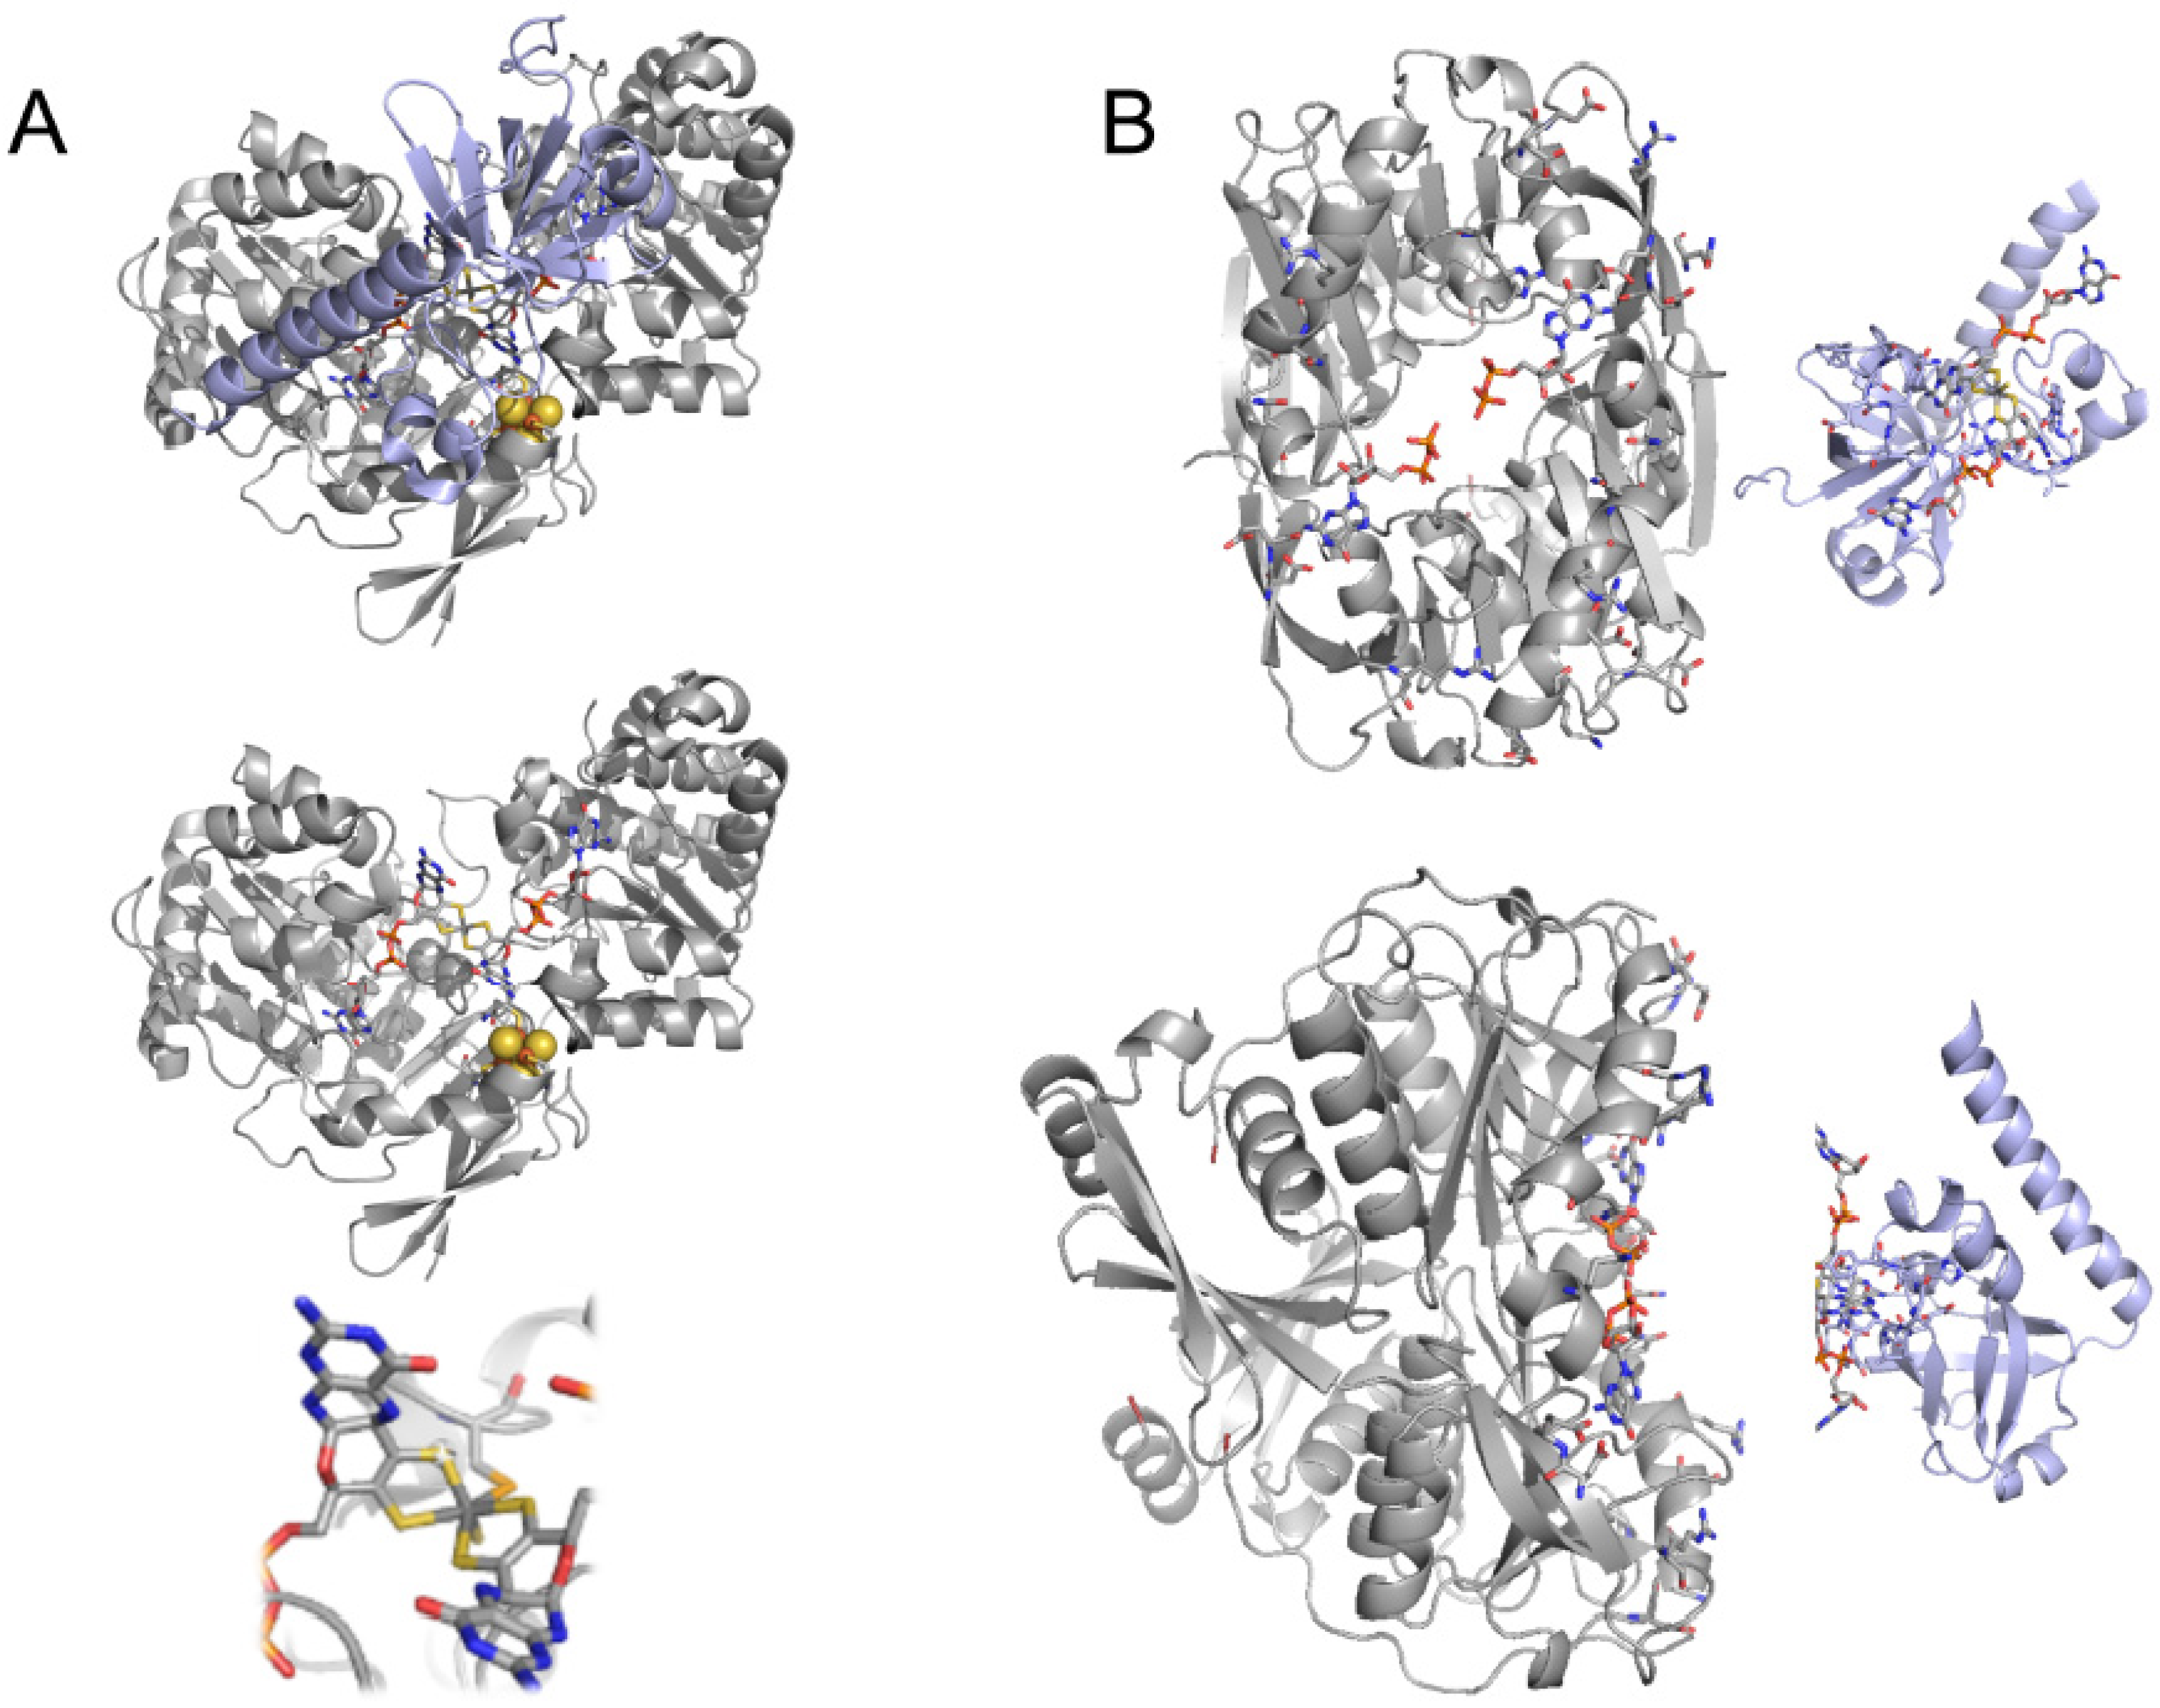
4. The Crystal Structure of FdsBG

The X-ray crystal structure of the FdsBG subcomplex of the C. necator formate dehydrogenase has also been determined at a resolution of 2.3 Å [19]. This fragment of the holoenzyme contains FMN and a Fe4S4 cluster in the FdsB subunit and a Fe2S2 cluster in FdsG; it lacks the FdsA subunit that contains the molybdenum center and additional iron–sulfur clusters. As expected, the structure of each subunit is closely related to its cognate subunits in the NADH dehydrogenases from T. thermophilus and Aquifex aeolicus, FdsB being homologous to the T. thermophilus Nqo2 and A. aeolicus NuoF subunits and contains FMN and a Fe4S4 cluster, and FdsG to the T. thermophilus Nqo1 and A. aeolicus NuoE subunits and contains a Fe2S2 cluster [20]. Compared to the A. aeolicus NuoF, FdsB has an RMSD of 1.48 Å for 394 Cα atoms and contains a Rossmann-like fold [21] encompassing the FMN binding site, a ubiquitin-like and a four-helix domain containing the Fe4S4 cluster [22] (Figure 3); all these structural elements are shared with NuoF. The Fe4S4 cluster is in a mostly hydrophobic environment close to the protein surface and is bound by C443B, C446B, C449B, and C489B (superscript B indicating the residue is in FdsB). The principal structural differences between FdsB and NuoF are in surface loops of the protein. However, the N-terminal portion of FdsB consists of a thioredoxin-like fold [20] not seen in NuoF or Nqo1. This domain lacks the Fe2S2 cluster typical of thioredoxins owing to mutation of the iron-coordinating cysteines (P10B, A15B, S45B, and F49B). This resembles the C-terminal portion of FdsG (RMSD 1.97 Å for 71 Cα atoms of the core of the domain) that contains the Fe2S2 cluster (vide infra).
The FdsG subunit is homologous to the NuoE subunit of A. aeolicus NADH dehydrogenase, consisting of an N-terminal four-helical bundle (residues 29G–74G) and a C-terminal thioredoxin-like domain (residues 79G–159G) that possesses the subunit’s Fe2S2 cluster. These two domains are connected by a four-amino acid linker and are rotated by ~26° relative to the orientation seen in NuoE.
It is to be noted that while the N-terminal domains of FdsG and NuoE both have four helices, the first helix of FdsG runs parallel, but in NuoE, it runs across the second and third helices. The C-terminal thioredoxin-like domain of FdsG resembles the N-terminal thioredoxin-like domain of FdsB, but unlike the cofactorless FdsB domain, the FdsG domain contains a spinach ferredoxin-like Fe2S2 cluster [19]. This iron–sulfur cluster is again in a hydrophobic environment near the surface, coordinated by C86G, C91G, C127G, and C131G. Like A. aeolicus NuoE (but unlike T. thermophilus Nqo1), the C-terminus of FdsG is truncated at its C-terminus and lacks a disulfide bond.
At the FdsB–FdsG interface, two helices of the N-terminal four-helical bundle domain of FdsG contact the Rossmann-like domain of FdsB, as seen in the subunit interface between NuoE and NuoF. FdsG’s C-terminal thioredoxin-like domain interacts with the same surfaces of the ubiquitin-like and Rossmann-like domains of FdsB as do the corresponding structural elements of NuoE and NuoF. The different placement of the ubiquitin and of the 183B–190B loop in FdsB as compared to NuoE results in an increase in the distance between the Fe2S2 cluster of FdsG and the Fe4S4 cluster of FdsB, being of ~1.0 Å as compared to the separation seen in NuoEF.
At a distance of nearly 21 Å (edge-to-edge), direct electron transfer between the two Fe/S clusters is expected to be extremely slow and unlikely to be physiologically relevant. On the other hand, each cluster is within 12 Å of the FMN isoalloxazine ring (Figure 4). Given the model that has been constructed for the holoenzyme based on the structures of FdhF and Nqo123, the Fe4S4 cluster of FdsB clearly lies on-path for electron transfer between the molybdenum center and FMN of the formate dehydrogenase, while the Fe2S2 cluster of FdsG is off-path. In the NADH dehydrogenases, it has been suggested that this cluster may serve to temporarily store electrons during electron transfer out of the FMN once it has been reduced by NADH (vide infra). The FMN in FdsB is surrounded by a network of interactions that is also conserved in other NADH dehydrogenase-like enzymes [20,23] and is part of the solvent-accessible cavity that constitutes the NAD+/NADH binding site. The C8-methyl of the FMN points towards the Fe4S4 cluster, with the C4=O facing the Fe2S2 cluster (Figure 4).

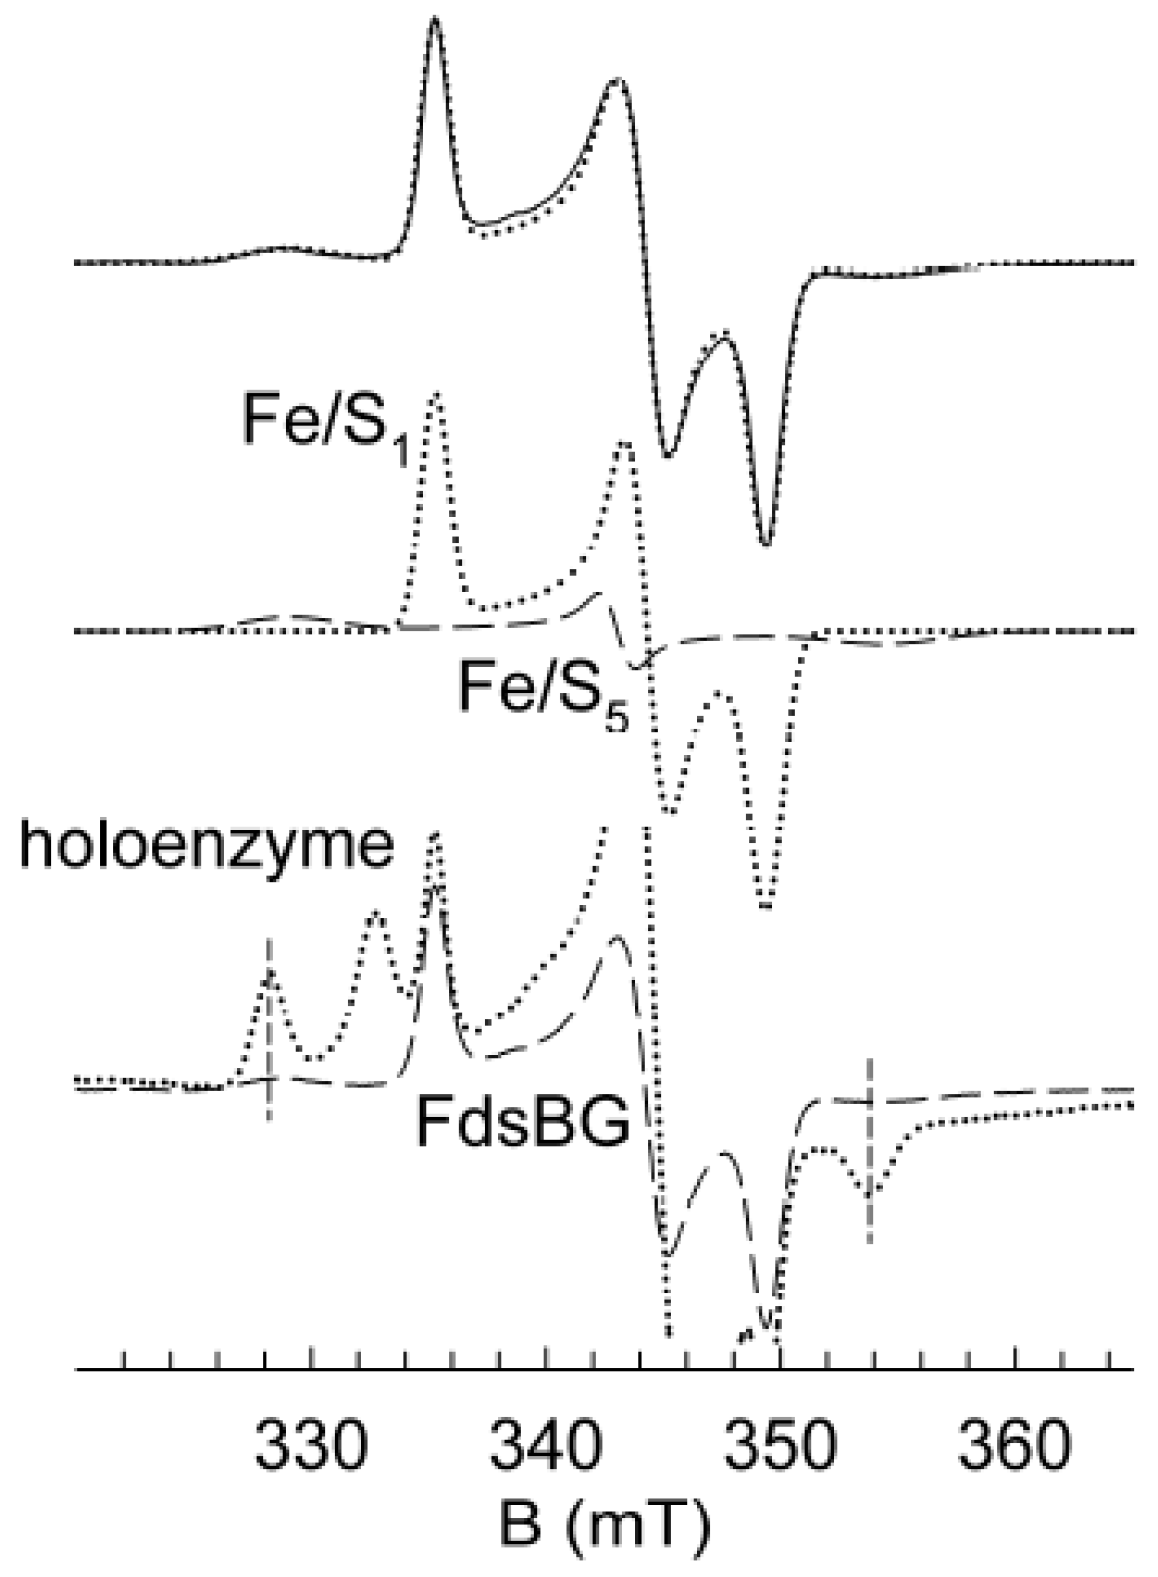
5. EPR Characterization of the Iron–Sulfur Clusters of FdsBG

Extended incubation of FdsBG complex with sodium dithionite (pH 7.0) yields two signals (as seen in Figure 5 top). The first is seen at liquid nitrogen temperatures as high as 200 K, with g1,2,3 = 2.000, 1.948, and 1.920 and linewidths of 1.4, 1.7, and 1.6 mT, respectively. These values are in good agreement with previously reported parameters for the cluster designated as Fe/S1 for holoenzyme (Figure 5 middle, dotted spectrum) [13]. The second signal is seen only below 20 K and has g1,2,3 = 2.039, 1.955, and 1.891, and linewidths of 4.5, 1.4, and 5.3 mT (Figure 5 middle, dashed spectrum). This signal has not been previously seen with the holoenzyme [13], owing to its low intensity, broad linewidths, and overlap with the much stronger Fe/S3 signal, and is designated Fe/S5. In the A. aeolicus NuoEF and T. thermophilus Nqo12 NADH dehydrogenases, only the Fe2S2 clusters exhibit EPR signals at 77 K, while the Fe4S4 signals appear only below 50 K [24]. Further, the g-values g1,2,3 = 2.004, 1.945, and 1.917 for the N1a Fe2S2 cluster of the 24 kDa subunit of bovine complex I [25] (the homolog to FdsG) are in very good agreement with the Fe/S1 signal seen here in FdsBG, and accordingly, the Fe/S1 signal has been assigned to the Fe2S2 cluster of FdsG. The signal assigned to the N3 Fe4S4 cluster in the NADH dehydrogenase systems, with g-values of g1,2,3 = 2.037, 1.945, and 1.852, is also in good agreement with the Fe/S5 signal of the FdsBG complex, and we accordingly assign the Fe/S5 signal to the Fe4S4 cluster of FdsB. The Fe/S1 signal seen with holoenzyme was initially assigned to the His-coordinated Fe4S4 cluster of FdsA (Figure 5 bottom, dotted spectrum) [13], but that is clearly incorrect as FdsBG exhibits the signal. The Fe/S5 signal has similar g-values to those reported for the previously observed Fe/S3, but the signal-giving cluster couples to the molybdenum center and must be the proximal Fe4S4 cluster to the molybdenum center in FdsA; the Fe/S5 signal must, therefore, be a new signal not seen previously with holoenzyme. The assignment of EPR signal Fe/S5 to the Fe4S4 cluster of FdsB is consistent with our previously published structural model of holoformate dehydrogenase placing the Fe4S4 cluster near FdsA in the intact holoenzyme and on-path between the molybdenum and FMN of the enzyme [10].

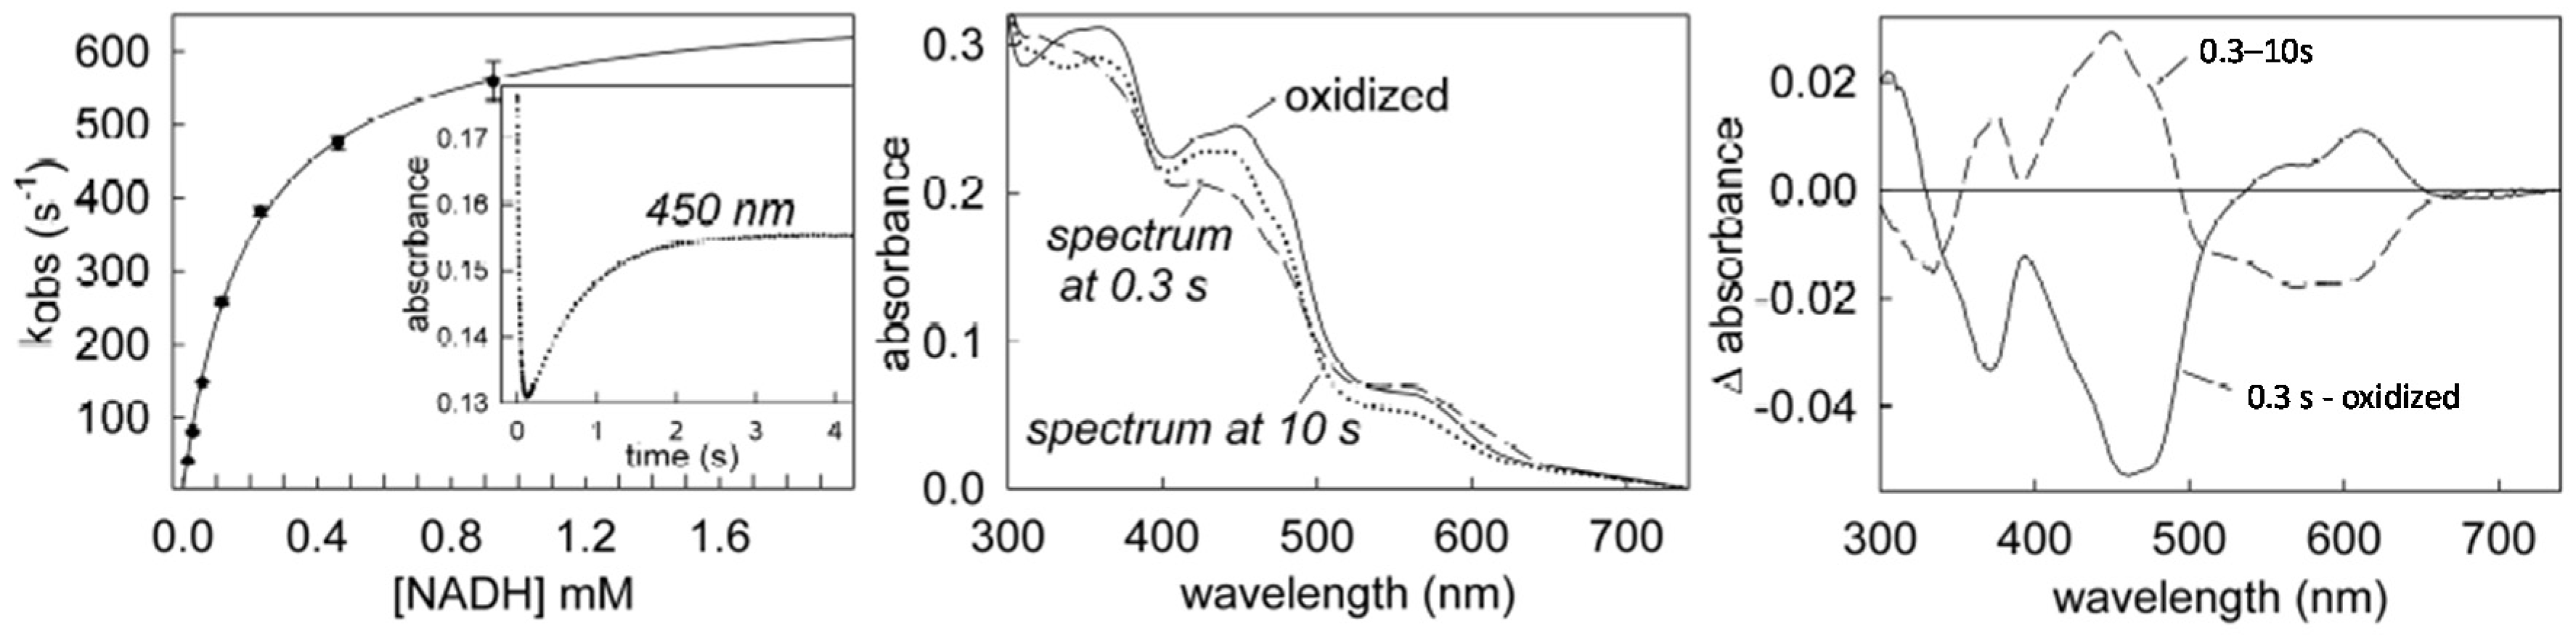
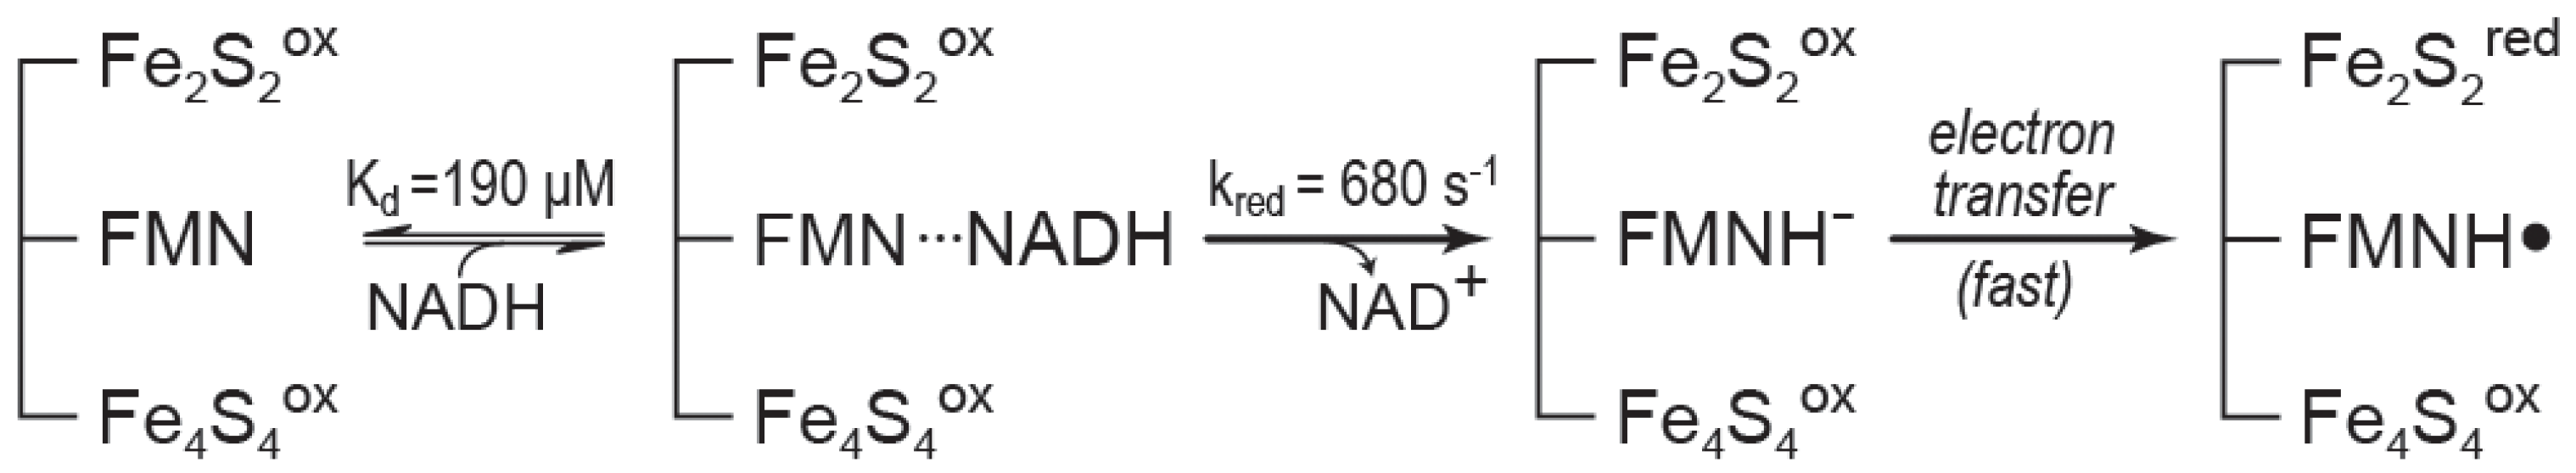
6. Rapid-Reaction Kinetics of FdsBG Reduction by NADH

The rapid-reaction kinetics of FdsBG reduction by NADH have also been examined. This is the reverse of the physiological reaction for the formate dehydrogenase, but is the physiological direction seen in the NADH dehydrogenases. A typical kinetic transient is shown in the inset of Figure 6 left. The reaction is biphasic, with the fast phase of the reaction completing within 120 ms. A plot of the observed kfast as a function of NADH is hyperbolic (Figure 6 left), yielding a limiting kred of 680 s−1 and KdNADH of 190 µM at 5 °C. We note that this rate is more than sixfold faster than the limiting rate of reduction of holoenzyme at high formate, some 20-fold faster than kcat for formate oxidation (13), and 350-fold faster than kcat for CO2 reduction [12] under comparable conditions.
When the reaction was repeated using substoichiometric NADH (so that the FdsBG1e- formed on disproportionation will not be further reduced by reaction with a second equivalent of NADH), the absorbance increase seen at the end of the fast phase of the reaction implies formation of the neutral semiquinone FMNH· (Figure 6 center, dashed). This species has not seen in previous work with holoenzyme and must be the result of transfer of a single electron from the fully reduced flavin hydroquinone (formed on its initial two-electron reduction by NADH) to the Fe2S2 cluster of FdsG iron, leaving the flavin as FMNH· (and giving rise to the Fe/S1 EPR signal; see further below and Scheme 1). On a second, slower timescale, two equivalents of the FdsBG2e- formed upon reaction with NADH disproportionate to give one equivalent each of FdsBG1e- and FdsBG3e-. To the extent this occurs, FdsBG1e- will have its Fe2S2 cluster (Fe/S1) reduced and its FMN oxidized, whereas FdsBG3e- will have both Fe/S1 and the FMN reduced.
The UV/Visible signature of FMNH· [26] is seen as the positive feature in the 500–650 nm region in the difference spectrum between fully oxidized enzyme and that collected at 0.3 s after the initial reaction of FdsBG with NADH (Figure 6 right, black spectrum). The extended negative feature in the 300–500 nm region is due to reduction of the Fe/S clusters. The subsequent disappearance of the FMNH· formed in the fast phase of the reaction is reflected in the pronounced negative feature in the 500–650 nm region seen in the 0.3–10 s difference spectrum (Figure 6 right, dashed difference spectrum). Here, the two broad, negative peaks centered at 570 and 605 nm reflect the presence of FMNH· at 0.3 s but its loss over the next 10 s. Formation of FMNH· has independently been confirmed in a freeze-quench EPR experiment. Figure 7 shows the spectrum seen at 150 K when FdsBG is reacted with NADH and frozen after ~40 ms (Top), which exhibits the EPR signatures of both FMNH· and Fe/S1. In addition to demonstrating the formation of FMNH·, this experiment establishes that it is the Fe2S2 cluster of FdsG that becomes reduced in forming FMNH·. Subtracting out the Fe/S1 signal from the measured EPR spectrum yields an isotropic EPR signal with a giso = 2.003 and a linewidth of ~1.9 mT, reflecting formation of the neutral rather than anionic semiquinone (Figure 7 middle) [27,28]. No additional iron–sulfur signal attributable to the Fe/S4 signal is seen at 9 K, even when the experiment is repeated in the presence of excess NADH, indicating that it does not get reduced in the course of reduction of FdsBG by NADH (Figure 7 bottom).

7. The Thioredoxin-Like Domain of FdsB

The N-terminal thioredoxin-like domain of FdsB is extremely similar to the Fe2S2 ferredoxin domain from A. aeolicus [21], which like the C. necator formate dehydrogenase is known to dimerize. The largest contact interface between the two FdsBG protomers within the asymmetric unit of the crystal is between the two FdsB thioredoxin-like domains, suggesting that these contribute significantly to the dimerization of the holoenzyme.
The buried area is small (~560 Å2), however, with only a few specific interactions across the interface, which are not highly conserved among the NADH dehydrogenase family. In addition, FdsBG remains monomeric throughout purification. It thus appears that the dimer seen in the asymmetric unit is simply the result of crystal packing [29,30].

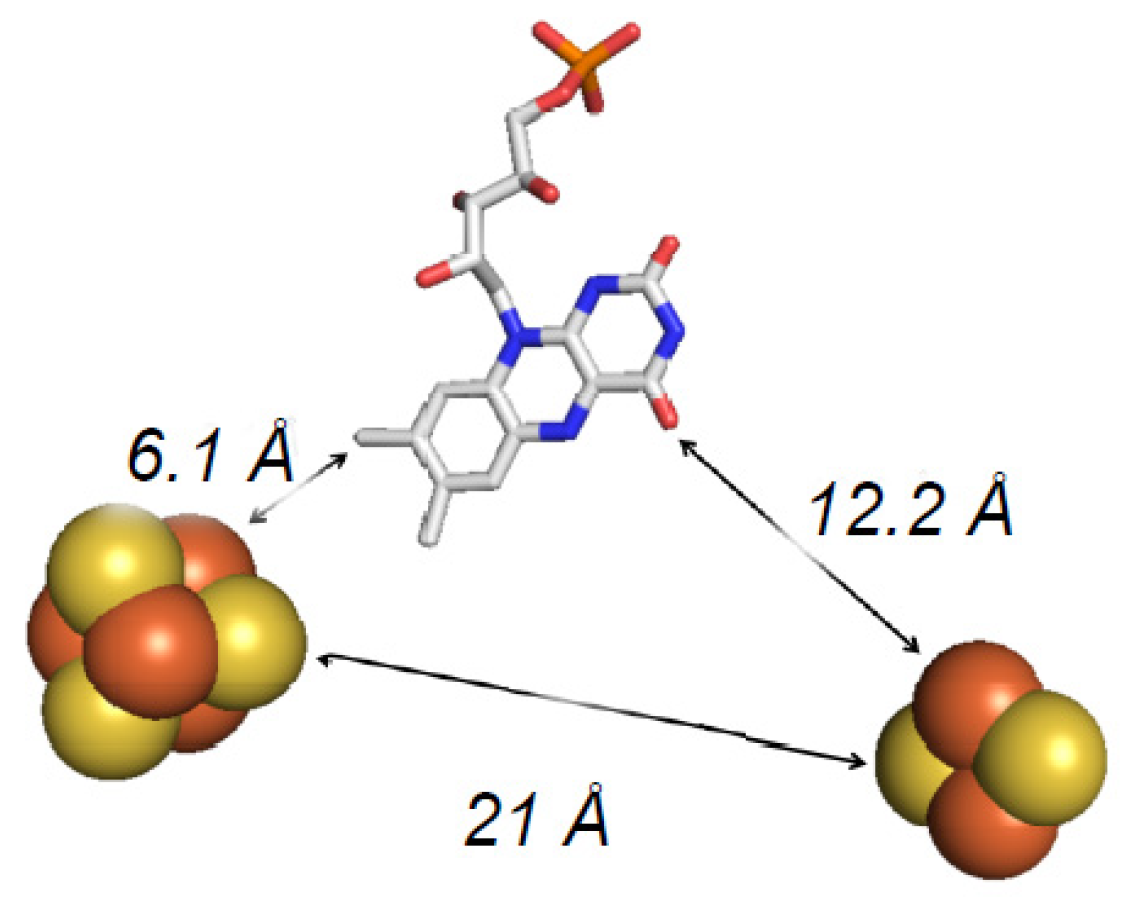
8. Electron Transfer in FdsBG

During normal turnover with holoformate dehydrogenase, reducing equivalents from the oxidation of formate pass from the active site molybdenum center through a chain of iron–sulfur clusters to the FMN, which ultimately reduces NAD+. FdsBG is able to reduce NAD+, as are the corresponding subcomplexes from NADH dehydrogenases [31,32] and the NAD+-reducing hydrogenase [33]. Consistent with the Fe4S4 cluster of FdsB being on-path between the molybdenum center and FMN, it lies close to the C8-methyl of FMN and to highly conserved surface residues that are implicated in the interaction of FdsB with FdsA (i.e., E441B–S487B, I451B–G452B, and K292B–L298B). By contrast, the Fe2S2 cluster of FdsG lies further from the region implicated in FdsA binding. Nevertheless, as summarized in Scheme 1, the present evidence indicates that the initial electron transfer event out of the FMN in FdsB upon reduction by NADH is to the off-path Fe2S2 cluster, which has the higher reduction potential relative to the on-path Fe4S4 cluster. In the case of the NADH dehydrogenases, a similar electron transfer to the Fe2S2 cluster is thought to minimize formation of neutral flavin semiquinone, FMNH·, thereby reducing the accumulation of reactive oxygen species [20,22].

9. Concluding Remarks

The cytosolic and NAD+-dependent formate dehydrogenase is fully capable of catalyzing the reduction of CO2 to formate using NADH as a source of reducing equivalents. The values for the forward and reverse steady-state kinetic parameters are consistent with the expected Haldane relationship. The addition of an NADH-regenerating system consisting of glucose and glucose dehydrogenase increases the yield of formate approximately 10-fold, suggesting the commercial potential of the enzyme as an effective means of CO2 remediation.
A consideration of the recently reported structure of the FdhD sulfurase that transfers a catalytically essential sulfur to the maturing molybdenum cofactor prior to insertion into apoenzyme suggests that the cofactor may first be transferred to the C-terminal cap domain of apo formate dehydrogenase, which then closes over the body of the enzyme to assemble the active site, rather than transferring the cofactor directly to the body of the protein.
The X-ray crystal structure of the FdsBG fragment of the C. necator formate dehydrogenase is reviewed, as are the kinetics of its reduction by NADH. Notably, the neutral semiquinone FMNH· is observed transiently in the course of the reaction of FdsBG with NADH. In a reaction analogous to the physiological reduction of NADH dehydrogenases by NADH, after initial reduction of the FMN of FdsB by NADH to the hydroquinone (with a kred of 680 s−1 and Kd of 190 µM), one electron is rapidly transferred to the Fe2S2 cluster of FdsG, leaving FMNH·, as characterized by both UV/visible spectroscopy and EPR. The Fe4S4 cluster of FdsB does not become reduced in the process.
Finally, we note that the cryo-EM structure of the R. capsulatus formate dehydrogenase, which is very similar to the C. necator enzyme that has been the focus here, has very recently been reported at a resolution of 3.3 Å [34]. The overall structure of the FdsBG fragment of the R. capsulatus protein is very much in agreement with that described here for the C. necator protein, and the overall structure is also in good agreement with that predicted previously on the basis of the structures of the E. coli FdhF formate dehydrogenase and the T. thermophilus NADH dehydrogenase [10]. Not previously anticipated is the proximity (9.5 Å edge-to-edge) of the Fe4S4 clusters designated A4 in the two FdsA subunits of the dimeric Fds(ABGD)2 dimer, which suggests reducing equivalents are able to pass easily between protomers (a situation also seen in the even more complex formylmethanofuran dehydrogenase from Methanothermobacter wolfeii [35]). Interestingly, the A4 Fe4S4 cluster is the one possessing histidine as a ligand and presumably having a higher rather than lower reduction potential. Importantly, the cryo-EM work clearly demonstrates that the small FdsD subunit is an integral component of the mature holoenzyme, interacting intimately with the C-terminal domain of FdsA and apparently stabilizing the inserted molybdenum cofactor. The position of FdsD is not inconsistent with the model for cofactor incorporation considered here, although its role in cofactor insertion remains to be elucidated. Very interestingly, evidence is presented that cryo-EM is able to distinguish between oxidized and reduced iron–sulfur clusters in complex systems. If found to be generally applicable, this would constitute a very significant advantage of the cryo-EM method over other structural methods and provide information presently obtainable by spatially resolved anomalous dispersion refinement [36].

Author Contributions

R.H. supervised the EPR and kinetic work described here, and prepared the manuscript. T.Y., S.H., and T.K.T. analyzed the X-ray crystallographic work with FdsBG under the supervision of G.M.B., who also contributed to preparation of the manuscript. D.N. performed the EPR and kinetic work described. X.Y. performed the work involving CO2 reduction to formate under the supervision of A.M., who also contributed to preparation of the manuscript. All authors have read and agreed to the published version of the manuscript.

Funding

This research was funded by a grant from the U.S. Department of Energy (DE-SC0010666 to R.H.).

Acknowledgments

We thank the staff of the following beamlines for their assistance in data collection: 5.0.1 and 5.0.2 of the Berkeley Center of Structural Biology at Advanced Light Source (ALS), 24-ID-C of the Northeastern Collaborative Access Team at Advanced Photon Source (APS), and BL7-1 of the Stanford Synchrotron Radiation Lightsource (SSRL). The Berkeley Center for Structural Biology is supported in part by the Howard Hughes Medical Institute. The Advanced Light Source is a Department of Energy Office of Science User Facility under Contract No. DE-AC02-05CH11231. The Pilatus detector on 5.0.1 was funded under NIH grant S10OD021832. The ALS-ENABLE beamlines are supported in part by the National Institutes of Health, National Institute of General Medical Sciences, grant P30 GM124169. The Northeastern Collaborative Access Team beamlines are funded by the National Institute of General Medical Sciences from the National Institutes of Health (P30 GM124165). The Advanced Photon Source is a U.S. Department of Energy (DOE) Office of Science User Facility operated for the DOE Office of Science by Argonne National Laboratory under Contract No. DE-AC02-06CH11357. The Stanford Synchrotron Radiation Lightsource, SLAC National Accelerator Laboratory, is supported by the U.S. Department of Energy, Office of Science, Office of Basic Energy Sciences under Contract No. DE-AC02-76SF00515. The SSRL Structural Molecular Biology Program is supported by the DOE Office of Biological and Environmental Research and by the National Institutes of Health, National Institute of General Medical Sciences (including P41GM103393). The contents of this publication are solely the responsibility of the authors and do not necessarily represent the official views of NIGMS or NIH.

Conflicts of Interest

The authors declare no conflict of interest.

References

  1. Pohlmann, A.; Fricke, W.F.; Reinecke, F.; Kusian, B.; Liesegang, H.; Cramm, R.; Eitinger, T.; Ewering, C.; Potter, M.; Schwartz, E.; et al. Genome sequence of the bioplastic-producing “Knallgas” bacterium Ralstonia eutropha H16. Nat. Biotechnol. 2006, 24, 1257–1262. [Google Scholar] [CrossRef] [PubMed] [Green Version]
  2. Little, G.T.; Ehsaan, M.; Arenas-Lopez, C.; Jawed, K.; Winzer, K.; Kovacs, K.; Minton, N.P. Complete genome sequence of Cupriavidus necator H16 (DSM 428). Microbiol. Resour. Announc. 2019, 8. [Google Scholar] [CrossRef] [PubMed] [Green Version]
  3. Cramm, R. Genomic view of energy metabolism in Ralstonia eutropha H16. J. Mol. Microbiol. Biotechnol. 2009, 16, 38–52. [Google Scholar] [CrossRef]
  4. Friedebold, J.; Bowien, B. Physiological and biochemical characterization of the soluble formate dehydrogenase, a molybdoenzyme from Alcaligenes eutrophus. J. Bacteriol. 1993, 175, 4719–4728. [Google Scholar] [CrossRef] [PubMed] [Green Version]
  5. Friedebold, J.; Mayer, F.; Bill, E.; Trautwein, A.X.; Bowien, B. Structural and immunological studies on the soluble formate dehydrogenase from Alcaligenes eutrophus. Biol. Chem. Hoppe Seyler 1995, 376, 561–568. [Google Scholar] [CrossRef] [PubMed]
  6. Oh, J.I.; Bowien, B. Structural analysis of the Fds operon encoding the NAD+-linked formate dehydrogenase of Ralstonia eutropha. J. Biol. Chem. 1998, 273, 26349–26360. [Google Scholar] [CrossRef] [PubMed] [Green Version]
  7. Sazanov, L.A.; Hinchliffe, P. Structure of the hydrophilic domain of respiratory complex I from Thermus thermophilus. Science 2006, 311, 1430–1436. [Google Scholar] [CrossRef] [Green Version]
  8. Berrisford, J.M.; Sazanov, L.A. Structural basis for the mecahnism of respiratory complex I. J. Biol. Chem. 2009, 284, 29773–29783. [Google Scholar] [CrossRef] [Green Version]
  9. Efremov, R.G.; Baradaran, R.; Sazanov, L.A. The architecture of respiratory complex I. Nature 2010, 465, 441–445. [Google Scholar] [CrossRef]
  10. Hille, R.; Hall, J.; Basu, P. The mononuclear molybdenum enzymes. Chem. Rev. 2014, 114, 3963–4038. [Google Scholar] [CrossRef] [Green Version]
  11. Boyington, J.C.; Gladyshev, V.N.; Khangulov, S.V.; Stadtman, T.C.; Sun, P.D. Crystal structure of formate dehydrogenase H: Catalysis involving Mo, molybdopterin, selenocysteine, and an Fe4S4 cluster. Science 1997, 275, 1305–1308. [Google Scholar] [CrossRef] [PubMed] [Green Version]
  12. Yu, X.; Niks, D.; Mulchandani, A.; Hille, R. Efficient reduction of CO2 by the molybdenum-containing formate dehydrogenase from Cupriavidus necator (Ralstonia eutropha). J. Biol. Chem. 2017, 292, 16872–16879. [Google Scholar] [CrossRef] [PubMed] [Green Version]
  13. Niks, D.; Duvvuru, J.; Escalona, M.; Hille, R. Spectroscopic and kinetic properties of the molybdenum-containing, NAD+-dependent Formate Dehydrogenase from Ralstonia eutropha. J. Biol. Chem. 2016, 291, 1162–1174. [Google Scholar] [CrossRef] [PubMed] [Green Version]
  14. Yu, X.; Niks, D.; Ge, X.; Liu, H.; Hille, R.; Mulchandani, A. Synthesis of formate from CO2 gas catalyzed by an O2-tolerant NAD+-dependent formate dehydrogenase and glucose dehydrogenase. Biochemistry 2019, 58, 1861–1868. [Google Scholar] [CrossRef] [PubMed]
  15. Thomé, R.; Gust, A.; Toci, R.; Mendel, R.; Bittner, F.; Magalon, A.; Walburger, A. A sulfurtransferase is essential for activity of formate dehydrogenase in Escherichia coli. J. Biol. Chem. 2012, 287, 4671–4678. [Google Scholar] [CrossRef] [Green Version]
  16. Arnoux, P.; Ruppelt, C.; Oudouhou, F.; Lavergne, J.; Siponen, M.I.; Toci, R.; Mendel, R.R.; Bittner, F.; Pignol, D.; Magalon, A.; et al. Sulphur shuttling across a chaperone during molybdenum cofactor maturation. Nat. Commun. 2015, 6, 6148. [Google Scholar] [CrossRef] [Green Version]
  17. Dow, J.M.; Grabel, F.; Sargent, F.; Palmer, T. Characterization of a pre-export enzyme-chaperone complex on the twin-arginine transport pathway. Biochem. J. 2013, 452, 57–66. [Google Scholar] [CrossRef] [Green Version]
  18. Dow, J.M.; Grahl, S.; Ward, R.; Evans, R.; Byron, O.; Norman, D.G.; Palmer, T.; Sargent, F. Characterization of a periplasmic nitrate reductase in complex with its biosynthetic chaperone. FEBS J. 2014, 281, 246–260. [Google Scholar] [CrossRef] [Green Version]
  19. Young, T.; Niks, D.; Hakopian, S.; Tam, T.K.; Yu, X.; Hille, R.; Blaha, G.M. Crystallographic and kinetic analyses of the FdsBG subcomplex of the cytosolic formate dehydrogenase from Cupriavidus necator. J. Biol. Chem. 2020, 295, 6570–6585. [Google Scholar] [CrossRef] [Green Version]
  20. Schulte, M.; Frick, K.; Gnandt, E.; Jurkovic, S.; Burschel, S.; Labatzke, R.; Aierstock, K.; Fiegen, D.; Wohlwend, D.; Gerhardt, S.; et al. A mechanism to prevent production of reactive oxygen species by Escherichia coli respiratory complex I. Nat. Commun. 2019, 10, 2551. [Google Scholar] [CrossRef] [Green Version]
  21. Marchler-Bauer, A.; Bo, Y.; Han, L.; He, J.; Lanczycki, C.J.; Lu, S.; Chitsaz, F.; Derbyshire, M.K.; Geer, R.C.; Gonzales, N.R.; et al. CDD/SPARCLE: Functional classification of proteins via subfamily domain architectures. Nucleic Acids Res. 2017, 45, D200–D203. [Google Scholar] [CrossRef]
  22. Hinchliffe, P.; Sazanov, L.A. Organization of iron-sulfur clusters in respiratory complex I. Science 2005, 309, 771–774. [Google Scholar] [CrossRef] [PubMed]
  23. Shomura, Y.; Taketa, M.; Nakashima, H.; Tai, H.; Nakagawa, H.; Ikeda, Y.; Ishii, M.; Igarashi, Y.; Nishihara, H.; Yoon, K.S.; et al. Structural basis of the redox switches in the NAD(+)-reducing soluble [NiFe]-hydrogenase. Science 2017, 357, 928–932. [Google Scholar] [CrossRef] [Green Version]
  24. Ohnishi, T.; Ohnishi, S.T.; Salerno, J.C. Five decades of research on mitochondrial NADH-quinone oxidoreductase (complex I). Biol. Chem. 2018, 399, 1249–1264. [Google Scholar] [CrossRef] [PubMed] [Green Version]
  25. Reda, T.; Barker, C.D.; Hirst, J. Reduction of the iron-sulfur clusters in mitochondrial NADH:ubiquinone oxidoreductase (complex I) by EuII-DTPA, a very low potential reductant. Biochemistry 2008, 47, 8885–8893. [Google Scholar] [CrossRef]
  26. Edmondson, D.E.; Tollin, G. Semiquinone formation in flavo- and metalloflavoproteins. Top. Curr. Chem. 1983, 108, 109–138. [Google Scholar] [PubMed]
  27. Edmondson, D.E.; Ackrell, B.A.; Kearney, E.B. Identification of neutral and anionic 8 alpha-substituted flavin semiquinones in flavoproteins by electron spin resonance spectroscopy. Arch. Biochem. Biophys. 1981, 208, 69–74. [Google Scholar] [CrossRef]
  28. Palmer, G.; Mueller, F.; Massey, V. Electron Paramagnetic Resonance Studies on Flavoprotein Radicals. In Third International Symposium of Flavins and Flavoproteins; Kamin, H., Ed.; University Park Press: Baltimore, MD, USA, 1971; pp. 123–140. [Google Scholar]
  29. Bliven, S.; Lafita, A.; Parker, A.; Capitani, G.; Duarte, J.M. Automated evaluation of quaternary structures from protein crystals. PLoS Comput. Biol. 2018, 14, e1006104. [Google Scholar] [CrossRef] [Green Version]
  30. Krissinel, E.; Henrick, K. Inference of macromolecular assemblies from crystalline state. J. Mol. Biol. 2007, 372, 774–797. [Google Scholar] [CrossRef]
  31. Yano, T.; Sled, V.D.; Ohnishi, T.; Yagi, T. Expression and characterization of the flavoprotein subcomplex composed of 50-kDa (NQO1) and 25-kDa (NQO2) subunits of the proton-translocating NADH-quinone oxidoreductase of Paracoccus denitrificans. J. Biol. Chem. 1996, 271, 5907–5913. [Google Scholar] [CrossRef] [Green Version]
  32. Galante, Y.M.; Hatefi, Y. Purification and molecular and enzymic properties of mitochondrial NADH dehydrogenase. Arch. Biochem. Biophys. 1979, 192, 559–568. [Google Scholar] [CrossRef]
  33. Lauterbach, L.; Idris, Z.; Vincent, K.A.; Lenz, O. Catalytic properties of the isolated diaphorase fragment of the NAD-reducing [NiFe]-hydrogenase from Ralstonia eutropha. PLoS ONE 2011, 6, e25939. [Google Scholar] [CrossRef] [PubMed] [Green Version]
  34. Radon, C.; MIttelStádt, G.; Duffus, B.R.; Bürger, J.; Hartmann, T.; Mielke, T.; Teutloff, C.; Leimkühler, S.; Wendler, P. Cryo-EM structures reveal intricate Fe-S cluster arrangement and charging in Rhodobacter capsulatus formate dehydrogenase. Nat. Commun. 2020, 11, 1912. [Google Scholar] [CrossRef] [PubMed]
  35. Wagner, T.; Ermler, U.; Shima, S. The methanogenic CO2 redcuing-and-fixing enzyme is bifunctional and contains 46 [4Fe-4S] clusters. Science 2016, 354, 114–117. [Google Scholar] [CrossRef]
  36. Spatzao, T.; Schlesier, J.; Burger, E.-M.; Sippel, D.; Zhang, L.; Andrade, S.L.A.; Rees, D.C.; Einsle, O. Nitrogenase FeMoCo investigated by spatially resolved anomalous dispersion refinement. Nat. Commun. 2016, 7, 10902. [Google Scholar] [CrossRef] [Green Version]
Figure 1. Catalysis of CO2 reduction to formate by C. necator formate dehydrogenase. (Left) the reaction of 0.2 µM holoenzyme with 29.5 mM CO2(aq) and 300 µM NADH, 20 mM Bis-Tris propane, pH 6.3, 30 °C. The absorbance change reflects the consumption of 130 µM NADH. The amount of formate accumulated as determined by ion chromatography was 120 µM [12]. (Right) the accumulation of formate under the same conditions upon addition of 50 mM glucose and catalytic glucose dehydrogenase to the reaction mix. Adapted with permission from Biochemistry 2019, 58, 1861–1868 [14]. Copyright (2019) American Chemical Society.
Inorganics 08 00041 g001
Figure 2. A comparison of the structures of FdhD and FdhF. Panel (A) top, the structure of FdhF (PDB 1FDO), with the body of the enzyme in gray and the C-terminal cap domain in blue. Middle, the body of FdhF with the C-terminal cap domain removed, revealing the buried molybdenum center. Bottom, an enlargement of the molybdenum center, illustrating its disposition in the body of FdhF. Panel (B) top, views of the putative interfaces of the dimeric FdhD in complex with two equivalents of GDP (gray; PDB 4PDE) and the C-terminal cap domain of FdhF with the molybdenum center shown (blue). Bottom, the structures shown rotated toward one another illustrating the overlap between the GDP’s of the FdhD structure and the molybdenum center of FdhF.
Inorganics 08 00041 g002
Figure 3. The structure of FdsBG. (Top) the overall structure of FdsBG, with FdsB in gray and FdsG in blue (PDB 6VW8). The center structure is rotated about the horizontal or vertical axis as indicated to give the structures to the left and right, respectively. The two iron–sulfur clusters are rendered as CPK spheres and the FMN as CPK sticks. (Bottom Left) the domain structure of FdsB, with the thioredoxin-like domain in red, the Rossmann fold in gray, the ubiquitin-like domain in green, and the four-helix domain in blue; (Center) the domain structure of FdsG, with the N-terminal domain in gray and the thioredoxin-like domain in red; (Right) a comparison of the thioredoxin-like domains of FdsB (upper) and FdsG (lower).
Inorganics 08 00041 g003
Figure 4. Disposition of the redox-active centers of FdsBG. From left to right the Fe4S4 and FMN of FdsB and the Fe2S2 of FdsG (PDB 6VW8).
Inorganics 08 00041 g004
Figure 5. EPR spectra of the iron–sulfur clusters of the FdsBG complex. (Top) the observed iron–sulfur EPR spectrum (solid) and simulated composite spectrum (dashed) of dithionite-reduced FdsBG, collected at 9 K with modulation amplitude of 8 Gauss and microwave power of 2 µW. The sample was prepared by incubation of 125 µM of FdsBG complex in 100 mM potassium phosphate, pH 7.0 with 2 mM buffered sodium dithionite under anaerobic conditions for 1 h at room temperature prior to freezing. (Middle) the individual signals resulting from the simulation of the composite spectrum above. The spectrum corresponding to the previously assigned Fe/S1 (dotted) and an additional Fe/S5 signal (dashed) are resolved only in the FdsBG complex. (Bottom) a comparison of the spectra seen with FdsBG (dashed) and holoenzyme, at 20 K (dotted). The dashed lines mark the location of g1 and g3 features of the Fe/S3 component seen in the spectrum of the reduced holoenzyme (see text) [19].
Inorganics 08 00041 g005
Figure 6. The kinetics of FdsBG reduction by NADH. (Left) a plot of kfast vs. NADH, yielding a limiting kred of 680 s−1 and a KdNADH of 190 µM. The inset shows a typical biphasic transient, as described in the text. The reaction conditions were 100 mM potassium phosphate, pH 7.0, 5 °C. (Center) spectra seen at the times indicated in the reaction of 10 µM FdsBG with 5 µM NADH, as obtained with a photodiode array detector on the stopped-flow. (Right) difference spectra obtained using the spectra obtained at the times indicated. The formation of FMNH· in the fast phase of the reaction is reflected in the positive feature in the 500–650 nm region in the dotted difference spectrum and its loss during the slow disproportionation phase of the reaction by the negative feature in the same region in the dashed difference spectrum [19].
Inorganics 08 00041 g006
Scheme 1. Proposed electron transfer in FdsBG upon NADH reduction.
Inorganics 08 00041 sch001
Figure 7. EPR of the neutral flavin semiquinone of FdsBG. (Top) The EPR spectrum seen by rapid-freeze quench (quenching time ~40 ms) on reaction of 40 µM FdsBG with 0.8 mM NADH at 0 °C. The spectrum was obtained at 150 K with modulation amplitude of 8 Gauss and microwave power of 0.4 mW. (Middle) the spectrum of FADH·, obtained by subtracting out the Fe/S1 contribution (solid line) along with a simulation (dashed line). (Bottom) The EPR spectrum seen on mixing 160 µM of FdsBG with 60 µM NADH at room temperature for 10 s prior to freezing. The EPR spectrum was collected at 9 K with modulation amplitude of 8 Gauss and microwave power of 2 µW, and it exhibits only the Fe/S1 signal with no contribution from Fe/S4. All samples were prepared in 100 mM potassium phosphate, pH 7.0, under anaerobic conditions [19].
Inorganics 08 00041 g007
Table 1. Steady-state kinetic parameters for the C. necator formate dehydrogenase.
ForwardReverse
kcat201 s−110 s−1
Kmformate130 µM
KmNAD+310 µM
KmCO22700 µM
KmNADH46 µM

